
ABSTRACT
Mutations in the PKD1 gene result in autosomal dominant polycystic kidney disease (ADPKD), the most common monogenetic cause of end-stage renal disease (ESRD) in humans. Previous reports suggested that PKD1, together with PKD2/polycystin-2, may function as a receptor-cation channel complex at cilia and on intracellular membranes and participate in various signaling pathways to regulate cell survival, proliferation and macroautophagy/autophagy. However, the exact molecular function of PKD1 and PKD2 has remained enigmatic. Here we used Pkd1-deficient mouse inner medullary collecting duct cells (mIMCD3) genetically deleted for Pkd1, and tubular epithelial cells isolated from nephrons of doxycycline-inducible conditional pkd1fl/fl;Pax8rtTA;TetOCre+ knockout mice to show that the lack of Pkd1 caused diminished lysosomal acidification, LAMP degradation and reduced CTSB/cathepsin B processing and activity. This led to an impairment of autophagosomal-lysosomal fusion, a lower delivery of ubiquitinated cargo from multivesicular bodies (MVB)/exosomes to lysosomes and an enhanced secretion of unprocessed CTSB into the extracellular space. The TFEB-dependent lysosomal biogenesis pathway was however unaffected. Pkd1-deficient cells exhibited increased activity of the calcium-dependent CAPN (calpain) proteases, probably due to a higher calcium influx. Consistent with this notion CAPN inhibitors restored lysosomal function, CTSB processing/activity and autophagosomal-lysosomal fusion, and blocked CTSB secretion and LAMP degradation in pkd1 knockout cells. Our data reveal for the first time a lysosomal function of PKD1 which keeps CAPN activity in check and ensures lysosomal integrity and a correct autophagic flux.
Abbreviations: acCal: acetyl-calpastatin peptide; ADPKD: autosomal dominant polycystic kidney disease; CI-1: calpain inhibitor-1; CQ: chloroquine; Dox: doxycycline; EV: extracellular vesicles; EXO: exosomes; LAMP1/2: lysosomal-associated membrane protein 1/2; LGALS1/GAL1/galectin-1: lectin, galactose binding, soluble 1; LMP: lysosomal membrane permeabilization; mIMCD3: mouse inner medullary collecting duct cells; MV: microvesicles; MVB: multivesicular bodies; PAX8: paired box 8; PKD1/polycystin-1: polycystin 1, transient receptor potential channel interacting; PKD2/polycystin-2: polycystin 2, transient receptor potential cation channel; Tet: tetracycline; TFEB: transcription factor EB; VFM: vesicle-free medium; WT: wild-type.
Introduction
Defects in the proteins PKD1 and PKD2 cause autosomal dominant polycystic kidney disease (ADPKD) in humans, a severe hereditary disorder of the kidney characterized by the progressive development of large cysts and kidney dysfunction [Citation1]. ADPKD is a common monogenic disease in the western world with a prevalence of 1:400–1.000 and a total of 12 million people affected worldwide.
PKD1 and PKD2 are integral membrane proteins located in the ciliary, plasma and intracellular membranes of kidney epithelial cells [Citation2,Citation3]. PKD1 has the structural and functional features of a receptor [Citation4], while PKD2 acts as a Ca2+-permeable cation channel belonging to the transient receptor potential sensory channel family [Citation5,Citation6]. Six of the transmembrane regions of PKD2 show high similarity to PKD1 allowing for PKD1-PKD2 hetero-dimerization [Citation7]. In the heterodimeric complex PKD1 is thought to operate as a regulator of the PKD2 cation channel [Citation2,Citation6]. PKD1 has also been proposed to act as a mechano- or chemosensor of fluid flow in the primary cilium or as a G-protein-coupled receptor [Citation4,Citation5]. Moreover, PKD1 can be proteolytically cleaved in several ways to generate N- and C-terminal fragments. Cleavage at an extracellular G-protein cleavage site (GPS) of PKD1 creates an N-terminal fragment which appears to be important for PKD1 function in vivo [Citation8]. Intracellular cleavage of PKD1 results in a C-terminal 35-kD fragment, which migrates to the nucleus upon decreased fluid flow in mouse kidneys [Citation9]. Another PKD1 fragment is found in the matrix of mitochondria [Citation10] and a 15-kD fragment interacts with STAT6 and p100 and components of the canonical WNT-CTNNB1/β-catenin signaling pathway in an inhibitory fashion [Citation11]. Finally, a series of intracellular signaling pathways were found to be activated in pkd1−/- cells, including those affecting planar cell polarity (PCP) and cell-matrix interactions, cAMP production, MTOR activation and autophagy inhibition as well as G-protein coupled receptor, EGFR (epidermal growth factor receptor) and MAPK (mitogen-activated protein kinase) signaling (reviewed in [Citation2,Citation3,Citation12,Citation13]).
In addition to our scarce understanding of the molecular function of PKD1, it has remained enigmatic how functional inactivation of this protein triggers the formation of fluid filled cysts within the epithelia lining tubules of the kidney [Citation14]. These cysts mostly emerge from the collecting duct, thick ascending limb and distal tubules and grow in size and number over time [Citation2]. Besides the hypotheses that excessive cell proliferation or impaired programmed cell death may drive cyst formation [Citation3], research in the past decade has drawn attention to a deregulation of autophagy in tubulus-lining epithelial cells [Citation15–17].
Autophagy is a tightly regulated cellular process which collects unnecessary, damaged organelles or proteins and delivers them to lysosomes for degradation/recycling [Citation18]. It starts by forming a membrane-enclosed phagophore that engulfs the material that needs to be degraded [Citation19]. This then matures into a double membrane autophagosome, which finally fuses with the lysosome. In normal, nutrient-rich cells the protein kinase MTOR is activated and inhibits ULK1 (unc-51 like kinase 1) and ULK2 (yeast Atg1 homologs) through phosphorylation [Citation20]. In the absence of amino acids or other nutrients, MTOR-mediated phosphorylation of ULK1/2 is ablated, ULK1/2 is further activated by AMP-activated protein kinase (AMPK) and in turn phosphorylates and activates BECN1/BECLIN1 (Vps30/Atg6), which forms a complex with and activates PIK3C3/VPS34, a class III phosphatidylinositol 3-kinase (PtdIns3K) [Citation21]. The generated phosphatidylinositol-3-phosphate is the docking point for other downstream autophagy components. Among them is ATG3 that covalently attaches LC3-I to the lipid phosphatidylethanolamine on the surface of phagophores [Citation22]. Lipidated LC3-II contributes to the closure of the phagophores to generate autophagosomes and allows the binding of specific cargo and receptor proteins such as SQSTM1/p62 [Citation23]. The matured autophagosome fuses with the lysosome by the action of several proteins including SNAREs and UVRAG [Citation24]. While LC3-II on the inner side of the autophagosome is degraded in the lysosome along with the cargo, the one attached to the outer side is cleaved off by ATG4 and recycled to LC3-I [Citation25].
The integrity of lysosomes is ensured by the glycoproteins LAMP1 and LAMP2, which comprise 50% of all lysosomal membrane proteins [Citation26,Citation27]. They are further responsible for the loading and fusion of lysosomes with autophagosomes or endosomes [Citation28]. HSPA/HSP70 is another lysosomal stabilizer because it binds to an endolysosomal anionic phospholipid essential for lysosomal sphingomyelin metabolism [Citation29]. Finally, the acidification of lysosomes, which is crucial for the degradation of its cargo is maintained by the vacuolar-type H+-ATPase (V-ATPase). Degradation of lysosomes is mediated via a class of calcium-activated proteases, CAPN1 and CAPN2 (or µ and m), which translocate from the zymogenic form in the cytosol to their active form on lysosomes in response to calcium, magnesium or yet undefined mechanisms [Citation30]. At the lysosome activated CAPNs induce lysosomal membrane permeabilization by cleaving LAMPs, HSPA/HSP70 and V-ATPase by limited proteolysis leading to lysosomal destabilization [Citation31]. It has been recently shown that impairment of lysosomal function leads to a reduction in the number of multivesicular bodies (MVBs) targeted for lysosomal degradation [Citation32,Citation33]. These MVBs contain more ubiquitinated cargo and, instead of merging with lysosomes, fuse with the plasma membrane to release their contents, including exosomes and resident lysosomal hydrolases, into the extracellular space. Exosomes are a type of non-classical secretory vesicles, also known as extracellular vesicles (EV), which can be distinguished from the other major type of EV, the microvesicles (MV), based on their size and biogenesis [Citation34]. MVs range from 0.2 − 2 µm in diameter and directly bud off from the plasma membrane. Exosomes are 30–150 nm in diameter and are contained within MVB. Both MV and exosomes contain cargo that can be transferred to neighboring cells stimulating their growth and survival [Citation35].
It was suggested that pkd1 knockout cells exerted a deregulated metabolism leading to AMPK inhibition and MTOR activation and as a consequence diminished autophagy initiation [Citation15–17]. Because this mechanism was suspected to play a crucial role in cystogenesis and ADPKD generation, humans were treated with MTOR inhibitors such as rapamycin and sirolimus in order to boost autophagy in kidney cells. Although preclinical trials in mice were successful, the drugs failed to stop cyst formation and ADPKD in humans, due to toxic side effects [Citation36–39]. Recent work in zebrafish proposed a combination therapy of rapamycin and carbamazepine that allows to reduce the doses of rapamycin to a tolerable level in humans [Citation40,Citation41]. Hence, although deregulated MTOR may be involved in ADPKD progression, additional MTOR-independent regulatory pathways are likely to be affected.
Here we show that immortalized Pkd1-deficient mIMCD3 cells and cells freshly isolated from Pkd1 mutant kidneys, exhibit impaired lysosomal function due to lower acidification. As a consequence, the activity and processing of the lysosomal hydrolase CTSB is diminished, LC3-II accumulates and autophagosomal-lysosomal fusion as well as the delivery of ubiquitinated cargo from MVB to lysosomes are impaired. Mechanistically, we provide evidence for a role of the calcium-activated CAPN proteases in this process.
Results
Loss of Pkd1 leads to a defect in the completion step of autophagy
It was previously reported that cells lacking Pkd1 exhibited enhanced MTOR activation and diminished autophagy initiation [Citation15–17]. However, when we measured autophagy by LC3-I to LC3-II conversion, we found that LC3-II levels were constitutively higher in two different clones (cl 2 and cl 3) of pkd1−/- mouse inner medullary collecting duct (mIMCD3) cells than in their wild-type (WT) counterparts (). LC3-II accumulated to a similar extent as in WT cells treated with the lysosomal proton pump inhibitor bafilomycin A1 (Baf A1), and it was ablated when Pkd1 was re-expressed in pkd1−/- cl 2 cells (, resc., Figure S1A). This indicates that LC3-II accumulation was a direct consequence of the loss of Pkd1, either caused by enhanced autophagy initiation or diminished autophagy completion.
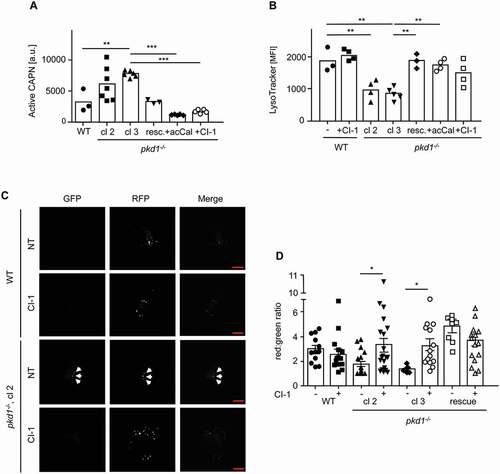
Figure 1. Pkd1−/- mIMCD3s accumulate LC3-II and show a defect in autophagosome-lysosome fusion. (A) Anti-LC3 western blot of total extracts of wildtype (wt) and two clones (cl 2 and cl 3) of pkd1−/- mIMCD3 cells as well as pkd1−/- cells re-expressing Pkd1 (resc.). Pkd1−/- cl 2 cells were also treated with 10 µM of CAPN inhibitor CI-1 for 4 h. Moreover, WT cells were exposed to 10 nM bafilomycin A1 (Baf) for 4 h to reveal maximal accumulation of LC3-II. GAPDH served as loading control. LC3-II accumulates at the expense of LC3-I in both pkd1−/- cell clones and reaches a similar level as WT cells treated with Baf. This effect is reversed by CAPN inhibition and upon Pkd1 re-expression in pkd1−/- cells. (B) ImageJ quantification of the western blot in (A) showing the ratio of LC3-II:LC3-I bands. The data represent the means of 3–5 experiments ± SD. (C) Representative microscopy fluorescence images of WT (upper) and pkd1−/- mIMCD3 cl 2 cells (middle) transiently overexpressing an RFP-GFP-LC3 reporter construct for 24 h. In the lower image series, Pkd1 cDNA was reintroduced into pkd1−/- mIMCD3 cl 2 cells (rescue). Red dots represent functional lysosomes in which GFP is bleached by the acidic environment, yellow dots represent autophagosomes (dots in GFP and RFP channels, white arrowheads). Scale bar: 20 µm. (D) Quantification of the ratio of red:green dots (determined as described in Materials and Methods) detected in RFP-GFP-LC3-expressing WT and pkd1−/- cl 2 and cl 3 mIMCD3 cells as well as in pkd1−/- cl 2 cells re-expressing Pkd1 at 24 and 48 h after transfection. The data represent the means of 7–15 independent manual, double blinded dot countings (100 dots/counting) ± SD. pkd1−/- cells show a defect in autophagosome-lysosome fusion (yellow dots), which can be rescued by reintroducing the Pkd1 gene (red dots). Statistical evaluation in (B) and (D) by one-way ANOVA: *p < 0.05, **p < 0.01, ***p < 0.001
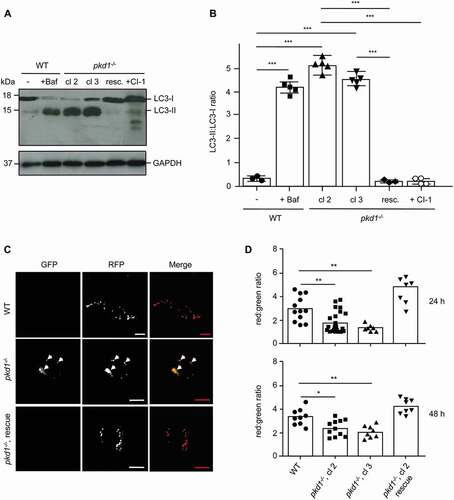
To provide evidence that pkd1−/- mIMCD3 cells exhibited a defect in autophagy completion, we monitored the autophagosomal-lysosomal fusion with an RFP-GFP-LC3 reporter construct. This assay is based on the higher bleaching sensitivity of GFP compared to RFP in the acidic environment of the lysosome [Citation42]. Hence if autophagosomes (expressing both GFP and RFP) correctly fuse with lysosomes and degrade the LC3 cargo, these organelles should become red (loss of GFP). However, if autophagosomes accumulate we should observe a double red/green (hence yellow) staining. As shown in , two clones of pkd1−/- mIMCD3s (cl 2 and cl 3) indeed showed an accumulation of yellow-stained autophagosomes under the fluorescence microscope (see white arrowheads in both GFP and RFP channels) and had a significantly lower red:green ratio of vesicles than their WT counterparts. Importantly, the defect in autophagosomal-lysosomal fusion was not only detected at 24 h, but also at 48 h after RFP-GFP-LC3 reporter construct transfection, and was ablated when the Pkd1 gene was reinserted into pkd1−/- mIMCD3 cl 2 cells (, rescue).
Defect in autophagosomal-lysosomal fusion in pkd1−/- mIMCD3s is due to diminished lysosomal acidification
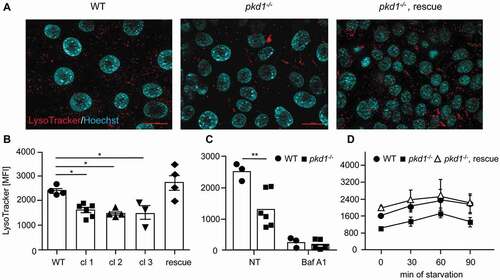
A possible cause for the diminished cargo delivery of autophagosomal markers to the lysosome could be a defect in lysosomal function since it was previously reported that hypoactive lysosomes led to an accumulation of autophagosomes [Citation43]. We therefore stained WT and pkd1−/- mIMCD3 cells with LysoTracker™ Red (). Fluorescence microscopy analysis showed the lysosomal staining in all cells analyzed (). As determined by flow cytometry quantification, the volume of the acidic compartment was significantly diminished in three independent clones of pkd1−/- mIMCD3 cells (cl 1–3) as compared to WT cells () although not to the same extent as if acidification was entirely blocked by Baf A1 (). This acidification defect was rescued upon reintroduction of the Pkd1 gene into pkd1−/- cl 2 cells (, rescue). Starvation is known to induce lysosomal biogenesis in order to ensure the regeneration of metabolic building blocks under nutrient-poor conditions [Citation15]. We therefore studied this behavior in starved WT and pkd1−/- mIMCD3 cl 2 cells over time. Again, pkd1−/- mIMCD3s started with less functional lysosomes (). However, in response to starvation both the WT and pkd1−/- cells increased acidic organelles with the same kinetics during the first 60 min. Expression of the Pkd1 cDNA in pkd1−/- cl 2 cells recapitulated the behavior of WT cells (, rescue). This finding indicates that it is not starvation-induced lysosomal biogenesis, but the basal acidification of lysosomes, which seems to be perturbed in pkd1−/- cells.
Figure 2. Pkd1−/- mIMCD3 cells exhibit diminished lysosomal activity. (A) Representative images of lysosomes stained with LysoTracker. Red dots represent functional, acidic lysosomes; blue Hoechst 33,342 stainings show nuclei. Scale bar: 20 µm. (B) The amount of LysoTracker staining was quantified by FACS analysis of WT and three pkd1−/- mIMCD3 cell clones and pkd1−/- cl 2 rescue cells. (C) Quantification of LysoTracker staining of WT and pkd1−/- cl 2 mIMCD3 cells either untreated (NT) or treated with 10 nM bafilomycin A1 (Baf A1) for 4 h. (D) Quantification of LysoTracker staining of WT and pkd1−/- cl 2 cells as well as pkd1−/- cl 2 rescue cells in full medium (0 min) or starved in EBSS without fetal calf serum for 30, 60 or 90 min. Pkd1−/- mIMCD3s exhibit lower LysoTracker staining as compared to WT cells. This can be rescued by Pkd1 gene reintroduction. In response to starvation, both WT and pkd1−/- cells increase their acidic compartment with similar kinetics. Data in (B-D) are given as mean fluorescence intensity (MFI) and represent the means of 3–6 independent experiments ± SD. Statistical evaluation in (B) by one-way ANOVA, in (C) by t-test: *p < 0.05, **p < 0.01
Pkd1−/- mIMCD3 cells show reduced CTSB activity and a higher lysosomal pH
To substantiate the lysosomal defect in pkd1−/- mIMCD3 cells, we measured CTSB activity by Magic Red™ CTSB and lysosomal pH by LysoSensorTM Yellow/Blue Dextran® assays, respectively. Fluorescence plate reader quantification showed that CTSB activity was substantially diminished in two clones of pkd1−/- mIMCD3 as compared to WT cells () although not to the same extent as in Baf A1-treated cells. Based on a LysoSensor™ 460/540 fluorescence calibration curve built from buffers ranging from pH 3.5–8.0, we found that the pH of lysosomes in WT mIMCD3 cells was 4.7, matching the reported pH of correctly functioning lysosomes [Citation44]. By contrast, the lysosomal pH was increased to about 5.5 in pkd1−/- cl 2 cells (). Both, the diminished CTSB activity and the increased pH were rescued in pkd1−/- cl 2 cells re-expressing Pkd1 ().
Figure 3. Pkd1−/- mIMCD3 cells exhibit diminished CTSB activity due to a higher lysosomal pH. (A) Intracellular CTSB activity in WT, pkd1−/- cl 2 and cl 3 and pkd1−/- cl 2 rescue mIMCD3 cells as well as in pkd1−/- cl 2 cells treated with the CAPN inhibitors acCal or CI-1 measured by fluorometric plate reader analysis using the Magic Red™ CTSB assay. As control for the lowest CTSB activity, WT cells were treated with 10 nM bafilomycin A1 (Baf A1) for 4 h. pkd1−/- cells exhibit lower CTSB activity, which is reversed by CAPN inhibition or re-expressing Pkd1. Data show the relative fluorescence intensity as compared to that seen in WT cells (1.0) and represent the means of 3–5 experiments ± SD. (B) Lysosomal pH measurement by LysoSensorTM Yellow/Blue Dextran® fluorometric plate reader analysis of WT, pkd1−/- cl 2 and pkd1−/- cl 2 rescue mIMCD3 cells as well as pkd1−/- cl 2 cells treated with the CAPN inhibitor CI-1. While WT cells exhibit a standard pH of 4.7, the pH is increased to 5.5 in pkd1−/- cells. CAPN inhibition and re-expression of Pkd1 bring the pH back to WT conditions. Data represent the means of 3–4 experiments ± SD. Statistical evaluation in (A) and (B) by one-way ANOVA: **p < 0.01, ***p < 0.001
Pkd1 deletion causes impairment of CTSB processing and diminished LAMP1 protein expression
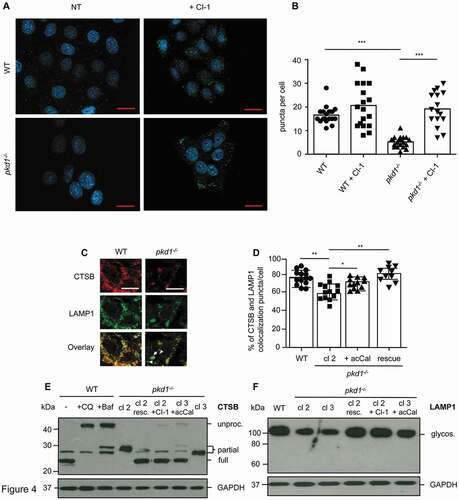
Reduced lysosomal function is expected to affect the processing of hydrolases to their active forms. In addition, diminished LAMP expression is known to compromise lysosomal integrity. Anti-LAMP1 immunofluorescence analysis showed that pkd1−/- cl 2 mIMCD3 cells displayed a significantly lower number of LAMP positive puncta than WT cells (). When examining colocalization of CTSB and LAMP1 we found that approximately 75% of the proteins colocalized in WT cells () as judged by manually counting yellow-stained puncta (). This was slightly reduced to 55% in pkd1−/- cl 2 mIMCD3 cells but returned to WT levels when these cells were transfected with Pkd1 cDNA (). The diminished colocalization of CTSB and LAMP1 in cells lacking Pkd1 was due to reduced LAMP1 expression as shown on anti-LAMP1 western blots of total extracts of two clones of pkd1−/- mIMCD3 cells (cl 2 and cl 3) (). CTSB expression was not reduced to a major extent in these cells but the hydrolase was only partially processed in both pkd1−/- cl 2 and cl 3 mIMCD3s (). Entirely unprocessed CTSB was only detected when mIMCD3 cells were treated with Baf A1 or chloroquine (CQ) to block lysosomal acidification. Reintroduction of Pkd1 into pkd1−/- cl 2 mIMCD3 cells rescued full CTSB processing and LAMP1 expression to the same level as in WT cells. Our finding therefore confirms that the deletion of Pkd1 impedes lysosomal integrity/function and by consequence the processing and activity of lysosomal hydrolases.
Figure 4. Diminished lysosomal LAMP1 and CTSB expression and CTSB processing in pkd1−/- mIMCD3 cells. (A) Anti-LAMP1 immunofluorescence analysis of WT and pkd1−/- cl 2 mIMCD3 cells treated or not (NT) with 10 µM of CI-1 for 4 h showing punctate lysosomal localization of LAMP1. DAPI was used to stain nuclei. Scale bar: 20 µm. (B) Quantification of the number of LAMP1 puncta per cell in the cells shown in (A). Pkd1−/- cells display significantly fewer LAMP1-positive puncta than WT cells. This effect is reversed upon CAPN inhibition. Data represent the means of >15 independent, double blinded, manual counts of puncta per cell ± SD. (C) Anti-LAMP1 and anti-CTSB immunofluorescence showing major colocalization (yellow puncta) of LAMP1 and CTSB in WT mIMCD3 cells but less colocalization (see arrowheads) in pkd1−/- cl 2 cells. Two representative WT cells and one representative pkd1−/- cell are shown. Scale bar: 10 µm. (D) Quantification of LAMP1 and CTSB colocalized puncta of the immunofluorescence analysis in (C). The number of fluorescent puncta was manually counted in >20 WT, pkd1−/- cl 2 cells as well as in pkd1−/- cells transfected with Pkd1 (rescue) or treated with the CAPN inhibitor acCal, and the percentage of yellow, colocalized puncta was depicted. While ca. 75% of the puncta in WT cells were double positive for LAMP and CTSB, this was only the case for 55% of the puncta in pkd1−/- cl 2 cells. CAPN inhibition or Pkd1 re-expression could partially reverse this effect. Data represent the means of 10–14 independent puncta countings from >20 cells ± SD. Statistical evaluation in (B) and (D) by one-way ANOVA: *p < 0.05, **p < 0.01, ***p < 0.001. Anti-CTSB (E) or anti-LAMP1 (F) western blots analysis of total extracts of WT and pkd1−/- cl 2 and cl 3 mIMCD3 cells as well as pkd1−/- cells re-expressing Pkd1 or treated with CI-1 or acCal. In (E) WT cells were also treated with 10 nM Baf A1 (Baf) or 40 µM chloroquine (CQ) for 4 h to detect entirely unprocessed CTSB. While WT cells mostly displayed processed (active) CTSB and high levels of glycosylated LAMP1, CTSB was only partially processed and LAMP1 levels were diminished in both cl 2 and cl 3 clones of pkd1−/- cells. Both Pkd1 re-expression and CAPN inhibitor treatment of pkd1−/- cells reinstated WT levels of LAMP and CTSB. GAPDH served a loading control
Pkd1−/- mIMCD3 cells contain MVBs/exosomes with ubiquitinated cargo and secrete lysosomal hydrolases
To investigate the fate and cargo of MVB and its intraluminal vesicles in WT and pkd1−/- mIMCD3 cells, we isolated the two major types of extracellular vesicles (EV), exosomes (EXO) and microvesicles (MV), using a combination of filtration and ultracentrifugation steps. The purity of each type of EV and the media depleted of EV (vesicle-free medium, VFM) was verified by western blot analysis for specific EV cargo and selected soluble proteins. As shown in , the exosome marker CD63 was only detected in the exosomal fraction (EXO, middle panel). NFKBIA/IκBα was found only in the whole cell lysate (WCL) (top panel) indicating that the MV and exosomes were not contaminated with cytosolic components. HSP90 (heat shock protein 90) served as loading marker (bottom panel) because it was expressed in all fractions [Citation45]. During the maturation of intralumenal vesicles (exosomes) within MVB, so called endosomal sorting complexes required for transport (ESCRTs) recognize and import ubiquitinated proteins into a subset of intralumenal vesicles which are then degraded when MVB fuse with lysosomes. We therefore assumed that a lysosomal defect in pkd1−/- cells would lead to an accumulation of ubiquitinated cargo in their exosomes. While no significant differences in the levels of ubiquitinated proteins were detected in the WCL of WT and pkd1−/- cl 2 mIMCD3 cells, a higher level of ubiquitinated cargo was seen in exosomes (EXO) isolated from cells deficient in Pkd1 (). Ectopic expression of Pkd1 in pkd1−/- cl 2 cells reversed this effect.
Figure 5. Pkd1−/- mIMCD3 cells show a higher level of ubiquitinated cargo in exosomes and augmented secretion of unprocessed CTSB. (A) Anti-NFKBIA and anti-CD63 western blot analyses of subcellular fractions of WT and pkd1−/- cl 2 mIMCD3 cells to confirm the purity of the isolated exosomes (EXO, rich in CD63) as compared to whole cell lysate (WCL, contains NFKBIA), microvesicles (MV) and vesicle-free medium (VFM) (both CD63 negative). (B) Anti-UBIQUITIN western blot analysis of WCL and EXO fractions of WT and pkd1−/- cl 2 cells as well as pkd1−/- cl 2 cells re-expressing Pkd1 (resc.) or treated with the CAPN inhibitor CI-1. pkd1−/- cl 2 cells show an accumulation of ubiquitinated cargo in their EXO indicating that it is less delivered to lysosomes for degradation than in WT cells. Pkd1 re-expression or treating the pkd1−/- cells with CAPN inhibitor reverses this effect. The overall level of ubiquitinated proteins in WCL however stays the same between WT and pkd1−/- cells. (C) Anti-CTSB western blot analysis of the vesicle free medium (VFM) of WT and pkd1−/- cl 2 and cl 3 cells as well as pkd1−/- cl 2 cells re-expressing Pkd1 (resc.) or treated with CI-1 showing that pkd1−/- cells accumulate mostly unprocessed CTSB as secreted soluble protein in MVBs to a similar extent as in WT cells treated with Baf A1. This is reversed by Pkd1 re-expression or CAPN inhibition. HSP90 and ACTB served as loading controls
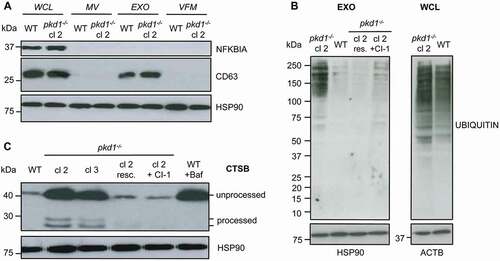
When MVB have a diminished tendency to fuse with lysosomes, they reach the cell surface and release their cargo into the extracellular environment. We therefore examined if pkd1−/- mIMCD3 cells also secreted soluble proteins, including lysosomal hydrolases that reside in MVB. For that purpose, we collected the conditioned media depleted of exosomes and MV, called VFM, from WT and pkd1−/- cells and subjected them to anti-CTSB western blot analysis. As shown in , while WT cells secreted only a small amount of mostly unprocessed CTSB, two clones of pkd1−/- cells showed high levels of unprocessed and also some processed CTSB in their cell supernatants. A similar effect was seen in WT cells treated with Baf A1, and it was completely reversed when pkd1−/- cl 2 cells were replenished with Pkd1 (, resc). These data indicate that pkd1−/- mIMCD3 cells do not only display a defect in autophagosomal-lysosomal fusion but also accumulate ubiquitinated cargo and secrete lysosomal hydrolases into the extracellular space presumably due to diminished capacity to discharge them from MVB to lysosomes.
TFEB-mediated lysosomal biogenesis is intact in pkd1−/- mIMCD3 cells
A consequence of increased autophagy and/or the accumulation of autophagosomes is the activation of the transcription factor TFEB, which induces the expression of genes involved in lysosomal biogenesis. In normal cells, TFEB is phosphorylated by MTOR and either sequestered by YWHA/14-3-3 proteins and/or degraded by the ubiquitin-proteasome system in the cytoplasm [Citation46]. In response to starvation or activation of the autophagic flux, MTOR is inactivated leading to the dephosphorylation, protein stabilization and nuclear translocation of TFEB [Citation47,Citation48]. Immunoblot analysis revealed that the TFEB protein was more abundant in 3 independent clones of pkd1−/- mIMCD3 cells as compared to WT counterparts () although Tfeb transcription was unaffected (). Moreover, while TFEB resided mainly in the cytosol of WT cells, it was highly abundant in the nucleus of pkd1−/- cl 1, cl 2 and 3 cells in an apparently dephosphorylated (based on gel mobility shift) and hence activated form (). Again, Pkd1 re-expression in pkd1−/- cl 2 cells ablated both the nuclear abundance (, re.) and the higher total protein expression level (, resc.). Consistent with this notion, pkd1−/- cl 2 cells showed a higher induction of the TFEB target genes Map1lc3b and Lamp1 (). Bnip1l, a control FOXO3/FOXO3a target gene not involved in lysosomal biogenesis did not show significant changes. Thus, pkd1−/- cells seemed to exhibit a higher constitutive lysosomal biogenesis response than WT cells, which is most likely due to the accumulation of autophagosomes. Surprisingly, however, although Lamp1 was induced on the transcriptional level, LAMP1 () and LAMP2 (Figure S2A,B) protein levels were much lower in pkd1−/- cl 2 and cl 3 than WT cells. This suggests that LAMP1 and maybe other lysosomal proteins are more prone to degradation/proteolysis in pkd1−/- cells (see below).
Figure 6. Lysosomal biogenesis is enhanced in pkd1−/- mIMCD3 cells. (A) Real time RT-PCR analysis showing the ratio of absolute Tfeb mRNA expression levels as compared to the control gene Actb/β-Actin in WT and pkd1−/- cl 1, cl 2 and cl 3 mIMCD3s as well as pkd1−/- cl 2 cells re-expressing Pkd1 (resc.) or treated with the CAPN inhibitor CI-1. No significant changes in Tfeb mRNA levels were found among the different cell lines and conditions. (B) Anti-TFEB western blot analysis and (C) ImageJ quantification of the TFEB protein band of total extracts of the cells used in (A). The lack of Pkd1 led to a higher protein expression (stabilization) of TFEB, which was ablated upon Pkd1 re-expression. (D) Anti-TFEB western blot analysis of cytosolic and nuclear extracts of the cells used in (A-C). While TFEB was mostly localized as presumably phosphorylated, inactive form (p-TFEB, mobility shift) in the cytosol of WT cells, it translocated to the nucleus in a presumably dephosphorylated (TFEB), active form in pkd1−/- cells. This effect was reversed upon Pkd1 re-expression or CAPN inhibition. (E) Real-time RT-PCR to determine the expression levels of the lysosomal TFEB target genes Map1lc3b and Lamp1 in the cells used in (A). The ratios of absolute target mRNA levels to control gene (Actb/β-Actin) were depicted. Bnip1l, a FOXO3 target gene, served as a negative control. The loss of Pkd1 led to increased transcription of TFEB target genes indicating that TFEB was more active in the nucleus of pkd1−/- cells. ACTB/β-ACTIN (B), GAPDH and HISTONE H3 (D) served as loading controls. In (A), (C) and (E) data represent the means of 3–4 independent experiments ± SD. Statistical evaluation in (A) and (C) by one-way ANOVA, in (E) by t-test. *p < 0.05, **p < 0.01
CAPNs are responsible for the defect in lysosomal acidification and its consequences in pkd1−/- mIMCD3 cells
Because lysosomal biogenesis is functional in pkd1−/- mIMCD3 cells, the defect in lysosomal acidification and its consequences may be due to the degradation of lysosomal proteins. A prominent class of enzymes which may affect lysosomal integrity are the calcium-dependent CAPN proteases. CAPN1 cleaves LAMP1 and LAMP2 causing lysosomal membrane permeability and loss of lysosomal function [Citation31]. Indeed, using a fluorescent-based CAPN assay, we found that extracts of pkd1−/- cl 2 and cl 3 mIMCD3 cells exhibited a higher CAPN activity than WT extracts (). This increased activity was specific for CAPNs because it was reversed upon adding two different CAPN inhibitors, ALLN (Cl-1) and acetyl-calpastatin peptide (acCal) (). Moreover, it was a direct consequence of a lack of Pkd1, because reintroduction of Pkd1 into pkd1−/- cl 2 cells brought the CAPN activity back to that seen in WT cells (). The higher activity of CAPNs seemed to be responsible for the impaired autophagic flux and lysosomal acidification in pkd1−/- cells because their treatment with Cl-1 or acCal prevented LC3-II accumulation (), rescued the delivery of the LC3 cargo to lysosomes () and reversed the diminished LysoTracker staining (), the reduced CTSB activity () and processing () and the higher lysosomal pH () to the levels seen in WT and pkd1−/- “rescue” cells. CAPN inhibition also restored the delivery of MVB’s cargo to lysosomes because protein ubiquitination in exosomes was diminished (, EXO) and CTSB was no longer secreted into the extracellular space (, EXO). Moreover, the TFEB protein returned to the cytosol () and the transcription of genes involved in lysosomal biogenesis was ablated () in pkd1−/- mIMCD3 cells due to the resumption of a normal autophagic flux in response to CAPN inhibition. Importantly, autophagic flux of WT mIMCD3 cells was not affected by CAPN inhibitor treatment () indicating that CAPN activity was specifically augmented and caused lysosomal dysfunction upon the loss of Pkd1.
Figure 7. Involvement of CAPNs in the disturbance of autophagosomal-lysosomal fusion and decrease of lysosomal function in pkd1−/- mIMCD3 cells. (A) CAPN activity in total extracts of WT, pkd1−/- cl 1, cl 2 and pkd1−/- cl 2 cells re-expressing Pkd1 (resc.) or treated with the CAPN inhibitors CI-1 or acCal, as measured by the fluorescent substrate Ac-LLY-AFC. CAPN activity is increased in cells lacking Pkd1 but returns to WT levels in Pkd1 rescue cells or when Cl-1 or acCal were present. (B) Quantification of LysoTracker staining by FACS analysis of the cell lines used in (A). The data are depicted as mean fluorescence intensity (MFI). In addition, WT cells were treated with CI-1 as a control. Data in (A) and (B) represent the means of >3 independent experiments ± SD. (C) Representative microscopy fluorescence images of WT and pkd1−/- cl 2 mIMCD3 cells transiently overexpressing an RFP-GFP-LC3 reporter construct for 24 h, either untreated or treated with 10 µM CI-1 for 4 h. Red dots represent functional lysosomes in which GFP is bleached by the acidic environment, yellow dots represent autophagosomes (dots in GFP and RFP channels, white arrowheads). Scale bar: 20 µm. (D) Quantification of the red:green ratio of RFP-GFP-LC3 expressing WT, two clones of pkd1−/- (2 and 3) and cl 2 rescue mIMCD3 cells either untreated (NT) or treated with 10 µM of CI-1 for 4 h. Diminished lysosomal function (B) and autophagosomal-lysosomal fusion (C,D) in pkd1−/- mIMCD3 cells are both reversed by CAPN inhibition. The data represent the means of 7–20 independent manual, double-blinded dot countings (100 dots/counting). Statistical evaluation in (A) and (B) by one-way ANOVA, in (D) by two-way ANOVA. *p < 0.05, **p < 0.01, ***p < 0.001
To elucidate if enhanced CAPN activity affected the degradation of lysosomal proteins, we monitored the expression of LAMPs in WT and pkd1−/- mIMCD3 cells in the absence or presence of the CI-1 and/or acCal. The lower number of LAMP1-positive puncta was reversed (), and LAMP1 more frequently colocalized with CTSB again () when pkd1−/- mIMCD3 cl 2 cells were treated with CI-1. Moreover, the degradation of both LAMP1 () and LAMP2 (Figure S2A,B) was halted in the presence of CI-I or acCal. To further confirm that diminished lysosomal acidification was due to CAPN activation upon loss of Pkd1, we treated the mIMCD3 cells with the lysosomotropic agent L-leucyl-L-leucine methyl ester (LLOMe) and measured the extent of lysosomal membrane permeabilization (LMP) with LGALS1/GAL1 staining, a recently established marker for damaged endomembranes [Citation49]. Galectins usually reside in the cytoplasm and cannot bind β-galactose-containing glycoconjugates that are only present on the cell surface or in the lumen on endocytic compartments. Upon LMP, they can access the lumen of damaged, leaky lysosomes and stain in a punctate pattern by immunofluorescence. Neither WT nor two clones of pkd1−/- mIMCD3s (cl 2 and cl 3) showed LMP under normal growth conditions as evidenced by the absence of partially or fully processed CTSB in the cytosol of these cells (Figure S3C). In response to LLOMe, a substantial amount of CTSB was released into the cytosol of WT cells, whereas this occurred to a lower extent in pkd1−/- cl 2 cells (Figure S3C). Consistently, WT mIMCD3 cells exhibited strong anti-LGALS1 puncta staining after LLOMe treatment indicative of LMP, whereas less of these puncta were detected in pkd1−/- cl 2 cells (Figure S3A,B). Pretreatment of the latter cells with CI-1 restored the LGALS1 staining, as did the re-expression of Pkd1 in pkd1−/- cells (Figure S3A,B). These data indicate that mIMCD3 cells lacking Pkd1 were less permeabilized with LLOMe, most likely because the lower acidification of lysosomes prevented the conversion of LLOMe into its membranolytic form by the lysosomal acidic thiol protease, CTSC/dipeptidyl peptidase I [Citation50]. CAPN inhibition could restore LMP and LGALS1 puncta staining because it reinstated normal lysosomal acidification.
Because CAPNs are activated by calcium, we expected that blocking calcium influx by the channel blocker verapamil would at least partially mimic the effects of CAPN inhibition. Indeed, the treatment of pkd1−/- cl 2 mIMCD3 cells with 100 µM of verapamil for 4 h almost completely restored both LysoTracker staining and LAMP1 protein expression to WT levels (Figure S4A,B). Thus, mIMCD3 cells lacking Pkd1 expression may exhibit a higher calcium influx than WT cells, which then activates CAPNs to perturb lysosomal function. However, the calcium levels are unlikely to reach toxic levels because pkd1−/- cl 2 cells are not more sensitive to apoptosis induction by staurosporine (STS), tunicamycin, (Tunica) or etoposide (Etopo) than WT cells (Figure S4C). On the contrary, in response to Etopo pkd1−/- cl 2 mIMCD3s survive even better than WT cells (Figure S4C).
CAPN-mediated diminution of lysosomal acidification is also observed in distal tubular cells isolated from pkd1−/- kidneys
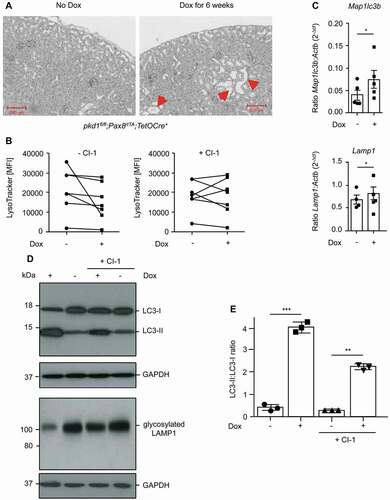
Although we have used 2–3 independent pkd1−/- clones of mIMCD3 cells and also validated our findings by reintroducing the Pkd1 gene into cl 2 cells, it is still possible that immortalized, established cell lines adapted to cell culture conditions that may have changed their autophagic/lysosomal behavior in a Pkd1-independent manner. We therefore turned to pkd1fl/fl;Pax8rtTA;TetOCre+ transgenic mice, in which the Pkd1 gene was deleted postnatally along the entire length of the renal tubule by doxycycline (Dox) for 6 weeks (Figure S1B). As expected, the loss of Pkd1 triggered polycystic kidney disease with cyst formation (). We then isolated primary distal renal tubular cells from uninduced (-Dox) and induced (+Dox) pkd1fl/fl;Pax8rtTA;TetOCre+ transgenic mice. These cells were kept in culture for only a short time (max 1 h), either left untreated or treated with CI-1 and then analyzed for LysoTracker staining and LC3 and LAMP1 western blot analysis. As in established mIMCD3 cell clones the acidic volume was lower in pkd1−/- primary distal tubular cells (+Dox) as compared to non-induced (-Dox) counterparts, and this effect could again be rescued with CI-1 treatment (). In addition, pkd1−/- primary cells showed an accumulation of LC3-II and exhibited lower expression of LAMP1 that was ablated by CAPN inhibition () indicating that CAPN-mediated LAMP1 degradation, lysosomal dysfunction and subsequent disturbance of autophagosomal-lysosomal fusion were also operative in pkd1−/- primary cells. In addition, these cells demonstrated increased expression of the TFEB target genes Map1lc3b and Lamp1 () confirming that also in vivo the defect in autophagy completion stimulates lysosomal biogenesis.
Figure 8. Lysosomal defect is also observed and can be rescued by CAPN inhibition in distal tubular cells isolated from pkd1−/- nephrons. (A) H/E-stained transverse sections (8 µm) from the kidney of a pkd1fl/fl;Pax8rtTA;TetOCre+ mouse show cyst formation (red arrowheads) after Dox treatment for 6 weeks. (B) Quantification of LysoTracker staining by FACS analysis of cells isolated from approximately 100 distal tubules of untreated (-Dox) or Dox-treated (+Dox) pkd1fl/fl;Pax8rtTA;TetOCre+ mice, exposed or not to 10 µM CI-1 for 20 min in vitro. The data are depicted as mean fluorescence intensity (MFI) of 7 independent experiments. Lysosomal activity was slightly diminished in Dox-treated Pkd1-lacking primary cells and this could be partially rescued by CAPN inhibition. (C) Real-time RT-PCR to determine the expression levels of the lysosomal TFEB target genes Map1lc3b and Lamp1 in the cells described in (B). The ratios of absolute target mRNA levels to control gene (β-Actin) were depicted. The data represent the means of 4–5 independent experiments. Statistical evaluation by t-test: *p < 0.05. Diminished lysosomal activity and increased expression of TFEB target genes were also seen in cells isolated from pkd1−/- kidneys. The effect can again be partially reverted by addition of CI-1. (D) Anti-LC3 and anti-LAMP1 western blot analyses in the cells used in (B) and (C) showing that the accumulation of LC3-II at the expense of LC3-I and the diminished expression of glycosylated LAMP1 were also detected in pkd1−/- kidneys in a CAPN-dependent manner. (E) ImageJ quantification of the upper western blot in (D) showing the ratio of LC3-II:LC-3-I bands. The data represent the means of 3 independent experiments ± SD. Statistical evaluation by one-way ANOVA: **p < 0.01, ***p < 0.001
Discussion
Here we show in both immortalized, genetically engineered mIMCD3 pkd1−/- cells and primary distal tubular cells isolated from mouse kidneys that the lack of Pkd1 leads to a lower acidification of lysosomes, diminished CTSB processing and activity, the accumulation of autophagosomes and ubiquitinated cargo within MVBs and a higher secretion of unprocessed CTSB into the extracellular space. These defects are all ablated by reintroducing the Pkd1 gene into pkd1−/- cells or by treating these cells with the CAPN inhibitors CI-1 or acCal. Indeed, a higher activity of the Ca2+-dependent proteases CAPN1 and/or CAPN2 is observed in pkd1−/- cells, which triggers partial proteolysis of LAMP1 and LAMP2. This seems to perturb lysosomal function in a calcium-dependent manner without affecting the apoptosis sensitivity of the cells. We suggest that PKD1 may have a so far unrecognized function on autophagosomes or lysosomes that ensures autophagy completion and/or lysosomal stability and keeps CAPN activities in check.
Although we do not know yet if the CAPN-mediated lysosomal defect is crucial for cystogenesis and ADPKD development, our study has major implications to further understand the molecular function of PKD1. It is still unknown which signaling pathways triggered by PKD1 are crucial for kidney homeostasis. PKD1 resembles the structure of a G-protein coupled receptor and can link to cAMP, MTOR, MAPK, WNT-CTNNB1/β-catenin, JAK-STAT and other signaling pathways important for cell survival, proliferation and differentiation (reviewed in [Citation2,Citation3,Citation12,Citation13]). On the plasma and ciliary membrane PKD1 was found to interact with the cation channel PKD2 [Citation2,Citation6,Citation7]. In addition, PKD1 was detected on intracellular membranes [Citation2,Citation3] and shown to be proteolyzed at its C terminus leading to protein fragments which end up in the mitochondrial matrix or in the nucleus [Citation8–11]. It is therefore possible that PKD1 interacts with the autophagosomal-lysosomal network either in its full-length or proteolyzed form. In this respect, it is interesting to note that PKD1 has recently been found to have an impact on sphingolipid metabolism, a crucial determinant of lysosomal integrity [Citation51]. Moreover, inhibition of glucosylceramide accumulation [Citation52] and loss of the St3gal5/Gm3 synthase gene [Citation53] have both been shown to protect against polycystic kidney disease in mice. An accurate subcellular localization analysis of PKD1 and identifying the full scope of its binding partners will be needed to shed light on how this protein controls lysosomal integrity and/or sphingolipid metabolism.
It was reported that cells lacking Pkd1 exert diminished autophagy initiation, presumably due to higher MTOR activity [Citation15–17]. It is, however, unlikely that this defect is the cause for ADPKD in light of the finding that MTOR inhibitors, stimulating autophagy, have been unsuccessful in the clinic [Citation39–41]. Instead, we now show an autophagic defect in cells on the level of autophagy completion. pkd1−/- cells clearly show the accumulation of the autophagic marker LC3-II, which cannot be as efficiently degraded in lysosomes as in WT cells. Consistently, autophagosomal-lysosomal fusion is perturbed (as quantified by GFP-RFP-LC3 tracing). In addition, we provide evidence for an increased lysosomal biogenesis response in pkd1−/- cells via the transcription factor TFEB. If autophagy was inhibited, TFEB should either be sequestered or proteolytically degraded and restrained from entering the nucleus to perform its transcriptional activity [Citation46–48]. However, the opposite is the case in both pkd1−/- mIMCD3s and primary epithelial cells isolated from pkd1−/- nephrons. TFEB expression is even higher, more TFEB accumulates in the nucleus in a presumably dephosphorylated form and its target genes for lysosomal biogenesis are more induced. In addition, starvation-induced lysosomal biogenesis proceeds with similar kinetics in pkd1−/- mIMCD3s as compared to WT cells. Thus, higher expression of TFEB and its target genes seem to generate more lysosomes in pkd1−/- cells, but they are less acidic/functional, presumably due to a concomitant increased activation of CAPNs.
We cannot entirely exclude that autophagosomes still fuse with lysosomes in pkd1−/- cells in which case the GFP fluorescence of the RFP-GFP-LC3 reporter would be quenched due to the higher pH in the lysosomes. We however found another defect which was associated with diminished lysosomal function, namely that MVB do not effectively deliver their ubiquitinated cargo to lysosomes. Instead, they fuse with the plasma membrane and release exosomes and soluble proteins, including lysosomal hydrolases into the extracellular space. Exosomes trigger various cellular responses, including cell proliferation and migration of neighboring cells [Citation35]. In addition, secreted hydrolases such as CTSB assist in the degradation of extracellular matrix components and the maturation of growth factors which favor cell proliferation and tumor invasiveness [Citation54]. Although most of the secreted CTSB was in an unprocessed form in pkd1−/- cells, some active, processed CTSB was found in conditioned media. Increased cell proliferation and migration have been reported to be characteristic features of cystogenesis and ADPKD formation [Citation1–3].
CAPN-mediated proteolysis of lysosomal proteins such as LAMP1 and LAMP2 occurs in both pkd1−/- cells and primary epithelial cells isolated from pkd1−/- nephrons and is likely to cause the defect in lysosomal function. LAMPs are crucial proteins which maintain the integrity of lysosomes [Citation26,Citation27]. It has also been shown that LAMP1 is crucial for the completion step of autophagy [Citation28,Citation43,Citation55]. Hence proteolysis of LAMP1 by CAPNs could be one possible cause why autophagosomes do not effectively fuse with lysosomes in pkd1−/- cells. In addition, CAPNs may degrade other lysosomal proteins such as V-ATPase, which is responsible for lysosomal acidification. Importantly, however, CAPN-mediated proteolysis of lysosomal proteins does not occur to the point that the lysosomal membrane is permeabilized (LMP). As shown in our LGALS1 immunofluorescence and anti-CTSB western blotting analyses, LMP only occurs after LLOMe addition, and it is more efficient in WT than pkd1−/- cells probably because LLOMe requires acidification for its activation. pkd1−/- cells are also not more prone to apoptosis which should be the case if these cells display increased LMP or if calcium rises to cytotoxic levels. CAPNs cleave their targets by limited proteolysis without entirely destroying them (the reason why LAMPs are not entirely depleted). This makes them ideal enzymes to effectively modulate signaling pathways such as the regulation of CDK5, IL1A/IL1α, CMYC or SPT/spectrin [Citation30]. Consistent with this notion, a deficiency in CAPN signaling causes many diseases such as neurodegenerative diseases, ischemia, cancers and formation of cataracts.
How CAPNs are activated in pkd1−/- cells has not yet been unraveled. Our finding that calcium blockers prevent LAMP1 degradation and partially rescue lysosomal function indicates that calcium influx plays a role. PKD1 could regulate calcium influx via its interaction partner PKD2, which operates as a cation channel that regulates calcium fluxes [Citation2,Citation5–7]. Recently, Arhatte et al. reported that PKD2 controls lysosomal calcium loading [Citation56]. It is therefore possible that a lack in Pkd1 perturbs calcium homeostasis in a way that CAPNs are hyperactivated. Alternatively, PKD1 may keep CAPNs in check in a Ca2+-independent manner through yet to be identified binding partners. Whatever mechanism involved, it will be interesting to study the role of CAPNs on cyst growth in pkd1−/- mouse models, to test whether they may qualify as new therapeutic targets to treat ADPKD. Over the last decades several CAPN inhibitors, mostly based on a short peptide sequence have been developed [Citation30]. However, clinical use of most of these inhibitors proved to be very limited, albeit some promising findings were reported with neurological or muscular ischemia [Citation30,Citation57]. Moreover, it has been difficult to study the role of CAPNs in mice because their genetic deletion causes embryonic lethality. We therefore need kidney-specific, inducible capn knockout mice to further study the impact of CAPNs on cyst development and ADPKD in the context of PKD1 deficiency.
Materials and methods
Cell culture
Murine inner medullary collecting duct (mIMCD3) cells were obtained from ATCC (CRL-2123). The generation of the pkd1 knockout cells was described elsewhere [Citation58]. Three different clones of pkd1−/- mIMCD3 cells were used (cl 1, cl 2 and cl 3). In addition, pkd1−/- mIMCD3 cl 2 cells were infected with a retroviral pLXSN construct (Clontech, 631509) containing the mouse Pkd1 cDNA followed by G418 selection to generate so-called “rescue” cells, which have the Pkd1 gene re-expressed. All cells were maintained in Dulbecco’s Modified Eagle Medium (DMEM; Sigma-Aldrich, D5796) with 10% fetal calf serum and 1% penicillin-streptomycin (P/S) and kept in continuous culture for one week after defrosting. Experiments were started 24 h after seeding when the cells were subconfluent and non-differentiated.
Chemicals and reagents
Starvation was induced by maintaining the cells in Earls balanced Salt Solution (EBSS; Thermo Fisher Scientific, 14155063) medium for up to 90 min. 10 nM of bafilomycin A1 (Sigma-Aldrich, B1793), a V-ATPase inhibitor, or 40 µM chloroquine (CQ) (Cell Signaling Technology, 14774), a lysosomotropic agent, were given to cells for 4 h to block/diminish lysosomal acidification. The CAPN inhibitors calpain inhibitor-1 (CI-1, ALLN; Sigma-Aldrich, A6185) and acetyl-calpastatin (acCal) (184–210) (Tocris Biotechnology, 2950) were applied at 10 µM and 50 µM for 2–4 h, respectively. The calcium channel blocker verapamil (Sigma-Aldrich, V4629) was given to cells at 100 µM for 4 h. L-leucyl-L-leucine methyl ester (LLOMe; Santa Cruz Biotechnology, sc285992) was applied at a concentration of 2 mM for 2 h to induce lysosomal membrane permeabilization (LMP). Hoechst 33342 was bought from Sigma-Aldrich, B2261.
LysoTracker labeling and FACS analysis
Acidic vesicles were labeled using LysoTrackerTM Red DND-99 (Thermo Fisher Scientific, L7528) at a final concentration of 50 nM. The cells were incubated with LysoTracker at 37°C for 30 min and then trypsinized, washed and resuspended in phosphate-buffered saline (PBS; Thermo Fisher Scientific, 10,010,031) to be analyzed by flow cytometry using the PE filter (LSRII, Becton Dickinson, Heidelberg, Germany or Cytoflex S, Beckman Coulter, Krefeld, Germany). Mean fluorescence intensity (MFI) was used as an indirect measure of the acidic compartment (lysosomal activity) in cells. Data exported from the FACS experiments were analyzed using the analysis software FlowJo 7.5.
Magic red CTSB assay
Intracellular CTSB activity was measured in WT, pkd1−/- cl 2 and cl 3 and pkd1−/- cl 2 “Pkd1 rescue” mIMCD3 cells treated or not with CAPN inhibitors or Baf A1 by fluorometric plate reader analysis using the Magic Red™ CTSB assay kit from Abcam, ab270772, according to the manufacturer’s protocol. Briefly, 20 µl of a reconstituted Magic Red staining solution was added to 280 µl of cells (3 x 10⁶ cells/ml) and incubated at 37°C for 30–60 min protected from light. The cells were resuspended gently approximately every 10–20 min as they settled to the bottom to ensure that Magic Red was evenly dispersed among all cells. The cells were split into 3 wells (100 µl each) of a black microtiter plate and the fluorescence intensity of the red fluorescent Magic Red cresyl violet fluorophore was measured at excitation and emission wavelength tandem of 592 nm and 628 nm, respectively, to an endpoint read in a fluorescence plate reader (Tecan, Männedorf, Switzerland). Unlabeled and acridine orange (AO) labeled samples were used as controls.
Lysosomal pH measurement
Lysosomal pH was measured as previously described [Citation59]. One day before the experiment, 1 × 10⁶ WT, pkd1−/- cl 2 and pkd1−/- cl 2 “Pkd1 rescue” mIMCD3 cells, treated or not with the CAPN inhibitor CI-1 were fed with 50 µg/ml of LysoSensorTM Yellow/Blue Dextran® (Thermo Fisher Scientific, L22460) for 12 h. The next day, the cells were rinsed 3 times in PBS to remove excess dye, detached by pipetting and resuspended in 200 µl of buffer A (136 mM NaCl, 2.5 mM KCl, 2 mM CaCl2, 1.3 mM MgCl2, 5 mM glucose, 10 mM HEPES, pH 7.4). The cells were transferred to a black 96-well plate. LysoSensor fluorescence emission was recorded at 460 nm and 540 nm upon excitation at 360 nm using a fluorescence plate reader (Tecan, Männedorf, Switzerland). The 460:540 fluorescence emission ratios were interpolated to a calibration curve that was built by resuspending the cells containing LysoSensor in 200 µl aliquots of pH calibration buffers (145 mM KCl, 10 mM glucose, 1 mM MgCl2, and 20 mM of either HEPES, MES, or acetate supplemented with 10 µg/ml nigericin, Sigma-Aldrich, N7143), buffered to pH ranging from 3.5 to 8.0. All measurements were performed in triplicates.
Whole cell protein extraction, nuclei isolation and immunoblotting
To prepare whole cell lysates (WCL), centrifuged, trypsinized cells were resuspended in 30–50 µl of lysis buffer (20 mM Tris-HCl, pH 7.5, 150 mM NaCl, 5 mM EDTA, pH 8.0, 5 mM Na-pyrophosphate, 1 mM Na3VO4, 20 mM NaH2PO4, pH 7.6, 3 mM β-glycerophosphate, 10 mM NaF, containing 1% Triton X-100 [Thermo Fisher Scientific, 85111) and a protease inhibitor cocktail [Abcam, ab65621). Nuclear and cytosolic fractions were prepared using the Nuclear Extraction Kit of Abcam, ab113474. Subcellular fractionation into membranes and cytosol was performed as described previously [Citation60]. Equal amounts of protein (50 µg) were separated by SDS-PAGE and transferred onto nitrocellulose or PVDF membranes (Thermo Fisher Scientific, 88018 or 88518). The blots were then incubated with the corresponding primary and secondary antibodies. The ECL detection kit was used to visualize the protein bands by chemoluminescence. The films were developed using film developer Curix 60 (AGFA Healthcare, Cologne, Germany) or imaged using a Fusion SL system (Vilber, Collégien, France). Band detection was within the linear range and quantification was performed using ImageJ (NIH, Bethesda, USA) and calculated relative to the housekeeping proteins GAPDH, ACTB/β-ACTIN or HISTONE H3. The following primary antibodies were used: Anti-LAMP1 (clone EPR21026, ab208943, rabbit monoclonal, 1:1000), anti-LAMP2 (clone H4B4, ab25631, mouse monoclonal, 1:1000), anti-CD63 (ab216130, rabbit polyclonal, 1:200), anti-NFKBIA/IκBα (clone EP689, ab76429, rabbit monoclonal, 1:2000), anti-histone H3 (ab1791, rabbit polyclonal, 1:2000) (all from Abcam), anti-CTSB (clone D1C7Y, 31718S, rabbit monoclonal, 1:1000), anti-TFEB (clone D4L2P, 32361, rabbit monoclonal 1:1000), anti-HSP90 (clone C45G5, 4877, rabbit monoclonal, 1:1000), anti-GAPDH (clone D16H11, 5174, rabbit monoclonal, 1:1000) (all from Cell Signaling Technology), anti-LC3 (Novus Biologicals, NB600-1384), anti-UBIQUITIN (clone P4D1, sc-8017, mouse monoclonal, 1:1000) and anti-ACTB/β-ACTIN (clone C4, 69100, mouse monoclonal, 1:500) (both from MP Biochemicals). Secondary peroxidase-labeled anti-mouse IgG (H + L) and anti-rabbit IgG (H + L) were obtained from Jackson Immuno Research, 115–035-003 and 111–035-144, respectively). All primary antibody dilutions were according to manufacturers’ protocols, secondary antibodies were diluted 1:5000.
Preparation of extracellular vesicles (EVs) and vesicle-free medium (VFM)
The preparation procedure established by Latifkar et al. [Citation32] was essentially followed with some modifications. Briefly, 1 × 10⁷ WT, pkd1−/- (cl 2 and cl 3) or pkd1−/- “rescue” cells, either untreated or treated with CI-1 or Baf A1 were serum starved overnight and their conditioned medium (CM) was collected on the next day. The CM was centrifuged twice at 700 x g to remove cell debris. The medium was then passed through a Steriflip PVDF filter (Merck Millipore, SE1M179M6), gamma sterilized, with pore sizes of 0.22 µm, and the filter was rinsed three times with 5 ml of PBS to remove any remaining exosome-sized EVs (less than 0.22 µm). The EVs larger than 0.22 µm retained by the filter were lysed in 250 µl of buffer B (25 mM Tris, pH 7.5, 100 mM NaCl, 1% Triton X-100, 1 mM EDTA, 1 mM DTT, 1 mM NaVO4, 1 mM β-glycerol phosphate containing a protease inhibitor cocktail [Abcam, ab65621)]) and considered as the microvesicle (MV) lysate. The filtrate was ultracentrifuged at 100,000 x g for 8 h and the pelleted exosomes were lysed in 250 µl of buffer B. The supernatant depleted of MV and exosomes was concentrated using 10 kD centricons (Amicon®, Merck Millipore, UFC901008). This concentrate was considered the VFM. MV, exosomes and whole cell lysates were all centrifuged at 16,000 x g for 10 min and the supernatants were subjected to western blots analysis.
CAPN activity assay
CAPN activity was measured using the calpain activity assay kit (Abcam, ab65308). Activated CAPN cleaves the substrate Ac-LLY-AFC which releases the AFC green fluorescence unit. 3 × 10⁶ cells were trypsinized and lysed with the provided extraction buffer. Isolated cytosolic proteins were incubated with the Ac-LLY-AFC substrate at 37°C for 1 h and measured using a fluorescence plate reader (Tecan, Männedorf, Switzerland).
Apoptosis assay
Wild-type (WT) and pkd1−/- cl 2 mIMCD3 cells were treated with 100 µM etoposide (Etopo; Sigma-Aldrich, E1383), 1 µM staurosporine (STS; Sigma-Aldrich, S6942) or 10 µM of tunicamycin (Tunica; Sigma-Aldrich, T7765) for 24 h. Both detached and attached cells were washed in ANXA5/annexin V binding buffer (10 mM HEPES, pH 7.5, 140 mM NaCl, 2.5 mM CaCl2), resuspended in ANXA5/annexin V binding buffer containing ANXA5/annexin V-fluorescein isothiocyanate (FITC) and 7-aminoactinomycin D (7-AAD) (both from Thermo Fisher Scientific, A13199 and A1310, respectively) and incubated for at least 15 min in the dark. The percentage of apoptotic cells was analyzed on a LSRII (BD Biosciences, Allschwil, Switzerland) or CytoflexS (Beckman Coulter, Krefeld, Germany). The number of living cells (ANXA5/annexin V-7-AAD negative) were depicted.
Autophagosome detection by RFP-GFP-LC3
The plasmid pF-CMVTO-mCherry-GFP-LC3-SV40-puro was a kind gift of Dr. Ian Gentle, University of Freiburg [Citation42]. 24 and 48 h after transfection with LipofectamineTM 3000 Transfection Reagent (Thermo Fisher Scientific, L3000008) the fluorescence analysis for autophagy was performed with standard GFP and RFP settings using an Observer.Z1 epifluorescence microscope (Zeiss, Oberkochen, Germany). Fluorescent dots were separately counted manually in the red channel (lysosomes) and in the green channel (which also have to be red, i.e. yellow, autophagosomes) in a double-blinded manner, and the red:green fluorescence ratio was determined.
Immunofluorescence microscopy
Cells were seeded at a density of 1 × 10⁵ cells per 6 wells on a previously sterilized cover slip. Twenty-four h after seeding, the cells were treated with CI-1 (10 µM) or acetyl-calpastatin (acCal, 50 µM) for 2 h and subsequently fixed/permeabilized in PTEMF buffer (2 mM PIPES, pH 6.8, 0.2% Triton X-100, 10 mM EGTA, 1 mM MgCl2, 4% formaldehyde). The slides were blocked in 10% bovine serum albumin (Sigma-Aldrich, B8667) diluted in PBS and incubated with anti-CTSB (Abcam, CA10, ab58802, mouse monoclonal, 1:200) and/or anti-LAMP1 (Abcam, EPR21026, ab208943 rabbit monoclonal, 1:100) or anti-LGALS1/GAL1 (Cell Signaling Technology, 12936) for 90 min, followed by Alexa Fluor 488 or Alexa Fluor 568-conjugated goat anti-rabbit (A11034 [Alexa Fluor 488] and A11011 [Alexa Fluor 568]) or anti-mouse (A32723 [Alexa Fluor 488] and 11031 [Alexa Fluor 568]) secondary fluorescence antibodies (1:400, Thermo Fisher Scientific) After mounting, the coverslips were incubated with ProLong Gold antifade reagent including DAPI (Thermo Fisher Scientific, P36935) and images were captured using an Observer.Z1 epifluorescence microscope equipped with an Apoptome (Zeiss, Oberkochen, Germany). Quantification was performed with ImageJ software.
RNA isolation and expression quantification
RNA was isolated using TRIzol (Thermo Fisher Scientific, 15596026) and a subsequent chloroform and isopropanol precipitation. cDNA was generated using 2 µg RNA and Super ScriptTM IV Reverse Transcriptase (Thermo Fisher Scientific, 18090200). cDNA was amplified in an CFX96® real time PCR machine (Bio-Rad, Hercules, CA, USA) using primers against Actb/β-Actin (FWD: 5ʹ-TACTGCTCTGGCTCCTAGCA-3ʹ, REV: 5ʹ-CGGACTCATCGTACTCCTGC-3ʹ), Map1lc3b (FWD: 5ʹ-GTGGAAGATGTCCGGCT CAT-3ʹ, REV: 5ʹ-TGGTCAGGCACCAGGAACTT-3ʹ), Lamp1 (FWD: 5ʹ-ACCTGTCGA GTGGCAACTTCA-3ʹ, REV: 5ʹ-GGGCACAAGTGGTGGTGAG-3ʹ), Bnip1l (FWD: 5ʹ-CGTCTTCCATCCACAATGGAG-3ʹ, REV: 5ʹ-TTGTGGTGAAGGGCTGTCAC-3ʹ) or Pkd1 (FWD: 5ʹ-TAGGGCTCCTGGTGAACCTT-3ʹ, REV: 5ʹ-CCAGACCACAGTTGCA CTCA-3ʹ) and Tfeb (FWD: 5ʹ-GACTC-AGAAGCGAGAGCTAACA-3ʹ, REV: 5ʹ-TGTGATTGTCTTTCTTCTGCCG-3ʹ. The detected gene expression levels were normalized to those of the housekeeping gene Actb/β-Actin. The ratios of target genes to Actb/β-Actin expression levels in WT, pkd1−/-, pkd1−/“rescue”, untreated and treated samples were calculated using the delta-CT method.
Mouse handling
All animal experiments were conducted according to the guidelines of the National Institutes of Health Guide for the Care and Use of Laboratory Animals, as well as the German law for the welfare of animals, and were approved by regional authorities. Mice were housed in a specific pathogen-free facility, fed ad libitum and housed at constant ambient temperature in a 12-h day/night cycle. Breeding and genotyping were done according to standard procedures. The generation of conditional pkd1fl/fl;Pax8rtTA;TetOCre+ mice (BL6 background) was described elsewhere [Citation61–63]. At 4 weeks of age (time of weaning), Cre+ transgenic mice were put on doxycycline (2 mg/ml, sweetened with 5% (w:v) sucrose, protected from light; Sigma-Aldrich, D3447) for 6 weeks to induce Cre activity. Mice were sacrificed, kidneys immediately explanted and stored on ice. Half of the kidney was fixed in 4% formol for 24 h and transferred to 70% ethanol. The tissue was embedded in paraffin, cut into 8-µm-thick slices and stained with hematoxylin/eosin (H/E) (Vector Laboratories, H-3502). The second half of the kidney was immediately mechanically and chemically lysed in lysis buffer as described above (extraction and immunoblotting). To isolate the distal tubules from the kidneys, a collagenase digestion was performed on the isolated kidney as extensively described in [Citation64]. In short, the mouse was narcotized with carbon dioxide, the aorta clamped caudal to the renal artery, and 1 ml pre-warmed collagenase II (2 mg/ml; Sigma-Aldrich, C2-BIOC) was injected into the intrarenal aorta abdominalis to perfuse the kidneys. Kidneys were immediately explanted, sliced into 1-mm-thick pieces (coronal to the axis of the organ) and incubated for 10 min in 1 ml of pre-warmed collagenase II (2 mg/ml) on a shaker at 37°C. The supernatant was collected, and transferred to a glass Petri dish. Distal tubuli were collected under a Zeiss Binocular (6 x magnification, Oberkochen, Germany), equipped with a Rottermann contrast (Leica, Wetzlar, Germany). Approximately 100 distal tubules were collected, centrifuged and trypsinized for 5 min. Single cells were resuspended in 500 µl pre-warmed DMEM containing LysoTracker (1:20,000) with or without calpain inhibitor-1 (Cl-1, 10 µM). After 20-min incubation on an orbital shaker at 37°C, the LysoTracker mean fluorescence intensity (MFI) was measured using Beckman Coulter Cytoflex S flow cytometer. In addition, whole cell extracts were prepared from non-induced and induced primary cells, treated or not with CI-1 and subjected to anti-LC3 and anti-LAMP1 western blot analysis.
Data presentation and statistical analysis
GraphPad Prism® 5.0 software was used to graph, analyze and present the obtained data. Quantitative data are presented as means ± SD. All experiments were independently performed at least three times. Statistical significance was calculated by one-way (one independent variable) or two-way (two and more independent variables) ANOVA (with Bonferroni Post Test) or experiments comparing more than two conditions, and Student’s t-test (with paired Values) for experiments comparing only two conditions. Error bars represent the mean ± SD. *p < 0.05, **p < 0.01, ***p < 0.001, n.s. non-significant.
Supplemental Material
Download Zip (6.9 MB)Acknowledgments
Our research is funded by the Collaborative Research Centre (SFB) KIDGEM 1140 “Kidney Disease – From Genes to Mechanisms” of the Deutsche Forschungsgemeinschaft (DFG). Animal experiments were performed according to the RRR principle and regulated by the Tierversuchsantrag G16/021 by the Regierungspräsidium Freiburg. The project was partly supported by a Bayer Foundation StartUP Grant to Lukas Peintner. Anusha Venkatraman was funded by the IMBS German-Argentinian Master program and the DAAD as well as by the Spemann Graduate School of Biology and Medicine (SGBM) in the frame of the Excellence Initiative of the DFG. Alexander Voronov is a member of the German Academic Scholarship Foundation. Michael Köttgen was supported by DFG, project number 239283807, TRR 152, project number 246781735, the SFB 1140 and the Excellence Strategy (CIBSS – EXC 2189 – project ID 390939984). E. Wolfgang Kuehn was supported by DFG KU 1504/5-1 and 1504/7-1. Amandine Viau was supported by ERA-EDTA ALTF 84-2011 and FRM ARF20150934110 fellowships. We are thankful to Helmut Laaff of TPL, Freiburg, for preparing the histological tissue slices of the kidney, Ian Gentle, University Freiburg for generously providing us with the RFP-GFP-LC3 plasmid. We thank Katrin Wieland and Sandra Sandler for excellent technical assistance, the team of the animal facility CEMT for animal care, and Kevin Ryan, University of Glasgow, for insightful discussions.
Disclosure statement
AH is now an employee of AstraZeneca, and may own stock or stock options. The others declare no conflict of interest.
Supplementary material
Supplemental data for this article can be accessed here.
Additional information
Funding
Related Research Data
References
- Cornec-Le Gall E, Alam A, Perrone RD. Autosomal dominant polycystic kidney disease. Lancet. 2019 Mar 2;393(10174):919–935.
- Fedeles SV, Gallagher AR, Somlo S. Polycystin-1: a master regulator of intersecting cystic pathways. Trends Mol Med. 2014 May;20(5):251–260.
- Peintner L, Borner C. Role of apoptosis in the development of autosomal dominant polycystic kidney disease (ADPKD). Cell Tissue Res. 2017 Jul;369(1):27–39.
- Nims N, Vassmer D, Maser RL. Transmembrane domain analysis of polycystin-1, the product of the polycystic kidney disease-1 (PKD1) gene: evidence for 11 membrane-spanning domains. Biochemistry. 2003 Nov 11;42(44):13035–13048.
- Nauli SM, Alenghat FJ, Luo Y, et al. Polycystins 1 and 2 mediate mechanosensation in the primary cilium of kidney cells. Nat Genet. 2003 Feb;33(2):129–137.
- Busch T, Köttgen M, Hofherr A. TRPP2 ion channels: critical regulators of organ morphogenesis in health and disease. Cell Calcium. 2017 Sep;66:25–32.
- Su Q, Hu F, Ge X, et al. Structure of the human PKD1-PKD2 complex. Science. 2018 Sep 7;361(6406):eaat9819.
- Qian F, Boletta A, Bhunia AK, et al. Cleavage of polycystin-1 requires the receptor for egg jelly domain and is disrupted by human autosomal-dominant polycystic kidney disease 1-associated mutations. Proc Natl Acad Sci U S A. 2002 Dec 24;99(26):16981–16986.
- Chauvet V, Tian X, Husson H, et al. Mechanical stimuli induce cleavage and nuclear translocation of the polycystin-1 C terminus. J Clin Invest. 2004 Nov;114(10):1433–1443.
- Lin -C-C, Kurashige M, Liu Y, et al. A cleavage product of Polycystin-1 is a mitochondrial matrix protein that affects mitochondria morphology and function when heterologously expressed. Sci Rep. 2018 Feb 9;8(1):2743.
- Low SH, Vasanth S, Larson CH, et al. Polycystin-1, STAT6, and P100 function in a pathway that transduces ciliary mechanosensation and is activated in polycystic kidney disease. Dev Cell. 2006 Jan;10(1):57–69.
- Harris PC, Torres VE. Polycystic kidney disease. Annu Rev Med. 2009;60(1):321–337.
- Gallagher AR, Germino GG, Somlo S. Molecular advances in autosomal dominant polycystic kidney disease. Adv Chronic Kidney Dis. 2010 Mar;17(2):118–130.
- Antignac C, Calvet JP, Germino GG, et al. The future of polycystic kidney disease research—as seen by the 12 kaplan awardees. J Am Soc Nephrol. 2015 Sep;26(9):2081–2095.
- Boletta A. Emerging evidence of a link between the polycystins and the mTOR pathways. Pathogenetics. 2009 Oct 28;2(1):1–16.
- Ravichandran K, Edelstein CL. Polycystic kidney disease: a case of suppressed autophagy? Semin Nephrol. 2014 Jan;34(1):27–33.
- Rowe I, Chiaravalli M, Mannella V, et al. Defective glucose metabolism in polycystic kidney disease identifies a new therapeutic strategy. Nat Med. 2013 Apr;19(4):488–493.
- Levine B, Mizushima N, Virgin HW. Autophagy in immunity and inflammation. Nature. 2011 Jan 20;469(7330):323–335.
- Mizushima N, Ohsumi Y, Yoshimori T. Autophagosome formation in mammalian cells. Cell Struct Funct. 2002 Dec;27(6):421–429.
- Chan E. Regulation and function of uncoordinated-51 like kinase proteins. Antioxidants Redox Signal. 2012 Sep 1;17(5):775–785.
- Russell RC, Tian Y, Yuan H, et al. ULK1 induces autophagy by phosphorylating Beclin-1 and activating VPS34 lipid kinase. Nat Cell Biol. 2013 Jul;15(7):741–750.
- Kabeya Y, Mizushima N, Yamamoto A, et al. LC3, GABARAP and GATE16 localize to autophagosomal membrane depending on form-II formation. J Cell Sci. 2004 Jun 1;117(Pt 13):2805–2812.
- Park S, Choi S-G, Yoo S-M, et al. Choline dehydrogenase interacts with SQSTM1/p62 to recruit LC3 and stimulate mitophagy. Autophagy. 2014;10(11):1906–1920.
- Liang C, Lee J-S, Inn K-S, et al. Beclin1-binding UVRAG targets the class C Vps complex to coordinate autophagosome maturation and endocytic trafficking. Nat Cell Biol. 2008 Jul;10(7):776–787.
- Satoo K, Noda NN, Kumeta H, et al. The structure of Atg4B-LC3 complex reveals the mechanism of LC3 processing and delipidation during autophagy. Embo J. 2009 May 6;28(9):1341–1350.
- Andrejewski N, Punnonen E-L, Guhde G, et al. Normal lysosomal morphology and function in LAMP-1-deficient mice. J Biol Chem. 1999 Apr 30;274(18):12692–12701.
- Eskelinen E-L. Roles of LAMP-1 and LAMP-2 in lysosome biogenesis and autophagy. Mol Aspects Med. 2006 Oct-Dec;27(5–6):495–502.
- Mrschtik M, Ryan KM. Lysosomal proteins in cell death and autophagy. Febs J. 2015 May;282(10):1858–1870.
- Yamashima T. Hsp70.1 and related lysosomal factors for necrotic neuronal death. J Neurochem. 2012 Feb;120(4):477–494.
- Ono Y, Saido TC, Sorimachi H. Calpain research for drug discovery: challenges and potential. Nat Rev Drug Discov. 2016 Dec;15(12):854–876.
- Villalpando Rodriguez GE, Torriglia A. Calpain 1 induce lysosomal permeabilization by cleavage of lysosomal associated membrane protein 2. Biochim Biophys Acta. 2013 Oct;1833(10):2244–2253.
- Latifkar A, Ling L, Hingorani A, et al. Loss of sirtuin 1 alters the secretome of breast cancer cells by impairing lysosomal integrity. Dev Cell. 2019 May 6;49(3):393–408.e7.
- Alvarez-Erviti L, Seow Y, Schapira AH, et al. Lysosomal dysfunction increases exosome-mediated alpha-synuclein release and transmission. Neurobiol Dis. 2011 Jun;42(3):360–367.
- Desrochers LM, Antonyak MA, Cerione RA. Extracellular vesicles: satellites of information transfer in cancer and stem cell biology. Dev Cell. 2016 May 23;37(4):301–309.
- Antonyak MA, Li B, Boroughs LK, et al. Cancer cell-derived microvesicles induce transformation by transferring tissue transglutaminase and fibronectin to recipient cells. Proc Natl Acad Sci USA. 2011 Mar 22;108(12):4852–4857.
- Walz G, Budde K, Mannaa M, et al. Everolimus in patients with autosomal dominant polycystic kidney disease. N Engl J Med. 2010 Aug 26;363(9):830–840.
- Serra AL, Poster D, Kistler AD, et al. Sirolimus and kidney growth in autosomal dominant polycystic kidney disease. N Engl J Med. 2010 Aug 26;363(9):820–829.
- Huber TB, Walz G, Kuehn EW. mTOR and rapamycin in the kidney: signalling and therapeutic implications beyond immunosuppression. Kidney Int. 2011 Mar;79(5):502–511.
- Ruggenenti P, Gentile G, Perico N, et al. Effect of sirolimus on disease progression in patients with autosomal dominant polycystic kidney disease and CKD stages 3b-4. Clin J Am Soc Nephro. 2016 May 6;11(5):785–794.
- Lenoir O, Tharaux P-L, Huber TB. Autophagy in kidney disease and aging: lessons from rodent models. Kidney Int. 2016 Nov;90(5):950–964.
- Zhu P, Sieben CJ, Xu X, et al. Autophagy activators suppress cystogenesis in an autosomal dominant polycystic kidney disease model. Hum Mol Genet. 2017 Jan 1;26(1):158–172.
- Zhou C, Zhong W, Zhou J, et al. Monitoring autophagic flux by an improved tandem fluorescent-tagged LC3 (mTagRFP-mWasabi-LC3) reveals that high-dose rapamycin impairs autophagic flux in cancer cells. Autophagy. 2012 8;Aug(8):1215–1226.
- Sakamaki J-I, Wilkinson S, Hahn M, et al. Bromodomain protein BRD4 is a transcriptional repressor of autophagy and lysosomal function. Mol Cell. 2017 May 18;66(4):517–532.e9.
- Diwu Z, Chen CS, Zhang C, et al. A novel acidotropic pH indicator and its potential application in labeling acidic organelles of live cells. Chem Biol. 1999 Jul;6(7):411–418.
- Li W, Sahu D, Tsen F. Secreted heat shock protein-90 (hsp90) in wound healing and cancer. Biochem Biophys Acta. 2012 Mar;1823(3):730–741.
- Sha Y, Rao J, Settembre C, et al. STUB1 regulates TFEB-induced autophagy-lysosome pathway. Embo J. 2017 Sep 1;36(17):2544–2552.
- Settembre C, Zoncu R, Medina DL, et al. A lysosome‐to‐nucleus signalling mechanism senses and regulates the lysosome via mTOR and TFEB. Embo J. 2012 Mar 7;31(5):1095–1108.
- Settembre C, Di MC, Polito VA, et al. TFEB Links Autophagy to Lysosomal Biogenesis. Science. 2011 Jun 17;332(6036):1429–1433.
- Aits S, Kricker J, Liu B, et al. Sensitive detection of lysosomal membrane permeabilization by lysosomal galectin puncta assay. Autophagy. 2015;11(8):1408–1424.
- Thiele DL, Lipsky PE. Mechanism of L-leucyl-L-leucine methyl ester-mediated killing of cytotoxic lymphocytes: dependence on a lysosomal thiol protease, dipeptidyl peptidase I, that is enriched in these cells. Proc Natl Acad Sci U S A. 1990 Jan;87(1):83–87.
- Gabande-Rodriguez E, Boya P, Labrador V, et al. High sphingomyelin levels induce lysosomal damage and autophagy dysfunction in Niemann Pick disease type A. Cell Death Differ. 2014 Jun;21(6):864–875.
- Natoli TA, Husson H, Rogers KA, et al. Loss of GM3 synthase gene, but not sphingosine kinase 1, is protective against murine nephronophthisis-related polycystic kidney disease. Human Mol Genet. 2012 Aug 1;21(15):3397–3407.
- Natoli TA, Smith LA, Rogers KA, et al. Inhibition of glucosylceramide accumulation results in effective blockade of polycystic kidney disease in mouse models. Nat Med. 2010 Jul;16(7):788–792.
- Olson OC, Joyce JA. Cysteine cathepsin proteases: regulators of cancer progression and therapeutic response. Nat Rev Cancer. 2015 Dec;15(12):712–729.
- Mrschtik M, O’Prey J, LY L, et al. DRAM-3 modulates autophagy and promotes cell survival in the absence of glucose. Cell Death Differ. 2015 Oct;22(10):1714–1726.
- Arhatte M, Gunaratne GS, Boustany CE, et al. TMEM33 regulates intracellular calcium homeostasis in renal tubular epithelial cells. Nat Commun. 2019 May 2;10:2024.
- Storr SJ, Carragher NO, Frame MC, et al. The calpain system and cancer. Nat Rev Cancer. 2011 May;11(5):364–374.
- Hofherr A, Busch T, Huber N, et al. Efficient genome editing of differentiated renal epithelial cells. Pflügers Archiv – Eur J Physiol. 2017 Feb;469(2):303–311.
- Zoncu R, Bar-Peled L, Efeyan A, et al. mTORC1 senses lysosomal amino acids through an inside-out-mechanism that requires the vacuolar H(+)-ATPase. Science. 2011 Nov 4;334(6056):678–683.
- Vogel S, Raulf N, Bregenhorn S, et al. Cytosolic Bax: does it require binding proteins to keep its pro-apoptotic activity in check? J Biol Chem. 2012 Mar 16;287(12):9112–9127.
- Traykova-Brauch M, Schonig K, Greiner O, et al. An efficient and versatile system for acute and chronic modulation of renal tubular function in transgenic mice. Nat Med. 2008 Sep;14(9):979–984.
- Ma M, Tian X, Igarashi P, et al. Loss of cilia suppresses cyst growth in genetic models of autosomal dominant polycystic kidney disease. Nature Genet. 2013 Sep;45(9):1004–1012.
- Viau A, Bienaimé F, Lukas K, et al. Cilia-localized LKB1 regulates chemokine signalling, macrophage recruitment, and tissue homeostasis in the kidney. Embo J. 2018 Aug 1;37(15):e98615.
- Linkermann A, Skouta R, Himmerkus N, et al. Synchronized renal tubular cell death involves ferroptosis. Proc Natl Acad Sci USA. 2014 Nov 25;111(47):16836–16841.