
ABSTRACT
Macroautophagy/autophagy, a self-degradative process, regulates metabolic homeostasis in response to various stress conditions and is a therapeutic target for nonalcoholic fatty liver disease. We found that autophagic activity was inhibited as a result of a significant reduction in the expression of autophagy-related genes such as Ulk1 in a mouse model and patients with fatty liver. This downregulation was caused by increased Mir214-3p levels and decreased Hnf4a/Hnf4α mRNA levels in hepatocytes. Mir214-3p suppressed Ulk1 expression through direct binding at a 3′ untranslated region sequence. Hnf4a directly activated transcription of Ulk1. We investigated lipid accumulation and the expression of autophagy-related genes in the livers of mice treated with anti-Mir214-3p. Hepatic steatosis was alleviated, and Ulk1 mRNA levels were significantly increased by locked nucleic acid-mediated Mir214-3p silencing. Additionally, autophagosome formation and MAP1LC3/LC3-II protein levels were increased, indicating an increase in autophagic activity. Interestingly, suppression of Mir214-3p did not ameliorate fatty liver under Ulk1 suppression, suggesting that reduced Mir214-3p levels mitigate hepatic steatosis through upregulation of Ulk1. These results demonstrate that inhibition of Mir214-3p expression ameliorated fatty liver disease through increased autophagic activity by increasing the expression of Ulk1. Thus, Mir214-3p is a potential therapeutic target for nonalcoholic fatty disease.
Abbreviations: AMPK: adenosine monophosphate-activated protein kinase; ATG: autophagy-related; ChIP: chromatin immunoprecipitation; CTSB: cathepsin B; CTSL: cathepsin L; CQ: chloroquine; HFD: high-fat diet; HNF4A: hepatocyte nuclear factor 4, alpha; IF: immunofluorescence; IHC: immunohistochemistry; LDs: lipid droplets; Leup: leupeptin; LFD: low-fat diet; LNA: locked nucleic acid; MAP1LC3B/LC3B: microtubule-associated protein 1 light chain 3 beta; miRNA: microRNA; MTOR: mechanistic target of rapamycin kinase; NAFLD: non-alcoholic fatty liver disease; NASH: non-alcoholic steatohepatitis; PCR: polymerase chain reaction; TEM: transmission electron microscopy; TF: transcription factor; TLDA: TaqMan low-density array; ULK1: unc-51 like kinase 1; UTR: untranslated region
Introduction
Macroautophagy/autophagy is a catabolic pathway that eliminates damaged cellular organelles or cytosolic components to maintain intracellular homeostasis. Recent studies have revealed “selective autophagy” that selectively degrades damaged mitochondria, peroxisomes, endoplasmic reticulum, and excessively accumulated lipid droplets (LDs) [Citation1]. Among the different types of autophagy, lipophagy, which selectively degrades LDs, was first reported by Singh et al. [Citation2], who demonstrated the critical role of autophagy in lipid metabolism as evidenced by the increase in lipid accumulation upon inhibition of autophagy in hepatocytes.
Nonalcoholic fatty liver disease (NAFLD) is a chronic liver disease caused by excessive fat accumulation, not by alcohol consumption. NAFLD is characterized by simple steatosis (intracellular triglyceride infiltration in > 5% of hepatocytes) and inflammatory nonalcoholic steatohepatitis (NASH) that can progress to fibrosis and, ultimately, to cirrhosis [Citation3]. NAFLD is frequently associated with metabolic syndromes such as obesity, dyslipidemia, and type 2 diabetes [Citation4], and its increasing prevalence worldwide parallels that of obesity [Citation5]. Modulation of autophagy is a new therapeutic target for NAFLD by degrading LDs and relieving hepatic inflammation [Citation6,Citation7]. Defective autophagosome-lysosome fusion [Citation8,Citation9], decreased lysosomal acidification [Citation10], reduced lysosomal enzyme expression [Citation11], and downregulation of autophagy-related genes, comprise the main mechanisms of impairment of autophagy in NAFLD. However, most studies on the role of autophagy in NAFLD have focused on genetic deletion models of autophagy-related genes [Citation12,Citation13], and the exact role of autophagy in NAFLD remains unclear [Citation14,Citation15].
Autophagy is induced by cellular stressors such as starvation, hypoxia, and viral infection. The adenosine monophosphate (AMP)-activated protein kinase (AMPK) and MTOR (mechanistic target of rapamycin kinase) signaling pathways regulate autophagy [Citation16,Citation17]. Autophagy studies are focused on post-translational regulation of autophagy-related proteins as well as on transcriptional regulation of autophagy-related genes [Citation18]. MicroRNAs (miRNAs) and transcription factors (TFs) are the most widely found gene regulatory factors at the post-transcriptional and transcriptional levels [Citation19]. miRNAs are initially transcribed in the nucleus as primary miRNAs; they cleave to precursor miRNAs, which are then exported to the cytosol to be converted to mature miRNAs. The mature miRNAs silence target genes by mRNA degradation or translational repression [Citation20,Citation21]. Approximately 1,000 miRNAs have been identified in the human genome, and they are known to play important roles in cell development, differentiation, growth, and apoptosis [Citation22]. miRNAs that regulate autophagy have also been identified in diseases such as cancer, and are emerging as new therapeutic targets [Citation23]. Manipulation of miRNAs, such as Mir27a, Mir27b [Citation24,Citation25], Mir24-3p [Citation26], Mir122 [Citation27], Mir132 [Citation28] and Mir34a [Citation29], can mitigate NAFLD. These miRNAs act as post-transcriptional regulators of important processes in hepatic lipid metabolism, such as insulin signaling, lipid transport (by regulating ABCA1), and cholesterol metabolism (by regulating sterol regulatory element-binding proteins). There are several studies on the amelioration of hepatic steatosis through miRNA-mediated autophagy regulation in NAFLD, but there are few reports yet [Citation28,Citation30,Citation31].
Studies on regulatory networks show the interplay of miRNAs and TFs [Citation32,Citation33]. In addition to miRNAs, TFs also regulate the transcription of genes by binding to specific cis-regulatory DNA sequences (response elements) to recruit transcription machinery such as RNA polymerase, and to initiate transcription [Citation34]. TFEB (transcription factor EB) regulates the transcription of autophagy-related genes and is a critical regulator of autophagy and lysosomal biogenesis [Citation35]. TFEB binds directly to the promoters of several autophagy-related genes such as Atg4d, Atg9b, Map1lc3b/Lc3b, Sqstm1/p62, and Uvrag. Besides TFEB, the FOXO (forkhead box O) family, JUN (jun proto-oncogene), and NR1H4/FXR (nuclear receptor subfamily 1, group H, member 4)–PPARA (peroxisome proliferator-activated receptor alpha)–CREB1 (cAMP responsive element binding protein 1) axis also regulate the transcription of autophagy-related genes [Citation36].
Although miRNAs and TFs have been reported to be involved in autophagy, how they regulate autophagy in nonalcoholic hepatic steatosis is still unknown. Hence, in this study, we aimed to investigate the expression of autophagy-related genes in high-fat diet-induced hepatic steatosis; further, we aimed to identify miRNAs and TFs that regulate autophagy-related gene expression.
Results
Autophagy-related gene expression was suppressed in the fatty liver
To investigate autophagy flux in NAFLD, mice were fed a low-fat diet (LFD) or a high-fat diet (HFD) for 5, 10, and 20 weeks to establish different degrees of fat accumulation. The final body weights, liver weights, and total hepatic lipids were significantly higher in the 5-, 10-, and 20-week HFD groups than in the LFD groups (Fig. S1A–S1C). The size of the liver and lipid accumulation in the liver increased over time in the HFD group (Fig. S1D). Further, after 20 weeks, serum GPT/ALT (glutamic pyruvic transaminase, soluble) and GOT1/AST (glutamic-oxaloacetic transaminase, soluble) levels were significantly higher in the HFD group than in the LFD group (Fig. S1E). GPT and GOT1 were used as indicators of hepatic inflammation. Although the mRNA levels of pro-inflammatory cytokines were significantly increased in the livers of the 20-week HFD group (relative to the 20-week LFD group), collagen accumulation was not detected in livers stained with Masson’s trichrome (Fig. S1F and S1G). Expression of lipogenesis- and lipid uptake-related genes were significantly upregulated by long-term (20-week)-HFD feeding, contributing to hepatic steatosis (Fig. S1H). Taken together, these results indicate that long-term-HFD-fed mice showed severe steatosis, but not NASH. Hence, we compared autophagic activity in the 20-week HFD group and the 5- and 10-week HFD groups.
To examine autophagy flux in the fatty liver, we first measured MAP1LC3/LC3 (microtubule-associated protein 1 light chain 3) protein levels, with or without leupeptin (Leup), a protease inhibitor that blocks degradation of autolysosomal cargo. Leup treatment caused LC3 expression in the liver to be elevated in the 5-week HFD group, but not in the 10- and 20-week HFD groups (Fig. S1I). These data show that autophagy flux was impaired in the fatty livers of long-term-HFD-fed mice.
The decrease in autophagic activity in fatty liver has been attributed to a decrease in lysosomal activity. Hence, we measured the protein levels and enzyme activity of CTSB (cathepsin B) and CTSL (cathepsin L), both lysosomal cysteine proteases. CTSB protein levels were significantly increased in mice fed HFD for 20 weeks, whereas CTSL levels were not significantly altered by HFD feeding (Fig. S1J and S1K). Further, although HFD feeding for 20 weeks did not alter CTSL activity, it significantly increased CTSB activity (Fig. S1L). Although our results indicate that neither CTSB nor CTSL activities were impaired by HFD, they suggest that other lysosomal markers should be analyzed.
The LC3 conjugation system is a key player in LD formation [Citation37]. Therefore, an increase in LC3 protein levels may be attributed to the HFD-induced increase in the number of LDs. To measure LC3 levels, as an autophagosome marker, we performed immunohistochemistry and immunofluorescence (IF) analyses with an anti-LC3 antibody. Immunohistochemistry analysis showed that, although LC3 in the 5- and 10-week HFD groups were similar to those in the corresponding LFD groups, LC3 levels had significantly decreased after long-term HFD feeding (20 weeks) (Fig. S1M). These results are consistent with those of the IF analysis (Fig. S1N), which shows a decrease in the number of LC3 puncta in the fatty liver after long-term HFD feeding, due to the reduction in autophagic activity. To measure autophagic activity, we examined the autophagic vacuoles using transmission electron microscopy (TEM) and found that, in the HFD group at 20 weeks, the number of autophagic vacuoles in the liver had significantly decreased (). Unlike in the 20-week LFD group, autophagosome formation was not increased by Leup treatment in the 20-week HFD group. These results indicate that autophagy was reduced in the fatty livers of long-term-HFD-fed mice.
Figure 1. Autophagic activity was decreased in the livers of long-term-HFD-fed mice. (A) Representative TEM images of autophagic vacuoles in the liver. Scale bar: 2 μm (B) The number of autophagic vacuoles per μm2 of liver area was counted. (C) The expression of autophagy-related genes was analyzed using PCR array. The RNA samples from liver tissues were pooled by group, and PCR arrays were analyzed in triplicate. Autophagy-related genes selected using the criterion having FDR < 0.15 are labeled and colored in red. Bar plots of expression levels for the autophagy genes, with dots representing data points. (D) The expression of genes found to be downregulated in the PCR array analysis was validated using qRT-PCR. (E) Protein levels for selected autophagy-related genes in the livers of 5-week or 20-week HFD- or LFD-fed mice. (F) Abundance of the protein products of selected autophagy-related genes in HFD groups relative to that in LFD groups (density ratio of protein:ACTB). (G) Autophagy-related gene mRNA levels in fatty liver (n = 6) and adjacent normal liver tissue samples (n = 5) from hepatocellular carcinoma patients were analyzed. Values represent mean ± SEM (n = 10). * p < 0.05; ** p < 0.01; *** p < 0.001, compared to LFD or normal liver tissues (Con, control). Ambra1: autophagy and beclin 1 regulator 1; ATG: autophagy-related; GABARAP: gamma-aminobutyric acid receptor associated protein; HFD: high-fat diet; LFD: low-fat diet; Leup: leupeptin; mRNA: messenger RNA; NAFLD: nonalcoholic fatty liver disease; ns: not significant; PCR: polymerase chain reaction; PIK3C3: phosphatidylinositol 3-kinase catalytic subunit type 3; qRT-PCR: quantitative reverse transcription PCR; RNA: ribonucleic acid; SEM: standard error of mean; SQSTM1/p62: sequestosome 1; TEM, transmission electron microscopy; ULK1: unc-51 like kinase 1; Uvrag: UV radiation resistance associated gene
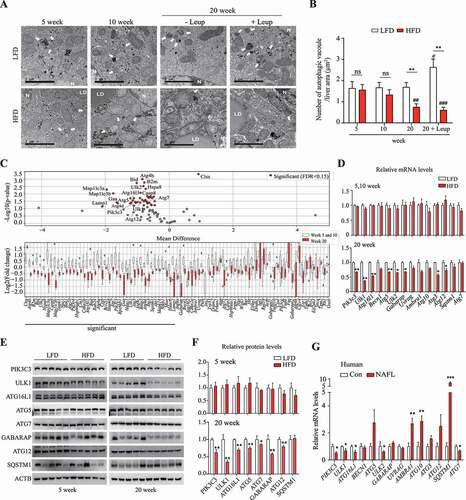
We hypothesized that the decrease over time in autophagic activity is due to a corresponding reduction over time in the expression of autophagy-related genes in the livers of the long-term HFD-fed mice. Hence, we measured the mRNA levels of autophagy-related genes, using polymerase chain reaction (PCR) arrays. Approximately 84 autophagy-related genes were examined; of these, 42 genes showed significant differences in expression in the 20-week HFD group, relative to the 5- and 10-week HFD groups (). By selecting genes known to be involved in autophagy, we found that the expression of eight autophagy-related genes, including Ulk1, Ulk2, and Atg16l1, was significantly lower in the 20-week HFD group than in the other HFD groups (). Furthermore, protein levels of PIK3C3 (phosphatidylinositol 3-kinase catalytic subunit type 3), ULK1, ATG16L1, ATG5, ATG7, GABARAP (gamma-aminobutyric acid receptor associated protein), and ATG12 were significantly lower in the 20-week HFD group than in the 5-week HFD group (). Similarly, the expression of these autophagy-related genes was lower in fatty liver samples from hepatocellular carcinoma patients than in samples of their adjacent normal tissue; PIK3C3, ULK1, ULK2, ATG16L1, and ATG7 genes were downregulated in both the human and mouse fatty liver tissues (). These results suggest that reduced autophagic activity in fatty liver, induced by long-term HFD feeding, could be attributed more to the suppression of autophagy-related gene expression than to autophagy flux dysfunction due to decreased lysosomal activity.
Mir214-3p negatively regulated Ulk1 expression through direct binding
We hypothesized that the suppression of autophagy-related gene expression was caused by transcriptional regulation by miRNA and TFs (). First, we analyzed miRNA levels using the TaqMan low-density array (TLDA) in the liver tissues of HFD- and LFD-fed mice. In the 20-week HFD group, the levels of 16 miRNAs had increased, and those of 10 miRNAs had decreased, relative to the 5- and 10-week HFD groups, both changes being significant and > 2-fold (false discovery rate = 0.1) ( and S2A). As miRNAs suppress gene expression by degrading mRNA or repressing translation [Citation38], we focused on those miRNAs whose levels were significantly increased in the mouse fatty liver tissue; these miRNAs were also upregulated in the human fatty liver tissues (). To identify the miRNAs targeting autophagy-related genes, we analyzed miRNA–autophagy-related gene interactions using the target-prediction databases miRWalk and TargetScan (). By combining the predictions of both databases, we found that the target autophagy-related genes interacted with most candidate miRNAs (). We examined the levels of these 16 upregulated miRNAs using TLDA and found that 11 miRNAs were significantly upregulated in the fatty liver tissue (HFD group), relative to the LFD group ().
Figure 2. Mir214-3p downregulated Ulk1 expression through direct binding to the Ulk1 gene. (A) The regulatory network of microRNAs and TFs in the regulation of target mRNA. (B) miRNA levels were analyzed using a TLDA kit. The RNA samples from the livers were pooled by group, and PCR arrays were analyzed in triplicate. (C) The miRNA levels in the liver of a human NAFLD patient were compared to those of a person without fatty liver (Con, control) (n = 5). (D) miRNA–autophagy-related gene interactions were analyzed using miRWalk and TargetScan. (E) miRNA–autophagy-related gene interactions were analyzed using a target-prediction website. Red indicates higher expression, and green indicates lower expression, relative to the LFD group. The intensity of the color, and the size, indicate the degree of change in expression. (F) The expression of miRNAs that were upregulated according to TLDA analysis was validated using qRT-PCR. Values represent mean ± SEM (n = 10). * p < 0.05; ** p < 0.01; *** p < 0.001, compared to the LFD group. (G–H) The expression of autophagy-related genes in (G) miRNA inhibitor-transfected or (H) mimic-transfected cells. Increase is indicated in red, and decrease is indicated in blue, relative to the negative control (n = 3). (I) Hepatocytes were transfected with the Mir214-3p inhibitor or mimic for 48 h; the protein levels of the target autophagy-related genes were then measured using immunoblotting. (J) Dual reporter assay was performed using the GLuc-SEAP vector containing 3′ UTR of Ulk1 mRNA. Hepatocytes were co-transfected with the GLuc-SEAP vector and Mir214-3p mimic for 48 h. After incubation, luciferase activity in the medium was measured, and Mir214-3p levels were quantified in cell lysates. (K) Luciferase activity was measured in hepatocytes transfected with the GLuc-SEAP vector of Ulk1 3′ UTR containing the wild-type or mutated Mir214-3p binding sites. Values represent mean ± SD (n = 3). * p < 0.05; ** p < 0.01; *** p < 0.001, compared to the NC. GLuc: Gaussia luciferase; HFD: high-fat diet; LFD: low-fat diet; miRNA: microRNA; mRNA: messenger RNA; NAFLD: nonalcoholic fatty liver disease; NC: negative control; PCR: polymerase chain reaction; qRT-PCR: quantitative reverse transcription PCR; SD: standard deviation; SEAP: secreted alkaline phosphatase; SEM: standard error of mean; TF: transcription factor; TLDA: TaqMan low-density array; UTR: untranslated region
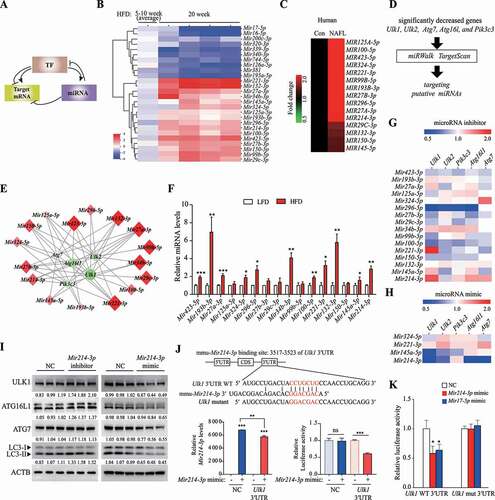
To determine whether these miRNAs regulated the expression of the target autophagy-related genes, we transfected hepatocytes with the corresponding inhibitors for these 16 miRNAs or with a negative control. The inhibition of Mir324-5p, Mir221-3p, Mir145a-5p, and Mir214-3p upregulated the expression of the target autophagy-related genes (, S2B, and S2C). However, comparing the effects of the miRNA mimics, downregulation of autophagy-related genes was observed only for Mir145a-5p (Ulk1, Ulk2, and Pik3c3) and Mir214-3p (Ulk1, Ulk2, Atg16l1, and Atg7) ( and S2D). In particular, Mir214-3p modulated ULK1 protein levels in both Mir214-3p-inhibited and mimic-treated conditions (). Protein synthesis of ATG7 and ATG16L1 was slightly regulated by Mir214-3p levels. These results suggest that, among the different miRNAs found to be upregulated in the fatty liver, Mir214-3p effectively suppressed Ulk1 expression. To determine whether Mir214-3p modulated gene expression by directly binding to Ulk1 mRNA, we searched for a complementary sequence (seed sequence of Mir214-3p) in Ulk1 and found a complementary sequence in the 3′ UTR, which is known to bind miRNAs. We performed a luciferase reporter assay using the Gaussia luciferase vector containing the 3′ UTR sequence of Ulk1 and found that transfection of the Mir214-3p mimic significantly reduced luciferase activity in cells transfected with the Ulk1 3′ UTR-containing vector (). To further confirm whether Mir214-3p binds to the 3′ UTR of Ulk1, we examined the effects of mutation of the Mir214-3p binding site on luciferase activity. We found that Mir214-3p significantly reduced luciferase activity in cells transfected with the Ulk1 WT 3′ UTR-containing vector; similarly, reduced luciferase activity was revealed by transfection with the Mir17-5p mimic, which is known to bind to Ulk1 [Citation39]. In contrast, no reduction in luciferase activity was observed after transfection with either the Mir214-3p or Mir17-5p mimics, when the mutated Ulk1 3′ UTR sequence was used (). These results suggest that Mir214-3p reduced Ulk1 expression through direct binding to the 3′ UTR sequence of Ulk1 gene. Mir214-3p was also predicted to bind to the 3′ UTR of Atg16l1, Atg7, and Ulk2, using the miRWalk database (Fig. S2E). The results from the luciferase assay demonstrated that Mir214-3p was able to bind with Atg16l1, Atg7, and Ulk2 (Fig. S2F). However, based on the analyses of liver tissue and hepatocytes, the regulation of these genes by Mir214-3p appears to be lower than its regulation of Ulk1.
Hnf4a positively regulated Ulk1 expression in hepatocytes
To identify the key TFs that regulate autophagy-related genes in hepatic steatosis in long-term-HFD-fed mice, compared to the 5- and 10-week groups, 84 TFs were studied using PCR arrays. We found 6 TFs showing significant changes, among which Atf3 (activating transcription factor 3) was significantly upregulated, whereas Hnf4a (hepatocyte nuclear factor 4 alpha) and Smad9 (SMAD family member 9) were significantly downregulated in the long-term-HFD-fed groups ( and S3A). In the validation experiments, Atf3 was again significantly upregulated, whereas Hnf4a and Smad9 were significantly downregulated (). The expression of Atf3 and Hnf4a showed the same trends in both mouse and human fatty liver tissues (). To investigate the interaction between the TFs and the autophagy-related genes, we examined the target autophagy-related gene expression in TF small interfering RNA (siRNA)-treated hepatocytes. When we compared the effects of silencing Hnf4a, Smad9, Tfeb, and Tfe3 (transcription factor E3) (Fig. S3B), only Hnf4a-silencing significantly downregulated the target autophagy-related genes, Ulk1 and Ulk2 (). The expression of Tfeb and Tfe3, both typical TFs regulating autophagy-related genes [Citation35,Citation40], was significantly reduced in the fatty mouse liver, with the decrease in Tfe3 expression being greater than that of Tfeb (Fig. S3C). However, the levels of other TFs known to regulate autophagy were not reduced in the fatty livers of HFD-fed mice (Fig. S3C), in contrast to a previous report [Citation36]. Silencing of either Tfeb or Tfe3 significantly downregulated only Atg7 expression (). The effects of Hnf4a on Ulk1 and Ulk2 expression were confirmed by the significant increase in Ulk1 and Ulk2 expression when Hnf4a was stably overexpressed using a viral vector ().
Figure 3. HNF4A upregulated Ulk1 expression through direct binding to the Ulk1 gene. (A) Differences between the means of expression levels at 5 and 10 week, and those at 20 week. TFs selected using the criterion having FDR < 0.15 were labeled and colored red or blue to indicate elevated or reduced expression, respectively. (B) TF expression that was significantly increased or decreased according to PCR array analysis was validated using qRT-PCR. Values represent mean ± SEM (n = 10). *** p < 0.001, compared to the LFD group. (C) ATF3 and HNF4A levels in the liver of human NAFLD patients were analyzed using TaqMan probe, compared to those from a person without fatty liver (Control, CON). (n = 5). (D) Hepatocytes were transfected with the indicated siRNA for 48 h; the target autophagy-related gene mRNA levels were measured using qRT-PCR. Values represent mean ± SD (n = 3). ** p < 0.01; *** p < 0.001, compared to the negative control. (E–F) Hnf4a-overexpressing hepatocytes were generated using an Hnf4a mouse retroviral vector. (E) The mRNA levels of Ulk1 and Ulk2 and (F) protein levels of ULK1 and LC3 were measured in Hnf4a-overexpressing cells. Values represent mean ± SD (n = 3). * p < 0.05; *** p < 0.001, compared to normal hepatocytes (control). (G) ChIP assay was performed using the HNF4A antibody in hepatocytes. *** p < 0.001, compared to the negative control (IgG). (H) The expression of autophagy-related genes in Hnf4a-overexpressing hepatocytes was analyzed using PCR array, and the difference in expression of autophagy-related genes is shown in the heatmap. (I) Genes that were upregulated based on PCR array analysis were validated using RT-PCR. ChIP: chromatin immunoprecipitation; FDR: false discovery rate; HFD: high-fat diet; IgG: immunoglobulin G; LFD: low-fat diet; mRNA: messenger RNA; NAFLD: nonalcoholic fatty liver disease; PCR: polymerase chain reaction; qRT-PCR: quantitative reverse transcription PCR; SD: standard deviation; SEM: standard error of mean; siRNA: small interfering RNA; TF: transcription factor
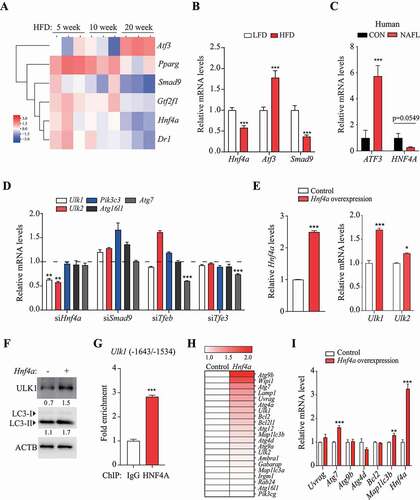
Inhibition of Atf3 by siRNA transfection upregulated the expression of Ulk1, Ulk2, and Atg16l1 (Fig. S3D), whereas overexpression of Atf3 using viral particles downregulated the expression of Ulk1, Ulk2, and Atg16l1 in hepatocytes (Fig. S3E). However, Atf3 did not alter the levels of proteins encoded by the autophagy-related genes. We also found that the protein levels of ULK1 and LC3-II were increased by overexpression of Hnf4a (), suggesting that Hnf4a plays a role in the regulation of Ulk1 expression and autophagic activity. To determine whether HNF4A binds to the promoter region of Ulk1, we performed chromatin immunoprecipitation; there was a significant increase in Ulk1 levels using the anti-HNF4A antibody, relative to that obtained using IgG (). Together, these results suggest that HNF4A promotes transcription of Ulk1 by direct binding and may increase autophagic activity. To determine whether Hnf4a affects autophagy-related genes other than those in the Ulk family, changes in autophagy-related gene expression in Hnf4a-overexpressing cells were examined using autophagy PCR arrays. This revealed that Hnf4a affected the expression of various autophagy-related genes (). Among these, Atg7 mRNA levels were found to be significantly higher in the validation experiments (). Protein synthesis of ATG7 was increased in Hnfa-overexpressing cells, but this increase was reversed by transfection with the Mir214-3p mimic (Fig. S3F).
Mir214-3p and Hnf4a regulated Ulk1 expression in hepatocytes
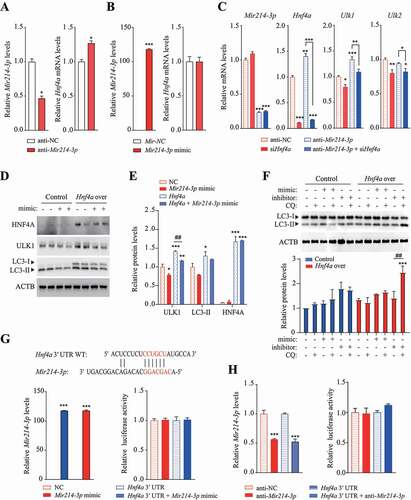
To identify the regulatory network of Mir214-3p- and Hnf4a-mediated Ulk1 expression, we examined the effects of Mir214-3p expression on Hnf4a expression. Inhibition of Mir214-3p led to the upregulation of Hnf4a (), whereas the Mir214-3p mimic did not change Hnf4a expression (). However, the expression of Tfeb and Tfe3 was not affected by Mir214-3p expression (Fig. S4A and S4B). To further confirm whether Mir214-3p regulated Hnf4a-mediated Ulk1 expression, Hepa 1-6 cells were co-transfected with anti-Mir214-3p and Hnf4a siRNA. We found that the reduction in Ulk1 mRNA levels induced by Hnf4a siRNA transfection was not reversed by Mir214-3p inhibition (). ULK1 protein levels were lower in Hnf4a-overexpressing cells transfected with the Mir214-3p mimic than in those that were not transfected with the Mir214-3p mimic (). Additionally, although LC3-II levels were higher in Hnf4a-overexpressing cells than in those that did not overexpress Hnf4a, they did not decrease after transfection with the Mir214-3p mimic. These results indicate that Hnf4a did not regulate Ulk1 expression by altering Mir214-3p levels. To investigate the effects of Hnf4a and Mir214-3p on autophagic activity, autophagy flux was analyzed using a lysosomal inhibitor. In Hnf4a-overexpressing cells, autophagy flux was significantly increased upon Mir214-3p inhibition, suggesting that Hnf4a does not induce autophagy flux by Mir214-3p regulation (). Next, to determine whether Mir214-3p can bind directly to the Hnf4a, we measured luciferase activity in Mir214-3p-mimic-transfected cells, using a luciferase vector containing the Hnf4a 3′ UTR. The computational program MiRanda was used to detect potential miRNAs that could bind to the 3′ UTR of mouse Hnf4a mRNA. We found that luciferase activity of the Hnf4a 3′ UTR reporter was not reduced by Mir214-3p mimic transfection (). No decrease in luciferase activity was observed after anti-Mir214-3p transfection in Hepa 1–6 cells (), which means that Mir214-3p did not bind directly to Hnf4a. Together, these data suggest that Mir214-3p did not regulate the expression of Ulk1 through direct binding to the Hnf4a gene and that Mir214-3p and Hnf4a regulate Ulk1 expression independently of each other.
Figure 4. Mir214-3p and Hnf4a independently regulated Ulk1 expression. (A–B) Hepatocytes were transfected with (A) Mir214-3p inhibitor or (B) mimic for 48 h; Hnf4a expression was measured using qRT-PCR. Values represent mean ± SD (n = 3). * p < 0.05; *** p < 0.001, compared to the negative control (NC). (C) Hepatocytes were co-transfected with anti-Mir214-3p and Hnf4a siRNA for 48 h. After incubation, relative expression of Ulk1 and Ulk2 was measured using qPCR. (D) Mir214-3p mimic was transfected into Hnf4a-overexpressing hepatocytes for 48 h. After incubation, relative protein levels were measured using immunoblotting. (E) Protein levels (expressed as the density ratio of protein:ACTB) were quantified using ImageJ. (F) Autophagy flux assay performed using the lysosomal inhibitor chloroquine (CQ). Mir214-3p mimic or inhibitor was transfected into Hnf4a-overexpressing hepatocytes for 48 h. Cells were treated with or without 10 µM CQ for 4 h. (G–H) Dual reporter assay was performed using GLuc-SEAP vector containing the 3′ UTR of Hnf4a mRNA. Hepatocytes were co-transfected with Glu-SEAP vector and (G) Mir214-3p mimic or (H) anti-Mir214-3p for 48 h. Luciferase activity in the medium was measured, and Mir214-3p levels were quantified in cell lysates. Values represent mean ± SD (n = 3). *** p < 0.001, compared to the negative control. GLuc: Gaussia luciferase; mRNA: messenger RNA; NC: negative control; qPCR: quantitative polymerase chain reaction; SD: standard deviation; siRNA: small interfering RNA; SEAP: secreted alkaline phosphatase; UTR: untranslated region
Inhibition of Mir214-3p expression ameliorated fatty liver disease
To determine whether the inhibition of Mir214-3p expression ameliorates fatty liver disease by regulating autophagy-related gene expression, we inhibited Mir214-3p levels in the livers of HFD-fed mice using locked nucleic acid (LNA)-mediated Mir214-3p silencing. LNA-anti-Mir214-3p or LNA-scramble construct, injected twice into the peritoneal cavity, resulted in significantly lower Mir214-3p expression in the livers of LNA-Mir214-3p-injected mice than in those of the LNA-scramble-injected mice (HFD control group) (). Mir214-3p knockdown in vivo significantly decreased the body weights and liver weights of the LNA-Mir214-3p-injected mice, compared to those of the control group (). Although Mir214-3p levels were significantly reduced in other tissues, this reduction did not affect organ weights (Fig. S5A and S5B). Hematoxylin and eosin staining showed significantly lower lipid accumulation in the liver tissue of the Mir214-3p-knockdown group than in that of the control group (). Levels of hepatic lipids and triglycerides were also lower in the Mir214-3p-knockdown group than in the control group (). These results suggest that inhibition of Mir214-3p alleviates fatty liver disease.
Figure 5. Inhibition of Mir214-3p ameliorated hepatic steatosis in HFD-fed mice. (A) nonalcoholic fatty liver was induced by 60 kcal% HFD feeding for 16 weeks and LNA-anti-Mir214-3p was administered twice intraperitoneally to inhibit Mir214-3p levels. (B) Mir214-3p levels in the liver were measured 1 week after the final LNA-anti-Mir214-3p administration. (C) Final body weight gain. (D) Liver weight. (E) Hematoxylin and eosin staining of the liver. (F) Hepatic total lipid and triglyceride levels were measured in the liver. Values represent mean ± SEM (n = 10). * p < 0.05; *** p < 0.001, compared to the HFD-fed group. (G) Representative TEM images of autophagic vacuoles in the liver. In the enlarged insets, autophagosome aggregation is observed in Leup-treated livers. Scale bar: 1 μm (H) The number of autophagic vacuoles per μm2 of liver area was quantified. Values represent mean ± SEM (n = 10). * p < 0.05; *** p < 0.001, compared to the group not treated with Leup. (I) The LC3 protein levels in the liver in the presence or absence of Leup. (J) The expression of Mir214-3p target genes was measured using qRT-PCR. Values represent mean ± SEM (n = 6). * p < 0.05; ** p < 0.01; *** p < 0.001, compared to the HFD group. (K) Liver tissue levels of proteins encoded by genes targeted by Mir214-3p. (L) Schematic overview of this study. Mir214-3p directly downregulates Ulk1 expression to ultimately inhibit autophagic activity. Reduced expression of Hnf4a by HFD feeding also reduced Ulk1 expression, leading to hepatic steatosis. PRKAA/AMPKa: adenosine monophosphate-activated protein kinase, alpha catalytic subunit; HFD: high-fat diet; Leup: leupeptin; LFD: low-fat diet; LNA: locked nucleic acid; qRT-PCR: quantitative reverse transcription polymerase chain reaction; SEM: standard error of mean; TEM: transmission electron microscopy
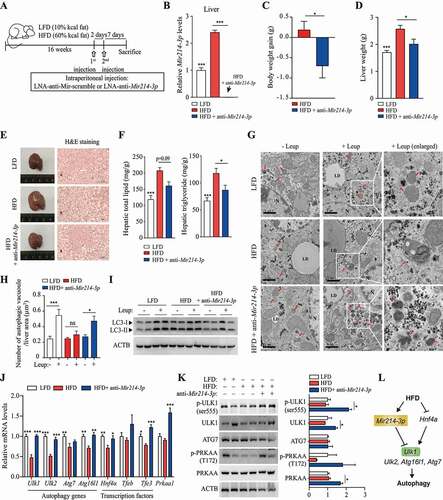
To investigate whether inhibition of Mir214-3p increases autophagic activity, autophagosome formation was observed using TEM. No significant difference was observed in the number of autophagic vacuoles in the HFD and LFD groups. However, the inhibition of lysosomal proteolysis by treatment with leupeptin, which inhibits Ctsb [Citation41,Citation42], significantly increased the number of autophagic vacuoles in the LFD group, but not in the HFD group (). Autophagosome aggregation was induced in the LFD group by leupeptin treatment, confirming the inhibitory effects of leupeptin on lysosomal proteolysis. In the Mir214-3p inhibited HFD group, leupeptin treatment caused the number of autophagic vacuoles to increase. Thus, Mir214-3p inhibition restored autophagic activity and autophagosome formation in the HFD group. Further, leupeptin treatment did not cause LC3-II protein levels to be higher in the HFD group than in the LFD group; however, treatment with anti-Mir214-3p did cause this (). This is consistent with the results of the IF analysis (Fig. S5C). Thus, autophagosome formation was inhibited in the HFD group and was restored by Mir214-3p inhibition. Further, we examined the effects of inhibition of Mir214-3p levels on hepatic steatosis and regulation of autophagy-related and lipid metabolism-related genes. Inhibition of Mir214-3p caused the higher expression of Ppara (peroxisome proliferator activated receptor alpha), a beta oxidation-related gene, in the HFD group. However, following inhibition of Mir214-3p, the expression of lipogenesis-related genes did not differ significantly different between the LFD and HFD groups (Fig. S5D and S5E).
To investigate the mechanism underlying the increase in autophagic activity by inhibition of Mir214-3p, we measured the expression of autophagy-related genes, which was significantly reduced in HFD-fed mice. The levels of Ulk1, Ulk2, Atg7, and Atg16l1 mRNA were significantly lower in the HFD group than in the LFD group, and the expression of these genes was restored by the inhibition of Mir214-3p expression (). Expression of Hnf4a, Tfeb, and Tfe3 was reduced by HFD but was significantly increased by Mir214-3p inhibition (). ULK1 protein levels were also restored by Mir214-3p knockdown (). The results of the IF analysis revealed that, although ULK1 protein levels had decreased in the fatty livers of HFD-fed mice, they had increased in the fatty livers of Mir214-3p-knockdown mice (Fig. S5F). Interestingly, inhibition of Mir214-3p increased mRNA levels of Prkaa1 and restored the phosphorylation of PRKAA/AMPKα in hepatic steatosis to levels found in the livers of LFD-fed mice (). The inhibition of Mir214-3p also insignificantly upregulated the expression and phosphorylation of PRKAA in hepatocytes, whereas compound C, an AMPK inhibitor, inhibited only the phosphorylation of PRKAA, without affecting its expression (Fig. S5G). Phosphorylation of PRKAA was slightly reduced in Mir214-3p mimic-transfected cells, whereas AICAR, an AMPK activator, increased PRKAA phosphorylation (Fig. S5H). However, relative to the negative control, Mir214-3p levels did not respond significantly to the AMPK activity regulator. Conversely, modulation of AMPK expression or activity did not alter Mir214-3p levels (Fig. S5I and S5J). This suggests the regulation of AMPK by Mir214-3p; however, further investigation is needed. Thus, Mir214-3p knockdown increased autophagic activity by increasing the expression of the autophagy-related genes (especially Ulk1) and Hnf4α indirectly, thereby ameliorating hepatic steatosis ().
Ulk1, a target of Mir214-3p, is a key positive regulator in ameliorating fatty liver
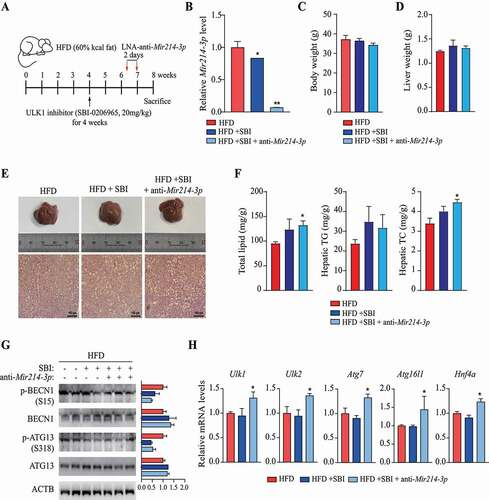
To determine whether the amelioration of fatty liver by suppressing Mir214-3p is induced by an increase in Ulk1 expression, we examined the effects of inhibition of ULK1 and Mir214-3p on fatty liver in mice. The mice were fed 60 kcal% HFD to induce fatty liver, and SBI-0206965, a ULK1 inhibitor, was administered intraperitoneally to suppress ULK1 activity. Two weeks before the sacrifice, LNA-anti-Mir214-3p was administered intraperitoneally to the mice in which ULK1 activity was inhibited (). The levels of Mir214-3p in the liver were significantly reduced by the administration of LNA-anti-Mir214-3p (HFD+SBI+anti-Mir214-3p); compared to the control (HFD) group, Mir214-3p levels were also reduced in the HFD+SBI group that was treated with the ULK1 inhibitor (). Inhibition of ULK1 and Mir214-3p expression did not significantly affect the final body weight (), and the liver weight was also slightly increased in both the HFD+SBI and HFD+SBI+anti-Mir214-3p groups (). Interestingly, staining of liver tissue with hematoxylin and eosin showed that inhibition of ULK1 activity increased lipid accumulation in the liver; this increase was not reversed by suppression of Mir214-3p (). Indeed, the lipid content in the liver tissue had increased in all of the groups in which ULK1 was inhibited, and the administration of LNA-anti-Mir214-3p did not decrease the lipid content (). These results indicate that although the Mir214-3p levels were suppressed, no amelioration of the fatty liver was observed under inhibition of ULK1 activity. We confirmed that the phosphorylation of BECN1/Beclin1 (S15) and ATG13 (S318) by ULK1 was lower in the groups treated with the ULK1 inhibitor, which may have led to the suppression of autophagic activity (). The mRNA levels of Mir214-3p target genes were not regulated by ULK1 inhibition and were significantly increased by LNA-anti-Mir214-3p administration (). Taken together, these results suggest that Ulk1 is an important regulator of autophagic flux to alleviate fatty liver, and suppression of Mir214-3p levels could mitigate hepatic steatosis by increasing Ulk1 expression.
Figure 6. Regulation of Ulk1 expression by Mir214-3p is important for the mitigation of hepatic steatosis. (A) Scheme of in vivo experiments. To induce nonalcoholic fatty liver, mice were fed 60 kcal% HFD. At 4 weeks, SBI-0206965 (ULK1 inhibitor) was injected intraperitoneally to reduce ULK1 activity, and LNA-anti-Mir214-3p was administered twice after 2 weeks. (B) Relative Mir214-3p levels in the liver tissue. These levels were measured 1 week after the final anti-Mir214-3p administration. (C) Final body weight. (D) Liver weight. (E) Representative images of H&E-stained liver section. Scale bar: 100 μm (F) Total hepatic lipid, triglyceride (TG), and total cholesterol (TC) levels. (G) Protein production from autophagy-related genes in the liver. Levels of proteins phosphorylated by ULK1 to induce autophagy were measured in the liver. (H) mRNA levels of autophagy genes targeted by Mir214-3p. Values represent mean ± SEM. * p < 0.05; ** p < 0.01. BECN1: beclin 1; H&E: hematoxylin and eosin; HFD: high-fat diet; LNA: locked nucleic acid; SEM: standard error of mean
Discussion
Autophagy is a self-degradative process that engulfs cytosolic components by the formation of a double-membrane vesicle (autophagosome) and degrades these engulfed components with the help of lysosomal enzymes [Citation43,Citation44]. Lipophagy, which selectively degrades excessive levels of LDs, has a protective function in NAFLD. The mechanisms of autophagy or lipophagy in NAFLD have been studied extensively but remain unclear and controversial. Therefore, we investigated autophagy flux and its mechanism in HFD-induced hepatic steatosis. To examine the autophagy flux according to the stage of steatosis, we fed an HFD to mice for 5, 10, and 20 weeks, resulting in a severe fatty liver status in the 20-week HFD-fed mice. Although the LC3-II protein levels were higher in the 5-week HFD group, they did not increase in the 10- and 20-week HFD groups after treatment with the protease inhibitor leupeptin. These results indicate the inhibition of the fusion of the autophagosome with the lysosome; hence, we measured the protein levels and activity of CTSB and CTSL, both lysosomal proteases. An increase was observed in the protein levels and activity of CTSB, but not of CTSL, in the HFD-fed group compared to those of the LFD-fed group. These results are different from the findings of previous reports [Citation8,Citation45], which show that the autophagosome-lysosome fusion is inhibited by a change in the intercellular lipid content and that CTSB and CTSL levels decrease after feeding with HFD. However, autophagy flux cannot be considered defective without an accurate analysis of other lysosomal markers. We found that the number of autophagic vacuoles was reduced in the 20-week HFD group, and that LC3 levels had also decreased, as shown in the immunohistochemistry and IF analyses, suggesting that autophagic activity was reduced by long-term HFD feeding.
Several studies have reported that autophagic activity is decreased in NAFLD [Citation15,Citation46], and that hepatic steatosis is accelerated by a deficiency of autophagy-related gene expression [Citation2,Citation12]. This decrease in autophagic activity is mainly attributed to an increase in MTOR activity due to excessive nutrient levels [Citation47] and a blockade of autophagosome-lysosome fusion because of a decrease in lysosomal activity [Citation8,Citation10,Citation11]. Furthermore, autophagic activity was reduced due to the suppression of autophagy-related gene expression by long-term HFD feeding [Citation48]. Hepatic autophagy is inhibited by a decrease in autophagy-related gene expression (such as that of Atg5 and Atg7) in diet-induced obese mice [Citation15]. Autophagy is regulated at transcriptional, post-transcriptional, and post-translational levels in yeast and mammals [Citation49]. At the transcriptional level, autophagy is regulated by several transcription factors that typically belong to the Tfeb and Foxo families [Citation15]. Therefore, we examined the expression of autophagy-related genes in fatty liver tissue and found that the expression of Ulk1, Ulk2, Atg7, and Atg16l1 was significantly reduced in the HFD-fed groups compared to that of the LFD-fed groups. Thus, the decrease in autophagic activity in HFD-induced fatty liver is probably more attributable to reduced autophagy-related gene expression than to reduced lysosomal activity.
In this study, we found that Mir214-3p modulated the protein levels of ULK1 and LC3 in hepatocytes. We subsequently investigated the mode of inhibition of Ulk1 by Mir214-3p and used a luciferase reporter assay to determine that Mir214-3p inhibited Ulk1 expression by binding directly to the Ulk1 gene. Previous reports have described the role of Mir214 in cancers such as melanoma [Citation50], breast cancer [Citation51], and hepatocellular carcinoma [Citation52,Citation53]. Mir214 regulates hepatic gluconeogenesis by targeting Atf4 [Citation54], and promotes cancer progression by targeting Atg12; however, its roles in hepatic lipid metabolism and autophagy-related gene regulation are unclear [Citation55]. Our results suggest that Mir214-3p suppressed autophagic activity by reducing Ulk1 expression through direct binding to its 3′ UTR sequence in fatty liver cells.
We examined TFs as regulatory factors in fatty liver tissue and found a significant increase in Atf3 mRNA, but a decrease in Hnf4a mRNA levels. Hnf4a is essential for hepatocyte differentiation and plays an important role in liver function [Citation56,Citation57]. Deficiency of Hnf4a in the liver disrupts lipid homeostasis by dysregulation of lipid-metabolism-related genes [Citation58]. Hnf4a expression is reduced by increased Mir34a levels in NAFLD [Citation59], but its association with autophagy has not been investigated. Tfeb, which is known to regulate genes related to lysosomal biogenesis and autophagy, such as Ctsb, Lamp1 (lysosomal-associated membrane protein 1), Map1lc3b, and Uvrag [Citation35], did not show any significant decrease in expression in this study. However, Tfe3, another TF belonging to the microphthalmia/TFE sub-family [Citation60] that regulates lysosomal biogenesis along with Tfeb [Citation40], showed a significant decrease in expression in our study. This decrease in Tfeb and Tfe3 mRNA levels might have been linked to the suppression of autophagy-related gene expression in previous reports, but Tfeb and Tfe3 did not regulate the expression of Ulk1 in this study. Our data show that the expression of Ulk1 was decreased in Hnf4a-silenced hepatocytes, whereas overexpression of Hnf4a increased Ulk1 mRNA and protein levels. HNF4A bound to a specific site of Ulk1 DNA (−1643/-1534), and the expression of Ulk1 was directly regulated by Hnf4a. We found that the mRNA and protein levels of Atg7 also increased in Hnf4a-overexpressing cells. However, according to the TF binding site-prediction software (PROMO v3.0.2), Ulk1 is directly regulated by HNF4A binding to its promoter region, whereas Atg7 does not have an HNF4A binding site in its promoter/enhancer region. In addition, as Atg7 expression was not regulated in Hnf4a-silenced hepatocytes, the change in its expression might be a result of indirect regulation by Hnf4a overexpression.
We examined the regulation of Hnf4a and Ulk1 expression by Mir214-3p and found a negative correlation between inhibition of Mir214-3p and Hnf4a expression. However, there was no change in Hnf4a levels in Mir214-3p-overexpressing cells, and no evidence of direct binding of Mir214-3p to Hnf4a. Expression of Hnf4a was regulated by Mir214-3p levels; however, Hnf4a expression was not reversed when we lowered or raised the expression of Mir214-3p and Hnf4a at the same time. These results suggest that the reduction in Ulk1 expression in fatty liver tissue was caused by the increased expression of Mir214-3p and decreased Hnf4a expression. Thus, both Mir214-3p and Hnf4a act as regulatory factors of Ulk1 expression, although they act independently of each other.
We investigated the effects of inhibition of Mir214-3p expression on hepatic steatosis. We found that hepatic steatosis was alleviated by reducing lipid accumulation in the livers of LNA-anti-Mir214-3p-treated mice. Consistently, we found that oleic acid-induced lipid accumulation was reduced in hepatocytes in which Mir214-3p was suppressed (Fig. S6A and S6B).
To further assess whether this alleviation of fatty liver disease is associated with the autophagic activity, we measured autophagosome formation in the presence of leupeptin. Even with leupeptin treatment, autophagosome accumulation was not observed in the fatty livers of HFD-fed mice, whereas it was observed in those of LFD-fed mice. However, Mir214-3p inhibition increased autophagosome accumulation in the HFD group, which was confirmed by the increase in LC3-II protein levels. Next, we studied the effects of Mir214-3p on the expression of Ulk1 and found that mRNA levels of Ulk1 were significantly increased in the fatty liver tissue of Mir214-3p-knockdown mice. These results demonstrate that Mir214-3p mitigates fatty liver by activating autophagy.
In addition, mRNA levels of autophagy-related gene-regulating TFs, Tfeb and Tfe3, as well as of Prkaa1, a nutrient sensor, were also significantly increased in Mir214-3p-knockdown group. Interestingly, inhibition of Mir214-3p expression increased PRKAA phosphorylation and AMPK-dependent phosphorylation of ULK1 at serine 555. As AMPK complex plays a critical role in lipid metabolism and inflammatory signaling in the liver, its activator has been found to ameliorate NAFLD [Citation61,Citation62]. Given that PRKAA regulates MIR214-3p levels [Citation63], we investigated the interplay between Mir214-3p and PRKAA, but we did not find any clear association. Thus, in this study, the increase in phosphorylation of PRKAA upon inhibition of Mir214-3p was considered to be an effect of the amelioration of fatty liver.
In Mir214-3p-knockdown mice, mRNA levels of Ulk2, Atg16l1, and Atg7 genes were also restored after being lowered by HFD. Because we found that Mir214-3p directly bound to these genes in a luciferase assay, we investigated the effects of Mir214-3p suppression on Ulk1 regulation in the fatty liver.
Previous studies have shown that liver-specific depletion of Ulk1 induces hepatic steatosis [Citation64,Citation65]. Indeed, we confirmed that lipid accumulation was notably increased in the livers of mice treated with a ULK1 inhibitor. Our results also show that LC3 puncta formation was reduced, and lipid droplets were increased in cells where Ulk1 was depleted (Fig. S6C), indicating that Ulk1 negatively regulates lipid accumulation in hepatocytes. However, inhibition of Mir214-3p expression did not alleviate fatty liver in ULK1-inhibited mice, suggesting that Mir214-3p can regulate the expression of autophagy genes, such as Ulk2, Atg16l1, and Atg7, through direct binding, but that it reduces lipid accumulation by specific regulation of Ulk1 in the fatty liver.
Further study is needed because of the relatively small sample size of human tissue samples in this study, and because hepatocellular carcinoma can affect some outcomes. However, the findings of this study with respect to the mechanism of autophagy in NAFLD are valuable.
Taken together, our results indicate that inhibition of Mir214-3p upregulated Ulk1 expression, leading to increased autophagic activity and the alleviation of fatty liver disease. Thus, our study presents evidence of Mir214-3p as a potential therapeutic target for NAFLD.
Materials and methods
Antibodies
Antibodies against CTSB/cathepsin B (sc-13985), CTSL/cathepsin L (sc-390385), SQSTM1/p62 (sc-28359), BECN1/Beclin1 (sc-11427), and ACTB/β–actin (sc-47778) were purchased from Santa Cruz Biotechnology. Antibodies against LC3B (2775), ATG12 (4180), p-PRKAA/AMPKα (2535), PRKAA/AMPKα (2793), p-BECN1/Beclin1 (84966), and ATG13 (13273) were purchased from Cell Signaling Technology. The antibody against ULK1 (A7481), leupeptin (L2884), and chloroquine (C6628) were purchased from Sigma Chemical Co. The antibody against p-ULK1 (phospho-Ser556, OABF01248) was purchased from Aviva Systems Biology. The antibody against ATG16L1 (PM040) was purchased from MBL International Corporation. Antibodies against ATG5 (NB110-53818) and GABARAP (NBP1-71771) were purchased from Novus Biologicals. Antibodies against ATG7 (ab133528) and HNF4A/Hnf4α (ab41898) were purchased from Abcam, and the antibody against PIK3C3 (QD218529) was purchased from Thermo Fisher Scientific. The antibody against p-ATG13 (PAB19948) was purchased from Abnova.
Animals
Four-week-old male C57BL/6J mice were purchased from Japan SLC Inc. (Hamamatsu, C57BL/6JJmsSlc). Animal studies were performed in accordance with national and institutional guidelines, and all experimental procedures were approved by the Korea Food Research Institute Animal Care and Use Committee (KFRI-M-16054). The main experimental diets were based on the AIN-76A diet, which contained 45% fat and 0.5% cholesterol (w:w). The composition of the diet is shown in Table S1. After feeding the experimental diets for 5, 10, or 20 weeks, mice were sacrificed by cervical dislocation under anesthesia (isoflurane with 2% oxygen).
LNA-anti-Mir214-3p administration
Four-week-old male C57BL/6J mice were purchased from Orient Bio (Gyeonggi-do, 000664). Animal studies were conducted in accordance with institutional and national guidelines, and all experimental procedures were approved by the Korea Food Research Institute Animal Care and Use Committee (KFRI-M-18035). After acclimation for a week, mice were fed a low-fat diet (LFD; Research Diets, D12450B) containing 10 kcal% fat or a high-fat diet (HFD; Research Diets, D12492) containing 60 kcal% fat. After consuming the diets for 16 weeks, mice were injected with 5 mg/kg custom-made miRCURY locked nucleic acid (LNA) scramble or LNA targeting Mir214-3p (Qiagen) intraperitoneally. The mice were injected twice at two-day intervals and sacrificed under anesthesia (isoflurane with 2% oxygen) 1 week after LNA administration.
ULK1 inhibitor in vivo experiment
Mice were fed with high-fat diet (60 kcal% fat diet) for 4 weeks. Mice were then divided into three groups; Control (HFD), HFD + ULK1 inhibitor (SBI-0206965; Cayman Chemical Company, 18477), HFD + SBI-0206965 + LNA-anti-Mir214-3p. ULK1 inhibitor SBI-0206965 was dissolved in dimethyl sulfoxide (100 mg/ml; Sigma Chemical Co., D4540) and then diluted in 5% PEG (Sigma Chemical Co., P3015), 5% Tween-80 (Sigma Chemical Co., P1754) to appropriate concentration (6 mg/ml). The mice in each group were intraperitoneally injected with the vehicle or SBI-0206965 (20 mg/kg for ULK1 inhibitor groups) for 4 weeks. Two weeks before sacrifice, the LNA-scramble construct or LNA-anti-Mir214-3p (Qiagen, custom-made for this project) was injected intraperitoneally twice at two-day intervals.
Human tissue samples
Samples of human fatty liver tissue (n = 6) and the adjacent normal liver tissue (n = 5) were collected from hepatocellular carcinoma patients undergoing liver resection at the Gachon Medical University. The lipid content and GOT1 and GPT levels of the samples are shown in Table S2. This study was approved by the Ethics Committee of Gachon University Gil Medical Center (GCIRB2016-277), and informed consent was obtained from all individuals.
Measurement of serum lipids
Serum was separated from whole blood by centrifuging at 1,000 × g for 20 min. Serum total cholesterol, triglyceride, high-density lipoprotein, GPT, and GOT1 were measured using enzymatic commercial kits (Shinyang Chemical Co., Ltd., 20186, 20267, 20081, A302, and A301, respectively), according to the manufacturer’s protocols.
Measurement of hepatic lipids
Folch’s method was used to extract hepatic lipids [Citation66]. The liver tissues were homogenized using 0.9% (w:v) sodium chloride and incubated overnight in a 2:1 chloroform-methanol mixture (v:v) at 4°C. The extracted hepatic lipid was analyzed using enzymatic commercial kits, using the same method used for serum lipid measurement (Shinyang Chemical Co., Ltd.).
Cell culture
Hepa 1–6 cells were purchased from American Type Culture Collection (ATCC, CRL-1830) and cultured in Dulbecco’s modified Eagle medium (Hyclone, SH30022.01) containing 10% fetal bovine serum (Gibco, 16140071), 100 U/mL penicillin, and 100 µg/mL streptomycin (Gibco, 15140122) in a 5% CO2 incubator at 37°C.
Gene expression analysis
Total RNA was extracted from liver tissues using an RNeasy mini kit (Qiagen, 74106), and cDNA was synthesized using a reverse transcription kit (RT2 First Strand Kit; Qiagen, 330401). Quantitative PCR (qPCR) was performed using RT2 qPCR SYBR Green/ROX MasterMix (Qiagen, 330520) and an RT2 profiler PCR array kit (Qiagen, PAMM-084ZE-1 for autophagy-related genes, PAMM-075ZE-1 for transcription factors).
TaqMan low-density arrays (TLDAs)
The cDNA was synthesized from total RNA using Megaplex RT primer Rodent A Pool (Applied Biosystems, 4399970) and TaqMan™ MicroRNA Reverse Transcription Kit (Applied Biosystems, 436659), according to the manufacturer’s instructions. The synthesized cDNA was pre-amplified using Megaplex PreAmp Primers Rodent Pool A (Applied Biosystems, 4399203) and Megaplex PreAmp Master Mix (Applied Biosystems, PN4384267). qPCR was performed using TaqMan™ Rodent MicroRNA Array (Applied Biosystems, 4398967).
Reverse transcription polymerase chain reaction (RT-PCR)
The cDNA was synthesized from total RNA using the ReverTra AceTM qPCR RT Kit (Toyobo, FSQ-201) for quantifying mRNA or TaqMan™ MicroRNA Reverse Transcription Kit (Applied Biosystems, 4366597) for quantifying miRNA. qRT-PCR was performed to quantify mRNA using SYBR Green Real-time PCR Master Mix (Toyobo, TOQPK-201), with the following conditions: pre-denaturation at 95°C for 1 min, followed by 40 cycles of 95°C for 15 s, 60°C for 15 s, and 75°C for 45 s. The specific primer sequences are given in Table S3. To quantify miRNA, qRT-PCR was conducted using TaqMan™ Universal Master Mix II (Applied Biosystems, 4440040) on a ViiATM 7 Real-Time PCR system (Applied Biosystems), as follows: 50°C for 2 min and 95°C for 10 min, followed by 40 cycles of 95°C for 15 s and 60°C for 1 min. The TaqMan probes (Thermo Fisher Scientific) used in the experiment are shown in Table S4.
Western blot analysis
Hepatocytes and liver tissues were lysed in radioimmunoprecipitation assay buffer supplemented with protease- and phosphatase-inhibitor cocktails (Thermo Fisher Scientific, 78440). The extracted proteins were separated by sodium dodecyl sulfate-polyacrylamide gel electrophoresis based on mass and transferred to polyvinylidene fluoride membranes (Bio-Rad, 1620174). The membranes were blocked with 5% skim milk and subsequently incubated with primary and secondary antibodies. The protein levels were visualized using a chemiluminescence reagent.
Transmission electron microscopy (TEM)
Liver tissue was fixed immediately in 2% glutaraldehyde and 2% paraformaldehyde in 0.1 M phosphate-buffered saline (PBS, pH 7.4; Thermo Fisher Scientific, 10010072). After washing with PBS, the tissues were post-fixed with 1% osmium tetroxide (Electron Microscopy Sciences, 19152) and washed again with PBS. The tissues were then embedded in pure Epon 812 mixture after dehydration in a series of ethanol:water mixtures and following infiltration in a series of propylene oxide:epon mixtures. Ultrathin sections (~70 nm) were obtained using a model MT-X ultramicrotome (RMC, Tucson, AZ, USA) and then collected on 100 mesh copper grids. After staining with 2% uranyl acetate (7 min) and lead citrate (2 min), the sections were visualized by Cryo-TEM (JEM-1400 Plus, 120 kV) and Bio-HVEM (JEM-1000 BEF, 1000 kV) (Jeol, Japan).
Transfection
Hepa 1–6 cells were transfected with the miRNA inhibitors, mimics, or siRNAs using Lipofectamine 2000 (Thermo Fisher Scientific, 11668019). At 48 h post-transfection, total RNA was extracted from the cells to measure the expression of the target genes. These oligonucleotides are shown in Table S5.
Dual-luciferase reporter assay
The Ulk1 3′ UTR (GeneCopoeia, MmiT028479-MT05) containing the putative or mutated Mir214-3p binding sites, or Hnf4a (GeneCopoeia, MmiT092779-MT05), were cloned into the Gaussia (GLuc)-secreted alkaline phosphatase (SEAP) luciferase reporter plasmid. The constructs were co-transfected with Mir214-3p mimic or anti-Mir214-3p for 48 h. At 48 h post-transfection, the GLuc and SEAP luciferase activity were measured in the media, and the results were normalized to SEAP activity.
Chromatin immunoprecipitation (ChIP) assay
Hepa 1–6 cells were treated with formaldehyde at a final concentration of 1% for 10 min. After 10 min, glycine was added to stop the reaction, and the cells were washed with PBS and scraped. The ChIP assay was performed using an agarose ChIP kit (Thermo Fisher Scientific, 26156) according to the manufacturer’s instructions. RT-PCR was performed for quantification of protein-bound DNA. The following primers were used in RT-PCR (5′-3′): forward AACTGCCGGCTAGAAGGAAT and reverse GCGGGTTTGTTTGTTGACAT [Citation67]. These primers were designed for the Ulk1 promoter fragment using Primer3, and those showing the greatest enrichment for Ulk1 were selected as primers.
Histological analysis
Liver tissues were fixed in 4% formaldehyde, embedded in paraffin, and cut into sections 5 µm thick. The sections were stained with hematoxylin and eosin and their morphology was evaluated using an Olympus TH4-200 microscope (Olympus).
Immunohistochemistry of LC3
Endogenous peroxidase activity of liver tissues fixed in 4% formaldehyde was inhibited by incubating with 0.3% hydrogen peroxide (Sigma-Aldrich., 216763) in PBS and the tissues were blocked with 1% horse serum (Sigma-Aldrich, H0146), before incubation with the LC3 antibody. LC3 was visualized using a diaminobenzidine (Sigma-Aldrich, D12384) solution, and the slides with the fixed tissues were mounted and examined under Olympus TH4-200 microscope (Japan).
Immunofluorescence analysis of LC3 and ULK1
Frozen liver tissue was sectioned and fixed in 10% formalin. The fixed tissues were blocked with 2% horse serum and then incubated with the LC3 or ULK1 antibody overnight at 4°C. After incubation, the sections were incubated with Alexa Fluor 488 (Abcam, ab150077) for 60 min at room temperature and mounted with fluorescence mounting medium (Dako, S3025). LC3 or ULK1 was detected with a confocal microscope (Nikon ECLIPSE TI/C1, Tokyo, Japan).
Statistical analysis
Differences between groups were analyzed by one-way analysis of variance using Tukey’s post-hoc correction for multiple comparisons using Prism 7 software (GraphPad Software, San Diego, CA, USA). These statistical results are expressed as the mean ± standard deviation (SD) or standard error of the mean (SEM). P < 0.05 was considered statistically significant.
Supplemental Material
Download MS Word (6.9 MB)Disclosure statement
No potential conflict interest was reported by the authors.
Supplementary material
Supplemental data for this article can be accessed here.
Supplementary material
Supplemental data for this article can be accessed here.
Additional information
Funding
Related Research Data
References
- Fimia GM, Kroemer G, Piacentini M. Molecular mechanisms of selective autophagy. Cell Death Differ. 2013 Jan;20(1):1–2.
- Singh R, Kaushik S, Wang Y, et al. Autophagy regulates lipid metabolism. Nature. 2009 Apr 30;458(7242):1131–1135.
- Hardy T, Oakley F, Anstee QM, et al. Nonalcoholic fatty liver disease: pathogenesis and disease spectrum. Annu Rev Pathol. 2016 May 23;11:451–496.
- Streba LA, Vere CC, Rogoveanu I, et al. Nonalcoholic fatty liver disease, metabolic risk factors, and hepatocellular carcinoma: an open question. World J Gastroenterol. 2015 Apr 14;21(14):4103–4110.
- Araujo AR, Rosso N, Bedogni G, et al. Global epidemiology of non-alcoholic fatty liver disease/non-alcoholic steatohepatitis: what we need in the future. Liver Int. 2018 Feb;38(Suppl 1):47–51.
- Tong L, Wang L, Yao S, et al. PPARdelta attenuates hepatic steatosis through autophagy-mediated fatty acid oxidation. Cell Death Dis. 2019 Feb 27;10(3):197.
- Mao Y, Yu F, Wang J, et al. Autophagy: a new target for nonalcoholic fatty liver disease therapy. Hepat Med. 2016;8:27–37.
- Koga H, Kaushik S, Cuervo AM. Altered lipid content inhibits autophagic vesicular fusion. Faseb J. 2010 Aug;24(8):3052–3065.
- Tanaka S, Hikita H, Tatsumi T, et al. Rubicon inhibits autophagy and accelerates hepatocyte apoptosis and lipid accumulation in nonalcoholic fatty liver disease in mice. Hepatology. 2016 Dec;64(6):1994–2014.
- Wang X, Zhang X, Chu ESH, et al. Defective lysosomal clearance of autophagosomes and its clinical implications in nonalcoholic steatohepatitis. The FASEB Journal. 2018 Jan;32(1):37–51. .
- Fukuo Y, Yamashina S, Sonoue H, et al. Abnormality of autophagic function and cathepsin expression in the liver from patients with non-alcoholic fatty liver disease. Hepatol Res. 2014 Sep;44(9):1026–1036. .
- Ma D, Molusky MM, Song J, et al. Autophagy deficiency by hepatic FIP200 deletion uncouples steatosis from liver injury in NAFLD. Mol Endocrinol (Baltimore, Md). 2013 Oct;27(10):1643–1654. .
- Xiong X, Tao R, DePinho RA, et al. The autophagy-related gene 14 (Atg14) is regulated by forkhead box O transcription factors and circadian rhythms and plays a critical role in hepatic autophagy and lipid metabolism. J Biol Chem. 2012 Nov 9;287(46):39107–39114.
- Kim KH, Jeong YT, Oh H, et al. Autophagy deficiency leads to protection from obesity and insulin resistance by inducing Fgf21 as a mitokine. Nat Med. 2013 Jan;19(1):83–92.
- Yang L, Li P, Fu S, et al. Defective hepatic autophagy in obesity promotes ER stress and causes insulin resistance. Cell Metab. 2010 Jun 9;11(6):467–478.
- Jung CH, Ro SH, Cao J, et al. mTOR regulation of autophagy. FEBS Lett. 2010 Apr 2;584(7):1287–1295.
- Kim J, Kundu M, Viollet B, et al. AMPK and mTOR regulate autophagy through direct phosphorylation of Ulk1. Nat Cell Biol. 2011 Feb;13(2):132–141.
- Fullgrabe J, Klionsky DJ, Joseph B. The return of the nucleus: transcriptional and epigenetic control of autophagy. Nat Rev Mol Cell Biol. 2014 Jan;15(1):65–74.
- Hobert O. Gene regulation by transcription factors and microRNAs. Science (New York, NY). 2008 Mar 28;319(5871):1785–1786.
- Winter J, Jung S, Keller S, et al. Many roads to maturity: microRNA biogenesis pathways and their regulation. Nat Cell Biol. 2009 Mar;11(3):228–234.
- Macfarlane LA, Murphy PR. MicroRNA: biogenesis, function and role in cancer. Curr Genomics. 2010 Nov;11(7):537–561.
- Alvarez-Garcia I, Miska EA. MicroRNA functions in animal development and human disease. Development. 2005 Nov;132(21):4653–4662.
- Yang Y, Liang C. MicroRNAs: an emerging player in autophagy. Sci Open Res. 2015;2015. doi:https://doi.org/10.14293/S2199-1006.1.SOR-LIFE.A181CU.v1
- Willeit P, Skroblin P, Kiechl S, et al. Liver microRNAs: potential mediators and biomarkers for metabolic and cardiovascular disease? Eur Heart J. 2016 Nov 14;37(43):3260–3266.
- Ji J, Zhang J, Huang G, et al. Over-expressed microRNA-27a and 27b influence fat accumulation and cell proliferation during rat hepatic stellate cell activation. FEBS Lett. 2009 Feb 18;583(4):759–766.
- Ng R, Wu H, Xiao H, et al. Inhibition of microRNA-24 expression in liver prevents hepatic lipid accumulation and hyperlipidemia. Hepatology. 2014 Aug;60(2):554–564.
- Brandt S, Roos J, Inzaghi E, et al. Circulating levels of miR-122 and nonalcoholic fatty liver disease in pre-pubertal obese children. Pediatr Obes. 2018 Mar;13(3):175–182.
- Hanin G, Yayon N, Tzur Y, et al. miRNA-132 induces hepatic steatosis and hyperlipidaemia by synergistic multitarget suppression. Gut. 2018;67(6):1124–1134.
- Ding J, Li M, Wan X, et al. Effect of miR-34a in regulating steatosis by targeting PPARalpha expression in nonalcoholic fatty liver disease. Sci Rep. 2015 Sep 2;5:13729.
- Stacchiotti A, Grossi I, García-Gómez R, et al. Melatonin effects on non-alcoholic fatty liver disease are related to MicroRNA-34a-5p/Sirt1 axis and autophagy. Cells. 2019;8(9):1053.
- Ghareghani P, Shanaki M, Ahmadi S, et al. Aerobic endurance training improves nonalcoholic fatty liver disease (NAFLD) features via miR-33 dependent autophagy induction in high fat diet fed mice. Obes Res Clin Pract. 2018 Jan-Feb;12(Suppl 2):80–89.
- Mullany LE, Herrick JS, Wolff RK, et al. MicroRNA-transcription factor interactions and their combined effect on target gene expression in colon cancer cases. Genes Chromosomes Cancer. 2018 Apr;57(4):192–202.
- Yan Z, Shah PK, Amin SB, et al. Integrative analysis of gene and miRNA expression profiles with transcription factor-miRNA feed-forward loops identifies regulators in human cancers. Nucleic Acids Res. 2012 Sep 1;40(17):e135.
- Todeschini AL, Georges A, Veitia RA. Transcription factors: specific DNA binding and specific gene regulation. Trends Genet. 2014 Jun;30(6):211–219.
- Settembre C, Di Malta C, Polito VA, et al. TFEB links autophagy to lysosomal biogenesis. Science (New York, NY). 2011 Jun 17;332(6036):1429–1433.
- Fullgrabe J, Ghislat G, Cho DH, et al. Transcriptional regulation of mammalian autophagy at a glance. J Cell Sci. 2016 Aug 15;129(16):3059–3066.
- Shibata M, Yoshimura K, Furuya N, et al. The MAP1-LC3 conjugation system is involved in lipid droplet formation. Biochem Biophys Res Commun. 2009;382(2):419–423.
- Bartel DP. MicroRNAs: genomics, biogenesis, mechanism, and function. Cell. 2004;116(2):281–297.
- Duan X, Zhang T, Ding S, et al. microRNA-17-5p modulates bacille calmette-guerin growth in RAW264.7 cells by targeting ULK1. PloS One. 2015;10(9):e0138011.
- Martina JA, Diab HI, Lishu L, et al. The nutrient-responsive transcription factor TFE3 promotes autophagy, lysosomal biogenesis, and clearance of cellular debris. Sci Signal. 2014;7(309):ra9–ra9.
- Kominami E, Hashida S, Khairallah EA, et al. Sequestration of cytoplasmic enzymes in an autophagic vacuole-lysosomal system induced by injection of leupeptin. J Biol Chem. 1983;258(10):6093–6100.
- Haspel J, Shaik RS, Ifedigbo E, et al. Characterization of macroautophagic flux in vivo using a leupeptin-based assay. Autophagy. 2011;7(6):629–642.
- Mizushima N. Autophagy: process and function. Genes Dev. 2007 Nov 15;21(22):2861–2873.
- Glick D, Barth S, Macleod KF. Autophagy: cellular and molecular mechanisms. J Pathol. 2010 May;221(1):3–12.
- Inami Y, Yamashina S, Izumi K, et al. Hepatic steatosis inhibits autophagic proteolysis via impairment of autophagosomal acidification and cathepsin expression. Biochem Biophys Res Commun. 2011 Sep 9;412(4):618–625.
- Czaja MJ. Function of autophagy in nonalcoholic fatty liver disease. Dig Dis Sci. 2016 May;61(5):1304–1313.
- Han J, Wang Y. mTORC1 signaling in hepatic lipid metabolism. Protein Cell. 2018 Feb;9(2):145–151.
- Zhang H, Yan S, Khambu B, et al. Dynamic MTORC1-TFEB feedback signaling regulates hepatic autophagy, steatosis and liver injury in long-term nutrient oversupply. Autophagy. 2018;14(10):1779–1795.
- Feng Y, Yao Z, Klionsky DJ. How to control self-digestion: transcriptional, post-transcriptional, and post-translational regulation of autophagy. Trends Cell Biol. 2015 Jun;25(6):354–363.
- Penna E, Orso F, Cimino D, et al. microRNA-214 contributes to melanoma tumour progression through suppression of TFAP2C. Embo J. 2011 May 18;30(10):1990–2007.
- Schwarzenbach H, Milde-Langosch K, Steinbach B, et al. Diagnostic potential of PTEN-targeting miR-214 in the blood of breast cancer patients. Breast Cancer Res Treat. 2012 Aug;134(3):933–941.
- Okada H, Honda M, Campbell JS, et al. Inhibition of microRNA-214 ameliorates hepatic fibrosis and tumor incidence in platelet-derived growth factor C transgenic mice. Cancer Sci. 2015 Sep;106(9):1143–1152.
- Penna E, Orso F, Taverna D. miR-214 as a key hub that controls cancer networks: small player, multiple functions. J Invest Dermatol. 2015 Apr;135(4):960–969.
- Li K, Zhang J, Yu J, et al. MicroRNA-214 suppresses gluconeogenesis by targeting activating transcriptional factor 4. J Biol Chem. 2015 Mar 27;290(13):8185–8195.
- Hu JL, He GY, Lan XL, et al. Inhibition of ATG12-mediated autophagy by miR-214 enhances radiosensitivity in colorectal cancer. Oncogenesis. 2018 Feb 20;7(2):16.
- Li J, Ning G, Duncan SA. Mammalian hepatocyte differentiation requires the transcription factor HNF-4alpha. Genes Dev. 2000 Feb 15;14(4):464–474.
- Holloway MG, Miles GD, Dombkowski AA, et al. Liver-specific hepatocyte nuclear factor-4alpha deficiency: greater impact on gene expression in male than in female mouse liver. Mol Endocrinol (Baltimore, Md). 2008 May;22(5):1274–1286.
- Yin L, Ma H, Ge X, et al. Hepatic hepatocyte nuclear factor 4alpha is essential for maintaining triglyceride and cholesterol homeostasis. Arterioscler Thromb Vasc Biol. 2011 Feb;31(2):328–336.
- Xu Y, Zalzala M, Xu J, et al. A metabolic stress-inducible miR-34a-HNF4alpha pathway regulates lipid and lipoprotein metabolism. Nat Commun. 2015 Jun 23;6:7466.
- Raben N, Puertollano R. TFEB and TFE3: linking lysosomes to cellular adaptation to stress. Annu Rev Cell Dev Biol. 2016 Oct 6;32:255–278.
- Ruderman NB, Carling D, Prentki M, et al. AMPK, insulin resistance, and the metabolic syndrome. J Clin Invest. 2013 Jul;123(7):2764–2772.
- Smith BK, Marcinko K, Desjardins EM, et al. Treatment of nonalcoholic fatty liver disease: role of AMPK. Am J Physiol Endocrinol Metab. 2016 Oct 1;311(4):E730–e740.
- Hall DP, Cost NG, Hegde S, et al. TRPM3 and miR-204 establish a regulatory circuit that controls oncogenic autophagy in clear cell renal cell carcinoma. Cancer Cell. 2014 Nov 10;26(5):738–753.
- Sun Y, Li TY, Song L, et al. Liver-specific deficiency of unc-51 like kinase 1 and 2 protects mice from acetaminophen-induced liver injury. Hepatology. 2018 Jun;67(6):2397–2413.
- KOO Y, MP GARNEAU, ZHANG Q, et al. Regulation of hepatic insulin sensitivity and hepatic steatosis by ULK1. Diabetes. 2018;67(Supplement 1):1863–P.
- Folch J, Lees M, Sloane Stanley GH. A simple method for the isolation and purification of total lipides from animal tissues. J Biol Chem. 1957 May;226(1):497–509.
- Seok S, Fu T, Choi SE, et al. Transcriptional regulation of autophagy by an FXR-CREB axis. Nature. 2014 Dec 4;516(7529):108–111.