
ABSTRACT
Selective degradation of the endoplasmic reticulum (ER; reticulophagy) is a type of autophagy involved in the removal of ER fragments. So far, amino acid starvation as well as ER stress have been described as inducers of reticulophagy, which in turn restores cellular energy levels and ER homeostasis. Here, we explored the autophagy-inducing mechanisms that underlie the autophagic cell death (ACD)-triggering compound loperamide (LOP) in glioblastoma cells. Interestingly, LOP triggers upregulation of the transcription factor ATF4, which is accompanied by the induction of additional ER stress markers. Notably, knockout of ATF4 significantly attenuated LOP-induced autophagy and ACD. Functionally, LOP also specifically induces the engulfment of large ER fragments within autophagosomes and lysosomes as determined by electron and fluorescence microscopy. LOP-induced reticulophagy and cell death are predominantly mediated through the reticulophagy receptor RETREG1/FAM134B and, to a lesser extent, TEX264, confirming that reticulophagy receptors can promote ACD. Strikingly, apart from triggering LOP-induced autophagy and ACD, ATF4 is also required for LOP-induced reticulophagy. These observations highlight a key role for ATF4, RETREG1 and TEX264 in response to LOP-induced ER stress, reticulophagy and ACD, and establish a novel mechanistic link between ER stress and reticulophagy, with possible implications for additional models of drug-induced ER stress.
Abbreviations: ACD: autophagic cell death; ATF6: activating transcription factor 6; ATL3: atlastin 3; BafA1: bafilomycin A1; CCPG1: cell cycle progression gene 1; co-IP: co-immunoprecipitation; DDIT3/CHOP: DNA damage inducible transcript 3; ER: endoplasmic reticulum; EIF2A/eIF2α: eukaryotic translation initiation factor 2A; EIF2AK3/PERK: eukaryotic translation initiation factor 2 alpha kinase 3; ERN1/IRE1α: endoplasmic reticulum to nucleus signaling 1; GABARAP: GABA type A receptor-associated protein; GBM: glioblastoma multiforme; HSPA5/BiP: heat shock protein family (Hsp70) member 5; LOP: loperamide; MAP1LC3/LC3: microtubule-associated protein 1 light chain 3; RETREG1/FAM134B: reticulophagy regulator 1; RTN3L: reticulon 3 long; SEC62: SEC62 homolog, protein translocation factor; TEX264: testis-expressed 264, reticulophagy receptor; UPR: unfolded protein response.
Introduction
Over the past decades, macroautophagy (hereafter referred to as “autophagy”) has emerged as a precisely regulated process that determines cellular functions and fate [Citation1]. Although it is widely agreed that the main function of autophagy is to secure cellular survival under stress conditions, such as amino acid starvation, endoplasmic reticulum (ER) stress or the accumulation of reactive oxygen species, an opposite pro-death function of autophagy has been recognized as well [Citation1–5]. In fact, several studies have shown the induction of autophagic cell death (ACD) by natural compounds or Food and Drug Administration-approved drugs in multiple cancer cell lines [Citation6–9]. Among these, glioblastomas seem to be particularly vulnerable to the induction of ACD, thus highlighting ACD induction in the context of glioblastoma as an attractive therapeutic strategy to selectively trigger cancer cell death [Citation10–12].
Several studies investigating ACD in glioma cell lines reported that the induction of ER stress/the unfolded protein response (UPR) occurred prior to autophagic responses [Citation8,Citation13,Citation14]. ER stress relates to the accumulation of mis- or unfolded proteins within the ER lumen, which in turn triggers recruitment of ER chaperones such as HSPA5 (heat shock protein family [Hsp70] member 5) to dysfunctional proteins [Citation15,Citation16]. Under physiological conditions, HSPA5 remains bound to the ER-resident sensor proteins EIF2AK3 (eukaryotic translation initiation factor 2 alpha kinase 3), ERN1 (endoplasmic reticulum to nucleus signaling 1), and ATF6 (activating transcription factor 6), thereby inactivating all these three kinases [Citation17]. Recruitment of HSPA5 to unfolded proteins triggers the activation of EIF2AK3, ERN1, and ATF6, which via distinct signaling cascades decrease global protein synthesis [Citation18]. At the same time, activation of the UPR increases chaperone synthesis and expands the ER size in order to enhance its folding capacity [Citation18]. For instance, EIF2AK3 activation mediates phosphorylation of the alpha-subunit of EIF2A (eukaryotic translation initiation factor 2A), followed by translation of ATF4 mRNA [Citation15]. ATF4 is a transcription factor that activates genes that predominantly control autophagy, protein folding, amino acid metabolism, redox balance, and apoptosis [Citation19–21]. In addition, ATF4 upregulates the transcription factor DDIT3 (DNA damage inducible transcript 3), which plays a role in apoptosis induction [Citation19,Citation22]. Besides EIF2AK3, EIF2AK1 (eukaryotic translation initiation factor 2 alpha kinase 1), EIF2AK2, and EIF2AK4 can directly phosphorylate EIF2A as well, which in turn favors the induction of ATF4 [Citation23].
Interestingly, apart from the initiation of bulk autophagy, the selective degradation of the ER by autophagy, referred to as reticulophagy, has emerged as one of the typical responses to ER stress [Citation24]. To maintain ER homeostasis upon ER stress a, reticulophagy molds the ER back to its previous shape and size [Citation24,Citation25]. To date, six reticulophagy receptors have been identified in mammals: RETREG1 (reticulophagy regulator 1), RTN3L (reticulon 3 long isoform), SEC62 (SEC62 homolog), CCPG1 (cell-cycle progression gene 1), ATL3 (atlastin 3) and TEX264 (testis-expressed 264) [Citation26–32]. All six receptors are inserted into the ER membrane and contain at least one MAP1LC3/LC3 (microtubule-associated protein 1 light chain 3)-interacting region (LIR), which enables them to recruit the autophagy machinery to specific subdomains of the ER [Citation25]. For example, RETREG1 triggers the selective degradation of ER sheets spanning the nucleus, while RTN3L and ATL3 selectively degrade ER tubules that form the periphery of the ER and TEX264 localizes to tubular three-way junctions [Citation30–32]. These four receptors appear to trigger reticulophagy exclusively in response to starvation conditions [Citation18]. In contrast, CCPG1 and SEC62 promote the degradation of insoluble proteins and the excess ER generated to resolve ER stress, respectively [Citation18,Citation28,Citation29]. Despite the identification of the reticulophagy receptors, the precise mechanisms that induce reticulophagy are still poorly understood. Furthermore, it remains unclear if there are, apart from starvation and the accumulation of unfolded proteins, additional stimuli that specifically trigger reticulophagy.
We previously screened a library containing autophagy-inducing compounds and identified the Food and Drug Administration-approved drug loperamide (LOP) as potent inducer of ACD in the glioblastoma multiforme (GBM) cell line MZ-54 [Citation7]. However, apart from the finding that LOP inhibits MTOR complex 1 signaling, the mechanism of how LOP triggers ACD is currently unclear [Citation7]. Here, we report that LOP induces a strong upregulation of both the transcription factor ATF4 and the ER chaperone HSPA5, which is indicative of progressive ER stress. Intriguingly, ATF4 is required for LOP-induced autophagy and ACD and in turn stimulates the selective degradation of sheet and tubular ER membranes, likely through the reticulophagy receptors RETREG1 and TEX264. This classifies ATF4 as an important regulator of autophagy and reticulophagy in the context of ER stress.
Results
LOP induces hallmarks of ER stress and autophagy in GBM cells and mouse embryonic fibroblasts (MEFs)
We previously reported that LOP induces ACD in the GBM cell line MZ-54 [Citation7]. As several studies suggest increased ER stress prior to ACD induction, we initially determined whether expression levels of common ER stress marker proteins are affected by LOP treatment [Citation8,Citation13,Citation14–17]. Interestingly, EIF2AK3 was upregulated upon LOP treatment in MZ-54 wild-type (WT) as well as in Atg5+/+ MEFs (). As a control, we analyzed EIF2AK3 expression upon treatment with thapsigargin, an established ER stress-inducing compound, and observed a shift of the EIF2AK3 protein band, which is indicative of EIF2AK3 activation through phosphorylation (). This shift, however, was absent in LOP-treated cells, suggesting that EIF2AK3 is not activated in response to LOP treatment. Nevertheless, we observed a marked upregulation of ATF4 that was accompanied by phosphorylation of EIF2A and increased DDIT3 levels () in MZ-54 WT and ATG7 knockout (KO) cells as well as in Atg5+/+ and atg5−/- MEFs (). To test whether LOP induces ERN1 signaling as well, we assessed the protein levels of spliced XBP1 (XPS1s [X-box binding protein 1]). Indeed, treatment with LOP moderately increased XBP1s as well as total ERN1 protein levels (Figure S1). ER stress typically induces upregulation of molecular chaperones that are required for proper protein folding [Citation33]. Consistently, LOP treatment induced a marked increase in the levels of the major chaperone HSPA5 in both cell lines (). In addition, to compare the kinetics of ER stress induction with stimulation of autophagy, we analyzed lipidation of the two well-characterized autophagy marker proteins LC3B and GABARAP (GABA type A receptor-associated protein). Both belong to the LC3/GABARAP family (hereafter referred to as LC3 proteins). During autophagy, LC3 proteins are lipidated in autophagy-proficient cells [Citation34]. We have previously reported that LOP enhances the autophagic flux and induces ACD in MZ-54 cells [Citation7]. Interestingly, the strong increase in LC3B and GABARAP lipidation was preceded by upregulation of ATF4, which peaked already after 2–4 h in GBM cells and MEFs (). Together, this indicates that LOP-triggered ER stress occurs prior to autophagy induction.
Figure 1. LOP induces hallmarks of ER stress and autophagy in GBM cells and MEFs. (A,B) MZ-54 WT and MZ-54 ATG7 KO cells (A) or Atg5+/+ and atg5−/- MEFs (B) were treated with 17.5 µM LOP or 0.75 µM thapsigargin for the indicated time points followed by western blotting with the indicated antibodies and VCL as loading control
ATF4 is essential for LOP-triggered autophagy and ACD
ATF4 has been reported to transcriptionally control several autophagy target genes [Citation35]. To investigate whether ATF4 is required for LOP-induced autophagy, we generated CRISPR/Cas9-derived ATF4 KO MZ-54 cell lines (). Strikingly, we observed a decrease in LC3B and GABARAP lipidation levels upon LOP treatment in ATF4 KO cells compared to WT cells (). As expected, LC3B or GABARAP lipidation was absent in ATG7 KO cells and ATG7; ATF4 double KO cells, as ATG7 is essential for the lipidation of LC3 proteins (). Next, we wanted to investigate whether ATF4 depletion also affects LOP-triggered ACD in MZ-54 cells [Citation7]. Deletion of ATG7 markedly reduced cell death induced after 48 h of LOP treatment, which is in accordance with the concept of LOP-induced ACD () [Citation7]. Surprisingly, depletion of ATF4 rescued LOP-induced cell death after 48 h and 72 h to a similar extent as depletion of ATG7 ( and S2A), while the concomitant absence of ATG7 and ATF4 did not further decrease LOP-induced cell death compared to cell death observed in ATG7 KO cells after 48 h (). Importantly, knockdown of ATF4 partially rescued LOP-induced cell death after various time points as well, which supports the observations in the ATF4 KO cell lines (Figure S2B). To further exclude potential clonal effects related to the ATF4 KO cell line, an independent ATF4 KO clone was generated that also exhibited a prominent rescue of LOP-induced cell death (Figure S2C). Importantly, LOP-induced ACD strictly occurs in the absence of alternative cell death pathways such as apoptosis, necroptosis, and ferroptosis, suggesting that ATF4 is indeed required for LOP-induced ACD [Citation7]. Of note, knockdown of EIF2AK3 did not influence LOP-induced LC3B lipidation (Figure S3, left panel) or ACD (Figure S3, right panel), suggesting EIF2AK3-independent regulation of autophagy through ATF4.
Figure 2. ATF4 is essential for LOP-triggered autophagy and ACD. (A,B) MZ-54 WT NHT, MZ-54 WT ATF4 KO #1 (A), MZ-54 ATG7 KO NHT and MZ-54 ATG7; ATF4 double KO (B) cells were treated with 17.5 µM LOP for the indicated time points followed by western blotting with VCL as loading control. (C) Expression levels of ATF4 mRNA were analyzed by qRT-PCR in MZ-54 WT NHT and MZ-54 WT ATF4 KO #1 cells. Fold increase of mRNA levels is shown relative to MZ-54 WT NHT with mean and SEM of 3 independent experiments performed at least in duplicate. (D) MZ-54 WT NHT, MZ-54 WT ATF4 KO #1, MZ-54 ATG7 KO NHT and MZ-54 ATG7; ATF4 double KO cells were treated with 17.5 µM or 20 µM LOP for 48 h. Cell death was assessed by measuring the propidium iodide (PI) uptake as fraction of total nuclei determined by Hoechst counterstaining using high-content fluorescence microscopy. (E-H) Expression levels of ATG13 (E), WIPI1 (F), MAP1LC3B (G) and GABARAP; GABARAPL1 (H) mRNA were analyzed by qRT-PCR in MZ-54 WT NHT and MZ-54 WT ATF4 KO #1 cells treated with 17.5 µM LOP for the indicated time points. Fold increase of mRNA levels is shown relative to untreated cells of each cell line with mean and SEM of at least 3 independent experiments performed at least in duplicate. *p < 0.05, **p < 0.01, ***p < 0.001, ns: non-significant. UT, untreated
To find out whether ATF4 stimulates autophagy through transcriptional regulation, we assessed mRNA expression levels of known ATF4 target genes involved in autophagy [Citation35]. Indeed, we observed a significant upregulation of ATG13 (autophagy initiation), WIPI1 (autophagosome nucleation) as well as MAP1LC3B and GABARAP/GABARAPL1 (autophagosome elongation) mRNA transcripts upon treatment of MZ-54 cells with LOP (). Consistent with the described ATF4 dependency, depletion of ATF4 markedly reduced LOP-induced upregulation of all four autophagy transcripts compared to WT cells () [Citation35]. Together, these experiments confirm the essential role of ATF4 in LOP-induced autophagy as well as ACD.
LOP treatment induces degradation of ER within lysosomal compartments
In recent years, it has become clear that, apart from bulk autophagy, selective autophagy pathways are frequently triggered in specific cellular contexts and in response to certain cellular cues [Citation36]. For instance, ER stress induces a restructuration of the ER itself by stimulating dilation of ER membranes to assure proper folding of proteins [Citation25]. Following ER stress termination, excess ER membranes are typically degraded via reticulophagy [Citation25]. In our subsequent analysis, we therefore asked whether LOP specifically induces reticulophagy and whether this is mediated via ATF4. To assess whether LOP-induced ER stress triggers reticulophagy, we applied the previously described ssRFP-GFP-KDEL sensor to quantify the ER-specific autophagic flux [Citation32]. Under normal growth conditions, ssRFP-GFP-KDEL localizes to the ER and is in part transported into lysosomes upon reticulophagy induction [Citation32]. ssRFP-GFP-KDEL becomes cleaved by lysosomal enzymes into ssRFP and GFP-KDEL [Citation32]. Under intralysosomal acidic conditions, GFP fluorescence is rapidly quenched, whereas fluorescence of ssRFP remains stable [Citation32]. Thus, reticulophagic flux can be determined by measuring the number of ssRFP-positive puncta that do not display a GFP signal using fluorescence microscopy.
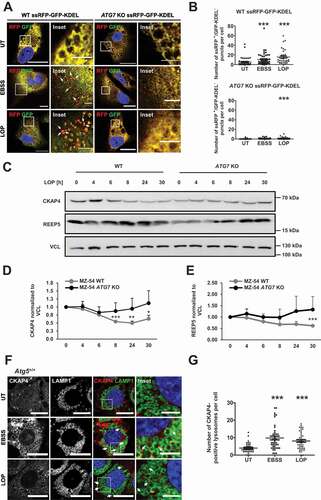
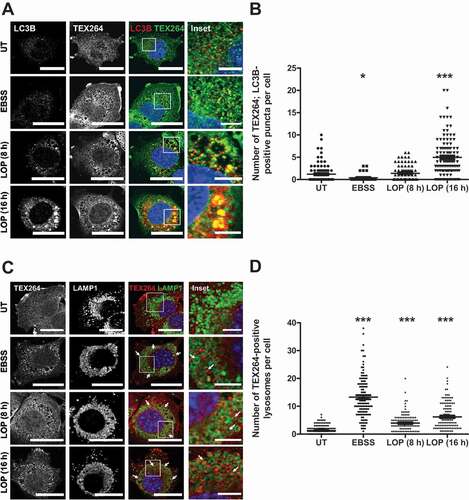
LOP-treated MZ-54 cells displayed the formation of distinct ssRFP-positive, GFP-negative puncta even more prominently than those quantified in EBSS-treated cells, which served as a positive control for reticulophagy stimulation (). Intriguingly, LOP specifically induced the formation of clover-shaped ssRFP-positive protein clusters that are typically observed during reticulophagy [Citation32] (). To further characterize the type of reticulophagy induced by LOP treatment we evaluated the levels of CKAP4/CLIMP-63 (cytoskeleton associated protein 4) and REEP5 (receptor accessory protein 5), two marker proteins for the ER sheets and tubules, respectively [Citation26,Citation27]. In contrast to ATG7 KO cells, the expression levels of both ER proteins were significantly decreased in MZ-54WT cells upon extended exposure to LOP, with CKAP4 showing a higher effect (). Moreover, we observed a significant and ATG5-dependent engulfment of CKAP4 protein (, and S4, upper panel), but not of REEP5 (Figure S4, lower panel) within LAMP1 (lysosomal associated membrane protein 1)-positive lysosomes upon treatment of MEFs with LOP, suggesting that LOP-induced reticulophagy predominantly targets ER sheets for degradation.
Figure 3. LOP treatment induces degradation of ER within lysosomal compartments. (A) Stable ssRFP-GFP-KDEL-expressing MZ-54 WT and ATG7 KO cells were treated for 8 h with EBSS or for 16 h with 17.5 µM LOP followed by confocal microscopy of ssRFP+/GFP-KDEL− and ssRFP+/GFP-KDEL+ structures. Scale bar: 20 µm (5 µm for insets). Asterisks highlight ssRFP+/GFP-KDEL− puncta. (B) Quantification of (A). Mean and SEM of the quantification of at least 33 cells from 3 independent experiments are shown. (C) MZ-54 WT and MZ-54 ATG7 KO cells were treated with 17.5 µM LOP for the indicated time points followed by western blotting with VCL as loading control. (D,E) Quantification of CKAP4 (D) and REEP5 (E) protein expression levels normalized to VCL. Mean and SEM of 3 to 4 independent experiments are shown. (F) Atg5+/+ MEFs were treated for 6 h with EBSS or for 8 h with 17.5 µM LOP followed by immunofluorescence staining of CKAP4 and LAMP1 and confocal microscopy. BafA1 was added to all samples 4 h before fixation. Scale bar: 20 µm (5 µm for insets). Asterisks highlight CKAP4-positive lysosomes. (G) Quantification of (F). Mean and SEM of the quantification of at least 36 cells from 3 independent experiments are shown. * p < 0.05, ** p < 0.01, *** p < 0.001
LOP triggers ultrastructural hallmarks of reticulophagy
To further confirm that LOP triggers degradation of ER portions within autophagic compartments and to distinguish between macro- and micro-reticulophagy, electron microscopy of LOP-treated MZ-54 cells was performed. As expected, an increased formation of degradative compartments, comprising autophagosomes as well as autolysosomes, was observed in LOP-treated cells compared to control cells (). Strikingly, 70% of autophagosomes formed in LOP-treated cells contained ER fragments, which was not observed in control cells (). Moreover, engulfed ER fragments clearly comprised rough ER, since they were decorated with ribosomes () [Citation37]. This ultrastructural morphological analysis therefore validates and confirms that LOP induces a type of reticulophagy, in particular of macro-reticulophagy, which is consistent with our previous microscopic analysis ( and S2).
Figure 4. LOP triggers ultrastructural hallmarks of reticulophagy. (A-F) MZ-54 WT cells were left untreated (A-C) or treated with 17.5 µM LOP (D-F) for 48 h before being processed for electron microscopy. Scale bar: 1 µm (A and D) or 500 nm (b, c, e, and f). (G) The average number of ER+ and ER− autophagosomes per cell section was determined as described in Materials and Methods. Significances are calculated versus untreated cells. *** p < 0.001. A, autophagosome; D, degradative compartment; ER, endoplasmic reticulum; M, mitochondria; N, nucleus; PM, plasma membrane; UT, untreated; asterisk, rough-ER fragment
LOP induces expression and degradation of the reticulophagy receptors TEX264 and RETREG1
It has been speculated that reticulophagy is preceded by transcriptional upregulation of reticulophagy receptors [Citation29,Citation38]. To address whether LOP-induced reticulophagy is mediated by any of the known reticulophagy receptors, mRNA levels of the reticulophagy receptors were quantified upon LOP treatment. Interestingly, a 4- to 5-fold upregulation of TEX264 and RETREG1 transcripts, and 1- of 2.5-fold for CCPG1, could be detected (). In contrast, RTN3 and SEC62 levels remained largely unaffected by LOP treatment ().
Figure 5. LOP induces expression and degradation of the reticulophagy receptors TEX264 and RETREG1. (A–E) mRNA expression levels of TEX264 (A), RETREG1 (B), RTN3 (C), CCPG1 (D) and SEC62 (E) were analyzed by qRT-PCR of MZ-54 WT NHT cells treated with 17.5 µM LOP for the indicated time points. Fold increase of mRNA levels is shown relative to UT control with mean and SEM of at least 3 independent experiments performed at least in duplicate. (F) MZ-54 WT and MZ-54 ATG7 KO cells were treated with 17.5 µM LOP for the indicated time points followed by western blotting with VCL as loading control. (G–K) Quantification of TEX264 (G), RETREG1 (H), RTN3L (I), CCPG1 (J) and SEC62 (K) protein expression levels normalized to VCL. Mean and SEM of 3-4 independent experiments are shown. *p < 0.05, **p < 0.01, ***p < 0.001. UT, untreated
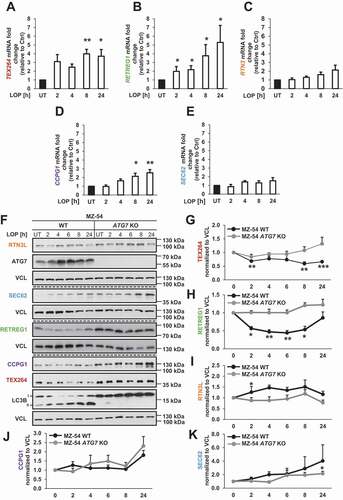
Apart from being transcriptionally upregulated, selective autophagy receptors are also degraded by selective autophagy, resulting in decreased protein expression levels [Citation39]. To investigate autophagic degradation of reticulophagy receptors, we therefore assessed their protein levels upon treatment with LOP. Intriguingly, LOP treatment induced a significant decrease in TEX264 and RETREG1 protein levels (). Essentially, this decrease was dependent on ATG7, consistent with the concept that reticulophagy requires the autophagy machinery [Citation24]. RTN3L, CCPG1 and SEC62 protein levels were not significantly decreased upon LOP treatment, suggesting that these receptors are either not degraded by LOP-induced reticulophagy, or at least to a minor extent in comparison to TEX264 and RETREG1 (). Given that TEX264 and RETREG1 were both transcriptionally upregulated and pronouncedly degraded in an LOP- and ATG7-dependent manner, we focused on these two reticulophagy receptors for the subsequent analysis.
LOP stimulates clustering of TEX264 at LC3B-positive sites, followed by delivery into LAMP1-positive lysosomes
To further understand the role of TEX264 as reticulophagy receptor upon LOP-induced ER stress, we assessed the colocalization of TEX264 with autophagic and lysosomal compartments in MEFs. Interestingly, we observed the formation of TEX264-positive clusters in LOP-treated MEFs (), which is indicative of TEX264 receptor clustering at distinct sites, a phenomenon that has recently been attributed to reticulophagy [Citation31,Citation32]. Moreover, we detected a significant colocalization of TEX264 puncta with larger LC3B puncta at multiple sites compared to control cells after 16 h of LOP treatment (). One hallmark of selective autophagy is the autophagy-dependent degradation of selective autophagy receptors within lysosomes [Citation39]. Therefore, we sought to confirm the delivery of TEX264 within lysosomes by monitoring the distribution of both TEX264 and the lysosomal marker protein LAMP1. Indeed, prominent TEX264-positive puncta could be detected within LAMP1-positive lysosomes after treatment with LOP (), which is consistent with ongoing TEX264-dependent reticulophagy. Of note, colocalization of TEX264 with LC3B, as well as engulfment into lysosomes, were largely autophagy-dependent, as we did not detect colocalization of TEX264 with LC3B (Figure S5, left panel) or its shuttling into lysosomes (Figure S5, right panel) in atg5−/- MEFs. All reticulophagy receptors identified so far share the common LIR domain that mediates interactions with LC3 family proteins. To test whether LC3B interacts with TEX264 upon treatment with LOP, co-immunoprecipitation (co-IP) experiments were performed that confirmed a LOP- and autophagy-dependent interaction of LC3B with TEX264, appearing already after 8 h of LOP treatment (Figure S6a). Vice versa, a strong interaction of FLAG-tagged TEX264 with LC3B occurred in MZ-54 cells treated with LOP for 24 h (Figure S6b). Importantly, the LOP-induced TEX264-LC3B interaction was dependent on an intact LIR domain, since the LIR-mutated TEX264-LIR4A did not interact with LC3B (Figure S6b). To determine whether RETREG1 also interacts with LC3B upon treatment with LOP, we also performed co-IP experiments with FLAG-tagged RETREG1. Indeed, we observed a LOP-dependent interaction between FLAG-tagged RETREG1 and LC3B (Figure S6c). Moreover, this interaction was absent in ATG7 KO MZ-54 cells (Figure S6c), which is consistent with the concept of reticulophagy.
Figure 6. LOP triggers clustering of TEX264 at LC3B-positive sites, followed by delivery into LAMP1-positive lysosomes. (A and C) Atg5+/+ MEFs were treated for 6 h with EBSS or for 8 or 16 h with 17.5 µM LOP followed by immunofluorescence stainings of LC3B and TEX264 (A) or TEX264 and LAMP1 (C) and confocal microscopy. BafA1 was added to all samples 4 h before fixation. Scale bar: 20 µm (5 µm for insets). (B and D) Quantification of (A,C). Asterisks highlight TEX264-positive lysosomes. Mean and SEM of the quantification of at least 115 cells from 5–6 independent experiments are shown. * p < 0.05, *** p < 0.001. UT, untreated
RETREG1 and TEX264 contribute to LOP-induced cell death and reticulophagy
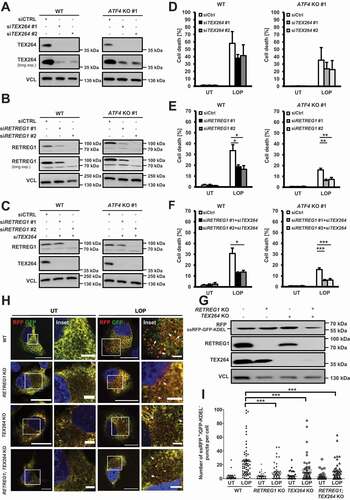
Generally, reticulophagy is associated with pro-survival and stress-relieving functions [Citation28,Citation29,Citation40], however, recent findings suggest the involvement of reticulophagy receptors to actively promote ACD in a context-dependent manner [Citation41,Citation42]. To test whether RETREG1 or TEX264 contribute to LOP-induced cell death, siRNA-mediated knockdown of both receptors was performed in WT and ATF4 KO cells (). Intriguingly, TEX264 knockdown only moderately inhibited cell death, while loss of RETREG1 expression or RETREG1; TEX264 double knockdown reduced LOP-induced cell death induction, suggesting that RETREG1 indeed promotes cell death in response to LOP treatment (). Next, we asked whether LOP-triggered reticulophagy is predominantly mediated via RETREG1 and TEX264 as well. For this, we generated RETREG1, TEX264 and RETREG1; TEX264 KO cell lines stably expressing the reticulophagy sensor protein ssRFP-GFP-KDEL (). To analyze the relevance of RETREG1 and TEX264 in reticulophagy in detail, the reticulophagic flux was quantified upon treatment with LOP. Importantly, loss of TEX264, RETREG1 or RETREG1; TEX264 expression reduced the number of ssRFP+/GFP-KDEL− puncta, indicative of a decreased reticulophagic flux (). Intriguingly, TEX264; RETREG1 double KO also blocked the formation of large ssRFP+/GFP-KDEL− aggregates (). In line with previous findings, RETREG1 KO inhibited the reticulophagic flux more efficiently compared to TEX264 KO (). As depletion of RETREG1 also reduced LOP-induced cell death (), these data suggest that RETREG1 is most likely a key executor of LOP-triggered reticulophagy and cell death.
Figure 7. RETREG1 and TEX264 contribute to LOP-induced cell death and reticulophagy. (A–F) Knockdown of TEX264 or RETREG1 was performed in MZ-54 WT and ATF4 KO #1 cells. 48 h after knockdown, cells were treated with 17.5 µM LOP for 30 h. Knockdown of TEX264 or RETREG1 was confirmed by western blotting with VCL as loading control (A-C) and cell death was assessed by measuring the PI uptake as fraction of total nuclei determined by Hoechst counterstaining using high-content fluorescence microscopy (D-F). Mean and SEM of 3 to 4 independent experiments are shown. (G) KO of RETREG1 or TEX264 was confirmed by western blotting with VCL as loading control. (H) Stable ssRFP-GFP-KDEL-expressing MZ-54 WT, RETREG1 KO, TEX264 KO and RETREG1; TEX264 KO cells were treated for 16 h with 17.5 µM LOP followed by confocal microscopy of ssRFP+/GFP-KDEL− and ssRFP+/GFP-KDEL+ structures. Scale bar: 20 µm (5 µm for insets) Asterisks highlight ssRFP+/GFP-KDEL− puncta. (I) Quantification of (H). Mean and SEM of the quantification of at least 40 cells from 4 independent experiments are shown. *p < 0.05, **p < 0.01, ***p < 0.001. UT, untreated
LOP-triggered reticulophagy depends on ATF4
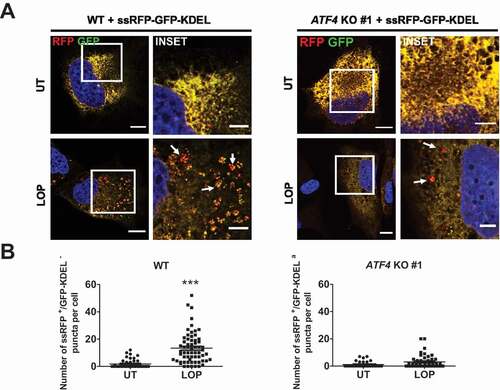
As LOP induced upregulation of ATF4 in MZ-54 cells, eventually leading to autophagy and reticulophagy, we next assessed whether ATF4 is also functionally required for the execution of LOP-induced reticulophagy. Therefore, the LOP-induced reticulophagic flux was quantified in MZ-54 WT cells and compared with the flux in ATF4 KO cells. In contrast to the control, no significant increase in the number of ssRFP-positive puncta per cell could be detected in ATF4 KO cells after LOP treatment, indicating that ATF4 is indeed required for the increased reticulophagic flux after LOP treatment (). Moreover, we also observed that ATF4 is required for transcriptional upregulation of TEX264 and RETREG1 upon LOP treatment, consistent with the TRANScription FACtor (TRANSFAC) database analysis of the presence of ATF4 binding site motifs within the RETREG1 promoter. Together, these data confirm a key role of ATF4 in RETREG1- and, likely also TEX264-, mediated LOP-induced reticulophagy (Figure S7) [Citation43].
Figure 8. LOP-triggered reticulophagy depends on ATF4. (A) Stable ssRFP-GFP-KDEL-expressing MZ-54 WT and ATF4 KO #1 cells were treated for 16 h with 17.5 µM LOP followed by confocal microscopy of ssRFP+/GFP-KDEL− and ssRFP+/GFP-KDEL+ structures. Scale bar: 20 µm (5 µm for insets) Asterisks highlight ssRFP+/GFP-KDEL− puncta. (B) Quantification of (A). Mean and SEM of the quantification of at least 36 cells from 4 independent experiments are shown. *** p < 0.001. UT, untreated
Discussion
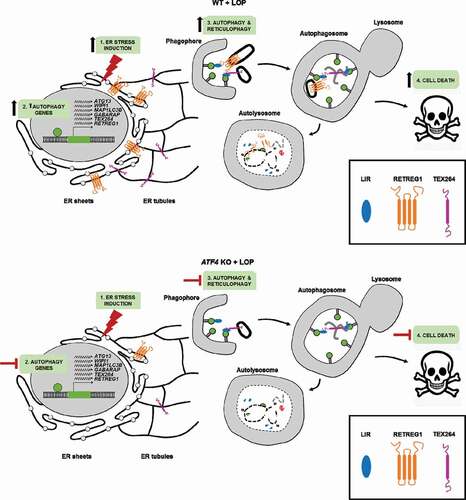
In this study, we demonstrate that LOP treatment induces ER stress including upregulation of the stress-signaling transcription factor ATF4, leading to the induction of autophagy, reticulophagy and ACD. Specifically, our experiments reveal that LOP-induced reticulophagy is mediated via the reticulophagy receptors RETREG1 and TEX264, and predominantly targets rough ER fragments for degradation ().
Figure 9. ATF4 is a key regulator of LOP-dependent autophagy, reticulophagy and cell death. In WT cells, treatment with LOP induces (1) upregulation of ATF4 and ER stress signaling proteins followed by (2) ATF4-dependent upregulation of autophagy genes, thereby inducing (3) autophagy and RETREG1- and TEX264-mediated reticulophagy, which (4) culminates in ACD. In ATF4 KO cells, treatment with LOP induces (1) upregulation of ER stress signaling proteins but not of ATF4 followed by (2) a diminished upregulation of autophagy genes. This leads to (3) the stimulation of low levels of autophagy and reticulophagy and (4) rescues cells from ACD
Treatment with LOP induces a rapid upregulation of ATF4, DDIT3 and HSPA5, phosphorylation of EIF2A and lipidation of the LC3 proteins LC3B and GABARAP. Moreover, ATF4 depletion reduced autophagy, suggesting that LOP-induced ATF4-dependent ER-stress signaling occurs upstream of autophagy. Although ER stress-mediated autophagy induction through transcriptional upregulation of autophagic machinery components has been suggested by others, most of these studies focused on unraveling the EIF2AK3-EIF2A-ATF4 branch [Citation19–22,Citation44,Citation45]. In contrast, our findings reveal that EIF2AK3 is not phosphorylated upon treatment with LOP, indicating EIF2AK3-independent modes of ATF4 upregulation. Interestingly, ATF4 has been reported to induce autophagy independently of EIF2AK3 activation through transcriptional upregulation of genes involved in autophagosome formation in response to thapsigargin treatment [Citation35]. However, it is currently unclear which upstream factors contribute to ATF4 activation in this context [Citation35]. LOP has recently been reported to potentiate DDIT3 upregulation and ER stress induced by the proteasome inhibitor bortezomib in the absence of EIF2AK3 activation as well [Citation46], which is consistent with our findings. The fact that we did not observe LOP-induced alterations in EIF2AK3 protein levels or phosphorylation status indicates that upregulation of ATF4, DDIT3 and phosphorylated EIF2A occurs through alternative pathways [Citation46]. One likely candidate is EIF2AK4, a kinase that is part of the integrated stress response, which is activated in response to various cellular stress stimuli, including ER stress, and directly phosphorylates EIF2A to control ATF4 gene transcription [Citation23,Citation47].
Apart from increasing the levels of proteins involved in ER stress, LOP treatment also induces transcriptional regulation of the autophagy genes ATG13, WIPI1, MAP1LC3B and GABARAP/GABARAPL1, required for all major steps of autophagosome formation, that have previously been reported to be induced by ATF4 [Citation35,Citation44]. Consistent with a key role of ATF4 in transcriptional regulation of autophagy, loss of ATF4 expression diminished autophagy gene upregulation. This observation places ATF4 activation upstream of LOP-induced autophagy.
Besides ATF4-mediated induction of autophagy, our study provides a link between ATF4 and the induction of ACD in GBM cells [Citation7]. Loss of ATF4 expression markedly reduced LOP-induced ACD to a level similar to ATG7 KO cells. As we already had excluded the execution of apoptosis, necroptosis and ferroptosis during LOP-induced ACD previously, these findings emphasize that ATF4 functions as a crucial inducer of autophagy and ACD [Citation7]. This is consistent with several studies that highlight a role for ATF4 in ACD [Citation48–51].
Intriguingly, we identify reticulophagy as the main consequence of LOP treatment. The LOP-induced increase in reticulophagic flux involves clustering of ER fragments at specific cytosolic sites and degradation of the ER sheet protein CKAP4 within lysosomes, a typical hallmark of reticulophagy [Citation26,Citation27,Citation30]. In addition, around 70% of LOP-induced autophagosomes contained large portions of ER.
Interestingly, dilation of the ER has previously been observed upon combinatorial treatment with bortezomib and LOP, although the implications of this finding for the induction of reticulophagy remain unclear [Citation46].
ER stress is a typical trigger of reticulophagy, as illustrated by the induction of reticulophagy by the UPR that is mediated by the reticulophagy receptor CCPG1 in the exocrine pancreas, thus protecting tissue from ER-luminal protein aggregation [Citation29]. In addition, the ER translocon component and reticulophagy receptor SEC62 restores ER homeostasis in response to ER stress in a process referred to as “recovER-phagy” [Citation28].
Nevertheless, LOP only induced a minor upregulation of CCPG1 and SEC62, while triggering a marked upregulation of both TEX264 and RETREG1. Apart from being transcriptionally upregulated, reticulophagy receptors are at the same time degraded during reticulophagic flux, thus hampering simple assessment of LOP-induced reticulophagy receptor turnover [Citation39]. In fact, we observed a LOP-, autophagy- and time-dependent degradation of TEX264 and RETREG1, suggesting prominent roles of these receptors during LOP-induced reticulophagy. Consistently, TEX264 clusters were delivered to lysosomes, whereas both receptors interact with LC3B upon LOP treatment. Reticulophagy receptor clustering has been proposed as a surrogate measure of reticulophagic activity, albeit mostly upon amino acid starvation [Citation25,Citation52]. Intriguingly, we observed that LOP treatment triggers (1) the general formation of clover-shaped ER structures and (2), more specifically, the delivery of TEX264 into lysosomes. In line with the induction of ER stress by LOP, it has been proposed that receptor clustering might be triggered by the capturing of unfolded or mutant protein aggregates within the ER lumen by chaperones at distinct sites, which might in turn recruit reticulophagy receptors through protein-protein interactions [Citation25,Citation40,Citation53].
Interestingly, we observed a prominent degradation of rough ER, which likely involves ER sheets and, to a minor extent, tubules. This is based on the observation that LOP treatment triggered CKAP4 and REEP5 protein degradation and stimulated the delivery of CKAP4 to lysosomes. Moreover, ultrastructural analysis of the content of LOP-stimulated autophagosomes revealed ribosome-decorated ER fragments, thus demonstrating the selective degradation of rough ER [Citation37]. As the mammalian reticulophagy receptors are located at specific ER subdomains, the fact that LOP induces reticulophagy through RETREG1 and TEX264 points to the selective degradation of ER sheets and tubular three-way junctions, respectively [Citation25,Citation26,Citation31].
Finally, we unveiled a role for the reticulophagy receptors TEX264 and RETREG1 in the induction of ACD by LOP. Depletion of TEX264 and RETREG1 reduced sensitivity toward LOP-induced cell death, thus challenging the overall assumption that reticulophagy predominantly restores ER homeostasis and supplies cells with nutrients to ensure survival under stress conditions [Citation24,Citation28,Citation29,Citation40]. Importantly, our findings are in line with RETREG1-mediated cytotoxic reticulophagy induced by the small molecule Z36 that impairs ER homeostasis through excessive ER degradation [Citation41]. In addition, selective reticulophagy was previously described as a major event occurring during ACD of keratinocyte lineage cells [Citation42]. Together, these findings indicate that selective autophagy is a finely tuned process with a context- and cell-dependent outcome.
Our study identifies ATF4 as a potential novel regulator of RETREG1- and TEX264-dependent reticulophagy. However, it remains to be established whether ATF4 specifically stimulates ER stress-induced reticulophagy, or if ATF4 increases the overall autophagic flux by enhancing LC3B and GABARAP protein lipidation. One open question certainly concerns the identification of upstream mechanisms and kinases that trigger EIF2A phosphorylation and ATF4 upregulation in response to LOP treatment. Furthermore, it cannot be completely excluded that LOP simply induces bulk autophagy, leading to coincidental engulfing of parts of the ER, especially since the ER is the largest organelle within the cell [Citation54]. In contrast, it is also possible that LOP triggers reticulophagy without substantially increasing bulk autophagy, which would in turn suggest that LOP-induced ACD is specifically mediated via reticulophagy. This has important implications for understanding to which degree drug-induced autophagy and ACD are selective or not. Finally, future research is required to identify additional reticulophagy receptors, co-factors and regulatory mechanisms that underlie LOP-induced reticulophagy and its potential crosstalk with cancer cell death.
In summary, our findings identify ATF4 and ER stress as novel key regulators of LOP-induced autophagy, RETREG1- and TEX264-mediated reticulophagy and ACD. These insights will have important and relevant implications for diseases characterized by perturbed reticulophagy, such as sensory and motor neuron diseases, neurodegenerative diseases and cancer [Citation38].
Materials and methods
Cell lines and chemicals
WT (Atg5+/+) and KO (atg5−/-) MEFs were generously provided by Prof. N. Mizushima (Department of Physiology and Cell Biology, Tokyo Medical and Dental University, Japan). MEFs as well as the human cell lines HEK293T (ATCC® CRL-3216™) and MZ-54 [Citation7] were cultured in DMEM GlutaMAX medium (Thermo Fisher Scientific, 10569010) supplemented with 10% fetal calf serum (FCS; Thermo Fisher Scientific, 10270–106) and 1% penicillin/streptomycin (Thermo Fisher Scientific, 15140122) at 37°C and 5% CO2 [Citation55,Citation56]. Cells were regularly tested for mycoplasma infection. MZ-54 cells were authenticated by STR profiling at DSMZ (Sammlung von Mikroorganismen und Zellkulturen GmbH). Bafilomycin A1 (BafA1; Selleckchem, S1413), doxycycline (Sigma-Aldrich, 17086–28-1), EBSS (Thermo Fisher Scientific, 24010043), G418 (Thermo Fisher Scientific, 10131027), LOP hydrochloride (Enzo Life Sciences, ALX-550-253-G005), puromycin (Thermo Fisher Scientific, A1113802) and thapsigargin (Sigma-Aldrich, 67526–95-8) were applied as indicated in the figure legends.
Generation of ATG7, ATF4, RETREG1 and TEX264 KO cell lines
MZ-54-derived ATG7 KO cell lines were generated by CRISPR/Cas9 as previously described [Citation7]. CRISPR/Cas9-mediated KO of ATF4, RETREG1 and TEX264 was performed using gRNAs against ATF4 (5ʹ-AGTCCCTCCAACAACAGCAA-3ʹ and 5ʹ-AGATGACCTTCTGACCACGT-3ʹ), against RETREG1 (5ʹ-AACACGCCCAAGTATCATGA-3ʹ, 5ʹ-AGAAACGTGAGAGATCTGGT-3ʹ and 5ʹ-ATGTGCACACACTACAGACC-3ʹ), against TEX264 (5ʹ-GATAAGTGCCGATGTGCCGT-3ʹ, 5ʹ-GTTGTCATAGTAGACAGCGA-3ʹ and 5ʹ-TCTCACCATAGAGCCCCATG-3ʹ) or against GFP as non-human target (NHT) control (5ʹ-GGAGCGCACCATCTTCTTCA-3ʹ, 5ʹ-GCCACAAGTTCAGCGTGTC-3ʹ, and 5ʹ-GGGCGAGGAGCTGTTCACCG-3ʹ) cloned into pLentiCRISPRv2 (Addgene, 52961, deposited by Feng Zhang). Lentiviral particles were generated by co-transfecting pLenti-CRISPRv2 with pPAX2 (Addgene,12260; deposited by Didier Trono) and pMD2.G (Addgene, 12259; deposited by Didier Trono) in HEK293T cells using FuGENE® HD (Promega, E2311) according to the manufacturer’s instructions. Viral particles were collected to transduce MZ-54 target cells using spin transduction followed by selection with puromycin (Thermo Fisher Scientific, A1113802) at a final concentration of 10 µg/ml. For ATF4 KO cell lines, ATF4-deleted single clones were isolated using limited dilution, whereas bulk cultures were used for the RETREG1 and TEX264 KO cell lines.
Knockdown of ATF4, RETREG1 and TEX264
To knock down ATF4, RETREG1 and TEX264, MZ-54 cells were reverse-transfected using Lipofectamine RNAiMAX reagent (Thermo Fisher Scientific, 13778150) according to the manufacturer’s guidelines with the following Silencer Select siRNAs (Thermo Fisher Scientific): siATF4#1, s1702; siATF4#2, s1703, siATF4#3, s1704; siTEX264#1, s28030; siTEX264#2, s28031; siRETREG1#1, s533552, siRETREG1#2, s533553. After 24 h, medium was changed and 24 h later, cells were treated for cell death experiments. Knockdown efficiency was confirmed by western blotting.
Generation of ssRFP-GFP-KDEL-expressing MZ-54 cells and determination of reticulophagy
Lentiviral particles were generated by co-transfecting pCW57-CMV-ssRFP-GFP-KDEL (Addgene, 128257, deposited by Noboru Mizushima) with pPAX2 (Addgene, 12260, deposited by Didier Trono) and pMD2.G (Addgene, 12259, deposited by Didier Trono) in HEK293T cells using FuGENE® HD (Promega, E2311) according to the manufacturer’s instructions. Viral particles were collected to transduce MZ-54 target cells using spin transduction followed by selection with puromycin (Thermo Fisher Scientific, A1113802) at a final concentration of 5 µg/ml for at least two weeks.
For determination of reticulophagy, cells were seeded on coverslips into Greiner 12-well plates at 30,000 cells/well. Expression of the ssRFP-GFP-KDEL reporter was induced by the addition of doxycycline (Sigma-Aldrich, 17086–28-1) at a final concentration of 1 µg/ml for 24 h. Prior to imaging, cells were fixed with 3.7% paraformaldehyde (Merck Millipore, 104002) for 5 min followed by permeabilization with 0.1% Triton X-100 (Carl Roth, 3051.2) diluted in PBS for 10 min. Coverslips were rinsed with ddH2O followed by mounting with ProLong™ Diamond Antifade Mountant with DAPI (Thermo Fisher Scientific, P36966) and placing on a glass holder. Images were acquired with the Leica SP8 laser-scanning microscope (Leica Microsystems, Wetzlar, Germany) using the 63X objective and Type F Immersion Oil (Thorlabs, MOIL-10LF). Images shown are representative of experiments carried out at least three times. Image analysis was performed with ImageJ (v1.51 t). Counting of red and yellow puncta was performed by two independent persons.
Generation of TEX264-FLAG- and FLAG-RETREG1-expressing MZ-54 cells
Lentiviral particles were generated by co-transfecting pMRX-INU-TEX264-FLAG (Addgene, 128258, deposited by Noboru Mizushima), pMRX-INU-TEX264 LIR4A-FLAG (Addgene, 128259, deposited by Noboru Mizushima) or pMRX-INU-FLAG-RETREG1 (Addgene, 128260, deposited by Noboru Mizushima) with pPAX2 (Addgene, 12260, deposited by Didier Trono) and pMD2.G (Addgene, 12259, deposited by Didier Trono) in HEK293T cells using FuGENE® HD (Promega, E2311) according to the manufacturer’s instructions. Viral particles were collected to transduce MZ-54 target cells using spin transduction followed by selection with G418 (Thermo Fisher Scientific, 10131027) at a final concentration of 2 mg/ml for at least two weeks.
Determination of cell death
Cell death was measured by fluorescence-based microscopic analysis of PI uptake using Hoechst 33342 (Sigma-Aldrich, 14533) and PI (Sigma-Aldrich, P4864) double staining and the ImageXpress Micro XLS Widefield High-Content Analysis System and MetaXpress Software (Molecular Devices Sunnyvale, CA, USA) according to the manufacturer’s instructions.
Immunofluorescence analyses
For immunofluorescence staining, cells were seeded on coverslips into Greiner 12-well plates at 30,000 cells/well. Cells were fixed with 3.7% paraformaldehyde (Merck Millipore, 1.04003) for 5 min, followed by a washing step with PBS and permeabilization and blocking with permeabilization buffer (PB) (0.1% saponin [Carl Roth, 9622.1] and 5 mM MgCl2 [Carl Roth, 2189.1] diluted in PBS) supplemented with 10% FCS for 1 h. Cells were incubated with antibodies against LAMP1 (DSHB, 1D4B-s, 1:100 or DSHB, H4A3-s, 1:100), LC3B (Thermo Fisher Scientific, PA1-46286, 1:100 or MBL, M152-3, 1:100), REEP5 (Proteintech, 14643-1-AP, 1:1000), CKAP4/CLIMP-63 (Proteintech, 16686-1-AP, 1:150) or TEX264 (Proteintech, 25858-1-AP, 1:150) in PB supplemented with 5% FCS overnight at 4°C. After three washing steps with PB, cells were incubated with Cy™2 AffiniPure donkey-anti-rabbit IgG (Jackson Immuno Research Laboratories, 711–225-152), goat anti-mouse IgG (H + L) Alexa Fluor 647 (Thermo Fisher Scientific, A-21235) or goat anti-mouse IgG (H + L) Alexa Fluor 555 (Thermo Fisher Scientific, A-28180) diluted 1:500 in PB supplemented with 5% FCS for 2 h. After two washing steps with PB, slides were rinsed in ddH2O followed by mounting with ProLong™ Diamond Antifade Mountant with DAPI (Thermo Fisher Scientific, P36966) and placing on a glass holder. Images were acquired with the Leica SP8 laser-scanning microscope (Leica Microsystems, Wetzlar, Germany) using the 63X objective and Type F Immersion Oil (Thorlabs, MOIL-10LF). Images shown are representative of experiments carried out at least three times. Image analysis was performed with ImageJ (v1.51 t). Counting of puncta or lysosomes engulfing ER material was performed by two independent persons.
Western blot analysis
Western blot analysis was performed as described previously using RIPA buffer (50 mM Tris-HCl (Carl Roth, 9090.3), pH 8, 1% Triton X-100 (Carl Roth, 3051.2), 0.5% sodium deoxycholate (Thermo Fisher Scientific, 89904), 150 mM sodium chloride (Carl Roth, HN00.3) and 2 mM magnesium chloride (Carl Roth, 2189.1) supplemented with Pierce Nuclease (Thermo Fisher Scientific, 88701) [Citation57]. The following antibodies were used: rabbit anti-ATF4 (Cell Signaling Technology, 11815S; 1:1000), monoclonal rabbit anti-ATG7 (Cell Signaling Technology, 8558; 1:500), rabbit anti-ATG5 (Cell Signaling Technology, 2630S; 1:500), rabbit anti-HSPA5/BiP (Cell Signaling Technology, 3183S; 1:500), rabbit anti-CCPG1 (Proteintech, 13861-1-AP; 1:1000), monoclonal mouse anti-DDIT3/CHOP (Cell Signaling Technology, 2895S; 1:500), rabbit anti-CKAP4/CLIMP-63 (Proteintech, 16686-1-AP; 1:5000), rabbit anti-EIF2A/eIF2α (Cell Signaling Technology, 9722S; 1:1000), rabbit anti-RETREG1/FAM134B (Proteintech, 21537-1-AP; 1:1000), rabbit anti-GABARAP (Proteintech, 18723-1-AP; 1:500), rabbit anti-ERN1/IRE1α (Cell Signaling Technology, 3294S; 1:1000), rabbit anti-LC3B (Thermo Fisher Scientific, PAI-16930; 1:2000), rabbit anti-EIF2AK3/PERK (Cell Signaling Technology, 5683S; 1:1000), rabbit anti-phospho(Ser51)-EIF2A/eIF2α (Cell Signaling Technology, 3597S; 1:1000), rabbit anti-REEP5 (Proteintech, 14643-1-AP; 1:1000), rabbit anti-RFP (ChromoTek, 5 f8-20; 1:500), rabbit anti-RTN3 (Proteintech, 12055-2-AP; 1:1000), rabbit anti-SEC62 (Abcam, ab168843), rabbit anti-TEX264 (Proteintech, 25858-1-AP; 1:2000), mouse anti-VCL (Sigma-Aldrich, V9131; 1:2000), and mouse anti-XBP1s (Biolegend, 647502; 1:500). Goat anti-mouse and goat anti-rabbit conjugated to horseradish peroxidase (Abcam, ab6789 and ab6721, respectively) as well as enhanced chemiluminescence (Thermo Fisher Scientific, 32209) were used for detection. To ensure that the obtained bands were within the linear range of detection, multiple exposures were collected. Representative blots of at least two independent experiments are shown.
Co-IP of FLAG and LC3B
To immunoprecipitate endogenous LC3B cells were plated on 15 cm dishes at a density of one million cells per dish. For lysis, cells were washed twice with ice-cold PBS followed by scraping and centrifugation at 793 x g for 5 min at 4°C. Cell pellets were resuspended in 250 µl of IP buffer (50 mM Tris-HCl, pH 7.5, 150 mM NaCl, 1% IGEPAL CA-630/NP-40 [Sigma-Aldrich, 56741], 1 mM EDTA [Carl Roth, 8043.2] supplemented with protease inhibitor cocktail [Sigma-Aldrich, 04693116001], 1 mM sodium orthovanadate [Sigma-Aldrich, 450243] and 1 mM beta-glycerophosphate [Sigma-Aldrich, G6376]) followed by incubation on a rolling wheel for 30 min at 4°C. Lysates were centrifuged at 18,620 x g for 25 min at 4°C. Per sample, 500 µg of protein per sample were diluted with IP buffer to a total volume of 600 µl and 2.5 µl of LC3B antibody (Thermo Fisher Scientific, PA1-16930; rabbit IgG) were incubated with the lysates overnight on a rolling wheel at 4°C. The next day, 20 µl of Dyna Protein G beads (Thermo Fisher Scientific, 10009D) per sample were washed three times in PBST (1 ml PBS + 0.05% Tween-20 [Carl Roth, 9127.2]) with a magnetic rack. Immune complexes were added to the beads for 4 h at 4°C on a rolling wheel. Samples were washed 5 times with IP buffer (without protease inhibitors) by inverting the tubes several times followed by denaturation with 2x SDS-containing loading buffer for 5 min at 96°C.
To immunoprecipitate FLAG-tagged proteins, cells were plated on 15 cm dishes at a density of one million cells per dish. For lysis, cells were washed twice with ice-cold PBS followed by scraping and centrifugation at 793 x g for 5 min at 4°C. Cell pellets were resuspended in 250 µl of FLAG-IP buffer (50 mM Tris-HCl, pH 7.5, 150 mM NaCl, 1% Triton X-100, 1 mM EDTA supplemented with protease inhibitor cocktail, 1 mM sodium orthovanadate and 1 mM beta-glycerophosphate) followed by incubation on a rolling wheel for 30 min at 4°C. Lysates were centrifuged at 18,620 x g for 25 min at 4°C. 40 µl of 50% FLAG M2 magnetic bead suspension (Sigma-Aldrich, M8823) were washed three times with TBS (50 mM Tris HCl, 150 mM NaCl, pH 7.5) per sample. Per sample, 600 µg of protein per sample were diluted with FLAG-IP buffer to a total volume of 1,000 µl and incubated with the beads overnight on a rolling wheel at 4°C. The next day, samples were washed three times with TBS on a magnetic rack. Elution of the protein complexes from the beads was performed by incubation of beads with 3X FLAG peptide (Sigma-Aldrich, F4799) at a final concentration of 150 ng/µl in TBS for 30 min on a rolling wheel at 4°C followed by denaturation with 6x SDS-containing loading buffer for 5 min at 96°C.
Electron microscopy
For conventional transmission electron microscopy, MZ-54 WT cells were treated with the indicated concentrations of the compounds. After 48 h, an equal volume of double-strength fixatives (4% paraformaldehyde, 5% glutaraldehyde in 0.1 M sodium cacodylate buffer [pH 7.4]) was added to the cells for 20 min at room temperature, prior to fixing the cells with one volume of 2% paraformaldehyde and 2.5% glutaraldehyde in 0.1 M sodium cacodylate buffer (pH 7.4) for 2 h at room temperature. Cells were then scraped and embedded as previously described [Citation58]. 70-nm ultra-thin sections were cut using a Leica EM UC7 ultra microtome (Leica Microsystems, Wetzlar, Germany). Sections were stained with uranyl acetate and lead citrate as previously described [Citation58]. Cell sections were analyzed using a CM100bio TEM (FEI, Eindhoven, the Netherlands). The average number of ER-positive and ER-negative autophagosomes per cell section was determined by counting these intracellular structures through 120 cell sections per condition, randomly selected from five independent grids.
Determination of gene expression by quantitative real-time PCR (qRT-PCR)
In order to measure gene expression, MZ-54 cells were seeded in six-well plates at 80,000 cells/well. Total RNA was isolated by using the PeqGold RNA kit (VWR, 732–2871) according to the manufacturer’s instructions. The concentration of RNA was measured with a NanoDrop 1,000 spectrometer (VWR, Darmstadt, Germany). For cDNA synthesis, 500–1,000 ng of RNA were used per sample. RevertAID H Minus First Strand cDNA synthesis kit (Thermo Fisher Scientific, K1632) was used according to the manufacturer’s guidelines using oligo primer (dT) and the following cycles: Start (5 min 25°C), Synthesis (60 min 42°C), Stop (5 min 70°C). cDNA was diluted 1:10 in nuclease-free water. For quantification of transcript levels, SYBR green-based qRT-PCR was performed using the SYBR™ Green PCR Master Mix (Thermo Fisher Scientific, 4309155) and the QuantStudio 7 Flex Real-Time PCR System (Applied Biosystems, Thermo Fisher Scientific, Darmstadt, Germany). qRT-PCR was initiated with 2 min at 50°C, followed by 10 min at 95°C. This was followed by 40 cycles of 15 s at 95°C and 1 min at 60°C. Analysis of the melting curves served as control for the specificity of the amplified products. Relative RNA levels of the analyzed genes were calculated compared to the housekeeping gene RNA28S by using the 2−ΔΔCT-method [Citation59]. At least three independent experiments in technical duplicates or triplicates were performed for each condition. All primers were purchased by Eurofins (Hamburg, Germany): RNA28S, forward: 5ʹ-TTGAAAATCCGGGGGAGAG-3ʹ, reverse: 5ʹ-TTGAAAATCCGGGGGAGAG-3ʹ; MAP1LC3B, forward: 5ʹ-CGCCGCACCTTCGAACA-3ʹ, reverse: 5ʹ-GGTTGGATGCTGCTCTCGAAT-3ʹ; ATG13, forward: 5ʹ-AGACAGTTCGTGTTGGGACAG-3ʹ, reverse: 5ʹ-CTCAAATTGCCTGGTAGACATGA-3ʹ; WIPI1, forward: 5ʹ-ACTAAAGCCGGGTATAAGCTGT-3ʹ, reverse: 5ʹ-CGGGATTTCATTGCTTCCGTG-3ʹ; GABARAP/L1, forward: 5ʹ-ATGAAGTTCCAGTACAAGGAGGA-3ʹ, reverse: 5ʹ-GCTTTTGGAGCCTTCTCTACAAT-3ʹ; ATF4, forward: 5ʹ-GTGGATGGGTTGGTCAGTCCCT-3ʹ, reverse: 5ʹ-AGGGCATCCAAGTCGAACTCCT-3ʹ; TEX264, forward: 5ʹ-GACTGGGCGGCTTTTCACT-3ʹ, reverse: 5ʹ-GGGTTGTCATAGTAGACAGCGA-3ʹ; RETREG1, forward: 5ʹ-GTCTCAGAGGTATCCTGGACTG-3ʹ, reverse: 5ʹ-TTCCTCACTGGGTCGGTCAAGA-3ʹ; CCPG1, forward: 5ʹ-AATGGCACAGTGCTTATGGAA-3ʹ, reverse: 5ʹ-GGTGGCTCAAGGGTAACAATATC-3ʹ; RTN3, forward: 5ʹ-ACTGGGTTTGTCTTTGGCAC-3ʹ, reverse: 5ʹ-ATGACGGACTTGTAGATCCTGA-3ʹ; SEC62, forward: 5ʹ-CCAGCAGAAATGAGAGTAGGTG-3ʹ, reverse: 5ʹ-GAGTCAATGAAGCCCACATCA-3ʹ.
Statistical analysis
Results are expressed as mean ± SEM. Statistical analysis was performed with SigmaPlot (v12.5). Statistical significance of two group data was analyzed by Student’s t-test (two-tailed) or 1-way ANOVA. If samples did not pass either the Shapiro-Wilk Normality Test or the Equal Variance test, statistical significance was analyzed by Mann-Whitney Rank Sum Test, Kruskal-Wallis Rank Sum Test, Dunn’s Test or Holm-Sidak method. p-values were interpreted as follows: *p < 0.05; **p < 0.01; ***p < 0.001.
Supplemental Material
Download MS Word (3.1 MB)Acknowledgments
We thank C. Hugenberg for expert secretarial assistance. We thank I. Dikic for helpful discussions and sharing of reagents along the project.
Disclosure statement
The authors do not have any potential conflicts of interest disclosed.
Supplementary material
Supplemental data for this article can be accessed here.
Additional information
Funding
References
- Doherty J, Baehrecke EH. Life, death and autophagy. Nat Cell Biol. 2018;20:1110–1117.
- Shang L, Chen S, Du F, et al. Nutrient starvation elicits an acute autophagic response mediated by Ulk1 dephosphorylation and its subsequent dissociation from AMPK. Proc Natl Acad Sci U S A. 2011;108:4788–4793.
- Bachar-Wikstrom E, Wikstrom JD, Ariav Y, et al. Stimulation of autophagy improves endoplasmic reticulum stress-induced diabetes. Diabetes. 2013;62:1227–1237.
- Haberzettl P, Hill BG. Oxidized lipids activate autophagy in a JNK-dependent manner by stimulating the endoplasmic reticulum stress response. Redox Biol. 2013;1(1):56–64.
- Bialik S, Dasari SK, Kimchi A. Autophagy-dependent cell death - where, how and why a cell eats itself to death. J Cell Sci. 2018;131(18).
- Dasari SK, Bialik S, Levin-Zaidman S, et al. Signalome-wide RNAi screen identifies GBA1 as a positive mediator of autophagic cell death. Cell Death Differ. 2017;24:1288–1302.
- Zielke S, Meyer N, Mari M, et al. Loperamide, pimozide, and STF-62247 trigger autophagy-dependent cell death in glioblastoma cells. Cell Death Dis. 2018;9:994.
- Salazar M, Carracedo A, Salanueva IJ, et al. Cannabinoid action induces autophagy-mediated cell death through stimulation of ER stress in human glioma cells. J Clin Invest. 2009;119:1359–1372.
- Han B, Yu YQ, Yang QL, et al. Kaempferol induces autophagic cell death of hepatocellular carcinoma cells via activating AMPK signaling. Oncotarget. 2017;8:86227–86239.
- Shchors K, Massaras A, Hanahan D. Dual targeting of the autophagic regulatory circuitry in gliomas with repurposed drugs elicits cell-lethal autophagy and therapeutic benefit. Cancer Cell. 2015;28:456–471.
- Kogel D, Fulda S, Mittelbronn M. Therapeutic exploitation of apoptosis and autophagy for glioblastoma. Anticancer Agents Med Chem. 2010;10:438–449.
- Kaza N, Kohli L, Roth KA. Autophagy in brain tumors: a new target for therapeutic intervention. Brain Pathol. 2012;22:89–98.
- Rubiolo JA, Lopez-Alonso H, Martinez P, et al. Yessotoxin induces ER-stress followed by autophagic cell death in glioma cells mediated by mTOR and BNIP3. Cell Signal. 2014;26:419–432.
- Hwang MS, Baek WK. Glucosamine induces autophagic cell death through the stimulation of ER stress in human glioma cancer cells. Biochem Biophys Res Commun. 2010;399:111–116.
- Walter P, Ron D. The unfolded protein response: from stress pathway to homeostatic regulation. Science. 2011;334:1081–1086.
- Wang M, Kaufman RJ. Protein misfolding in the endoplasmic reticulum as a conduit to human disease. Nature. 2016;529:326–335.
- Chambers JE, Marciniak SJ. Cellular mechanisms of endoplasmic reticulum stress signaling in health and disease. 2. Protein misfolding and ER stress. Am J Physiol Cell Physiol. 2014;307:C657–70.
- Wilkinson S. Emerging principles of selective ER autophagy. J Mol Biol. 2020;432:185–205.
- Deegan S, Saveljeva S, Gorman AM, et al. Stress-induced self-cannibalism: on the regulation of autophagy by endoplasmic reticulum stress. Cell Mol Life Sci. 2013;70:2425–2441.
- Harding HP, Zhang Y, Bertolotti A, et al. Perk is essential for translational regulation and cell survival during the unfolded protein response. Mol Cell. 2000;5:897–904.
- Harding HP, Zhang Y, Zeng H, et al. An integrated stress response regulates amino acid metabolism and resistance to oxidative stress. Mol Cell. 2003;11:619–633.
- Szegezdi E, Logue SE, Gorman AM, et al. Mediators of endoplasmic reticulum stress-induced apoptosis. EMBO Rep. 2006;7:880–885.
- Pakos-Zebrucka K, Koryga I, Mnich K, et al. The integrated stress response. EMBO Rep. 2016;17:1374–1395.
- Wilkinson S. ER-phagy: shaping up and destressing the endoplasmic reticulum. Febs J. 2019;286:2645–2663.
- Stolz A, Grumati P. The various shades of ER-phagy. Febs J. 2019;286:4642–4649.
- Khaminets A, Heinrich T, Mari M, et al. Regulation of endoplasmic reticulum turnover by selective autophagy. Nature. 2015;522:354–358.
- Grumati P, Morozzi G, Holper S, et al. Full length RTN3 regulates turnover of tubular endoplasmic reticulum via selective autophagy. Elife. 2017;6:pii: e25555.
- Fumagalli F, Noack J, Bergmann TJ, et al. Translocon component Sec62 acts in endoplasmic reticulum turnover during stress recovery. Nat Cell Biol. 2016;18:1173–1184.
- Smith MD, Harley ME, Kemp AJ, et al. CCPG1 is a non-canonical autophagy cargo receptor essential for ER-phagy and pancreatic ER proteostasis. Dev Cell. 2018;44:217–32.e11.
- Chen Q, Xiao Y, Chai P, et al. ATL3 is a tubular ER-phagy receptor for GABARAP-mediated selective autophagy. Curr Biol. 2019;29:846–55 e6.
- An H, Ordureau A, Paulo JA, et al. TEX264 is an endoplasmic reticulum-resident ATG8-interacting protein critical for ER remodeling during nutrient stress. Mol Cell. 2019;74:891–908 e10.
- Chino H, Hatta T, Natsume T, et al. Intrinsically disordered protein TEX264 mediates ER-phagy. Mol Cell. 2019;74:909–21 e6.
- Hetz C, Papa FR. The unfolded protein response and cell fate control. Mol Cell. 2018;69:169–181.
- Klionsky DJ, Abdelmohsen K, Abe A, et al. Guidelines for the use and interpretation of assays for monitoring autophagy (3rd edition). Autophagy. 2016;12:1–222.
- Luhr M, Torgersen ML, Szalai P, et al. The kinase PERK and the transcription factor ATF4 play distinct and essential roles in autophagy resulting from tunicamycin-induced ER stress. J Biol Chem. 2019;294:8197–8217.
- Gatica D, Lahiri V, Klionsky DJ. Cargo recognition and degradation by selective autophagy. Nat Cell Biol. 2018;20:233–242.
- Beese CJ, Brynjolfsdottir SH, Frankel LB. Selective autophagy of the protein homeostasis machinery: ribophagy, proteaphagy and er-phagy. Front Cell Dev Biol. 2019;7:373.
- Hubner CA, Dikic I. ER-phagy and human diseases. Cell Death Differ. 2020;27:833–842.
- Stolz A, Ernst A, Dikic I. Cargo recognition and trafficking in selective autophagy. Nat Cell Biol. 2014;16:495–501.
- Forrester A, De Leonibus C, Grumati P, et al. A selective ER-phagy exerts procollagen quality control via a Calnexin-FAM134B complex. Embo J. 2019;38(2).
- Liao Y, Duan B, Zhang Y, et al. Excessive ER-phagy mediated by the autophagy receptor FAM134B results in ER stress, the unfolded protein response, and cell death in HeLa cells. J Biol Chem. 2019;294:20009–20023.
- Koenig U, Robenek H, Barresi C, et al. Cell death induced autophagy contributes to terminal differentiation of skin and skin appendages. Autophagy. 2020;16(5):932–945.
- Rouillard AD, Gundersen GW, Fernandez NF, et al. The harmonizome: a collection of processed datasets gathered to serve and mine knowledge about genes and proteins. Database (Oxford). 2016;2016:baw100.
- Rzymski T, Milani M, Pike L, et al. Regulation of autophagy by ATF4 in response to severe hypoxia. Oncogene. 2010;29:4424–4435.
- Yorimitsu T, Nair U, Yang Z, et al. Endoplasmic reticulum stress triggers autophagy. J Biol Chem. 2006;281:30299–30304.
- Kim IY, Shim MJ, Lee DM, et al. Loperamide overcomes the resistance of colon cancer cells to bortezomib by inducing CHOP-mediated paraptosis-like cell death. Biochem Pharmacol. 2019;162:41–54.
- Donnelly N, Gorman AM, Gupta S, et al. The eIF2alpha kinases: their structures and functions. Cell Mol Life Sci. 2013;70:3493–3511.
- Zhu P, Xue J, Zhang ZJ, et al. Helicobacter pylori VacA induces autophagic cell death in gastric epithelial cells via the endoplasmic reticulum stress pathway. Cell Death Dis. 2017;8:3207.
- Tang B, Li Q, Zhao XH, et al. Shiga toxins induce autophagic cell death in intestinal epithelial cells via the endoplasmic reticulum stress pathway. Autophagy. 2015;11:344–354.
- Li S, Guo L, Qian P, et al. Lipopolysaccharide induces autophagic cell death through the perk-dependent branch of the unfolded protein response in human alveolar epithelial A549 cells. Cell Physiol Biochem. 2015;36:2403–2417.
- Liang C, Li H, Zhou H, et al. Recombinant Lz-8 from Ganoderma lucidum induces endoplasmic reticulum stress-mediated autophagic cell death in SGC-7901 human gastric cancer cells. Oncol Rep. 2012;27:1079–1089.
- Bhaskara RM, Grumati P, Garcia-Pardo J, et al. Curvature induction and membrane remodeling by FAM134B reticulon homology domain assist selective ER-phagy. Nat Commun. 2019;10:2370.
- Fregno I, Fasana E, Bergmann TJ, et al. ER-to-lysosome-associated degradation of proteasome-resistant ATZ polymers occurs via receptor-mediated vesicular transport. Embo J. 2018;37:e99259.
- Schwarz DS, Blower MD. The endoplasmic reticulum: structure, function and response to cellular signaling. Cell Mol Life Sci. 2016;73:79–94.
- Voss V, Senft C, Lang V, et al. The pan-Bcl-2 inhibitor (-)-gossypol triggers autophagic cell death in malignant glioma. Mol Cancer Res. 2010;8:1002–1016.
- Meyer N, Zielke S, Michaelis JB, et al. AT 101 induces early mitochondrial dysfunction and HMOX1 (heme oxygenase 1) to trigger mitophagic cell death in glioma cells. Autophagy. 2018;14:1693–1709.
- Faqar-Uz-Zaman SF, Heinicke U, Meister MT, et al. BCL-xL-selective BH3 mimetic sensitizes rhabdomyosarcoma cells to chemotherapeutics by activation of the mitochondrial pathway of apoptosis. Cancer Lett. 2018;412:131–142.
- Verheije MH. Mouse hepatitis coronavirus RNA replication depends on GBF1-mediated ARF1 activation. PloS Pathog. 2008;4(6): e1000088.
- Livak KJ, Schmittgen TD. Analysis of relative gene expression data using real-time quantitative PCR and the 2(-Delta Delta C(T)) method. Methods. 2001;25:402–408.