
ABSTRACT
TFE3 (transcription factor binding to IGHM enhancer 3) nuclear translocation and transcriptional activity has been implicated in PINK1-PRKN/parkin-dependent mitophagy. However, the transcriptional control governing the mitophagy in TFE3/Xp11.2 translocation renal cell carcinoma (TFE3 tRCC) is largely unknown. Here, we investigated the role and mechanisms of PRCC-TFE3 fusion protein, one of TFE3 fusion types in TFE3 tRCC, in governing mitophagy to promote development of PRCC-TFE3 tRCC. We observed and analyzed mitophagy, transcriptional control of PRCC-TFE3 on PINK1-PRKN-dependent mitophagy, PRCC-TFE3 fusions nuclear translocation, cancer cell survival and proliferation under mitochondrial oxidative damage in PRCC-TFE3 tRCC cell line. We found that nuclear-aggregated PRCC-TFE3 fusions constitutively activated expression of the target gene E3 ubiquitin ligase PRKN, leading to rapid PINK1-PRKN-dependent mitophagy that promoted cell survival under mitochondrial oxidative damage as well as cell proliferation through decreasing mitochondrial ROS formation. However, nuclear translocation of TFE3 fusions escaped from PINK1-PRKN-dependent mitophagy. Furthermore, we confirmed that PRCC-TFE3 fusion accelerated mitochondrial turnover by activating PPARGC1A/PGC1α-NRF1. In conclusion, our findings indicated a major role of PRCC-TFE3 fusion-mediated mitophagy and mitochondrial biogenesis in promoting proliferation of PRCC-TFE3 tRCC.
Introduction
TFE3 (transcription factor E3) Xp11.2 translocation renal cell carcinoma (TFE3-tRCC) is defined as an independent subtype of RCC by WHO in 2004 and is classified into MiT/TFE family (microphthalmia family of bHLH-LZ transcription factors) tRCC. TFE3-tRCC is characterized by Xp11.2 rearrangements that create TFE3 gene fusions with a variety of partner genes and distinctive morphological features. PRCC-TFE3, t(X;1)(p11.2;q21.2), is the first described TFE3-tRCC in a pediatric RCC case in 1986 and is confirmed in 1995 [Citation1,Citation2]. Native TFE3 belongs to MiT/TFE transcription factors family and shares a similar structure with other 3 members: MITF, TFEB and TFEC, including the basic motif for DNA binding, highly similar helix-loop-helix (HLH) and leucine-zipper (Zip) regions for their dimerization. Besides, TFE3, TFEB and MITF also contain a conserved activation domain for its transcriptional activation. Dimerized MiT/TFE proteins can not only bind the palindromic CACGTG E-box like other bHLH-Zip transcription factors [Citation3] but also specifically bind the asymmetric TCATGTG M-box response elements presenting in the promoter region of their target genes [Citation4]. All TFE3 fusion genes encode in-frame chimeric proteins, which retain the bHLH-Zip domain of TFE3 [Citation5]. Nuclear aggregation of TFE3 is one of the most significant histopathological characteristics of TFE3-tRCC [Citation6]. The strong evidence supports that TFE3 fusions are oncogenes with constitutively active transcriptional activity.
Multiple studies have revealed the MiT/TFE proteins play a pivotal role in the regulation of autophagy and lysosomal biogenesis. The promoter analysis of lysosomal genes reveals that their promotors share a common 10-base E-box-like palindromic sequence (GTCACGTGAC), named Coordinated Lysosomal Expression and Regulation (CLEAR) element [Citation7], to which TFE3 and TFEB can directly bind and promote expression of these genes. Mitophagy is a form of evolutionarily conserved macroautophagy by which damaged, aged, or superfluous mitochondria are eliminated [Citation8]. PINK1 (PTEN induced kinase 1)-PRKN (parkin RBR E3 ubiquitin protein ligase) axis is often considered as the most studied pathway of mitophagy [Citation9]. Under conditions of loss of mitochondrial membrane potential, PINK1 induces recruitment of the cytosolic PRKN to the outer mitochondrial membrane [Citation10], where PRKN ubiquitinates outer-mitochondrial-membrane proteins to initiate recruitment of the autophagy machinery to capture and engulf specific mitochondria and degrade them in lysosomes [Citation11]. Interestingly, mitophagy can induce nuclear translocation of TFE3 in a process that requires PRKN and PINK1 [Citation12]. Depletion of all members of the MiT/TFE family causes impaired degradation of damaged mitochondria [Citation12]. In addition, the positive transcriptional feedback loop between PPARGC1A/PGC1-α (PPARG coactivator 1 alpha) and TFE3 plays a critical role in modulating mitochondrial quality and function in different tissues [Citation13,Citation14]. However, the transcriptional control governing the mitophagy in TFE3 tRCC is largely unknown. Moreover, the exact step that TFE3 fusions regulate mitochondrial quality and function in development of TFE3 tRCC also remains poorly understood.
Intracellular redox homeostasis is regulated by a balanced status between generation and elimination of reactive oxygen species (ROS) [Citation15]. ROS, as second messenger, not only induces cell apoptosis but also allows cells to adapt to environment, especially in cancer cells [Citation16]. As an important organelle for ROS production, mitochondria can generate ROS from the electron transport chain (ETC) during the ATP synthesis process [Citation16]. Some cancer cells can significantly increase the ATP production for their elevated proliferation and migration as well as the ROS generation [Citation17], thus cancer cells must develop a highly efficient mechanism, such as antioxidant system, to eliminate ROS. However, upon electron leakage of the ETC when mitochondria are damaged, excess ROS that cannot be removed in time will attack mitochondria themselves, leading to cell apoptosis by inducing the opening of the mitochondrial permeability transition pore and the release of CYCS (cytochrome c, somatic) [Citation18]. Therefore, degradation of damaged mitochondria by mitophagy plays crucial role in promoting cell survival under oxidative stress.
In the present study, we found that PRCC-TFE3 tRCC was selectively insensitive to being killed by the mitochondrial ROS inducer. PRKN, as target gene of nuclear-aggregated PRCC-TFE3 fusion, was constitutively activated expression. However, nuclear translocation of TFE3 fusions escaped from PRKN-dependent mitophagy. By driving PRKN-dependent mitophagy and accelerating mitochondria biosynthesis via PPARGC1A and NRF1 pathway to decrease mitochondrial ROS generation, PRCC-TFE3 fusions promoted cell survival and proliferation in PRCC-TFE3 tRCC.
Results
PRCC-TFE3 tRCC is selectively insensitive to being killed by the mitochondrial ROS inducer
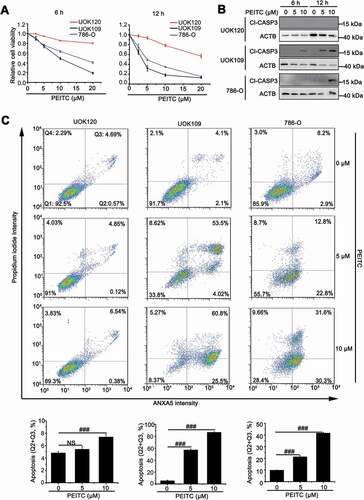
ROS can contribute to tumorigenesis and promote pro-oncogenic signaling in cancer cells [Citation19]. However, high ROS levels are also an impediment to tumor progression and metastasis through attacking vital cellular components, including mitochondria [Citation20–22]. We utilized three human kidney cancer cell lines: renal clear cell carcinoma cell line (786-O), NONO-TFE3 tRCC cell line (UOK109) and PRCC-TFE3 tRCC cell line (UOK120), treated with E-phenylethyl isothiocyanate (PEITC), a natural compound that is known to increase intracellular ROS generated from mitochondria [Citation23]. We found that 786-O and UOK109 cells were more vulnerable to PEITC-induced ROS, leading to cell death than UOK120 cells ()). The cleaved-CASP3 (Cl-CASP3) protein increased significantly in UOK109 and 786-O cells, while was undetectable in UOK120 cells under the same condition ()). Similarly, flow cytometric analysis showed that incubation with multi-concentration of PEITC caused more cell apoptosis in UOK109 and 786-O cells ()), further confirming with the data of ). These data indicate that PRCC-TFE3 tRCC may have specific mechanism to protect cells from ROS attacking, which is likely associated with mitochondrial function.
Figure 1. UOK120 cells is insensitive to PEITC-induced cell apoptosis. (A) UOK109, UOK120 and 786-O cells were treated with different doses of PEITC (5 μM and 10 μM) for 6 h or 12 h, and then cell viability was examined by CCK-8 kit. (B) UOK109, UOK120 and 786-O cells were treated with different doses of PEITC (5 μM and 10 μM) for 6 h or 12 h, and then cleaved-CASP3 (Cl-CASP3) was examined by western blot. ACTB was used as a loading control. (C) UOK109, UOK120 and 786-O cells were treated with different doses of PEITC (5 μM and 10 μM) for 12 h, and then cell apoptosis was determined by propidium iodide (PI) and ANXA5/annexin V staining using flow cytometry. Down panel: quantified viable apoptotic cell and viable apoptotic cell. Data are presented as mean ± s.e.m from 3 independent experiments. #p < 0.05, ##p < 0.01, ###p < 0.001 (One-way ANOVA with Dunnett posttests). NS, no significance
Amplification of PRKN boosts mitophagy in PRCC-TFE3 tRCC
ROS can induce mitochondrial depolarization and initiate PINK1-PRKN-dependent mitophagy [Citation24,Citation25] that protects the cell against apoptosis due to releasing CYCS from damaged mitochondria [Citation26]. We firstly measured the expression levels of PRKN in HK-2, 786-O, UOK109 and UOK120 cell lines. To our surprise, the highest expression level of PRKN was observed in UOK120 cells ()), further confirmed in human tissue samples, including paracancerous tissue, RCC, PRCC-TFE3 tRCC and NONO-TFE3 tRCC, by immunofluorescenc staining ()). In some cancers, deletion and mutation of PRKN often occurs [Citation27]; however, the whole-exome sequencing revealed no mutation on PRKN in UOK120 cells (Table S2).
Figure 2. Amplification of PRKN boosts mitophagy in UOK120 cells. (A) Representative blots of PRKN in HK-2, UOK109, UOK120 and 786-O cells. (B) Densitometric analysis of PRKN:GAPDH in (A). Data are presented as mean ± s.e.m from 3 independent experiments. #p < 0.05, ##p < 0.01, ###p < 0.001 (One-way ANOVA with Dunnett posttests). (C) Analysis of the mRNA levels of PRKN by real-time PCR in HK-2, UOK109, UOK120 and 786-O cells. Data are presented as mean ± s.e.m from 3 independent experiments. #p < 0.05, ##p < 0.01, ###p < 0.001 (One-way ANOVA with Dunnett posttests). (D) Renal paracancerous tissues, Xp11.2 tRCC, or RCC tissue were sectioned and stained with a fluorescent anti-PRKN antibody (green) and counter stained with DAPI to reveal nuclei, followed by immunofluorescence photomicrographic analysis. Scale bars: 30 μm. (E) UOK120 cells were infected with Lenti.shRNA (NC) or Lenti.shRNA (PRKN), and then PRKN, LC3-II and COX4I1 were examined by western blot after treatment with CCCP (10 μM) for 6 h in the presence or absence of HCQ (30 μM). (F) Densitometric analysis of COX4I1:GAPDH (upper) and LC3-II:GAPDH (down). Data are presented as mean ± s.e.m from 3 independent experiments. #p < 0.05, ##p < 0.01, ###p < 0.001 (One-way ANOVA with Dunnett posttests). (G) UOK120 cells were infected with Lenti.shRNA (NC) or Lenti.shRNA (PRKN), and then PRKN, LC3-II and COX4I1 were examined by western blot after treatment with CCCP (10 μM) for 6 h in the presence or absence of Baf A1 (200 nM). (H) UOK120 cells were infected with Lenti.shRNA (NC) or Lenti.shRNA (PRKN) followed by staining with the Mtphagy dye and MitoTracker Deep Red, and then visualization of Mtphagy dye and MitoTracker Deep Red using live-cell imaging microscopy after treatment with CCCP (10 μM) for 12 h. Scale bars: 20 μm. Right panel, quantification of acidic (red-only) mitochondria in different group, data are presented as mean ± s.e.m from 3 independent experiments (10 cells/group). GAPDH was used as a loading control. *p < 0.05, **p < 0.01, ***p < 0.001 (two-tailed t-test). NS, no significance
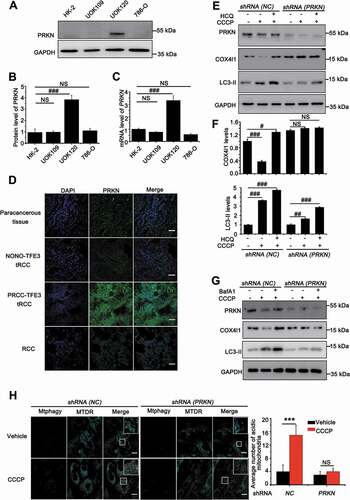
In order to observe whether the non-mutated PRKN could promote mitophagy, we employed UOK109, UOK120 and 786-O cell lines and treated with different doses of PEITC. Full-length PINK1 (63 kD) accumulation on mitochondria is both necessary and sufficient for PRKN recruitment to mitochondria to initiate mitophagy [Citation9,Citation10]. Therefore, we detected full-length of PINK1 after treatment of different doses of PEITC. The results showed that PINK1 (63 kD) was significantly increased in UOK120 and UOK109 cells. Meanwhile, the level of MAP1LC3/LC3-II was significantly increased with treatment of PEITC in UOK120 cells, but there was no obvious increase in UOK109 and 786-O cells (Fig. S1A and S1B). Furthermore, isolation of cytosolic and mitochondrial fractions revealed that carbonyl cyanide 3-chlorophenylhydrazone (CCCP, a mitochondrial depolarized inducer that can induce PINK1-PRKN-dependent mitophagy) and PEITC treatment induced robust mitochondrial translocation of PRKN in UOK120 cells (Fig. S1C). To determine the role of PRKN on mitophagy regulation in tRCC, we designed shRNA (PRKN) according to a previous report [Citation28] and confirmed that the shRNA (PRKN) used in this study could target PRKN in UOK120 cells. Mitophagy levels under basal conditions or treatment with mitophagy inducers (CCCP) were checked in UOK120 cells infected with shRNAs targeting PRKN (shRNA [PRKN]) or control shRNAs (shRNA [NC]) with lentivirus. As shown in ), the level of MAP1LC3/LC3-II formation and COX4I1/COX4 degradation increased in the CCCP-treated group, however, the effect was reversed in UOK120 cells infected with Lenti.shRNA(PRKN). When hydroxychloroquine (HCQ) was employed to inhibit activity of lysosome for detection mitophagic flux, we found that mitophagic flux was significantly decreased in Lenti.shRNA(PRKN) group. A recent report indicates that HCQ may cause unconventional LC3 lipidation [Citation29,Citation30]. Thus, we used another lysosomal inhibitor, bafilomycin A1 (Baf A1), to inhibit lysosomal activity. Similarly, more accumulated MAP1LC3/LC3-II was observed upon treatment with Baf A1 ()) in Lenti.shRNA(NC) group than in Lenti.shRNA(PRKN) group. Similarly, the knockdown of PRKN also repressed the level of mitophagy with treatment of PEITC (Fig. S1D). Mtphagy dye is utilized to probe mitochondria, which emits a high fluorescence in acidic environment when damaged mitochondria fuse to the lysosome instead of a weak fluorescence in intact mitochondria under neutral environment [Citation31–33]. Quantitative analysis showed that the knockdown of PRKN significantly decreased the number of acidic mitochondria induced by CCCP, indicating mitophagy was repressed ()). Furthermore, depolarized mitochondria, induced by CCCP, could co-locate with MAP1LC3/LC3 in shRNA (NC) group; however, the effect was significantly repressed in shRNA (PRKN) group (Fig. S2). These data demonstrate that amplification of non-mutated PRKN boosts mitophagy in PRCC-TFE3 tRCC.
Exogenous expression of PRKN represses cell apoptosis in UOK109 cells
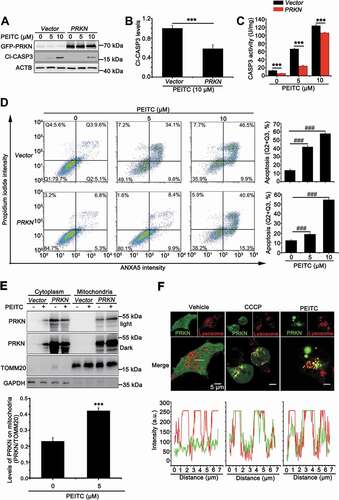
In order to further elucidate the role of PRKN in repressing cell apoptosis, we overexpressed PRKN in UOK109 cells that were more sensitive to PEITC treatment. As shown in ), the Cl-CASP3 was significantly increased in a dose-dependent manner; however, this effect was repressed dramatically with overexpression of PRKN. In addition, CASP3 activity assay and flow cytometry for apoptosis also showed that cell apoptosis decreased in PRKN-overexpressed UOK109 cells ()). Consistently, deletion of PRKN could increase the sensitivity of UOK120 to PEITC and this effect could be reversed by N-acetyl-L-cysteine (NAC, a scavenger of ROS) treatment (Fig. S3A and S3B). Our results showed that PINK1 (63 kD) could accumulate on mitochondria under treatment of PEITC in UOK109 and UOK120 cells (Fig. S1A). To dissect whether PINK1-PRKN-dependent mitophagy plays a vital role in the process of cell apoptosis, PEITC was utilized to treat UOK109 cells with PRKN overexpression or not. Isolation of cytosolic and mitochondrial fractions revealed that PRKN significantly translocated to mitochondria with treatment of PEITC ()). Moreover, live-cell imaging showed that both PEITC and CCCP treatment could induce PRKN and lysosome colocalization ()), which indicated that the overexpressed PRKN participated in PINK1-PRKN mitophagy under treatment of PEITC. Therefore, PRKN can attenuate cell apoptosis induced by PEITC through PINK1-PRKN dependent mitophagy.
Figure 3. Overexpression of PRKN protects UOK109 cells from PEITC-induced cell apoptosis. (A) UOK109 cells were infected with Lenti.GFP-Vector or Lenti.GFP-PRKN, and then cleave-CASP3 (Cl-CASP3) was examined by western blot after treated with different doses of PEITC (5 μM and 10 μM) for 12 h. (B) Densitometric analysis of cleave-CASP3 in (A). Data are presented as mean ± s.e.m from 3 independent experiments. *p < 0.05, **p < 0.01, ***p < 0.001 (two-tailed t-test). (C) UOK109 cells were infected with Lenti.GFP-Vector or Lenti.GFP-PRKN, and then CASP3 activity was examined by CASP3 activity detecting kit after treatment with different doses of PEITC (5 μM and 10 μM) for 12 h. Data are presented as mean ± s.e.m from 3 independent experiments. *p < 0.05, **p < 0.01, ***p < 0.001 (two-tailed t-test). (D) UOK109 cells were infected with Lenti.Vector or Lenti.PRKN, and then cell apoptosis was determined by propidium iodide (PI) and ANXA5 staining using flow cytometry after treated with different doses of PEITC (5 μM and 10 μM) for 12 h. Right panel: quantified viable apoptotic cell and viable apoptotic cell. Data are presented as mean ± s.e.m from 3 independent experiments. #p < 0.05, ##p < 0.01, ###p < 0.001 (One-way ANOVA with Dunnett posttests). Q1: viable cell, Q2: viable apoptotic cell, Q3: non-viable apoptotic cell, Q4: non-viable non-apoptotic cell. (E) UOK109 cells were infected with Lenti.Vector or Lenti.PRKN and then subjected to mitochondrial-cytoplasmic fractionation after treatment with treatment with PEITC (5 μM) for 6 h. Down panel: Densitometric analysis of PRKN in mitochondrial fraction. Data are presented as mean ± s.e.m from 3 independent experiments. *p < 0.05, **p < 0.01, ***p < 0.001 (two-tailed t-test) (F) UOK109 cells were infected with Lenti.GFP-PRKN and pre-loaded with LysoTracker Red before treatment with CCCP (10 μM) or PEITC (5 μM) for 6 h, followed by visualization of GFP and LysoTracker Red using live-cell imaging microscopy. Down panel: the merge images were subject to Z-axis profile analysis. ACTB was used as a loading control. NS, no significance
Nuclear translocation of TFE3 fusions escapes from PINK1-PRKN-dependent mitophagy
Since PINK1-PRKN-dependent mitophagy can induce nuclear translocation of TFE3 [Citation12], we next determined the role of PINK1-PRKN-dependent mitophagy on nuclear translocation of PRCC-TFE3. We utilized CCCP to induce PINK1-PRKN-dependent mitophagy and observed that PRCC-TFE3 fusions and NONO-TFE3 fusions accumulated in nucleus regardless of CCCP treatment ()). Isolation of cytosolic and nuclear fractions also revealed that PRCC-TFE3 fusions and NONO-TFE3 fusions were aggregated in nucleus ()). These data indicated that PINK-PRKN-dependent mitophagy could not induce nuclear translocation of PRCC-TFE3. To rule out the effect of PRKN on nuclear translocation of PRCC-TFE3, we further knocked down PRKN expression and observed that PRKN knockdown did not affect nuclear aggregation of PRCC-TFE3 by immunofluorescence staining ()).
Figure 4. Nuclear translocation of PRCC-TFE3 escapes from the regulation of PRKN-dependent mitophagy. (A) HK-2, UOK109, UOK120, or 786-O cells were treated with vehicle (DMSO) or CCCP (10 μM) for 6 h before immobilization and staining with a fluorescent anti-TFE3 antibody (red), followed by immunofluorescence photomicrographic analysis. Scale bars: 10 μm. (B) HK-2, UOK109 and UOK120 cells were fractionated and TFE3 was detected by western blot in nuclear fraction and cytoplasm fraction. N, nuclear fraction; C, cytoplasm fraction. (C) UOK120 cells were infected with Lenti.shRNA (NC) or Lenti.shRNA (PRKN) before immobilization and staining with a fluorescent anti-TFE3 antibody (red), followed by immunofluorescence photomicrographic analysis. Scale bars: 20 μm. (D) HEK293T cells were transiently transfected with constructs expressing PRCC (exon1)-RFP, PRCC (NLS)-RFP, RFP-tTFE3 (TFE3 fragment of PRCC-TFE3), or tTFE3-RFP, followed by visualization of RFP distribution using live-cell imaging microscopy. Scale bars: 10 μm. (E) RFP-tTFE3- and tTFE3-RFP-transfected cells as in (D) were fractionated and tTFE3 was detected by western blot in nuclear fraction and cytoplasm fraction. N, nuclear fraction; C, cytoplasm fraction
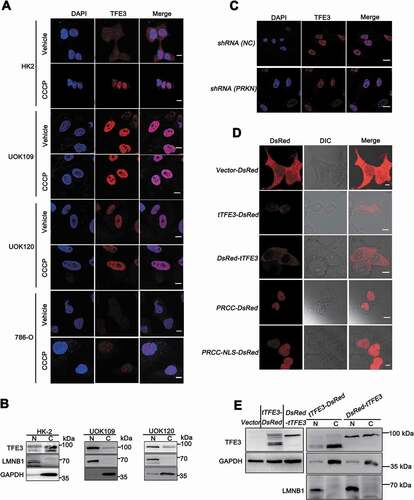
Because nuclear location signal (NLS) occurs in TFE3 fusion fragment, we wondered whether NLS of TFE3 mediated PRCC-TFE3 fusions nuclear accumulation. Expression constructs harboring the red fluorescent protein (RFP)-tagged TFE3 fragment showed that TFE3 fragment of NONO-TFE3, but not TFE3 fragment of PRCC-TFE3, could mediate RFP nuclear translocation (), upper panel and Fig. S4A). Isolation of cytosolic and nuclear fractions showed that TFE3 fragment of PRCC-TFE3 did not aggregate in nucleus () and S4C). PRCC, as a nuclear protein, plays a role in pre-mRNA splicing, which also possesses NLS in PRCC fragment [Citation34,Citation35]. Expression constructs carrying PRCC first exon and PRCC-NLS coding sequences of RFP-tagged were transiently transfected into HEK293T cells, respectively. Then, the subcellular localization was determined by direct visualization of the fluorescent RFP tag. Both PRCC and PRCC-NLS transfectants showed fluorescence in the nucleus (), down panel). Based on these results, we concluded that NLS of PRCC contributed to the nuclear location of PRCC-TFE3. Collectively, these data indicate that nuclear translocation of TFE3 fusions escapes from PRKN-dependent mitophagy, and NLS of PRCC fragment, but not PRKN-dependent mitophagy, mediates nuclear translocation of PRCC-TFE3.
PRKN is the target gene of TFE3 and PRCC-TFE3
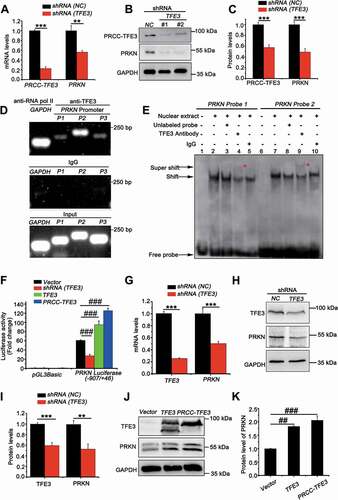
Since TFE3 fusions are oncogenes with constitutively active transcriptional activity, we wondered whether PRCC-TFE3 could induce upregulation of PRKN. We transfected shRNA (TFE3) with lentivirus, which has been validated in our previous study [Citation36]. To our surprise, both mRNA and protein expression of PRKN were repressed ()). Interestingly, PRKN was negatively regulated by NONO-TFE3 in UOK109 cells (Fig. S5A). These data suggested that nuclear-aggregated PRCC-TFE3 might upregulate expression of PRKN in PRCC-TFE3 tRCC directly. It is found that PRKN promoter contains E-Box motif [Citation37], which TFE3 can bind to [Citation3]. Meanwhile, ChIP-seq results show that TFE3 can bind to PRKN promoter [Citation38]. In order to verify that TFE3 could transcriptionally regulate expression of PRKN, firstly, we utilized Jasper online analysis software to analyze PRKN promoter (−1000/+100) and nine potential binding sites were found (Table S1D). Further, both chromatin immunoprecipitation PCR and electrophoretic mobility shift assay (EMSA) in vivo and in vitro revealed that a significant enrichment of immunoprecipitated PRKN promoter fragments (P1: −109/-8, P2: −397/-388, P3: −673/-657) was obtained using specific TFE3 antibody, compared with to IgG antibody control samples ()). To identify that TFE3 could bind to the putative recognition sequences, we designed two biotin-labeled double-strand oligonucleotide probes for EMSA according to the results of ChIP-PCR. Electrophoretic analysis of the binding products showed that probe 1 and 2 had slower migrating bands containing DNA-protein complex (), lane 2 and 7). The TFE3 antibody supershifted these complexes (), lane 4 and 9) and the IgG did not specifically supershift those complexes (), lanes 5 and 10). Although supershift band of the probe 1 was weaker than that of probe 2, the results indicated TFE3 could bind to the promoter of PRKN. To clarify the binding was functional, we used a luciferase reporter plasmid driven by the human PRKN promoter region (−970/+63). When cells were transiently co-transfected with this reporter along with shRNA (TFE3), a significant decrease in reporter activity was observed. However, the effect was reversed when TFE3 or PRCC-TFE3 was overexpressed ()). Meanwhile, we knocked down TFE3 in HEK293T cells and found mRNA and protein levels of PRKN were decreased significantly ()). Overexpression of TFE3 and PRCC-TFE3 in HEK293T cells further increased expression of PRKN ()). However, Overexpression of PRCC-TFE3 did not increase the expression of PRKN in UOK109 and 786-O (Fig. S5B). Taken together, TFE3 can positively regulate expression of PRKN and PRCC-TFE3 can constitutively activate PRKN expression.
Figure 5. PRKN is the target gene of TFE3 and PRCC-TFE3. (A) UOK120 cells were infected with Lenti.shRNA (NC) or Lenti.shRNA (TFE3), followed by analysis of the mRNA levels of PRKN and PRCC-TFE3 by real-time PCR. Data are presented as mean ± s.e.m from 3 independent experiments. *p < 0.05, **p < 0.01, ***p < 0.001 (two-tailed t-test). (B) UOK120 cells were infected with Lenti.shRNA (NC) or Lenti.shRNA (TFE3) and PRKN and PRCC-TFE3 were examined by western blot. (C) Densitometric analysis of PRCC-TFE3:GAPDH and PRKN:GAPDH. Data are presented as mean ± s.e.m from 3 independent experiments. *p < 0.05, **p < 0.01, ***p < 0.001 (two-tailed t-test). (D) HEK293T cells were analyzed by the ChIP assay using an anti-TFE3 antibody and immunoprecipitated DNA fragments were amplified by PCR. P1, PRKN promoter region (−109/-8); P2, PRKN promoter region (−397/-388) and P3, PRKN promoter region (−673/-657). (E) TFE3 binding was evaluated by EMSA using nuclear extract from HEK293T cells and two different biotin-labeled double-stranded oligonucleotide probes (probe 1 and 2) containing TFE3 putative binding sites. The unlabeled specific TFE3 competitor oligonucleotides (100-fold molar excess) and TFE3 antibody are indicated above each lane. DNA-protein complexes are indicated by arrows in each panel. Supershifted bands are indicated by red asterisks. (F) HEK293T cells were transiently co-transfected with an empty vector (vector), or vectors expressing shRNA (TFE3), TFE3 or PRCC-TFE3, together with the human PRKN promoter region (−907/+46) constructs or PGL3 Basic, followed by a luciferase reporter gene assay. The pRL-TK vector was co-transfected to normalize transfection efficiencies. Results are presented as a luciferase/Renilla ratio. Data are presented as mean ± s.e.m from 3 independent experiments. #p < 0.05, ##p < 0.01, ###p < 0.001 (One-way ANOVA with Dunnett posttests). (G) HEK293T cells were infected with Lenti.shRNA (NC) or Lenti.shRNA (TFE3), followed by analysis of the mRNA levels of PRKN and TFE3 by real-time PCR. Data are presented as mean ± s.e.m from 3 independent experiments. *p < 0.05, **p < 0.01, ***p < 0.001 (two-tailed t-test). (H) HEK293T cells were infected with Lenti.shRNA (NC) or Lenti.shRNA (TFE3) and PRKN and TFE3 were examined by western blot. (I) Densitometric analysis of TFE3:GAPDH and PRKN:GAPDH. Data are presented as mean ± s.e.m from 3 independent experiments. *p < 0.05, **p < 0.01, ***p < 0.001 (two-tailed t-test). (J) HEK293T cells were transiently transfected with empty vector (vector), or vectors expressing TFE3, or PRCC-TFE3 and PRKN and TFE3 were examined by western blot. (K) Densitometric analysis of PRKN:GAPDH. GAPDH was used as a loading control. Data are presented as mean ± s.e.m from 3 independent experiments. #p < 0.05, ##p < 0.01, ###p < 0.001 (One-way ANOVA with Dunnett posttests)
PRCC-TFE3 fusions-PRKN axis drives mitophagy in PRCC-TFE3 tRCC
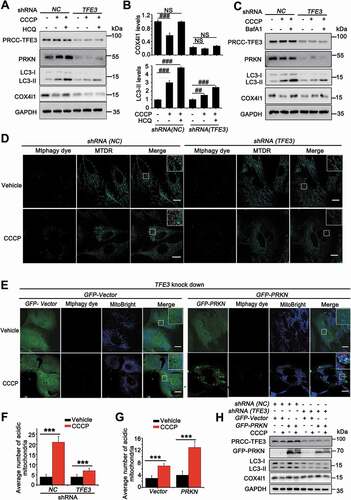
As we showed that PRCC-TFE3 fusion could constitutively activate PRKN expression, we next determined mitophagic regulation of PRCC-TFE3 fusion-PRKN. The LC3 shift assay showed that, upon treatment with CCCP, extracts from cells with knockdown of PRCC-TFE3 had lower levels of LC3-II and fewer degradation levels of COX4I1/COX4, indicating that mitochondrial clearance was repressed ()). Furthermore, mitophagic flux was also repressed in Lenti.shRNA (TFE3) group ()). Additionally, the effect of mitophagic repression caused by PRCC-TFE3 knockdown was confirmed by Mtphagy dye staining ()). Similarly, the knockdown of PRCC-TFE3 also repressed the level of mitophagy with treatment of PEITC (Fig. S1E) and increased the sensitivity of UOK120 to PEITC (Fig. S3A and S3B). The results indicated that PRCC-TFE3 was involved in regulating the process of mitophagy. To determine the role of PRKN and PINK1-PRKN-dependent mitophagy in UOK120 cells, we knocked down the expression of PRCC-TFE3 and rescued the expression of PRKN. Mtphagy dye staining and western blot results showed shRNA (TFE3) repressed mitophagy and the overexpression of PRKN could partially reverse this process ()). Collectively, these data indicate that PRCC-TFE3 regulates mitophagy through PRCC-TFE3 fusion-PRKN axis in PRCC-TFE3 tRCC.
Figure 6. PRCC-TFE3 fusions-PRKN axis drives mitophagy in UOK120 cells. (A) UOK120 cells were infected with Lenti.shRNA (NC) or Lenti.shRNA (TFE3), and then PRCC-TFE3, PRKN, LC3-II and COX4I1 were examined by western blot after treatment with CCCP (10 μM) for 6 h in the presence or absence of HCQ (30 μM). (B) Densitometric analysis of COX4I1:GAPDH(upper) and LC3-II:GAPDH (down). Data are presented as mean ± s.e.m from 3 independent experiments. #p < 0.05, ##p < 0.01, ###p < 0.001 (One-way ANOVA with Dunnett posttests). (C) UOK120 cells were infected with Lenti.shRNA (NC) or Lenti.shRNA (TFE3), and then PRCC-TFE3, PRKN, LC3-II and COX4I1 were examined by western blot after treatment with CCCP (10 μM) for 6 h in the presence or absence of Baf A1 (200 nM). (D) UOK120 cells were infected with Lenti.shRNA (NC) or Lenti.shRNA (TFE3) followed by staining with the Mtphagy dye and MitoTracker Deep Red, and then visualization of Mtphagy dye and MitoTracker Deep Red using live-cell imaging microscopy after treatment with CCCP (10 μM) for 12 h. (E) UOK120 cells were co-infected with Lenti.shRNA (TFE3) and Lenti.GFP-Vector or Lenti.GFP-PRKN followed by staining with the Mtphagy dye and MitoBright, and then visualization of Mtphagy dye, GFP and MitoBright using live-cell imaging microscopy after treatment with CCCP (10 μM) for 12 h. (F and G) quantification of acidic (red-only) mitochondria in different group of (D and E). Data are presented as mean ± s.e.m from 3 independent experiments (10 cells/group/experiment in F and G). *p < 0.05, **p < 0.01, ***p < 0.001 (two-tailed t-test). (H) UOK120 cells were co-infected with Lenti.shRNA (TFE3) and Lenti.GFP-Vector or Lenti.GFP-PRKN, and then PRCC-TFE3, PRKN, LC3-II and COX4I1 were examined by western blot after treatment with CCCP (10 μM) for 6 h. GAPDH was used as a loading control. NS, no significance. Scale bars: 20 μm
PRCC-TFE3 fusions accelerates mitochondria biosynthesis and turnover in PRCC-TFE3 tRCC
In order to maintain cellular homeostasis, elimination of damaged mitochondria through mitophagy must be replaced with newer, more efficient mitochondria. TFE3, as a master regulator of energy metabolism, is also involved in modulating mitochondrial biosynthesis in direct or indirect manners [Citation39,Citation40]. PPARGC1A, PPARGC1B and NRF1 and NRF2 (nuclear respiratory factor 1 and 2) are indispensable transcriptional factors for mitochondria biosynthesis [Citation41,Citation42]. Interestingly, knockdown of PRCC-TFE3 significantly decreased expression of PPARGC1A, PPARGC1B and NRF1 ()). Additionally, we further examined the mRNA levels of mitochondrial DNA (mtDNA) as well as protein levels of TOMM20 (translocase of outer mitochondrial membrane 20). In line with the effect of PRCC-TFE3 on PARGC1A, PPARGC1B and NRF1, mtDNA and TOMM20 significantly decreased in UOK120 with PRCC-TFE3 knockdown ()). To further evaluate whether these new biosynthesis mitochondria were functional, the oxygen consumption rate (OCR), as an indicator of mitochondrial respiration, was measured using an Agilent Seahorse Analyzer. As illustrated in ), cells with downregulation of PRCC-TFE3 or PRKN had lower resting OCR or oxidative phosphorylation (OXPHOS) and a lower maximal mitochondrial capacity than control group, suggesting that cells with knockdown of PRCC-TFE3 or PRKN generated fewer mitochondria-derived ATP. In addition, we rescued PRKN expression in PRCC-TFE3 knockdown group and found ATP production was partially reversed ()). These data showed that PRCC-TFE3 could increase functional mitochondrial biosynthesis through PPARGC1A-NRF1 pathway.
Figure 7. PRCC-TFE3 fusions accelerate mitochondria biosynthesis and turnover in UOK120 cells. (A) UOK120 cells were infected with Lenti.shRNA (NC) or Lenti.shRNA (TFE3), followed by analysis of the mRNA levels of PRCCC-TFE3, PPARGC1A, PPARGC1B, NRF1 by real-time PCR. Data are presented as mean ± s.e.m from 3 independent experiments. *p < 0.05, **p < 0.01, ***p < 0.001 (two-tailed t-test). (B) UOK120 cells were infected with Lenti.shRNA (NC) or Lenti.shRNA (TFE3), and then NRF1 and TOMM20 were examined by western blot (upper) and MT-TL1 (mitochondrially encoded tRNA-Leu (UUA/G) 1; mtDNA) copy number was detected using reverse transcription-PCR (down). (C) Relative quantity of mtDNA by measuring the ratio of mtDNA to Rn18s DNA levels. Data are presented as mean ± s.e.m from 3 independent experiments. *p < 0.05, **p < 0.01, ***p < 0.001 (two-tailed t-test). (D) Densitometric analysis of NRF1:GAPDH and TOMM20:GAPDH. Data are presented as mean ± s.e.m from 3 independent experiments. *p < 0.05, **p < 0.01, ***p < 0.001 (two-tailed t-test). (E) Graphical representation of the OCR measurement over time in UOK120 cells infected with Lenti.shRNA (TFE3), Lenti.shRNA (PRKN) or Lenti.shRNA (NC) and Lenti.shRNA (TFE3)+ Lenti.PRKN. oligomycin, 1 μM; FCCP, 2 μM; rotenone-antimycin (Rot/AA), 0.5 μM. (F) The calculated OCR for basal, ATP production and maximal respiration. Data are presented as mean ± s.e.m from 3 independent experiments. #p < 0.05, ##p < 0.01, ###p < 0.001 (One-way ANOVA with Dunnett posttests). (G) UOK120 cells were transfected with MitoTimer in presence or absence of Lenti.shRNA (NC) or Lenti.shRNA (TFE3), and then visualization of MitoTimer-green and MitoTimer-red using live-cell imaging microscopy after transfection for 24 h and 48 h. Data are presented as mean ± s.e.m from 3 independent experiments (10 cells/group/experiment in G). *p < 0.05, **p < 0.01, ***p < 0.001 (two-tailed t-test), Scale bars: 30 μm
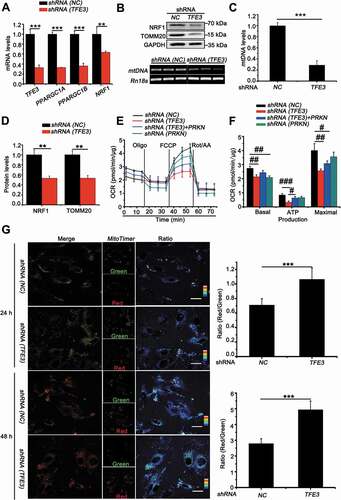
In order to confirm that PRCC-TFE3 could accelerate mitochondrial turnover through PRKN-dependent mitophagy and PPARGC1A-NRF1-dependent biosynthesis, we utilized MitoTimer, a fluorescent protein targeted to the mitochondrial matrix [Citation43]. MitoTimer protein irreversibly changes its emitted fluorescence from green to red over time with mitochondrial maturation. Therefore, the ratio of red to green can be used to monitor mitochondrial turnover. Quantitative analysis showed that the knockdown of PRCC-TFE3 significantly increased accumulation of MitoTimer-red form and decreased MitoTimer-green form, indicating mitochondrial turnover was repressed ()). Taken together, the present data demonstrate that PRCC-TFE3 accelerates mitochondrial turnover through promoting mitophagy and mitochondrial biosynthesis in UOK120 cells.
PRCC-TFE3 fusions-PRKN axis is involved in cell proliferation through regulating mitochondrial ROS formation
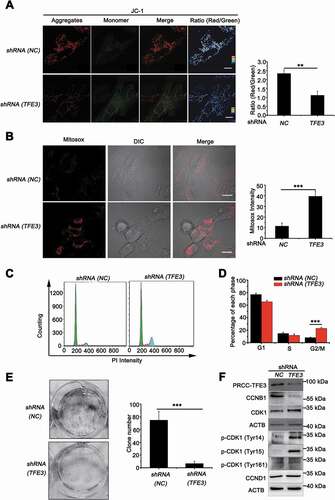
Since PRCC-TFE3 could accelerate mitochondrial turnover through promoting mitophagy and mitochondrial biosynthesis, we need to determine the role of accelerated mitochondrial turnover on the progress of PRCC-TFE3 tRCC. Examination of mitochondrial membrane potential revealed that mitochondrial membrane potential significantly decreased in shRNA (TFE3) or shRNA (PRKN) group () and S3A), indicating the increase of damaged mitochondria. However, deficiency of mitophagy may further result in accumulation of damaged mitochondria and induce an increase of mitochondrial-derived ROS [Citation44]. Therefore, we monitored ROS formation using MitoSOX, which is widely used to detect mitochondrial ROS. Knockdown of PRCC-TFE3 or PRKN significantly induced ROS production in UOK120 cells () and S6A). Intracellular ROS accumulation can lead to DNA damage and, consequently, induce cell cycle arrest by activating cell cycle checkpoints [Citation45]. Our data showed that knockdown of PRCC-TFE3 or PRKN resulted in the G2/M phase arrest () and S6B) and repression of cell proliferation (Fig. S6C). In addition, the capacity of colony formation was also repressed in shRNA (TFE3) or shRNA (PRKN) group () and S6D). These results suggested that knockdown of PRCC-TFE3 or PRKN repressed cell proliferation through inducing G2/M arrest of UOK120 cells. To elucidate the molecular basis of PRCC-TFE3 or PRKN knockdown-caused G2/M arrest, we investigated the activation of the CDK1 (cyclin dependent kinase 1)-CCNB1 (cyclin B1) complex G2/M checkpoint pathway. The results showed that CCNB1 was significantly decreased, but CDK1 was increased. Because phosphorylation at Thr161 of CDK1 activates kinase activity and phosphorylation at Thr14 and Tyr15 of CDK1 inhibits the protein kinase activity, increasing level of p-CDK1 (Tyr15) and p-CDK1 (Tyr14) in shRNA (TFE3) group or shRNA (PRKN) group indicated that the effect of G2/M arrest was caused by inactivation of the CDK1-CCNB1 complex. () and S6C). Afterward, we rescued the expression of PRKN in UOK109 to observe cell proliferation. The results revealed that the PRKN promoted cell proliferation in UOK109 cells (Fig. S6E and S6F). Collectively, these data suggest that PRCC-TFE3-PRKN axis promotes cell proliferation through sustaining mitochondrial quality and repressing accumulation of ROS.
Figure 8. PRCC-TFE3 fusions are involved in cell proliferation through regulating mitochondrial ROS formation. UOK120 cells were infected with Lenti.shRNA (NC) or Lenti.shRNA (TFE3) followed by staining with a JC-1 probe (A) or Mito-Sox (B) for 30 min. JC-1 or Mito-Sox intensity was measured with live-cell imaging microscopy. Data are presented as mean ± s.e.m from 3 independent experiments (10 cells/group/experiment in A and B). *p < 0.05, **p < 0.01, ***p < 0.001 (two-tailed t-test), Scale bars: 20 μm (in A) and 30 μm (in B). (C) UOK120 cells were infected with Lenti.shRNA (NC) or Lenti.shRNA (TFE3) and DNA content was determined by propidium iodide (PI) staining using flow cytometry. (D) Percentage of cells in each phase was quantified. Data are presented as mean ± s.e.m from 3 independent experiments. *p < 0.05, **p < 0.01, ***p < 0.001 (two-tailed t-test). (E) UOK120 cells were infected with Lenti.shRNA (NC) or Lenti.shRNA (TFE3), and then formation of colonies was measured after 7 d incubation. Data are presented as mean ± s.e.m from 3 independent experiments. *p < 0.05, **p < 0.01, ***p < 0.001 (two-tailed t-test). (F) UOK120 cells were infected with Lenti.shRNA (NC), Lenti.shRNA (TFE3) and then PRCC-TFE3, CCNB1, CCND1, CDK1, p-CDK1 (Tyr14), p-CDK1 (Tyr15) and p-CDK1 (Tyr161) were examined by western blot
Discussion
In the present study, we revealed that PRCC-TFE3 fusion could constitutively activate target gene PRKN expression, resulting in increased mitophagy and insensitive to being killed by the mitochondrial ROS inducer in PRCC-TFE3 tRCC. However, nuclear translocation of TFE3 fusions escaped from PINK1-PRKN-dependent mitophagy. Moreover, we found that PRCC-TFE3 fusions accelerated mitochondria biosynthesis by PPARGC1A and NRF1 pathway. Therefore, our data suggested that PRCC-TFE3 fusion-mediated rapid mitochondrial turnover played a major role in promoting the development of PRCC-TFE3 tRCC.
TFE3 is a transcription factor with bHLH leucine zipper, which binds specifically to CLEAR motif that is found in the promoter regions of many genes encoding for lysosomal biogenesis and autophagy. Intracellular localization of TFE3 is firmly associated with its transcript activity. In fully fed cells, TFE3 is recruited to the lysosomal surface, where TFE3 (S321) undergoes MTORC1-dependent phosphorylation to create a binding site for the cytosolic chaperone YWHAG/14-3-3γ [Citation36,Citation46]. Interaction with YWHAG/14-3-3γ results in sequestration of these transcription factors in the cytosol. Conversely, upon nutrients are limited, inactivation of MTORC1, together with dephosphorylation of TFE3 (S321), prevents binding to YWHAG/14-3-3 γ, resulting in the rapid accumulation of TFE3 in the nucleus to regulate transcription of target genes. Besides nutrient limitation, mitochondrial and ER stress also activate TFE3 response. For example, PINK1-PRKN-dependent mitophagy can induce translocation of TFE3 to the nucleus [Citation12]. In our previous study, however, we find that TFE3 fusion protein is not controlled by the MTOR signaling pathway and is accumulated in the nucleus in TFE3-fusion tRCCs [Citation36]. In the present study, we wondered whether PINK1-PRKN-dependent mitophagy influenced nuclear translocation of TFE3 fusions in TFE3 tRCC, especially in PRCC-TFE3 tRCC where PRKN was amplified. Similarly, both amplification of PRKN and PINK1-PRKN-dependent mitophagy did not affect intracellular localization of TFE3 fusions, which aggregated in the nucleus all the time.
PRCC-TFE3 tRCC is one of the most common types of TFE3 tRCC [Citation34,Citation47,Citation48]. Other studies reveal that the NLS in TFE3 fragment mediates TFE3 nuclear translocation and the nuclear translocation of PRCC-TFE3 is mediated by both PRCC and TFE3 [Citation34,Citation35]. However, in our study, we observed that the nuclear translocation of PRCC-TFE3 was not mediated by the NLS of TFE3 fragment, but NLS of PRCC fragment. In addition, we found that the nuclear location of NONO-TFE3 was mediated by NLS in TFE3 translocation region and was not mediated by NONO fragment. The NONO fragment induced the puncta formation of RFP tag, and the fragment also resulted in puncta formation of NONO-TFE3 in a living cell (data unpublished). The puncta were seemly more stable (data unpublished), which might lead to its protein level higher than PRCC-TFE3. The nuclear location difference between PRCC-TFE3 and NONO-TFE3 implicated that a domain in exon 4–5 of TFE3 might affect the NLS of TFE3 on structure. To our surprise, the deletion of exon 4 in TFE3 fragment of PRCC-TFE3 caused nuclear accumulation of RFP tag (Fig. S4B and S4D). TFE3 can interact with CDK4-CDK6 complex and be phosphorylated at Ser246, which results in nuclear export of TFE3 [Citation49]. Interestingly, the phosphorylation site of Ser246 occurred in exon 4 of TFE3. Therefore, we speculated that CDK4-CDK6 complex phosphorylated TFE3 fragment of PRCC-TFE3 at Ser246, which caused cytoplasmic localization of the TFE3 fragment. Both NONO-TFE3 and PRCC-TFE3 belong to TFE3 fusions; however, PRKN expression was lower in NONO-TFE3 tRCC. We speculated that NONO-TFE3 only contained exon 6–10 of TFE3, which lacks activation domain (as shown in Fig. S7), so NONO-TFE3 was unable to activate expression of the target gene, including PRKN in NONO-TFE3 tRCC. In fact, we indeed found that PRKN was negatively regulated by NONO-TFE3. Because, the TFE3 fragment contains DNA binding domain, which may occupy promoter region and repress transcription of PRKN. Correspondingly, NONO-TFE3 is revealed as a weaker activator of transcription than TFE3 and unable to enhance transcription through synergism with SMAD3 (SMAD family member 3) [Citation34].
The transcription factors that regulate PRKN include ATF4 under mitochondrial or ER stress [Citation50], MYCN/N-myc in cell cycle regulation [Citation37], and RELA/NF-κB with chronic systemic inflammation [Citation51]. ChIP-Seq results show that PRKN is a potential target gene of TFE3 [Citation38]. We further confirmed TFE3 and PRCC-TFE3 could transcriptionally regulate PRKN expression directly. This demonstrated that nuclear aggregation of PRCC-TFE3 could constitutively activate expression of PRKN. Additionally, we found that PRCC-TFE3-PRKN axis could mediate PINK1-PRKN-dependent mitophagy in PRCC-TFE3 tRCC. However, overexpression of PRKN could partially reverse the mitophagy inhibition in PRCC-TFE3 knockdown group. Consistently, overexpression of PRKN could partially rescue the function of mitochondrial respiration. TFE3 is shown to regulate expression of some overlapping autophagic genes with TFEB [Citation6]. Therefore, autophagic genes might also be downregulated by PRCC-TFE3 konckdown and played a role in mitophagic inhibition, which resulted in partially reversed effect of PRKN overexpression. Recent studies show that TFE3 is able to perform mitochondrial gene regulatory functions [Citation39], indicating that TFE3 plays a non-redundant and specific function in mitochondrial regulation. In the present study, the data showed that nuclear-aggregated PRCC-TFE3 could constitutively activate mitochondrial gene expression and promote mitochondrial biosynthesis. As PRCC-TFE3 has a dual role in mitochondrial quantity and quality, we employed MitoTimer to detected mitochondrial turnover and found that PRCC-TFE3 knockdown significantly repressed mitochondrial turnover. This suggested that the nuclear-aggregated PRCC-TFE3 could promote tRCC progression through accelerating mitochondrial turnover.
The ROS level of cancer cells is higher than that of normal cells, and 90% of ROS was produced by mitochondria [Citation52]. Therefore, in situ amplification of ROS in mitochondria has been a promising strategy for cancer treatment by producing long-term high oxidative stress to induce the apoptosis of cancer cells [Citation52]. PEITC can decrease OXPHOS and induce ROS production to trigger cancer cell apoptosis by disrupting mitochondrial respiratory chain [Citation53,Citation54]. Recently a Phase II clinical trial has been completed in which PEITC was used as a lung cancer-preventing agent in smoking subjects [Citation55]. In the present study, we employed PEITC to induce mitochondria-derived ROS in different subtype of RCCs. We found that UOK109 cells and 786-O cells were sensitive to PEITC, while PRCC-TFE3 tRCC was insensitive to be killed by this mitochondrial ROS inducer. ROS can induce mitochondrial damage by depolarizing mitochondrial membrane potential and initiate PINK1-PRKN-dependent mitophagy that protects cell against apoptosis due to the releasing of CYCS from damaged mitochondria [Citation25,Citation26]. Because PRKN is often considered as an amplifier of the PINK1-generated mitophagy signal [Citation11], amplification of PRKN in UOK120 from PRCC-TFE3 tRCC attracted our attention. A growing body of evidence shows PRKN as a tumor suppressor, as copy number loss or mutations of PRKN, which lead to the mRNA of PRKN significantly lower or inactivity of PRKN in multiple cancers [Citation56,Citation57]. However, no mutations on PRKN by exon sequencing indicated that the amplification of PRKN might influence mitophagic regulation in UOK120 cells. In our study, we observed that PRKN could translocate to mitochondria to regulate mitophagy when UOK120 cells were treated with CCCP or PEITC. Consistently, exogenous expression of PRKN could repress cell apoptosis in UOK109 cells through PINK1-PRKN-dependent mitophagy.
In the absence of the mitophagy machinery, damaged mitochondria produce cytotoxic ROS. In our study, we showed that downregulation of PRCC-TFE3 or PRKN resulted in depolarization of mitochondrial membrane potential and accumulation of mitochondrial-derived ROS in UOK120 cells. Intracellular ROS accumulation consequently induced cell cycle arrest by activating cell cycle checkpoints [Citation45]. In agreement with this, we confirmed that knockdown of PRCC-TFE3 or PRKN inhibited proliferation through repressing the formation of CCNB1-CDK1 complex. In our study, the results showed that the percentage of G2/M arrest in PRCC-TFE3 knockdown group was higher than that in PRKN knockdown group. We also tried to express exogenous PRKN in PRCC-TFE3 knockdown group, however, cell proliferation was not reversed obviously. This may be that knockdown of PRCC-TFE3 also caused inactivation of MTORC1-dependent cell proliferation, which plays a major role in cell proliferation. In order to keep MTOR-dependent cell proliferation activating, we expressed exogenous PRKN in UOK109 with low level of PRKN. We found that PRKN could promote proliferation of UOK109 cells. However, accumulating evidence implicates PRKN as the primary factor responsible for putative tumor suppressor function through down-regulating CCND1/cyclin D1 [Citation58]. In this study, knockdown of PRCC-TFE3 or PRKN did not alter protein levels of CCND1 in UOK120, indicating that PRCC-TFE3-PRKN axis could be involved in the regulation of cell proliferation through ROS-mediated cell cycle arrest and cell apoptosis, which promoted the development of PRCC-TFE3 tRCC.
Materials and methods
Reagents and antibodies
The following primary antibodies were used for immunoblotting and immunostaining: PRKN/parkin (Cell Signaling Technology, 4211), TFE3 (Sigma-Aldrich, HPA023881), TFE3 (Proteintech, 14480-1-AP), NRF1 (Abcam, ab175932), TOMM20 (Cell Signaling Technology, 42406), LC3A/B (Abcam, ab128025), LC3B (Sigma, L7543), GAPDH (ABclonal, AC033), CYCS/CytC (Proteintech, 10993-1-AP), COX4I1/COX4 (Proteintech, 11242-1-AP), CCNB1/cyclin B1 (Proteintech, 55004-1-AP), CCND1/CyclinD1 (Proteintech, 60186-1-lg), CDK1 (Proteintech, 19532-1-AP), phospho-CDK1 (Tyr161, Affinity, AF8137), phospho-CDK1 (Tyr14, Affinity, AF3236), phospho-CDK1 (Tyr15, Affinity, AF3108), ACTB/β-actin (Abbkine, A01010), HRP-conjugated goat anti-rabbit (Cell Signaling Technology, 7074), goat anti-mouse secondary antibody (Boster, BA1050), Alexa Fluor 488-conjugated goat anti-rabbit secondary antibodies (Abcam, ab150077), and Alexa Fluor 594-conjugated goat anti-rabbit secondary antibodies (Invitrogen, A-11058), Alexa Fluor 488-conjugated goat anti-mouse secondary antibodies (Invitrogen, A-11029). Other materials used for cell culture and culture treatments include carbonyl cyanide m-chlorophenylhydrazone (CCCP; Sigma-Aldrich, C2759), hydroxychloroquine (HCQ; Sigma-Aldrich, H0915), E-phenylethyl isothiocyanate (PEITC; Sigma-Aldrich, MKCC3781)
Cell culture and transfection
HEK293T human embryonic kidney cells (ATCC, CRL3216), 786-O renal clear cell cancer (ATCC, CRL-1932), HK-2 human kidney cortex/proximal tubule (ATCC, CRL2190) and UOK109, UOK120 Xp11.2 translocation renal cell carcinoma (gifts of Dr. W. Marston Linehan, National Cancer Institute, Bethesda, MD). The UOK120 and UOK109 cell lines were derived from primary papillary cell carcinoma as described [Citation36] and were derived from tumors arising in a 30- and a 39-year-old male, respectively. Cells were cultured in DMEM (Gibco, 10569010) supplemented with 10% FBS (Gibco, 16140063) and 1% penicillin-streptomycin (Invitrogen, 15070063) in a 5% CO2 humidified incubator at 37°C. HEK293T cells were transiently transfected using Lipofectamine 2000 Transfection Regent (Invitrogen, 11668019) according to the manufacturer’s protocol and followed by incubation for 48 h. UOK120 cells were infected with lentiviruses (Obio Technology Y6140, Y8237 and Y8969) carrying shRNA targeting the TFE3 or PRKN or cDNA of PRCC-TFE3 (Genechem, 47926–1) and PRKN (Obio Technology, Y15314). Forty-eight hours later, UOK120 cells were cultured in medium containing puromycin for the selection of stable clones. The clones stably knocking down TFE3 were identified and verified by western blotting. The shRNA sequences are as follows:
TFE3 shRNA #1: 5′-GCTCCGAATTCAGGAACTA-3′
TFE3 shRNA #2: 5′-CATGAAATGCTCAGCTATCT-3′
PRKN shRNA: 5′-CAGCCCAAATTGCAGAAGAA-3′
For induction of mitophagy, cells were incubated in culture media containing CCCP (10 μM; Sigma, C2759) dissolved in DMSO (Sigma, D2650), for 6 h. Autophagic flux experiments were performed in the presence or absence of lysosomal protease inhibitors hydroxychloroquine (HCQ, 30 μM; Sigma, H0915) or bafilomycin A1 (Baf A1, 200 nM; MCE, HY100558) for 3 h.
Plasmid constructs
cDNAs were amplified with Phanta Max Master mix (Vazyme, P511) and cDNA encoding PRKN was PCR-generated from UOK120 cells and subcloned into pRLenti-CMV-EGFP-C1 or pcDNA3.1(+) (Invitrogen, V790-20) with ClonExpress II One Step Cloning Kit (Vazyme, C112) to express GFP-PRKN or PRKN. cDNA encoding TFE3 fragments, PRCC fragment and NONO fragment were generated from UOK109 or UOK120 and subcloned into Dsred2-N1 (Clontech, 632406) or Dsred2-C1 (Clontech, 632407). cDNA encoding TFE3 and PRCC-TFE3 were generated from HEK293T cells and UOK120 cells and subcloned into pcDNA3.1(+) (Invitrogen, V790-20) to express WT TFE3 and PRCC-TFE3. For luciferase test, genomic DNA from UOK120 cells was used as the template to construct PRKN promoter reporter plasmids. Human PRKN promoter region (−907/+46) were subcloned into pGL3-basic vector (Promega, E1761). The primers were showed in (Table S1A).
ChIP assay
A ChIP assay was performed using a Thermo Fisher Scientific Pierce Agarose ChIP Kit (Thermo Fisher Scientific, 26156) according to the manufacturer’s protocol. HEK293T cells were fixed with 1% formaldehyde and quenched with 1.25 M glycine (Thermo Fisher Scientific, 26156). Then the cells were suspended in MNase Digestion Buffer and sheared with Micrococcal Nuclease. This sheared DNA was diluted with dilution buffer (1:10 ratio). The diluted supernatant was incubated with antibody (TFE3), normal mouse IgG and anti-POLR2 (RNA polymerase II) was used for negative and positive control. Protein G agarose was used to collect the antibody-antigen-DNA complex. The unbound antibody-antigen-DNA complex was washed off with Immune Complex Wash Buffer and the bound protein-DNA complexes were collected using Elution Buffer. The released protein-DNA complexes were reverse crosslinked into free DNA with proteinase K. The DNA was then quantified using specific PRKN primers (Table S1B) by conventional PCR.
Western blot
Cells were washed in ice-cold PBS (Julu, Z0757) and lysed in lysis buffer (Beyotime, P0013 C), containing protease and phosphatase inhibitors (Medchemexpress, HY-K0010 and HY-K0021) for 30 min. Cell lysates were subjected to sodium dodecylsulfate-polyacrylamide gel electrophoresis (SDS-PAGE) and transferred to polyvinylidene fluoride (Millipore, ISEQ10100). Membranes were immunoblotted using the indicated antibodies. For quantification of proteins, grayscale values of corresponding bands were measured with ImageJ software (NIH), and the fold-change was calculated by comparing the treated groups with the respective control groups.
Immunofluorescence confocal microscopy
Cells grown on a glass-bottom culture dish were washed with PBS and fixed with 4% formaldehyde at room temperature for 10 min. After fixation cells were permeabilized with 0.3% Triton X-100 (Sigma, X100) in PBS at room temperature for 10 min and then blocked in 5% BSA (Julu, Z0756) in PBS for 1 h at 37°C before being stained with the indicated antibodies. Cells were then incubated with the indicated primary antibodies overnight at 4°C. Cells were washed three times with PBS and incubated with the corresponding secondary antibodies conjugated to Alexa Fluor 568 or Alexa Fluor 488 in 5% BSA in PBS for 1 h at room temperature. Glass bottom culture dish was mounted with ProLong® Diamond Antifade Mountant (Thermo Fisher Scientific, P36966), and observed on a confocal microscope (Olympus FV3000 Confocal Laser Scanning Microscope, Japan).
RNA isolation and relative quantitative real-time polymerase chain reaction
After treatment, total RNA was extracted from the cells with a Trizol reagent (Vazyme, R401-01), and RNA was reversely transcribed into cDNA with Hiscript II Reverse Transcriptase (vazyme, R201-01) according to the manufacturer’s instructions. The primers were synthesized by tsingke biological technology (Nanjing, China). For quantitative real-time reverse transcription PCR (qRT-PCR) analysis, the action mixture consisted of 10 μL SYBR Green (Vazyme, Q711-02), 10 μM each primer (Table. S1C), 1 μL cDNA. PCR amplifications were performed on the 7300 real-time PCR system (Applied Biosystems, CA, US). The relative mRNA expression level was calculated by the comparative 2− ΔΔCt method and normalized against GAPDH mRNA. For reverse transcription-PCR analysis, amplification was done for 33 cycles, each with denaturation at 95°C for 30 s, annealing at 60°C for 30 s and extension at 72°C for 30 s. The products were analyzed using 1.5% agarose gel electrophoresis. The images were scanned with Tanon ultraviolet imaging system (Tanon-5200Multi, Shanghai, China) and data were analyzed using ImageJ software.
Electrophoretic mobility shift and supershift assays
Oligonucleotide probes with putative TFE3 binding sites on PRKN promoter were synthesized, annealed, and labeled by biotin. Each labeled probe was incubated 5 μg of HEK293T nuclear extract and processed for EMSA. Supershift assays were also performed and, in each reaction, 1–1.5 μg of TFE3-specific antibodies were added to the probe/nuclear extract mixture and incubated for 20 min at room temperature. For competition, 100-fold excess of unlabeled oligonucleotide was incubated with nuclear extract before adding labeled or nonspecific oligonucleotide. Shift reactions were loaded onto 6% polyacrylamide gel and run at 170 V (at 4°C) for 4 h in 0.5× Tris/Boric Acid/EDTA (TBE) buffer. Results were obtained in the chemical system. The sequence of Probes are as follows:
Probe1: (Bio-5ʹ-gatgtgagcaggaggtctgga-3ʹ
3ʹ-ctacactcgtcctccagacct-5ʹ-Bio)
Probe2: (Bio-5-cctccgcgcgtgcgcattcctagggccgggcgcgggggcggg-3
3-ggaggcgcgcacgcgtaaggatcccggcccgcgcccccgccc-5-Bio)
Luciferase activity assays
Luciferase assay for transcriptional activity of HRE-luciferase was performed as previously reported. In brief, HEK293T cells were grown to 90% confluence, and then plasmid constructs were co-transfected with an internal control vector pRL-TK (Promega, E2241) (100:1 ratio) into the cells using Lipofectamine 2000 (Invitrogen, 11668019). After 48 h, cells were harvested and luciferase activity was quantified using GloMaxTM 96 Microplate Luminometer (Promega, Madison, WI, USA).
Mitochondrial fractionation
Mitochondria were isolated with the Mitochondria Isolation Kit for Cultured Cells (Pierce, 89874) according to the manufacturer’s instructions. Cells and isolated mitochondria were lysed with lysis buffer A (20 mM Tris, pH 7.4, 150 mM NaCl, 2 mM EDTA, 1% Triton X-100 with protease and phosphatase inhibitors) for 20 min at 4°C. Protein concentrations were measured with BCA protein assay kit (Pierce, 23225) according to the manufacturer’s instructions, and 10 μg of protein was loaded on 4–12% SDS-PAGE gels. Primary antibodies were added for 16 h at 4°C and secondary antibodies for 1 h at room temperature. Antibody binding was detected with SuperSignal West Pico Chemiluminescent Substrate (Pierce, 34579).
Nuclear isolation
Nuclei were isolated with NE-PER™ Nuclear and Cytoplasmic Extraction Reagents (Thermo Fisher Scientific, 78835) according to the manufacturer’s instructions. Briefly, cells were harvested by centrifuging at 500 g for 5 min after digested with trypsin-EDTA; The pellet was suspended with cytoplasmic extraction reagent I and cytoplasmic extraction reagent II and vortex vigorously and subjected to centrifuging at 16,000 g for 5 min and the supernatant was cytoplasmic extract; The pellet was suspended with nuclear extraction reagent and subjected to centrifuging at 16,000 g for 10 min, the supernatant was nuclear extract. And then, nuclear extract and cytoplasmic extract were subjected to western blot.
Mitophagy assay
To detect mitophagy, the Mitophagy Detection Kit (Dojindo Molecular Technologies, MD01) was used according to the manufacturer’s protocol. Mtphagy Dye, a reagent for detection of mitophagy, and MitoBright (Dojindo Molecular Technologies, MT07) or MitoTracker Deep Red (Invitrogen, M24426), used for staining of healthy mitochondria to allow accurate quantification of damaged mitochondria.
ATP assay
The ATP level was quantified with ATP assay kit (beyotime, S0026). Briefly, lysates from UOK120 cell in presence or absence of shRNA. Samples were mixed with luminescent solution. The luminescence was measured by GloMaxTM 96 Microplate Luminometer (Promega, Madison, WI, USA). Values were normalized to protein content measured by the BCA protein assay kit (Vazyme, E112-01).
Profiles of mitochondrial respiration
shRNA (NC)- or shRNA (TFE3)-infected cells were seeded at a density of 3,000 cells/well. The cells were then changed to XF base medium (Agilent technology, 102535–100) containing 25 mM glucose, 4 mM L-glutamine, pH 7.4 and kept at 37°C without CO2 for 1 h. To detect the mitochondrial respiration, oxygen consumption rate (OCR) was recorded when cells were metabolically perturbed by the sequential injections of oligomycin (1 μM, final concentration; Agilent technology, 103260–100), carbonyl cyanide p-(trifluoromethoxy) phenylhydrazone (FCCP, 1.5 μM, final concentration; Agilent technology, 103260–100), and rotenone-antimycin A (0.5 μM, final concentration; Agilent technology, 103260–100). Mitochondrial respiration and glycolysis in indicated cells were recorded using a Seahorse Bioscience XF96 (Agilent technology, North Billerica, MA, USA).
CCK-8 cell proliferation assay
UOK-120 cells transfected with indicated shRNA for 72 h and then were seeded in 96-well (2000 cells/well) plates and incubated for 72 h at 37°C and 5% CO2. Cell viability was determined by measuring dehydrogenase activity. We changed the medium and applied 100 μL of serum-free medium with 10 μL of WST-8 (2-[2-methoxy-4-nitrophenyl]-3-[4-nitrophenyl]-5-[2,4-disulfophenyl]-2 H-tetrazolium sodium salt; Dojindo Molecular Technologies, CK04) to each well and incubated the cells for 1 h at 37°C and 5% CO2 to allow the formation of a formazan salt. The absorbance was measured at λ = 450 nm using a Micro Plate Reader (SpectraMax M3, Molecular Devices, USA).
Plate colony-formation assay
Cells were seeded in 6-well plates; each group had three replicate wells and contained 800 cells/well. After 10 d, the cell colonies were visible to the naked eye. The cells were stained with Giemsa Stain solution (Solarbio, G1015), and the number of visible colonies containing >50 cells were quantified.
Analysis of apoptosis and cell cycle distribution using flow cytometry
Following treatment, Cell apoptosis was analyzed by an ANXA5/annexin V-FITC and PI staining kit (Vazyme, A211-01) according to the manufacturer’s instructions. For cell cycle analysis, the cells were trypsinized, washed with PBS, and fixed in 70% ethanol at −20°C for 4 h. Cell cycle distribution analysis was performed using a cell cycle detection kit (BD Biosciences, 550825). The cells were incubated with propidium iodide at room temperature for 30 min in the dark. The cell cycle was analyzed using FlowJo software (v7.0) on a FACSCcalibur flow cytometer (BD Biosciences, USA).
Measurement of the change of mitochondrial membrane potential
Changes of MMP were monitored using a mitochondrial membrane potential assay kit containing the lipophilic cationic probe JC-1 (Beyotime, C2006). In this study, UOK120 cells were cultured overnight in glass-bottom dish at a density of 2 × 10⁴ cells/well in 200 μL of culture medium. After the indicated treatments, the cells were incubated with JC-1 dye for 30 min at 37°C in the dark and rinsed twice with ice-cold JC-1 buffer solution. Then, the cells were image JC-1 fluorescence using confocal microscope.
MitoTracker, MitoSOX Red and LysoTracker label
UOK120 and UOK120 PRCC-TFE3 knockdown cells were loaded with 100 nM MitoTracker Deep Red (MTDR, 37°C, 30 min) to measure mitochondrial distribution, or with LysoTracker Red DND-99 (100 nM, 37°C, 30 min; Invitrogen, L7528) to label lysosomes, followed by a wash with warmed PBS. To measure mitochondrial reactive oxygen species (ROS) levels, cells were loaded with 10 µM MitoSOX Red (37°C, 20 min; Invitrogen, M36008), which is a mitochondrial superoxide indicator. The cells were incubated in extracellular medium (145 mM NaCl, 5 mM KCl, 1.8 mM CaCl2, 0.8 mM MgCl2, 10 mM HEPES, pH 7.2, 10 mM glucose, 0.1% BSA) and live-imaged immediately. The excitation and emission wavelengths for each fluorophore were selected according to the manufacturer’s instructions. The fluorescence intensity of each tracer in various conditions was expressed as intensity (OD) versus control cells. All data were acquired from experiments with at least 3 replicates. For cells with each treatment, at least 10 cells were quantified.
MitoTimer fluorescence
UOK120 and UOK120 PRCC-TFE3 knockdown cells transfected with MitoTimer for 24 h or 48 h, and live-imaged with a Olympus FV3000 Confocal Laser Scanning Microscope. MitoTimer transfected cells were excited in 2 channels via 2 sequential wavelengths (488 nm, green; 561 nm, red). The ratio of red: green (561:488 nm)-excited timer fluorescence was calculated as an index of mitochondrial turnover. All data were acquired from experiments with at least 3 replicates. For each genotype, at least 10 cells were imaged from 3 different experiments. The fluorescence intensity of labeled cells was analyzed with Image pro plus.
Statistical analysis
Statistical analyses were performed using Student’s two-tailed t-test or One-way ANOVA with Dunnett posttests. Data were represented as mean ± s.e.m of 3 independent experiments (biological replicates). Values of p < 0.05 were considered as significant.
Abbreviations
Baf A1: bafilomycin A1; CCCP: carbonyl cyanide 3-chloroyphenylhydrazone; CCK8: cell counting kits; ChIP: chromatin immunoprecipitation assay; Cl-CASP3: cleaved-caspase 3; COX4I1/COX IV: cytochrome c oxidase subunit 4I1; GFP: green fluorescent protein; HCQ: hydroxychloroquine; MAP1LC3B/LC3B-II: lipidated form of microtubule associated protein 1 light chain 3 beta; MiT/TFE: microphthalmia family of bHLH-LZ transcription factors; MTDR: MitoTracker Deep Red; MTOR: mechanistic target of rapamycin kinase; NLS: nuclear localization signal; NONO: non-POU domain containing octamer binding; NRF1: nuclear respiratory factor 1; OCR: oxygen consumption rate; OXPHOS: oxidative phosphorylation; PEITC: E-phenylethyl isothiocyanate; PI: propidium iodide; PINK1: PTEN induced kinase 1; PPARGC1A/PGC1-α: PPARG coactivator 1 alpha; PRCC: proline rich mitotic checkpoint control factor; PRKN/parkin: parkin RBR E3 ubiquitin protein ligase; RFP: red fluorescent protein; ROS: reactive oxygen species; TFE3/TFEA: transcription factor binding to IGHM enhancer 3; TOMM20: translocase of outer mitochondrial membrane 20; tRCC: translocation renal cell carcinoma; tTFE3: TFE3 fragment of NONO-TFE3 or PRCC-TFE3.
Ethics approval and consent to participate
The present study was approved by the Medical Ethics Committee of Affiliated Drum Tower Hospital of Medical School of Nanjing University.
Supplemental Material
Download Zip (8 MB)Acknowledgments
Patient-derived UOK cell lines were from Dr. Marston Linhan lab Urologic oncology Branch Tumor Cell Line Repository NCI. We would like to extend our sincere gratitude to Dr. W. Marston Linehan from the National Cancer Institute in America for giving us the UOK109 and UOK120 cell lines.
Disclosure statement
No potential conflict of interest was reported by the authors.
Supplementary material
Supplemental data for this article can be accessed here.
Additional information
Funding
Related Research Data
References
- Weterman MA, Wilbrink M, Geurts van Kessel A. Fusion of the transcription factor TFE3 gene to a novel gene, PRCC, in t(X;1)(p11;q21)-positive papillary renal cell carcinomas. Proc Natl Acad Sci U S A. 1996;93(26):15294–15298.
- de Jong B, Molenaar IM, Leeuw JA, et al. Cytogenetics of a renal adenocarcinoma in a 2-year-old child. Cancer Genet Cytogenet. 1986;21(2):165–169.
- Aksan I, Goding CR. Targeting the microphthalmia basic helix-loop-helix-leucine zipper transcription factor to a subset of E-box elements in vitro and in vivo. Mol Cell Biol. 1998;18(12):6930–6938.
- Hemesath TJ, Steingrimsson E, McGill G, et al. Microphthalmia, a critical factor in melanocyte development, defines a discrete transcription factor family. Genes Dev. 1994;8(22):2770–2780.
- Kauffman EC, Rickett CJ, Rais Bahrami S, et al. Molecular genetics and cellular features of TFE3 and TFEB fusion kidney cancers. Nat Rev Urol. 2014;11(8):465–475.
- Slade L, Pulinilkunnil T. The MiTF/TFE family of transcription factors: master regulators of organelle signaling, metabolism, and stress adaptation. Mol Cancer Res. 2017;15(12):1637–1643.
- Raben N, Puertollano R. TFEB and TFE3: linking lysosomes to cellular adaptation to stress. Annu Rev Cell Dev Biol. 2016;32(1):255–278.
- Lemasters JJ. Selective mitochondrial autophagy, or mitophagy, as a targeted defense against oxidative stress, mitochondrial dysfunction, and aging. Rejuvenation Res. 2005;8(1):3–5.
- Eiyama A, Okamoto K. PINK1/Parkin-mediated mitophagy in mammalian cells. Curr Opin Cell Biol. 2015;33:95–101.
- Kondapalli C, Kazlauskaite A, Zhang N, et al. PINK1 is activated by mitochondrial membrane potential depolarization and stimulates Parkin E3 ligase activity by phosphorylating Serine 65. Open Biol. 2012;25(5):2.
- Lazarou M, Sliter DA, Kane LA, et al. The ubiquitin kinase PINK1 recruits autophagy receptors to induce mitophagy. Nature. 2015;524(7565):309–314.
- Nezich CL, Wang C, Fogel AI, et al. MiT/TFE transcription factors are activated during mitophagy downstream of Parkin and Atg5. J Cell Biol. 2015;210(3):435–450.
- Baba M, Endoh M, Ma W, et al. Folliculin regulates osteoclastogenesis through metabolic regulation. J Bone Miner Res. 2018;33(10):1785–1798.
- Salma N, Song JS, Arany Z. Transcription factor Tfe3 directly regulates Pgc‐1alpha in muscle. J Cell Physiol. 2015;230(10):2330–2336.
- Ray PD, Huang BW, Tsuji Y. Reactive oxygen species (ROS) homeostasis and redox regulation in cellular signaling. Cell Signal. 2012;24(5):981–990.
- Porporato PE, Filigheddu N, Pedro JMB, et al. Mitochondrial metabolism and cancer. Cell Res. 2018;28(3):265–280.
- Cheng CW, C Y K, Fan CC. Overexpression of Lon contributes to survival and aggressive phenotype of cancer cells through mitochondrial complex I-mediated generation of reactive oxygen species. Cell Death Dis. 2013;4(6):e681.
- Kubli DA, Gustafsson AB. Mitochondria and mitophagy: the yin and yang of cell death control. Circ Res. 2012;111(9):1208–1221.
- Idelchik M, Begley U, Begley TJ, et al. Mitochondrial ROS control of cancer. Semin Cancer Biol. 2017;47:57–66.
- Le Gal K, Ibrahim MX, Wiel C, et al. Antioxidants can increase melanoma metastasis in mice. Sci Transl Med. 2015;7(308):308re8.
- Piskounova E, Agathocleous M, Murphy MM, et al. Oxidative stress inhibits distant metastasis by human melanoma cells. Nature. 2015;527(7577):186–191.
- Sayin VI, Ibrahim MX, Larsson E, et al. Antioxidants accelerate lung cancer progression in mice. Sci Transl Med. 2014;6(221):221ra15.
- Xiao D, Powolny AA, Moura MB, et al. Phenethyl isothiocyanate inhibits oxidative phosphorylation to trigger reactive oxygen species-mediated death of human prostate cancer cells. J Biol Chem. 2010;285(34):26558–26569.
- Xiao B, Deng X, Lim GGY, et al. Superoxide drives progression of Parkin/PINK1-dependent mitophagy following translocation of Parkin to mitochondria. Cell Death Dis. 2017;8(10):e3097.
- Wang Y, Nartiss Y, Steipe B, et al. ROS-induced mitochondrial depolarization initiates PARK2/PARKIN-dependent mitochondrial degradation by autophagy. Autophagy. 2012;8(10):1462–1476.
- Simon HU, Haj-Yehia A. Role of reactive oxygen species (ROS) in apoptosis induction. Apoptosis. 2000;5(5):415–418.
- Xu L, Lin DC, Yin D, et al. An emerging role of PARK2 in cancer. J Mol Med (Berl). 2014;92(1):31–42.
- Wang H, Song P, Du L, et al. Parkin ubiquitinates Drp1 for proteasome-dependent degradation: implication of dysregulated mitochondrial dynamics in parkinson disease. J Biol Chem. 2011;286(13):11649–11658.
- Florey O, Gammoh N, Kim SE, et al. V-ATPase and osmotic imbalances activate endolysosomal LC3 lipidation. Autophagy. 2015;11(1):88–99.
- Jacquin E, Leclerc-Mercier S, Judon C, et al. Pharmacological modulators of autophagy activate a parallel noncanonical pathway driving unconventional LC3 lipidation. Autophagy. 2017;13(5):854–867.
- Takahashi D, Moriyama J, Nakamura T, et al. AUTACs: cargo-specific degraders using selective autophagy. Mol Cell. 2019;76(5):797–810 e10.
- Namba T. BAP31 regulates mitochondrial function via interaction with Tom40 within ER-mitochondria contact sites. Sci Adv. 2019;5(6):eaaw1386.
- Zheng J, Croteau DL, Bohr VA, et al. Diminished OPA1 expression and impaired mitochondrial morphology and homeostasis in aprataxin-deficient cells. Nucleic Acids Res. 2019;47(8):4086–4110.
- Skalsky YM, Ajuh PM, Parker C, et al. PRCC, the commonest TFE3 fusion partner in papillary renal carcinoma is associated with pre-mRNA splicing factors. Oncogene. 2001;20(2):178–187.
- Weterman MAJ, van Groningen JJ, Jansen A, et al. Nuclear localization and transactivating capacities of the papillaryrenal cell carcinoma-associated TFE3 and PRCC (fusion) proteins. Oncogene. 2000;19(1):69–74.
- Yin X, Wang B, Gan W, et al. TFE3 fusions escape from controlling of mTOR signaling pathway and accumulate in the nucleus promoting genes expression in Xp11.2 translocation renal cell carcinomas. J Exp Clin Cancer Res. 2019;38(1):119.
- West AB, Kapatos G, O’Farrell C, et al. N-myc regulates parkin expression. J Biol Chem. 2004;279(28):28896–28902.
- Betschinger J, Nichols J, Dietmann S, et al. Exit from pluripotency is gated by intracellular redistribution of the bHLH transcription factor Tfe3. Cell. 2013;153(2):335–347.
- Pastore N, Vainshtein A, Klisch TJ, et al. TFE3 regulates whole-body energy metabolism in cooperation with TFEB. EMBO Mol Med. 2017;9(5):605–621.
- Raben N, Puertollano R. TFEB and TFE3: linking Lysosomes to Cellular Adaptation to Stress. Annu Rev Cell Dev Biol. 2016;32(32):255–278.
- Fernandez-Marcos PJ, Auwerx J. Regulation of PGC-1alpha, a nodal regulator of mitochondrial biogenesis. Am J Clin Nutr. 2011;93(4):884S–90.
- Satoh J, Kawana N, Yamamoto Y. Pathway analysis of ChIP-Seq-based NRF1 target genes suggests a logical hypothesis of their involvement in the pathogenesis of neurodegenerative diseases. Gene Regul Syst Bio. 2013;7:139–152.
- Hernandez G, Thornton C, Stotland A, et al. MitoTimer: a novel tool for monitoring mitochondrial turnover. Autophagy. 2013;9(11):1852–1861.
- Dolman NJ, Chambers KM, Mandavilli B, et al. Tools and techniques to measure mitophagy using fluorescence microscopy. Autophagy. 2014;9(11):1653–1662.
- Li Y, Qin Y, Yang C, et al. Cardamonin induces ROS-mediated G2/M phase arrest and apoptosis through inhibition of NF-kappaB pathway in nasopharyngeal carcinoma. Cell Death Dis. 2017;8(8):e3024.
- Martina JA, Diab HI, Lishu L, et al. The nutrient-responsive transcription factor TFE3 promotes autophagy, lysosomal biogenesis, and clearance of cellular debris. Sci Signal. 2014;7(309):ra9–ra9.
- Argani P, Zhong M, Reuter VE, et al. TFE3-fusion variant analysis defines specific clinicopathologic associations among Xp11 translocation cancers. Am J Surg Pathol. 2016;40(6):723–737.
- Ellis CL, Eble JN, Subhawong AP, et al. Clinical heterogeneity of Xp11 translocation renal cell carcinoma: impact of fusion subtype, age, and stage. Mod Pathol. 2014;27(6):875–886.
- Yin Q, Jian Y, Xu M, et al. CDK4/6 regulate lysosome biogenesis through TFEB/TFE3. J Cell Biol. 2020;219(8):e201911036.
- Bouman L, Schlierf A, Lutz AK, et al. Parkin is transcriptionally regulated by ATF4: evidence for an interconnection between mitochondrial stress and ER stress. Cell Death Differ. 2011;18(5):769–782.
- Tran TA, Nguyen AD, Chang J, et al. Lipopolysaccharide and tumor necrosis factor regulate Parkin expression via nuclear factor-kappa B. PLoS One. 2011;6(8):e23660.
- Zhang W, Hu X, Shen Q, et al. Mitochondria-specific drug release and reactive oxygen species burst induced by polyprodrug nanoreactors can enhance chemotherapy. Nat Commun. 2019;10(1):1704.
- Gupta P, Wright SE, Kim SH, et al. Phenethyl isothiocyanate: a comprehensive review of anti-cancer mechanisms. Biochim Biophys Acta. 2014;1846(2):405–424.
- Chen G, Chen Z, Hu Y, et al. Inhibition of mitochondrial respiration and rapid depletion of mitochondrial glutathione by beta-phenethyl isothiocyanate: mechanisms for anti-leukemia activity. Antioxid Redox Signal. 2011;15(12):2911–2921.
- Pustylnikov S, Costabile F, Beghi S, et al. Targeting mitochondria in cancer: current concepts and immunotherapy approaches. Transl Res. 2018;202:35–51.
- Picchio MC, Martin ES, Cesari R. Alterations of the tumor suppressor gene Parkin in non-small cell lung cancer. Clin Cancer Res. 2004;10(8):2720–2724.
- Toma MI, Grosser M, Herr A. Loss of heterozygosity and copy number abnormality in clear cell renal cell carcinoma discovered by high-density affymetrix 10K single nucleotide polymorphism mapping array. Neoplasia. 2008;10(7):634–642.
- Yeo CW, Ng FSL, Chai C, et al. Parkin pathway activation mitigates glioma cell proliferation and predicts patient survival. Cancer Res. 2012;72(10):2543–2553.