
ABSTRACT
Mitochondria-associated membranes (MAMs) are essential communication subdomains of the endoplasmic reticulum (ER) that interact with mitochondria. We previously demonstrated that, upon macroautophagy/autophagy induction, AMBRA1 is recruited to the BECN1 complex and relocalizes to MAMs, where it regulates autophagy by interacting with raft-like components. ERLIN1 is an endoplasmic reticulum lipid raft protein of the prohibitin family. However, little is known about its association with the MAM interface and its involvement in autophagic initiation. In this study, we investigated ERLIN1 association with MAM raft-like microdomains and its interaction with AMBRA1 in the regulation of the autophagic process. We show that ERLIN1 interacts with AMBRA1 at MAM raft-like microdomains, which represents an essential condition for autophagosome formation upon nutrient starvation, as demonstrated by knocking down ERLIN1 gene expression. Moreover, this interaction depends on the “integrity” of key molecules, such as ganglioside GD3 and MFN2. Indeed, knocking down ST8SIA1/GD3-synthase or MFN2 expression impairs AMBRA1-ERLIN1 interaction at the MAM level and hinders autophagy. In conclusion, AMBRA1-ERLIN1 interaction within MAM raft-like microdomains appears to be pivotal in promoting the formation of autophagosomes.
Abbreviations: ACSL4/ACS4: acyl-CoA synthetase long chain family member 4; ACTB/β-actin: actin beta; AMBRA1: autophagy and beclin 1 regulator 1; ATG14: autophagy related 14; BECN1: beclin 1; CANX: calnexin; Cy5: cyanine 5; ECL: enhanced chemiluminescence; ER: endoplasmic reticulum; ERLIN1/KE04: ER lipid raft associated 1; FB1: fumonisin B1; FE: FRET efficiency; FRET: Förster/fluorescence resonance energy transfer; GAPDH: glyceraldehyde-3-phosphate dehydrogenase; GD3: aNeu5Ac(2-8)aNeu5Ac(2-3)bDGalp(1-4)bDGlcp(1-1)ceramide; HBSS: Hanks’ balanced salt solution; HRP: horseradish peroxidase; LMNB1: lamin B1; mAb: monoclonal antibody; MAMs: mitochondria-associated membranes; MAP1LC3B/LC3: microtubule associated protein 1 light chain 3 beta; MFN2: mitofusin 2; MTOR: mechanistic target of rapamycin kinase; MYC/cMyc: proto-oncogene, bHLH transcription factor; P4HB: prolyl 4-hydroxylase subunit beta; pAb: polyclonal antibody; PE: phycoerythrin; SCAP/SREBP: SREBF chaperone; SD: standard deviation; ST8SIA1: ST8 alpha-N-acetyl-neuraminide alpha-2,8 sialyltransferase 1; SQSTM1/p62: sequestosome 1; TOMM20: translocase of outer mitochondrial membrane 20; TUBB/beta-tubulin: tubulin beta class I; ULK1: unc-51 like autophagy activating kinase 1; VDAC1/porin: voltage dependent anion channel 1.
Introduction
Autophagosomes are spherical double-membrane vesicles generated during autophagy that are derived from several membrane sources, including the endoplasmic reticulum (ER) and mitochondria [Citation1,Citation2]. Emerging evidence indicates that membrane isolation is tightly coordinated by particular subdomains named mitochondria-associated membranes (MAMs), which represent 5–20% of the mitochondrial surface in close contact with the ER in resting condition, but this percentage dynamically increases following various cell stresses [Citation3–5]. According to these reports, MAMs can facilitate a variety of signaling processes since they are considered as essential communication domains able to collect different core molecules, thus contributing to coordinate their functions. In fact, Ca2+ regulation, cholesterol transfer, phospholipid transport and ATP production have been widely linked to MAMs. In particular, deregulation of Ca2+ trafficking seems to be responsible for unfolding protein, metabolic disruption and apoptosis; in this regard, it is known that lipid rafts are involved in coordinating the protein interactions required for proper Ca2+ exchange between the MAM and mitochondria [Citation6,Citation7]. More recently, a crucial role for ER-mitochondria association in autophagy initiation was also suggested. Autophagy is a highly dynamic process, which demands trafficking and membrane components involved in degradation and recycling of cell constituents, such as proteins or organelles [Citation1,Citation8]. Regulation of autophagy can occur at different steps of its multifaceted pathway, so pioneering researches have focused on the detailed analysis of these complex interactions. Autophagy initiation is mainly induced under nutrient starvation upon ULK1 (unc-51 like autophagy activating kinase 1) activation [Citation9]. In particular, the subdomains at MAM level during autophagic process have been reported to comprise some specific proteins, including ATG14 (autophagy related 14) [Citation1], ATG2 [Citation10], WIPI (WD repeat domain, phosphoinositide interacting) [Citation11], BECN1 (beclin1) and AMBRA1 (autophagy and beclin 1 regulator 1) [Citation12]. AMBRA1 has been found to be essential for autophagy induction by promoting the activity of both ULK1 and BECN1 complexes [Citation13–15], as well as in the temporal regulation of autophagy response [Citation16]. Under basal condition, AMBRA1 is negatively phosphorylated by MTOR (mechanistic target of rapamycin kinase) and sequestered to microtubules through the dynein motor complex. Upon autophagy stimulation, the ULK1-mediated phosphorylation of AMBRA1 drives its translocation to ER, where binds to the BECN1 complex and promotes the autophagic cascade [Citation14,Citation17]. More recently, we showed that the stimulation of autophagy by nutrient starvation leads to the re-localization of AMBRA1 at the MAM level together with the BECN1 complex. On MAM, AMBRA1 interacts with lipid raft-like components, such as GD3 and WIPI1, and positively regulates autophagy. These results confirmed the role of AMBRA1 in the organelle membrane scrambling activity, which finally leads to the formation of autophagosome [Citation12].
Lipid rafts, dynamic assemblages of sphingolipids, cholesterol and proteins have been reported to reside within cell membranes [Citation18,Citation19], including membranes of intracellular organelles, such as ER [Citation20] and mitochondria termed “raft-like microdomains” [Citation21,Citation22]. The presence of these structures in the MAM vesicles has been reported by several authors [Citation12,Citation23]. Moreover, a growing number of large-scale proteomics studies characterized the molecular composition of MAM-associated lipid microdomains [Citation24] and their implications in regulating and influencing a variety of cellular activities [Citation25], including the autophagic process [Citation26]. In fact, multiple MAM proteins have been reported to locate within lipid rafts, including palmitoylated TMX1 [Citation27], SIGMAR1 (sigma non opioid intracellular receptor 1) [Citation20], PSEN2 (presenilin 2) [Citation23], and RTN1 (reticulon 1) [Citation28]. However, further molecules resident or associated with MAMs that can influence specific signaling remain to be identified. On this regard, Browman et al. [Citation29] focused on the identification and characterization of two novel proteins preferentially enriched in lipid raft fractions from ER fractions of myelomonocytic cells: ERLIN1/KE04 (ER lipid raft associated 1) and ERLIN2/C8orf2 (ER lipid raft associated 2), proposed as the most recently discovered members of the prohibitin family of proteins. ERLIN1 and ERLIN2 are highly homologous and hetero-oligomerize to form a massive protein complex of ~40 subunits in lipid rafts [Citation30,Citation31]. A well-defined function of this complex is to mediate the ubiquitination of activated ITPRs (inositol 1,4,5-trisphosphate receptors) and then their degradation [Citation32–34]. Moreover, ERLIN proteins have been proposed to function as chaperones for mitochondrial membrane proteins [Citation35] and to play a role in regulating cellular cholesterol homeostasis through SCAP/SREBP (SREBF chaperone) activity [Citation36,Citation37] Although ERLIN1 and ERLIN2 are well known as exclusively lipid raft-located proteins on ER membrane, only little is known on their association with ER-MAM interface [Citation38] and their involvement in autophagic initiation.
In this study, we identified the interaction of ERLIN1 with the autophagic protein AMBRA1 and that these proteins cluster at MAM raft-like microdomains to promote the autophagosome formation upon starvation. Moreover, we demonstrated that this interaction depends on “integrity” of the close apposition between the ER and mitochondria, i.e., MAMs mediated by raft-like components.
In this regard, several candidates have been reported as mediator molecule between ER and mitochondria in both tethering and scrambling, including MFN2 (mitofusin 2) [Citation39–41]. Notably, disruption of mitochondrial dynamics by making MAM faulty is emerging as a pathogenetic determinant in prevalent diseases in which MFN2 has been shown to play a pivotal role [Citation42,Citation43].
In the present work, we revealed that a content modulation of both MFN2 and ganglioside GD3 within MAMs greatly influences the association between ERLIN1 and AMBRA1, thus regulating the autophagic process.
Results
ERLIN1 localization in MAM fractions
While it is well known that ERLIN1 predominantly associates with ER lipid raft-like domains, there is no evidence that this subcellular localization corresponds to the lipid raft-like domains present at MAM level. With this aim, MAMs isolated by subcellular fractionation from human 2FTGH (2F) cells were checked for the presence of ERLIN1 following incubation with a nutrient-free medium (HBSS), a physiological inducer of autophagy.
Crude mitochondrial fractions were sub-fractionated to obtain both MAMs and pure mitochondria fractions. All fractions, including ER, cytosol and nuclei were subjected to western blot analysis. As revealed in (left panel), ERLIN1 is present in isolated MAMs derived from both fed and starved cells, but not in pure mitochondrial fractions. Densitometric analysis confirmed that this association is increased following autophagy induction by HBSS (, bar graph on the right). Moreover, as expected, ERLIN1 was also present in ER and crude mitochondria (Cmit) fractions from both treated and untreated cells (, left panel). Purity of MAM preparations was verified by testing the presence of specific markers: ACSL4 (acyl-CoA synthetase long chain family member 4) for MAMs, CANX (calnexin) for MAMs and ER, VDAC1 (voltage dependent anion channel 1) for mitochondria and MAMs, TOMM20 (translocase of outer mitochondrial membrane 20) for mitochondria, TUBB/beta-tubulin (tubulin beta class I) for cytosol, LMNB1 (lamin B1) for nuclei and P4HB (prolyl 4-hydroxylase subunit beta) for ER (, left panel).
Figure 1. ERLIN1 distribution in MAM fractions from stimulated HBSS cells. (A) Protein components of subcellular fractions prepared from human 2FTGH (2F) fibroblasts cells, either untreated or treated with HBSS for 1 h, were detected by immunoblot analysis. MAM: mitochondria-associated membrane; Pmit: pure mitochondrial fraction; Cmit: crude mitochondrial fraction; ER; Cyt: cytosol; Nuc: nuclear fraction; Tot: total extracts. All fractions were analyzed by western blot using an anti-ERLIN1 mAb. The purity of all subcellular fractions was also tested by western blotting for the presence of specific markers: ACSL4 for MAMs, CANX for MAMs and ER, VDAC1 for mitochondria and MAMs, TOMM20 for mitochondria, TUBB/beta-tubulin for cytosol, LMNB1 for nuclei and P4HB for ER. Autophagy was checked by western blot analysis using rabbit anti-LC3 pAb or rabbit anti-SQSTM1 mAb. Loading control was evaluated using anti-ACTB mAb. A representative experiment among 3 is shown. Bar graph on the right shows densitometric analysis. Results represent the mean ± SD from 3 independent experiments. ***p ≤ 0.001, HBSS vs control cells. (B) Autophagy evaluation by western blot analysis using rabbit anti-LC3 pAb or rabbit anti-SQSTM1 mAb (first panel). Loading control was evaluated using anti-ACTB mAb. In the second panel, a bar graph showing densitometric analysis from 3 independent experiments and reported as the mean ± SD. ***p ≤ 0.001 HBSS vs control cells. Third and fourth panels show flow cytometry analysis of autophagy performed with a cyto-ID autophagy detection kit. Numbers represent the mean ± SD of the median fluorescence intensity obtained in three independent experiments. (C) Autophagy evaluation by flow cytometry (first to third panel) o by fluorescence microscopy (pictures on the right) after dual cell staining with anti-LC3 and anti-SQSTM1. For fluorescence microscopy, cells were also counterstained with Hoechst. All these different methods of detecting autophagy produced completely overlapping results
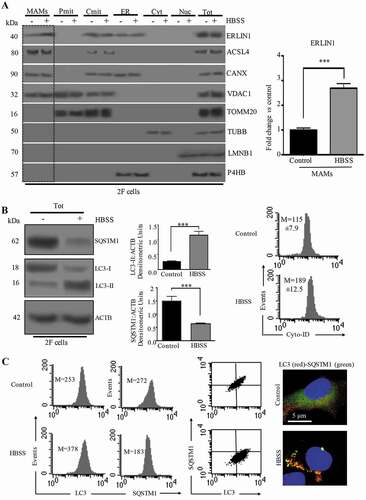
Autophagy induction was checked in control and HBSS-treated cells by western blot analysis, using anti-MAP1LC3/LC3 (microtubule associated protein 1 light chain 3) or anti-SQSTM1/p62 (sequestosome 1) antibodies (), and by flow or static cytometry using either Cyto-ID Autophagy Detection Kit () or anti-LC3 and anti-SQSTM1 (). Western blot analysis revealed an increase of LC3-II after cell starvation together with a significant decreased of SQSTM1 (, left panel), as also confirmed by densitometric analysis (, central panel, bar graphs). As far as Cyto-ID was concerned, a significant increase in green fluorescence emission was observed, as evidenced by higher median fluorescence values in starved fibroblasts than in control cells, which indicates the formation of LC3 puncta [Citation12] (, right panels). Western blot analysis, flow cytometry evaluations (, left panels) and fluorescence microscopy (, see micrographs right panels) all highlighted the formation of LC3 puncta (red) and the reduction of SQSTM1 (green) in 2F cells subjected to HBSS treatment. An example of autophagy evaluation, performed by flow and static cytometry in 2F cells treated with the main modulators of autophagy, such as rapamycin, 3-methyladenine (3-MA) and bafilomycin A1 is showed in Figure S1.
Figure 2. AMBRA1-ERLIN1 association during autophagy induction in 2F cells. (A) 2F cells, untreated or treated with HBSS for 1 h, were lysed in lysis buffer, followed by immunoprecipitation with rabbit anti-AMBRA1 pAb. A rabbit IgG isotypic control (IpCtr) was employed. The immunoprecipitates were analyzed for the presence of ERLIN1 by western blot analysis, using anti-ERLIN1 mAb. A representative experiment among 3 is shown. As a control, the immunoprecipitates were assessed by immunoblot with anti-AMBRA1 mAb. Bar graph in the right panel shows densitometric analysis. Results represent the mean ± SD from 3 independent experiments. ***p ≤ 0.001 HBSS vs control cells. Autophagy was checked by western blot analysis using rabbit anti-LC3 pAb or rabbit anti-SQSTM1 mAb. Loading control was evaluated using anti-ACTB mAb. Results represent the mean ± SD from 3 independent experiments. ***p ≤ 0.001 HBSS vs control cells. (B) Quantitative evaluation of AMBRA1-ERLIN1 association by FRET technique as revealed by flow cytometry analysis. Numbers in the first and second panels indicate the percentage of FL3-positive events (FRET channel), obtained in one experiment representative of three. Third panels. Bar graphs showing the FRET efficiency, calculated according to the Riemann’s algorithm, of AMBRA1 and ERLIN1 molecular association. Data are reported as mean ± SD from three independent experiments. Fourth panels. Flow cytometry analysis of autophagy in Control (full gray curves) and HBSS treated cells (empty curves), with or without FB1, performed with a Cyto-ID Autophagy Detection kit. Numbers represent the mean ± SD of the median fluorescence intensity obtained in three independent experiments. A representative experiment among three is shown. In the fifth panel bar graphs showing the mean ± SD obtained from three independent experiments. **p ≤ 0.01 vs control
AMBRA1-ERLIN1 association following autophagy induction
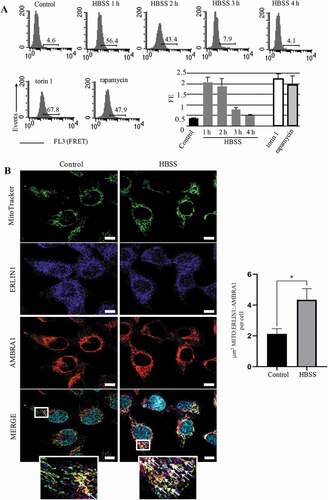
We identified ERLIN1 as an AMBRA1-binding protein in a proteomic screening ( and S1) [Citation16,Citation44]. Since we previously showed that AMBRA1 is strictly associated with lipid rafts at the MAMs during HBSS-induced autophagy [Citation12], in the present work, we decided to investigate if the interaction of AMBRA1 with ERLIN1 could occur at MAMs. Human 2F cells in fed and starved conditions were subjected to immunoprecipitation using an anti-AMBRA1 antibody. Western blot (, left panel) and densitometric analyses (, right panel bar graphs) of immunoprecipitated complexes revealed that, upon autophagy stimulation, ERLIN1 is closely associated with AMBRA1, although an interaction was already observed in unstimulated cells, possibly due to the presence of a pool of AMBRA1 at ER level under fed conditions [Citation17]. No bands were detected in immunoprecipitated with control IgG (, left panel). Autophagy induction in starved conditions was checked by western blot analysis using anti-LC3 and anti-SQSTM1 antibodies (, bottom panels). As an alternative method to evaluate molecular associations, we used Förster/Fluorescence Resonance Energy Transfer (FRET) (), which corroborated immunoprecipitation results, indicating that the association of AMBRA1 and ERLIN1, already present in control 2F cells (9.4%), increased significantly after incubation with HBSS medium (49.8%). This was also confirmed by calculating FRET efficiency (FE) from 3 independent experiments (, bar graphs in the middle). Interestingly, the ceramide synthase inhibitor fumonisin B1 (FB1) significantly reduced HBSS-induced autophagy in 2F cells, as revealed by flow cytometry using the Cyto-ID Autophagy Detection Kit (, bottom panels on the right), as well as significantly hindered AMBRA1-ERLIN1 interaction (, bottom panel on the left), strongly suggesting that this molecular association takes place within lipid rafts. A positive control for FRET analysis, performed in 2F cells to quantify molecular association α-β tubulin after treatment with demecolcine or with paclitaxel is showed in Figure S2. Performing a time-coTrse analysis of AMBRA1-ERLIN1 association, we found that the significant association of AMBRA1 and ERLIN1 observed after 1 h HBSS treatment was also present at 2 h, but decreased substantially at 3 h and 4 h of treatment (, upper panel). Notably, AMBRA1-ERLIN1 association was also confirmed in cells treated with rapamycin or with the MTOR inhibitor torin 1 (, lower panel). To verify that AMBRA1-ERLIN1 interaction during autophagy occur at MAMs, we performed confocal microscopy analysis after staining with MitoTracker (green), anti-AMBRA1 (red), anti-ERLIN1 (blue) antibodies. We observed colocalization of ERLIN1 with AMBRA1 at preferential mitochondria sites (see overlapping areas resulting from green, red and blue fluorescence in merge micrograph, arrows in ), which is increased after 1 h HBSS treatment (, arrows in magnification merge micrograph). ERLIN1 and AMBRA1 also largely colocalize with an ER marker (ER-GFP), but their overlap was similar in untreated fibroblasts and in HBSS-treated cells (Figure S3).
Table 1. Identification of ERLIN1 as an AMBRA1-interacting protein by mass spectrometry
Figure 3. AMBRA1-ERLIN1association during autophagy induction in 2F cells. (A) 2FTGH fibroblasts were treated with HBSS (Sigma, H9269) for 1, 2, 3 and 4 h. We considered the same cells treated with 50 nM rapamycin or with 100 nM torin 1 for 4 h as positive controls. At the end of treatment cells were harvested and analyzed by flow cytometry after single staining with Cyto-ID autophagy detection kit (left panel). In upper panels, the results obtained in a representative experiment are shown. Numbers represent the median fluorescence intensity values of the histograms. Bar graph in lower panel reports the mean ± SD of the results obtained in three independent experiments. (B) Increased colocalization between AMBRA1, ERLIN1 and a specific mitochondrial tracker upon autophagy induction. Untreated or HBSS-treated 2F cells were stained with MitoTracker (green), anti-AMBRA1 (red) and anti-ERLIN1 (blue) antibodies. Nuclei were stained with DAPI (Turquoise). To note, overlapping areas resulting from green, red and blue fluorescence in merge micrograph (see arrows in magnification of the boxed areas) indicate that colocalization of ERLIN1-AMBRA1-MitoTracker increases in cells treated with HBSS as compared to untreated cells. Images were acquired using a LSM 900, Airyscan SR Zeiss confocal microscopy and the co-localization between ERLIN1, AMBRA1 and MitoTracker was measured using the ZEN 3.0 Blue edition software and expressed as μm2 per cell. A minimum of 30 cells/sample was analyzed, and the statistical analysis was performed using Student’s t-test, *p ≤ 0.05 (right panel). Scale bar: 10 μm
Knocking down ERLIN1 expression hinders autophagy
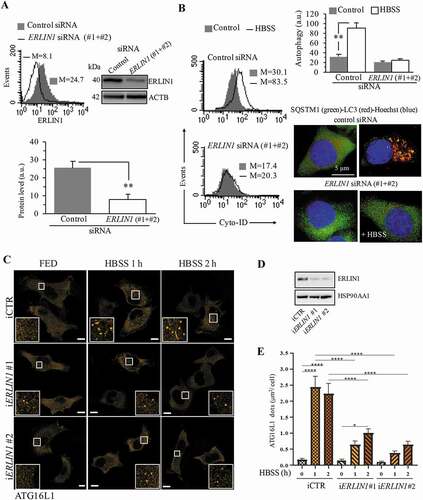
In order to evaluate the functional role of ERLIN1 in autophagy, we analyzed the impact of ERLIN1 downregulation on autophagy levels in 2F cells. Cells transfected with a pool of the two siRNA ERLIN1 oligonucleotides (#1 and #2) showed a significant decrease of ERLIN1 expression, as demonstrated by both western blot and cytofluorimetric analyses (). Knocking down ERLIN1 also causes a reduction of autophagy after nutrient starvation in comparison with cells transfected with control siRNA, as revealed either by flow cytometry after cell staining with Cyto-ID autophagy detection kit or by immunofluorescence microscopy after dual staining of cells with anti-LC3 (red) and SQSTM1 (green) (). We also evaluated the number of nascent autophagosomes by analyzing the subcellular localization of ATG16L1, a protein that selectively labels nascent autophagic vesicles [Citation45]. As shown in –E, ERLIN1 downregulation significantly reduced the formation of ATG16L1 puncta observed upon nutrient starvation, suggesting that ERLIN1 plays a role in autophagosome biogenesis.
Figure 4. Knocking down ERLIN1 expression hinders autophagy. (A) Cytofluorimetric and western blot evaluation of ERLIN1 expression level 48 h after specific siRNA transfection (#1 + #2). Representative experiments are shown. Numbers in the left panel represent the median fluorescence intensity. Bar graph showing the mean ± SD among 3 independent cytofluorimetric evaluations. (B) In the left panels, semiquantitative flow cytometry analysis performed with a Cyto-ID Autophagy detection kit of autophagy induced by HBSS in 2F fibroblasts knocked down for ERLIN1 or in cells transfected with control non-silencing siRNA. Numbers represent the median fluorescence intensity. Bar graph on the right shows the mean ± SD among 3 independent experiments. Pictures on the right show immunofluorescence analysis after cell staining with anti-LC3 (red) and anti-SQSTM1 (green) and Hoechst (blue). (C) Representative fluorescence images of Flag mATG16L1 expression in iERLIN1 2F cells subjected, or not, to nutrient deprivation, adding HBSS for 1 or 2 h. Scale bar: 10 μm. (D) Western blotting evaluation of ERLIN1 downregulation in Flag mATG16L1 expressing 2F cells. (E) Quantitative analysis of ATG16L1 dots area (μm2) per cell reported as the mean ± SD, *P ≤ 0.05, ****P ≤ 0.0001 using ANOVA 2-way test for repeated samples
To further confirm the role of ERLIN1 in autophagy, we analyzed autophagy flux by both western blot and immunofluorescence approaches. 2F cells were transfected with two different siRNA oligonucleotides specific for ERLIN1 and the efficient downregulation of ERLIN1 expression was validated by qRT-PCR and western blot after 48h (). Autophagy flux was assessed by comparing the levels of lipidated LC3-II by western blot in control and ERLIN1-silenced cells in the presence or absence of the lysosomal inhibitor bafilomycin A1. As shown in , ERLIN1-silenced cells displayed reduced LC3-II accumulation compared to control ones when incubated in HBSS for 2 or 4 h and lysosomal activity was inhibited by bafilomycin A1 in the last hour before lysis, indicating a requirement of ERLIN1 for an efficient induction of autophagy. Notably, the role of ERLIN1 in autophagy induction was also confirmed when autophagy flux was monitored in 2F cells treated with the MTOR inhibitor torin 1 (Figure S4).
Figure 5. Autophagy flux evaluation in iERLIN1 cells. ERLIN1 expression was downregulated by siRNA using two different oligonucleotides in 2F cells and qRT-PCR (A) and western blotting (B) were performed to evaluate ERLIN1 mRNA levels from three independent experiments; *p ≤ 0.05 and ****p ≤ 0.0001 using Student’s t-test. (C) iERLIN1 cells were starved for the indicated time points and incubated with the lysosome inhibitor, bafilomycin A1 or vehicle for 1 h before lysis. LC3 lipidation and SQSTM1 were detected by immunoblotting using specific antibodies; GAPDH was incubated as a loading control. The graph reports mean ± SD of LC3-II:GAPDH and SQSTM1:GAPDH from three independent experiments; *p ≤ 0.05, **p ≤ 0.01 using ANOVA 2-way test for repeated samples. (D) Western blotting evaluation of ERLIN1 downregulation in GFP-RFP-LC3-expressing 2F cells. (E) Representative fluorescence images of LC3 puncta in GFP-RFP-LC3-expressing iERLIN1 2F cells, subjected or not to autophagy induction by nutrient deprivation for 2 h (HBSS). The upper panel reports the amount of autophagosomes per cell measured as the mean area ± SD of RFP-GFP colocalizing puncta (μm2/cell); the lower panel reports the amount of autolysosomes reported as the mean area ± SD of RFP-only puncta (μm2/cell). **P ≤ 0.01, ****P ≤ 0.0001 using ANOVA 2-way test for repeated samples. Scale bar: 10 μm
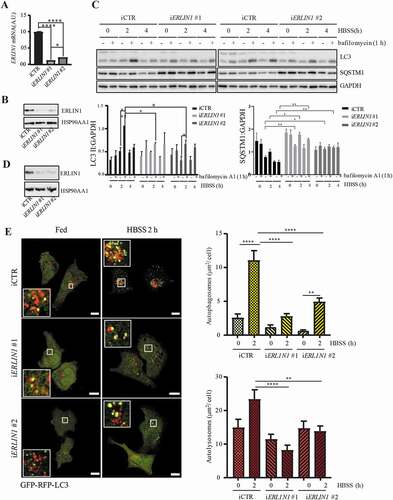
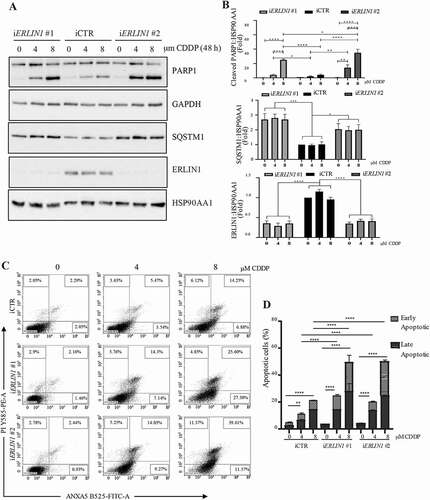
Moreover, autophagy flux was evaluated by means of a GFP-RFP-LC3 reporter, which allows to detect either autophagosomes (both GFP- and RFP-positive) or autolysosomes (RFP-positive, GFP-negative) [Citation46]. ERLIN1 silencing led to a significant decrease of autophagy flux in starved conditions, as shown by the decreased number of both autophagosomes and autolysosomes (). We then evaluated if the role of ERLIN1 is not limited to the autophagy response to nutrient starvation by also affects the autophagy-dependent survival to cisplatin treatment. To this aim, ERLIN1-silenced cells were treated with cisplatin for 48 h and cell death assessed by PARP cleavage () and ANXA5 (annexin A5)-propidium iodide staining (), while autophagy was analyzed by monitoring SQSTM1 levels. As shown in –D ERLIN1 downregulation results in impaired autophagy and increased susceptibility of 2F cells to the cytotoxic effect of cisplatin. In 2F cells treated with cisplatin, we observed a significant increase of autophagy at earlier time points, i.e. after 24 h (Figure S5A), as revealed by flow cytometry using Cyto-ID detection kit, paralleled by an increase of ERLIN1 association with the MAM’s marker MFN2 as quantified by FRET efficiency (Figure S5B).
Figure 6. ERLIN1 downregulation sensitizes 2F cells to cisplatin-induced cell death. Analysis of cell death in 2F cells downregulated for ERLIN1 expression in response cisplatin (CDDP) treatment for 4 or 8 μM (48 h) monitored by (A) western blotting of cleaved PARP1, SQSTM1 and ERLIN1 and (B) densitometric analysis (bar graph in the right panel (n = 4, p-value **≤0.01, ***≤0.001 ****≤0.0001, *P ≤ 0.05, ****P ≤ 0.0001 using ANOVA 2-way test for repeated samples) or (C) by PI-ANXA5 incorporation by FACS; representative dot plots of ANXA5-propidium iodide by flow cytometry are showed; (D) Quantitative analysis of PI-ANXA5 incorporation. (n = 3, **p-value ≤ 0.01, ***p ≤ 0.001 ****p ≤ 0.0001 *P ≤ 0.05, ****P ≤ 0.0001 using ANOVA 2-way test for repeated samples)
AMBRA1-ERLIN1 associate through the C terminal and central regions of AMBRA1
To identify the domain of AMBRA1 involved in the interaction with ERLIN1, we took advantage of previously described 2F cells expressing MYC/cMyc (MYC proto-oncogene, bHLH transcription factor) tagged AMBRA1 deletion mutants [Citation13]: AMBRA1 N-terminal (F1) AMBRA1 central region (F2) and AMBRA1 C-terminal (F3) (Table S2, ). As positive and negative controls, 2F cells expressing MYC-tagged AMBRA1 full-length protein (AMBRA1 FL) and 2F cells infected with retroviral vectors encoding MYC-tagged beta-gal protein, respectively, were used (Figure S6). Western blot and quantification by densitometric analyses of AMBRA1-immunoprecipitated complexes confirmed an interaction between ERLIN1 and AMBRA1 in both unstimulated beta-gal and AMBRA1 FL cells that significantly increased upon starvation condition in both cell lines. However, in starved AMBRA1-overexpressing cells, the association AMBRA1-ERLIN1 was significantly more evident. FRET analysis substantially confirmed results obtained by immunoprecipitation. Both western blot and flow cytometry analyses indicated that AMBRA1 FL cells were more prone to undergo autophagy than beta-gal cells, supporting the view that these cells may represent a useful cellular model to study the role of ERLIN1 during the autophagic process.
Figure 7. AMBRA1 interacts with ERLIN1 in AMBRA1 FL/F1-3 fragments overexpressed cells during autophagy. (A) 2F cells were coinfected with retroviral vectors encoding MYC-tagged AMBRA1 proteins or MYC-tagged beta-gal as a negative control; FL, full length; F1–3, fragments 1–3. (B) Cells, untreated or treated with HBSS for 1 h were lysed in lysis buffer. Protein extracts were subjected to IP using an anti-MYC antibody (IP MYC). Purified complexes were analyzed by WB using an anti-ERLIN1 (top) or anti-MYC (bottom) antibodies. A representative experiment among 3 is shown. Bar graph in the right panel shows densitometric analysis. Results represent the mean ± SD from 3 independent experiments. ***p ≤ 0.001 and ****p ≤ 0.0001. (C) A rabbit IgG isotypic control (IpCtr) was employed. WB was performed using an anti-ERLIN1 (top) or anti-MYC (bottom) antibodies; on right WB of the AMBRA1 mutants with the corresponding amino acid sequence boundary from total extracts is showed. A representative experiment among 3 is shown. (D) Modulation of autophagy by AMBRA1 FL/F1-3 fragments expressed cells. FL, or F1-3 untreated or treated cells with HBSS for 1 h were lysed in lysis buffer and the occurrence of autophagy was analyzed by LC3-I to LC3-II conversion using rabbit anti-LC3 pAb or by degradation of SQSTM1 using rabbit anti-SQSTM1 mAb. Loading control was evaluated using anti-ACTB mAb. Densitometric analysis of the band density ratio of LC3-II relative to ACTB is reported. A representative experiment among 3 is shown. Bar graph in the right panel shows densitometric analysis. Results represent the mean ± SD from 3 independent experiments. ***p ≤ 0.001 and ****p ≤ 0.0001, HBSS vs control cells. (E) shBECN1 cells and shRNA control cells were transfected with an expression vector encoding MYC-tagged AMBRA1 and cultured in nutrient-rich conditions or nutrient starvation for 1 h. AMBRA1 was immunoprecipitated using an anti-MYC antibody. Immunocomplexes and total extracts (input) were analyzed by western blot using anti AMBRA1 and ERLIN1 antibodies. HSP90AA1 levels were analyzed in total extracts as loading control
Then, upon autophagy induction by incubation in HBSS for 1 h, lysates from beta-gal, AMBRA1 FL, AMBRA1 N-terminal (F1), AMBRA1 central region (F2), and AMBRA1 C-terminal (F3) cell lines were subjected to immunoprecipitation using an anti-MYC-tagged antibody (IP MYC) and immunocomplexes were analyzed by western blot analysis using an anti-ERLIN1 or anti-MYC antibodies (, left panel). Densitometric analysis of MYC immunoprecipitates revealed an increased association between AMBRA1 and ERLIN1 in both fibroblasts expressing F2 and F3 fragments, respectively, following autophagy induction, although a low level of interaction was already evident in untreated cells (, right panel bar graphs). We also found a lower degree of AMBRA1-ERLIN1 association in fibroblasts expressing the F1 fragment after HBSS incubation compared to F2 and F3 (), which could be due to the ability of the WD40 domain of AMBRA1 to mediate dimerization with endogenous full-length protein (data not shown). No bands were detected in control immunoprecipitation experiments with IgG having irrelevant specificity both in untreated or in HBSS-treated cells (, left panel). These results indicated that the C terminal and central regions of AMBRA1 are involved, directly or indirectly, in the interaction with ERLIN1 during autophagy induction.
Importantly, we also observed cells expressing the ERLIN1 interacting AMBRA1 fragments have higher levels of autophagy, as verified by assessing the conversion of LC3-I to LC3-II, together with a significant decreased of SQSTM1 by western blot (, left panel), also confirmed by densitometric analysis (, right panels bar graphs), supporting a role for this interaction in autophagy induction.
The interaction of ERLIN1 with the central region of AMBRA1, which is involved in the binding to BECN1, prompted us to test if the ERLIN1-AMBRA1 association is mediated by BECN1. To this aim, we compared the levels of ERLIN1-AMBRA1 interaction in control and BECLIN1-silenced cells by a coimmunoprecipitation assay. As shown in , the binding of AMBRA1 with ERLIN1 is not affected by BECLIN1 downregulation both in nutrient-rich and starvation conditions, indicating that the interaction between AMBRA1 and ERLIN1 is not mediated by BECLIN1.
ERLIN1 and AMBRA1 interacts with MFN2 in MAM fractions
Next, we focused on MFN2, a key molecule, which we previously demonstrated to be associated with MAMs during the autophagic process [Citation12], setting out to investigate its association with ERLIN1 in MAM fractions from F2 cells. Experiments were performed in cells expressing the AMBRA1 central region (F2) because it was the domain of AMBRA1 with the higher level of binding to ERLIN1.
Based on the results described above regarding the presence of ERLIN1 in isolated MAMs, we investigated, by coimmunoprecipitation experiments, the possible interaction of ERLIN1 with MFN2 and AMBRA1 in fed or starved conditions. Crude mitochondrial fractions were sub-fractionated to obtain both MAM and pure mitochondria fractions. All the fractions were immunoprecipitated with anti-ERLIN1 pAb. Western blot analysis (, left panels) revealed that both MFN2 and AMBRA1 were weakly associated with ERLIN1 immunoprecipitated in MAMs fractions from control cells, while these associations were significantly increased following autophagy induction (, right panel bar graphs). No significant association was evident in ERLIN1 immunoprecipitates from mitochondria fractions; no bands were detected in control immunoprecipitation experiments with an IgG having irrelevant specificity from both untreated and HBSS-treated cells (, left panels).
Figure 8. Involvement of lipid raft-associated to MAMs on AMBRA1-ERLIN1 interaction. (A) Upper panel, Crude mitochondrial fractions obtained from F2 cells, either untreated or treated with HBSS for 1 h, were subjected to Percoll gradient fractionation. After centrifugation, high-purity MAM fractions were obtained. Isolated MAMs and pure mitochondrial fractions (Pmit) were subjected to IP using an anti-ERLIN1 pAb. A rabbit IgG isotypic control was employed (IpCtr). Immunoprecipitates were analyzed by western blot analysis, using anti-MFN2, or with anti AMBRA1. As a control, the immunoprecipitates were assessed by immunoblot with anti-ERLIN1 mAb. A representative experiment among 3 is shown. Bar graph shows densitometric analysis. ***p ≤ 0.001 HBSS vs control cells. Lower panel. Modulation of autophagy was analyzed by LC3-I to LC3-II conversion using rabbit anti-LC3 pAb or by degradation of SQSTM1 using rabbit anti-SQSTM1 mAb. Loading control was evaluated using anti-ACTB mAb. A representative experiment among 3 is shown. A representative experiment among 3 is shown. Bar graph shows densitometric analysis. ****p ≤ 0.0001 HBSS vs control cells. (B) In parallel, the immunoprecipitates were spotted onto nitrocellulose strips and incubated with anti-GD3 R24 mAb, anti-MFN2 or with anti-AMBRA as described in Materials and Methods. A rabbit IgG isotypic control was employed. As a control, the immunoprecipitates were checked using anti-ERLIN1 mAb. A representative experiment among 3 is shown. A positive control was obtained using pure standard GD3 (STD). A representative experiment among 3 is shown. Bar graph shows densitometric analysis. **p ≤ 0.01 HBSS vs control cells
Previously, we have reported a molecular interaction between AMBRA1 and the ganglioside GD3 at MAMs level [Citation12]; thus, we tested by dot blot analysis whether ERLIN1 could also interact with GD3 under the same experimental condition. As expected, ERLIN1 was associated with ganglioside GD3 only in MAM fractions; no association was observed in mitochondria fractions of both control and stimulated samples (, left and upper panel). Moreover, association of MFN2 or AMBRA1 with ERLIN1 was also confirmed by dot blot analysis (, left and lower panel). No bands were detected in control immunoprecipitation experiments with an IgG having irrelevant specificity ().
Autophagy induction was checked by western blot analysis revealing a band corresponding to LC3-II after cell starvation together with a significant decrease of SQSTM1 (, left panels), as confirmed by densitometric analysis (, right panel bar graphs).
These results strongly support the presence of a multimolecular complex, including ERLIN1, MFN2, AMBRA1 and ganglioside GD3 in MAM-associated raft-like microdomains, which is significantly increased after autophagy induction.
AMBRA1-ERLIN1 interaction requires the expression of MFN2 and the GD3 synthase ST8SIA
In order to evaluate the functional role of ganglioside GD3 and MFN2 on AMBRA1-ERLIN1 association, 2F cells were transfected with specific siRNA to downregulate the expression of either the GD3 synthase ST8SIA1 or MFN2. After 48 h, the downregulation of ST8SIA1 and MFN2 levels was verified by flow cytometry and western blot analysis, using specific antibodies for these proteins (ST8SIA1: about 80%; MFN2: about 70% with respect to control siRNA-transfected cells) ().
Figure 9. Knocking down MFN2, ST8SIA1 or ERLIN1 expression impairs the interaction AMBRA1-ERLIN1 and AMBRA1-MFN2, hindering autophagy. (A) Cytofluorimetric and western blot evaluation of MFN2 (left panel) and ST8SIA1 (right panel) expression level 48 h after specific siRNA transfection. Numbers in the upper panels represent the median fluorescence intensity. Bar graph on the right shows the mean ± SD among 3 independent cytofluorimetric experiments. (B) FRET analysis of AMBRA1-ERLIN1 association in cells knocked down for MFN2 (middle) or ST8SIA1 (right), or in cells transfected with control siRNA (left panel), treated or not with HBSS for 1 h. Numbers indicate the percentage of FL3 (FRET channel)-positive events obtained in one experiment representative of 3. Bar graphs on the right show the evaluation of FE, according to the Riemann algorithm. Results represent the mean ± SD from 3 independent experiments. (C) Semiquantitative analysis of autophagy, performed by flow cytometry with a Cyto-ID Autophagy detection kit and by western blot evaluating LC3-I to LC3-II conversion using rabbit anti-LC3 pAb, in cells knocked down for MFN2 and ST8SIA1 or in cells transfected with scrambled siRNA. Numbers in the upper panels represent the median fluorescence intensity. Upper bar graph shows the mean ± SD among 3 independent cytofluorimetric experiments. Bottom bar graph shows densitometric analysis considering 3 different experiments. **p ≤ 0.01 between indicated samples. (D) FRET analysis of AMBRA1-MFN2 association in AMBRA1 FL knocked down for ERLIN1 and treated with HBSS for 1 h or in cells transfected with control non-silencing siRNA and treated with HBSS for 1 h. Numbers indicate the percentage of FL3-positive events obtained in one experiment representative of 3. Bar graph on the right shows the evaluation of FE, according to the Riemann algorithm. Results represent the mean ± SD from 3 independent experiments. **p ≤ 0.01 between indicated samples
FRET analysis revealed that knocking down MFN2 induced a significant reduction of AMBRA1-ERLIN1 molecular interaction; similar findings were found following knocking down ST8SIA1 to reduce the levels of GD3 ganglioside ().
To evaluate whether knocking down MFN2 or ST8SIA1 impairs HBSS-induced autophagy, flow cytometry analysis by using Cyto-ID and western blot with anti-LC3 pAb were performed as previously reported [Citation47]. These analyses revealed that HBSS-induced autophagy was significantly reduced in both MFN2- and ST8SIA1-silenced cells, as compared to scrambled siRNA-transfected cells (). At last, since we have shown that knocking down of ERLIN1 expression was able to significantly hinder autophagy (), we also evaluated AMBRA1-MFN2 association by quantitative FRET analysis in ERLIN1-silenced cells. We observed that, in cells incubated in HBSS, ERLIN1 siRNA prevents the increase of AMBRA1-MFN2 association detectable in control siRNA-transfected cells ().
These findings strongly suggest that upon autophagy induction AMBRA1 forms a multimolecular complex at MAM-associated raft-like microdomains with ERLIN1, GD3 and MFN2, all of which are required for optimal execution of the autophagic process (Figure S7).
Discussion
Numerous physiological roles have been attributed to the formation of contact sites between elements of the ER and mitochondria [Citation48,Citation49], including regulation of signal transduction, autophagosomes biogenesis, cell death and lipid metabolism [Citation50–52]. Consequently, identification of lipids and/or proteins that operate at the interface between MAMs and mitochondria has become an active area of research [Citation24,Citation53,Citation54]. In particular, upon starvation, STX17 (syntaxin 17) is redistributed to the MAMs, where it recruits the PtdIns3-kinase complex through interaction with the PtdIns3-kinase subunit ATG14, leading to autophagosome maturation [Citation55]. Although the finding that phagophore also occurs at ER-mitochondria contact sites [Citation1], it is not clear how proteins and lipids are transferred from mitochondria and/or ER to nascent phagophore. One possibility is that lipids are transferred between MAMs and mitochondria via a non-vesicular pathway, as seen in the biosynthesis of lipids. We recently demonstrated the existence of raft-like microdomains at MAMs level, which provides a functional platform for recruitment of autophagosomal proteins during the early steps of autophagic process. Following this evidence, and considering ERLIN1 as an exclusively protein marker of ER lipid raft-like microdomains [Citation29], in this study, we defined a specific inter-organelle microdomains localization of ERLIN1, and then we analyzed its contribution to the early phases of autophagosome formation. Nowadays, the role played by ERLINs in cellular functions has been poorly clarified. However, ERLIN1 seems to contribute to the maintenance of ER protein folding capacity and the regulation of ER-associated degradation [Citation34], both of which would impact more directly on the induction of the unfolded protein response. Moreover, Huber et al. [Citation36] reported that ERLINs bind cholesterol with specificity and strong cooperativity and respond to ER cholesterol changes with altered diffusional mobility, suggesting that ERLINs themselves may be regulated by cholesterol. Thus, we first demonstrated by subcellular fractionation that ERLIN1 is enriched within MAMs fractions, which was more evident upon nutrient starvation. This is consistent with the finding that lipid raft-like microdomains are present in MAMs, suggesting a possible role for ERLIN1 during autophagosome induction. The functional activity of ERLIN1 in the autophagic process was demonstrated by knocking down ERLIN1 gene expression.
Lipid composition of MAMs has gained special attention in recent years [Citation20,Citation56], since the modulation of their local concentration modifies the structure of the contact sites and their ability to recruit specialized protein assemblies, altering physiological functions and activities of the MAMs including the autophagic process. Indeed, during the earliest steps of autophagy, raft-like microdomains could participate in the formation of autophagy-associated vesicles aimed at the engulfment and recycling of altered organelles or misfolded proteins [Citation47]. One of the best-characterized receptor proteins as regulator of the autophagy signaling network is AMBRA1. The overexpression of AMBRA1 in rapamycin‐treated human fibroblast 2F cells has been shown to significantly increase basal and rapamycin-induced autophagy [Citation13]. The functions of AMBRA1 in autophagy are mainly through interaction with positive and negative regulators of the process, such as MTORC1, ULK1, TRAF6 (TNF receptor associated factor 6), TRIM32 (tripartite motif containing 32), BECN1, CUL4A (cullin 4A), DYNLL1/DLC1 (dynein light chain LC8-type 1), DYNNL2/DLC2 and BCL2 when located at the mitochondria (mito-BCL2) [Citation16,Citation44,Citation57].
Here, our results clearly suggest a physical interaction between ERLIN1 and AMBRA1 in 2FTGH cells after incubation in a nutrient-free medium, as revealed by both coimmunoprecipitation experiments and FRET analysis. This finding is also in agreement with our recent data demonstrating that AMBRA1 was recruited to BECN1 complex into raft-like microdomains at MAMs level during HBSS-induced autophagy in human fibroblasts [Citation12].
In addition, our findings show a correlation between the domain of AMBRA1 protein that are able to mediate the association with ERLIN1, i.e., the AMBRA1 central region (F2) and AMBRA1 C terminal (F3), and the ability of these protein fragments to promote autophagy.
Lipid-rafts components can undergo intracellular re-localization via ER-MAM and microtubular network, allowing the presence of raft-like microdomains in mitochondrial membranes, which are enriched not only in cholesterol but also in gangliosides (although with lower content than PM) [Citation58,Citation59]. Consistently, the increase of ganglioside GD3 concentration within these microdomains promotes the interaction of this ganglioside with the chaperon calnexin, another resident protein of the MAMs and with core-initiator proteins of autophagy, such as AMBRA1 and WIPI1. Modulation of the gangliosides concentration in the MAMs greatly influences the recruitment of these proteins, thus impairing autophagy [Citation12].
A direct implication of GD3 to the biogenesis and maturation of autophagic vacuoles under nutrient starvation has already been reported [Citation47]. In fact, it has been revealed that GD3 could be detected in immature autophagosomes associated with phosphatidylinositol-3-phosphate (PtdIns3P) and LC3-II as well as in autolysosomes associated with LAMP1. Accordingly, disruption of mitochondrial dynamics after FB1 treatment significantly impaired these associations and consequently prevented autophagosome biogenesis and maturation. Likewise, the block of SL biogenesis after knocking down of GD3 synthase, affected PtdIns3P synthesis and autophagosome formation, hindering autophagic flux, since it has been reported that the clearance of PtdIns3P is critical in regulating both the size and the rate of production of autophagosomes [Citation60].
Interestingly, in the present study, our findings revealed that depletion of gangliosides after FB1 treatment significantly hindered both AMBRA1-ERLIN1 interaction and HBSS-induced autophagy in 2F fibroblasts, suggesting that combination of the specific protein ERLIN1 and lipids within MAMs is able to regulate the recruitment and activity of distinct sets of proteins involved in the autophagic process in response to nutrient deprivation.
During the past decade, different proteins were identified as virtually implicated in the formation and modulation of MAM compartment, influencing fundamental cellular pathways [Citation24]. Among these, MFN2, which is known to be essential for mitochondrial fusion, was the first protein suggested to directly mediate ER-mitochondria tethering in mammals [Citation39,Citation61]. Moreover, our previously published results revealed that the embedding of MFN2 in “lipid rafts” could be an essential event in the mitochondrial network extension induced by Mdivi-1 [Citation62].
Of note, since it is well known that MFN2 is localized not only in mitochondria but also abundant in the MAM, it may be considered an essential actor for starvation-induced autophagosomes biogenesis since its depletion profoundly impaired autophagy [Citation63]. In addition, a functional MFN2-AMBRA1 interaction has been reported in mitophagy induction, since AMBRA1 favors MFN2-HUWE1 interaction, thus leading to MFN2 ubiquitination and subsequent degradation [Citation64].
Furthermore, we also confirmed that disruption of ER-mitochondria contact sites by MFN2 downregulation reduced HBSS-induced CANX-AMBRA1 association at MAM level with an impact on autophagosome formation [Citation12]. In the present study, we showed that ERLIN1 is associated with a multimolecular complex including MFN2, AMBRA1 and ganglioside GD3 in MAM-associated raft-like microdomains of 2FTGH cells mostly after autophagy induction and, moreover, that this association decreased significantly when both MFN2 and ST8SIA1 were knocking down.
Taken together, these novel findings may contribute to understanding the significance of MAM-raft like-microdomains in regulating the recruitment and activity of distinct sets of proteins essential in downstream events of autophagic machinery, suggesting a potential role for these raft-like structures on translocation of proteins and lipids from mitochondria-MAM to autophagosomes. This study introduces for the first time ERLIN1 as a new player in the autophagy machinery, demonstrating that it interacts with AMBRA1 within MAMs. These findings also suggest the existence of a new checkpoint in the possible regulation of the autophagic process in physiological and/or pathological conditions (neurodegenerative disorders, cancer, autoimmune diseases).
Materials and methods
Cells and autophagy induction
Human 2FTGH (2F) fibroblasts (provided by ECACC, 12021508) were cultured in Dulbecco’s Modified Eagle Medium (DMEM; Sigma, D5796), containing 10% fetal calf serum (FCS; Aurogene, AU-S1810) plus 100 units/ml penicillin, 10 mg/ml streptomycin (Aurogene, AU-L0022), at 37°C in humified CO2 atmosphere. Cells were treated for the indicated time with 50 nM rapamycin (Enzo Life Sciences, BML-A275-0025), 100 nM torin 1 (Sigma-Aldrich, A113194), 10 mM 3-MA (Sigma-Aldrich, M9281) or 8 μM cisplatin (CDDP; Santa Cruz Biotechnology, sc-200896A); to monitor the autophagy flux, 1 μM bafilomycin A1 (Sigma-Aldrich, B1793) was added 1 h before lysis. For autophagy induction, cells were treated under condition of nutrient deprivation with Hanks’ Balanced Salt Solution (HBSS; Sigma, H9269) for 1 h at 37°C. The optimal incubation time with HBSS was selected on the basis of preliminary experiments. To evaluate the effects of sphingolipid depletion on autophagy induction and on AMBRA1-ERLIN1 association, cells were pre-incubated with 30 µM fumonisin B1 (FB1; Sigma, F1147) (inhibitor of ceramide synthases) overnight at 37°C. After treatment, cells were collected and prepared for the experimental procedures described below.
Human 2FTGH (2F) fibroblasts cells expressing MYC-tagged beta-gal, AMBRA1 full length proteins (AMBRA1 FL), AMBRA1 F1 (aa 1–532), F2 (aa 533–751) and F3 (aa 767–1269) fragments were previously described [Citation13].
Analysis of autophagy
To determine autophagy activity, the following assays were performed:
Flow cytometry by using Cyto-ID Autophagy Detection Kit (Enzo Life Sciences, ENZ-51031-K200). The kit was optimized for detection of autophagy in live cells by flow cytometry. This assay provides a rapid, specific, and quantitative approach for monitoring autophagic activity at the cellular level by using a 488 nm-excitable probe that becomes fluorescent in vesicles produced during autophagy [Citation65].
Immunofluorescence microscopy and flow cytometry after cell staining with anti-LC3 and anti-SQSTM1 antibodies, as reported in the “Immunofluorescence analysis” Section.
Confocal microscopy of Flag-ATG16L1 and RFP-GFP-LC3 dots was performed as follow: 2FTGH cells stably expressing Flag-ATG16L1 or RFP-GFP-LC3 were obtained as previously described [Citation16]. RFP-GFP-LC3 or Flag-ATG16L1 cells were fixed with 4% paraformaldehyde (Carlo Erba, 387503) in PBS (Sigma, P4417) and, in case of Flag-ATG16L1 cells, subjected to immunofluorescence using a mouse anti-Flag primary antibody (Sigma, F1804) diluted 1:500 and visualized by means of Cy3-conjugated anti-mouse secondary antibodies (Jackson ImmunoResearch, 715-166-151). Cells were examined with an LSM 900, Airyscan SR Zeiss confocal microscopy. The area of both mFlag-ATG16L1 and GFP-RFP-LC3 dots was measured using ZEN 3.0 Blue edition software and expressed as μm2 per cell. A minimum of 30 cells/sample was analyzed and the statistical analysis was performed using ANOVA 2-way test for repeated samples by using Graphpad Prism, p values of less than 0.05 were considered significant.
Western blot analysis
Cells, untreated or treated with HBSS for 1 h at 37°C, were lysed in lysis buffer, containing 1% Triton X-100 (Bio-Rad, 1610407), 10 mM Tris-HCl, pH 7.5, 150 mM NaCl, 5 mM EDTA, 1 mM Na3VO4 (Sigma Aldrich, 450243), 75 U of aprotinin (Sigma, A1153) for 20 min at 4°C. The lysate was centrifuged for 5 min at 1300 x g to remove nuclei and large cellular debris. After evaluation of the protein concentration by Bradford Dye Reagent assay (Bio-Rad, 500-0006), the lysate was subjected to 15% sodium-dodecyl sulfate polyacrylamide gel electrophoresis (SDS-PAGE). The proteins were electrophoretically transferred onto polyvinylidene difluoride (PVDF) membranes (Bio-Rad, 162-0177). Membranes were blocked with 5% nonfat dried milk (Santa Cruz Biotechnology, sc-2325) in TBS (Bio-Rad, 1706435), containing 0.05% Tween 20 (Bio-Rad, 1706531) and probed with rabbit anti-LC3 pAb (Novus Biologicals, NB100-2331), with rabbit anti-SQSTM1 mAb (Cell Signaling Technology, 8025), with rabbit anti-PARP1 pAb (Cell Signaling Technology, 9542), with rabbit anti-BECN1 H-300 pAb (Santa Cruz Biotechnology, sc-11427), with rabbit anti phospho-RPS6KB1/p70 (Cell Signaling Technology, 9205), with rabbit anti-RPS6KB1/p70 (Cell signaling, 9202), with rabbit anti-EIF4EBP1/4EBP1 (Cell Signaling Technology, 9452), with anti-HSP90AA1/AB/Hsp90 α/β mAb (Santa Cruz Biotechnology, sc-13119), with anti-GAPDH mAb (Calbiochem, CB1001), or with anti-ACTB/β-actin) mAb (Sigma, A5316). Bound antibodies were visualized with horseradish peroxidase (HRP)-conjugated anti-rabbit IgG (Sigma, A1949) or anti-mouse IgG (Sigma, A9044) and immunoreactivity assessed by chemiluminescence reaction, using the ECL western detection system (Amersham, RPN2106). Densitometric scanning analysis was performed with Mac OS X (Apple Computer International), using NIH ImageJ 1.62 software or by Image Lab software from BioRad version 6.0.1.
Data analysis and statistics
All the statistical procedures were performed by GraphPad Prism software Inc. (San Diego, CA, USA). All data reported in this paper were verified in at least 3 different experiments performed in triplicate and reported as mean ± standard deviation (SD). D’Agostino-Pearson omnibus normality test was used to assess the normal distribution of the data. Normally distributed variables were summarized using the mean ± standard deviation (SD). P values for all graphs were generated using Student’s t-test as indicated in the figure legends.
Cell death analysis
ANXA5/annexin V-FITC and PE-A propidium iodide staining were performed using Abcam apoptosis detection kit (ab14085). Stained 2FTGH cells were analyzed using CytoFLEX LX Beckman Coulter cytometer, and the occurrence of cell death was recorded as the percentage of both early and late apoptotic cells on the entire population; graph report the percentage of apoptotic cells on 20,000 events/sample in at least 3 different experiments and reported as mean ± SD. The statistical analysis was performed using ANOVA 2-way test for repeated samples by using Graphpad Prism; p values of less than 0.05 were considered significant as indicated in the figure legends.
Isolation of MAMs
Crude mitochondria and supernatant (enriched in ER and cytosol) were isolated from human 2F cells or from 2F cells expressing MYC-tagged AMBRA1 central regions (F2) [Citation13], as reported by Wieckowski et al. [Citation66]. Briefly, 5 × 10⁷ cells either untreated or treated with HBSS for 1 h at 37°C were first homogenized by 15 strokes in a Teflon-pestle homogenizer on ice. Then, the homogenate was subjected to differential centrifugation steps to obtain a partially pure “crude” mitochondrial fraction and a supernatant fraction enriched in ER and cytosol. For further purification, crude mitochondrial pellets were resuspended in 2 ml of ice-cold mitochondria resuspending buffer (MRB), containing 250 mM mannitol (Sigma Aldrich, M9546), 5 mM HEPES (Gibco, 15630-056), pH 7.4, 0.5 mM EGTA and loaded on top of 8 ml of Percoll medium (225 mM mannitol, 25 mM HEPES, pH 7.4, 1 mM EGTA, and 30% Percoll [vol:vol; Sigma Aldrich, P1644]) in an ultracentrifuge tube (Beckman, 344059). Afterward, the tube was gently filled up with 3.5 ml of MRB solution and centrifuged at 95,000 × g for 30 min at 4°C in an SW 41 rotor (Beckman). After centrifugation, a dense band containing purified mitochondria was localized approximately at the bottom, whereas MAM fraction was visible as diffuse white band located above the mitochondria. The fractions were collected and centrifuged at 6,300 × g for 10 min at 4°C. MAM supernatant was subjected to a further centrifugation at 100,000 × g for 1 h at 4°C in a 70-Ti rotor (Beckman). After evaluation of the protein concentration by Bradford Dye Reagent assay (Bio-Rad, 5000006), subcellular fractions (50 μg loaded in each lane), including MAM, as well as pure mitochondria (Pmit), crude mitochondria (Cmit), ER, cytosol (Cyt) and nuclei (Nuc) were analyzed by western blot analysis using anti-ERLIN1 mAb (Santa Cruz Biotechnology, sc-514820). Bound antibodies were visualized with horseradish peroxidase (HRP)-conjugated anti-mouse IgG or anti-rabbit IgG and immunoreactivity assessed by chemiluminescence reaction, using the ECL western detection system. All the subcellular fractions, isolated from cells, either untreated or treated with HBSS, were tested for MAM markers using rabbit anti-ACSL4 pAb (Abcam 110007), anti-CANX MAb (Abcam, 6F12BE10), anti-VDAC1 (Santa Cruz Biotechnology, sc-390996) MAb, for the mitochondrial marker using anti-TOMM20 MAb (Abcam, ab56783), for cytosol marker using rabbit anti-TUBB pAb (Abcam ab6046) for nuclei marker using rabbit anti-LMNB1/lamin B1 pAb (Abcam, ab16048) and for the ER marker using rabbit anti-P4HB pAb (Sigma-Aldrich, AV48151). P values for all graphs were generated using Student’s t-test as indicated in the figure legends.
Immunoprecipitation experiments
Cells, untreated or treated with HBSS for 1 h at 37°C, were lysed in lysis buffer (10 mM Tris-HCl, pH 8.0, 150 mM NaCl, 1% Nonidet P-40 [Sigma Aldrich, 98379-6x], 1 mM phenylmethylsulfonyl fluoride [Thermo Fisher Scientific, 36978], 10 mg/ml leupeptin [Sigma Aldrich, EI8]). Cell-free lysates were mixed with protein G-acrylic beads (Sigma, P3296) and stirred by a rotary shaker for 2 h at 4°C to pre-clear nonspecific binding. After centrifugation (500 x g for 1 min), the supernatant was immunoprecipitated with polyclonal anti-ERLIN1 (Abcam, ab80685) in 2F cells or rabbit anti-MYC/cMyc pAb (Sigma Aldrich, C3956) in 2F cells expressing MYC-tagged AMBRA1, with rotation at 4°C for 2 h followed by 60-min incubation with protein G-acrylic beads. After vigorous mixing for 5 min, samples were further mixed. As a negative control, immunoprecipitation was performed with an irrelevant rabbit IgG (Sigma Aldrich, 15006). The beads were collected by centrifugation and washed three times with lysis buffer. The immunoprecipitates were checked by western blot analysis.
Tandem Affinity Purification and mass spectrometry analysis were performed as described [Citation16,Citation44].
Immunoblotting analysis of immunoprecipitates
The immunoprecipitates, obtained as reported above, were subjected to SDS-PAGE. The proteins were electrophoretically transferred onto polyvinylidene difluoride (PVDF) membranes. Membrane were blocked with 5% defatted dried milk in TBS, containing 0.05% Tween 20 and probed with anti-AMBRA1 mAb (Santa Cruz Biotechnology, sc-398204), with anti-CANX MAb (Abcam, ab31290), with rabbit anti-MFN2 MAb (Cell Signaling Technology, D1E9 11925S), anti-MYC/c-Myc MAb (9E10; Santa Cruz Biotechnology, sc-40), anti-ERLIN1 MAb (Santa Cruz Biotechnology, sc-514820).
Bound antibodies were visualized with horseradish peroxidase (HRP)-conjugated anti-mouse IgG (Amersham, NA931V) or anti-rabbit IgG and immunoreactivity assessed by chemiluminescence reaction, using the ECL western detection system. P values for all graphs were generated using Student’s t-test as indicated in the figure legends.
Dot-blot analysis
GD3 association with ERLIN1 was verified by densitometric scanning analysis of GD3 from immuno-dot-blot analysis. Briefly, aliquots, obtained from ERLIN1 immunoprecipitates both from MAM and crude mitochondrial fractions of treated or untreated F2 cells with HBSS, were spotted onto nitrocellulose strips, and analyzed by dot blot as previously described [Citation12], using IgG anti-GD3 R24 MAb (Abcam, ab 11779; final dilution 1:500) for 1 h at room temperature. P values for all graphs were generated using Student’s t-test as indicated in the figure legends.
Immunofluorescence analysis: static and flow cytometry
Confocal microscopy analysis
2F cells were directly stained with MitoTracker Green FM (200 nM) (Thermo Fisher Scientific, M7514) for 30 min at 37° and then stimulated with HBSS for 1 h. After washing, both untreated and HBSS-treated cells were fixed with 4% paraformaldehyde (Carlo Erba, 387503) in PBS (Sigma, P4417) for 30 min at room temperature and then permeabilized by 0.5% Triton X-100 in PBS for 5 min at room temperature; then cells were incubated with anti-AMBRA1 pAb (Covalab, 0224) and anti-ERLIN1 mAb (Santa Cruz Biotechnology, sc-514820) antibodies for 1 h. After washings, cells were incubated with anti-rabbit Cy3-conjugated or with anti-mouse AlexaFluor 647-conjugated (all Thermo Fisher Scientific, A32728) for an additional 45 min at 37°C. Nuclei were stained with DAPI (Turquoise) (Invitrogen, P36935). Images were acquired using a LSM 900, Airyscan SR Zeiss confocal microscopy and the co-localization between ERLIN1, AMBRA1 and MitoTracker was measured using the ZEN 3.0 Blue edition software and expressed as μm2 per cell. A minimum of 30 cells/sample was analyzed and the statistical analysis was performed using Student’s t-test.
IVM analysis
For fluorescence images, cells after fixation with 4% paraformaldehyde (Carlo Erba, 387503) in PBS for 30 min at room temperature and then permeabilization by 0.5% Triton X-100 in PBS for 5 min at room temperature, were double stained with anti-LC3 (mouse; Invitrogen, GT3612) and anti-SQSTM1/p62 (rabbit; Abcam, ab91526) primary antibodies for 1 h, followed by anti-mouse Alexa Fluor 488 (Invitrogen, A32723) and anti-rabbit Alexa Fluor 594 plus-conjugated (Invitrogen, A32740) for an additional 45 min at 37°C. All samples were counterstained with Hoechst 33342 and mounted with glycerol (Sigma-Aldrich, G9012)-PBS (2:1). Samples were observed with an Olympus fluorescence microscope (Olympus Corporation of the Americas, Center Valley, PA.) equipped with an objective lens PlanApo 60x/1,40 (NA). The images were acquired by intensified video microscopy (IVM) with a Zeiss charge-coupled device (CCD) camera (Carl Zeiss, Oberkochen, Germany) by using I.A.S Software version 009 000 (Delta Sistemi S.r.l, Alessandria, Italy).
Flow cytometry analysis
For quantitative evaluation of LC3 and SQSTM1 by flow cytometry at the end of treatment cells were harvested and stained with anti-LC3 (mouse;, Invitrogen, GT3612) and anti-SQSTM1/p62 (rabbit; Abcam, ab91526) primary antibodies, followed by anti-mouse Alexa Fluor 488 (Invitrogen, A32723) and anti-rabbit Cy5-conjugated (Abcam, ab6564) secondary antibodies. After washing, cells were resuspended in PBS and analyzed with a dual-laser FACScalibur flow cytometer (BD Biosciences Franklin Lakes, New Jersey).
For flow cytometry studies all samples were analyzed by a dual-laser FACScalibur cytometer equipped with a 488-nm argon laser and with a 635-nm red diode laser. At least 20,000 events/sample were acquired. Data were recorded and statistically analyzed with a Macintosh computer using CellQuestPro Software. Collected data analyses, performed by Graphpad Prism software, were carried out by using: ANOVA 2- way test for repeated samples corrected for multiple comparisons by the Bonferroni procedure for the time course experiments, or Student’s t-test when two independent groups were compared. All data reported in this paper were verified in at least 3 different experiments performed in triplicate and reported as mean ± standard deviation (SD).
Förster/fluorescence resonance energy transfer (FRET)
We applied fluorescence resonance energy transfer (FRET) analysis by flow cytometry, in order to study the molecular association of AMBRA1-ERLIN1 or AMBRA1-MFN2 in different experimental conditions [Citation67] and/or in the cells knocked-down for ST8SIA1 GD3 synthase, MFN2 or ERLIN1. Briefly, fixed with 4% paraformaldehyde and then permeabilized by 0.5% (v:v) Triton X-100, washed twice in cold PBS and then labeled with antibodies tagged with donor (Phycoerythrin, PE) or acceptor (Cy5) dyes. The following primary and secondary antibodies used were: rabbit anti-ganglioside GD3 (Abcam, ab6217), anti-MFN2 (D1E9 11925S, Cell Signaling Technology), anti-AMBRA1 mAb (Santa Cruz Biotechnology, sc-398204), anti-MYC/c-Myc (9E10; sc-40 Santa Cruz Biotechnology), anti-ERLIN1 (Santa Cruz Biotechnology, sc-514820), goat anti-rabbit IgG H&L (Cy5) pre-adsorbed (Abcam, ab6564) goat anti-mouse IgG H&L (Cy5®) pre-adsorbed (Abcam, ab6563); goat F(ab’)2 anti-mouse IgG – Fc (PE) pre-adsorbed (ab5881), donkey F(ab’)2 anti-rabbit IgG – H&L (PE) pre-adsorbed (Abcam, ab98494).
After staining, cells were washed twice, resuspended in PBS and analyzed with a dual-laser FACScalibur flow cytometer (BD Biosciences Franklin Lakes, New Jersey). As a further control, the cross-reactivity among all the different primary and secondary antibodies was also assessed. All data were corrected for background by subtracting the binding of the isotype controls. Efficient energy transfer resulted in an increased acceptor emission on cells stained with both donor and acceptor dyes. The FRET efficiency (FE) was calculated according to Riemann [Citation68] by using the following algorithm: FE = [FL3DA – FL2DA/a – FL4DA/b]/FL3DA, in which A is the acceptor and D the donor and where a = FL2D/FL3D and b = FL4A/FL3A. Fluorescence emission in channels 2 (PE), 3 (FRET) and 4 (Cy5) was expressed as median fluorescence.
Data analysis and statistics
For flow cytometry studies all samples were analyzed as described above in flow cytometry analysis. Collected data analyses, performed by Graphpad Prism software, were carried out by using: ANOVA 2- way test for repeated samples corrected for multiple comparisons by the Bonferroni procedure for the time course experiments, or Student’s t-test when two independent groups were compared. All data reported in this paper were verified in at least 3 different experiments performed in triplicate and reported as mean ± standard deviation (SD).
qRT-PCR
After 48 h, RNA was extracted using Trizol (Invitrogen, 15596-018) and retro-transcribed to cDNA using a RT-kit from Promega (A3500). qPCR were performed with the Rotor-Gene 6000 (Corbett Research Ltd) thermocycler, as previously described [Citation1]. Primers: ERLIN1 forward (5ʹ-GGACTCCTCATGTGCTTTG-3ʹ) and reverse (5ʹ-CAACCTGTGCTCTCTTTGT-3ʹ) and hL34 forward (5ʹ-GTCCCGAACCCCTGGTAATAGA-3ʹ) and reverse (5ʹ- GGCCCTGCTGACATGTTTCTT-3ʹ), L34 mRNA level was used as an internal control and the statistical analysis was performed using Student’s t-test.
Knockdown experiments by RNA interference
2F fibroblasts were cultured in an antibiotic-free medium containing 10% FCS and transfected with Dharma FECT 1 reagent (Dharmacon, T-2001-03), according to the manufacturer’s instructions, using 25 nM of Smart pool siRNA ST8SIA1 (GD3 synthase) (Dharmacon, M-011775-02). As negative control we used related scrambled siRNA as (Dharmacon, D-001810-10-05). For knocking down MFN2, we transfected fibroblasts with a predesigned siRNA directed against human MFN2 (FlexiTube GeneSolution, Qiagen, GS9927) by using HiPerFect Transfection Reagent (Qiagen, 301705) according to the manufacturer’s instructions. As a negative control, we used a nonsilencing siRNA with no homology to any known mammalian gene (AllStars Negative Control siRNA; Qiagen, SI03650318). After 48 h, the effect of transfection on ST8SIA1, or MFN2 expression levels was verified by flow cytometry by using a rabbit anti-ST8SIA1 (K-18) pAb (Santa Cruz Biotechnology, sc-44587), or by a rabbit anti-MFN2 (D1E9) mAb (Cell Signaling Technology, 11925).
ERLIN1 RNA interference was performed using the following RNA oligonucleotide duplex from Invitrogen Life Technologies: ERLIN1 #1 (ERLIN1HSS116356), ERLIN1 #2 (ERLIN1HSS116358). The Negative Control medium GC duplex (Invitrogen, 462001) was used as control. In details, 2,5 × 10⁵ 2FTGH cells were transfected with 100 pmol siRNA oligonucleotides in 6 well plates using Lipofectamine RNAiMAX (Invitrogen, 13778-150) following the supplier’s instructions. For stable human BECN1 RNA interference, RNA–targeting pLKO.1 plasmid was used (Sigma-Aldrich, TRCN0000033550) as previously described [Citation69]. Data analysis and statistics. For flow cytometry studies, all samples were analyzed as described above in immunofluorescence analysis section. Collected data analyses, performed by Graphpad Prism software, were carried out by using Student’s t-test. P values were indicated in the figure legends.
Statistical analysis
All the statistical procedures were performed by GraphPad Prism software Inc. (San Diego, CA, USA). All data reported in this paper were reported as mean ± standard deviation (SD). P values for all graphs were generated using Student’s t-test or ANOVA 2- way test as indicated in the figure legends; *P ≤ 0.05, **P ≤ 0.005 ***P ≤ 0.001, ****P ≤ 0.0001.
Supplemental Material
Download Zip (11.3 MB)Disclosure statement
No potential conflicts of interest were disclosed.
Supplementary material
Supplemental data for this article can be accessed here.
Additional information
Funding
Related Research Data
References
- Hamasaki M, Furuta N, Matsuda A, et al. Autophagosomes form at ER- mitochondria contact sites. Nature. 2013;495:389–393.
- Ktistakis NT, Tooze SA. Digesting the expanding mechanisms of autophagy. Trends Cell Biol. 2016;26:624–635.
- Csordás G, Renken C, Várnai P, et al. Structural and functional features and significance of the physical linkage between ER and mitochondria. J Cell Biol. 2006;174:915–921.
- Tagaya M, Arasaki K. Regulation of mitochondrial dynamics and autophagy by the mitochondria- associated membrane. Adv Exp Med Biol. 2017;997:33–47.
- Shimizu S. Organelle zones in mitochondria. J Biochem. 2019;165:1–7.
- Rizzuto R, Pinton P, Carrington W, et al. Close contacts with the endoplasmic reticulum as determinants of mitochondrial Ca2± responses. Science. 1998;280:1763–1766.
- Sassano ML, van Vliet AR, Agostinis P. Mitochondria-associated membranes as networking platforms and regulators of cancer cell fate. Front Oncol. 2017;7:1–16.
- Xie Y, Kang R, Sun X, et al. Posttranslational modification of autophagy-related proteins in macroautophagy. Autophagy. 2015;11:28–45.
- Chan EY, Longatti A, McKnight NC, et al. Kinase- inactivated ULK proteins inhibit autophagy via their conserved C-terminal domains using an Atg13-independent mechanism. Mol Cell Biol. 2009;29:157–171.
- Tang Z, Takahashi Y, Wang HG. ATG2 regulation of phagophore expansion at mitochondria-associated ER membranes. Autophagy. 2019;15:2165–2166.
- Grimmel M, Backhaus C, Proikas-Cezanne T. WIPI-mediated autophagy and longevity. Cells. 2015;4:202–217.
- Garofalo T, Matarrese P, Manganelli V, et al. Evidence for the involvement of lipid rafts localized at the ER-mitochondria associated membranes in autophagosome formation. Autophagy. 2016;12:917–935.
- Fimia GM, Stoykova A, Romagnoli A, et al. Ambra1 regulates autophagy and development of the nervous system. Nature. 2007;447:1121–1125.
- Nazio F, Strappazzon F, Antonioli M, et al. mTOR inhibits autophagy by controlling ULK1 ubiquitylation, self-association and function through AMBRA1 and TRAF6. Nat Cell Biol. 2013;15:406–416.
- Di Rienzo M, Antonioli M, Fusco C, et al. Autophagy induction in atrophic muscle cells requires ULK1 activation by TRIM32 through unanchored K63-linked polyubiquitin chains. Sci Adv. 2019;5:eaau8857.
- Antonioli M, Albiero F, Nazio F, et al. AMBRA1 interplay with cullin E3 ubiquitin ligases regulates autophagy dynamics. Dev Cell. 2014;31:734–746.
- Di Bartolomeo S, Corazzari M, Nazio F, et al. The dynamic interaction of AMBRA1 with the dynein motor complex regulates mammalian autophagy. J Cell Biol. 2010;191:155–168.
- Sorice M, Longo A, Garofalo T, et al. Role of GM3 enriched microdomains in signal transduction regulation in T lymphocytes. Glycoconjugate J. 2004;20:63–70.
- Lingwood D, Simons K. Lipid rafts as a membrane-organizing principle. Science. 2010;327:46–50.
- Hayashi T, Fujimoto M. Detergent-resistant microdomains determine the localization of sigma-1 receptors to the endoplasmic reticulum-mitochondria junction. Mol Pharmacol. 2010;77:517–528.
- Garofalo T, Giammarioli AM, Misasi R, et al. Lipid microdomains contribute to apoptosis-associated modifications of mitochondria in T cells. Cell Death Differ. 2005;12:1378–1389.
- Sorice M, Garofalo T, Misasi R, et al. Ganglioside GD3 as a raft component in cell death regulation. Anticancer Agents Med Chem. 2012;12:376–382.
- Area-Gomez E, Del Carmen Lara Castillo M, Tambini MD, et al. Upregulated function of mitochondria-associated ER membranes in Alzheimer disease. EMBO J. 2012;31:4106–4123.
- Poston CN, Duong E, Cao Y, et al. Proteomic analysis of lipid raft-enriched membranes isolated from internal organelles. Biochem Biophys Res Commun. 2011;415:355–360.
- Rowland AA, Voeltz GK. Endoplasmic reticulum-mito- chondria contacts: function of the junction. Nat Rev Mol Cell Biol. 2012;13:607–625.
- Lamb CA, Yoshimori T, Tooze SA. The autophagosome: origins unknown, biogenesis complex. Nat Rev Mol Cell Biol. 2013;14:759–774.
- Lynes EM, Bui M, Yap MC, et al. Palmitoylated TMX and calnexin target to the mitochondria-associated membrane. EMBO J. 2012;31(2):457–470.
- Reali V, Mehdawy B, Nardacci R, et al. Reticulon protein-1C is a key component of MAMs. Biochim Biophys Acta. 2015;1853:733–745.
- Browman DT, Resek ME, Zajchowski LD, et al. ERLIN1 and Erlin-2 are novel members of the prohibitin family of proteins that define lipid-raft-like domains of the ER. J Cell Sci. 2006;119:3149–4160.
- Pednekar D, Wang Y, Fedotova TV, et al. Clustered hydrophobic amino acids in amphipathic helices mediate erlin1/2 complex assembly. Biochem Biophys Res Commun. 2011;415:135–140.
- Hoegg MB, Browman DT, Resek ME, et al. Distinct regions within the erlins are required for oligomerization and association with high molecular weight complexes. Biol Chem. 2009;284:7766–7776.
- Wright FA, Wojcikiewicz RJ. Chapter 4—inositol 1,4,5- trisphosphate receptor ubiquitination. Prog Mol Biol Transl Sci. 2016;141:141–159.
- Wright FA, Bonzerato CG, Sliter DA, et al. The erlin2 T65I mutation inhibits erlin1/2 complex-mediated inositol 1,4,5-trisphosphate receptor ubiquitination and phosphatidylinositol 3-phosphate binding. J Biol Chem. 2018;40:15706–15714.
- Pearce MM, Wormer DB, Wilkens S, et al. An endoplasmic reticulum (ER) membrane complex composed of SPFH1 and SPFH2 mediates the ER- associated degradation of inositol 1,4,5-trisphosphate receptors. J Biol Chem. 2009;284:10433–10445.
- Nijtmans LG, de Jong L, Artal Sanz M, et al. Prohibitins act as a membrane-bound chaperone for the stabilization of mitochondrial proteins. EMBO J. 2000;19:2444–2451.
- Huber MD, Vesely PW, Datta K, et al. Erlins restrict SREBP activation in the ER and regulate cellular cholesterol homeostasis. J Biol Chem. 2013;203:427–436.
- Wang G, Zhang X, Lee JS, et al. Endoplasmic reticulum factor erlin2 regulates cytosolic lipid con- tent in cancer cells. Biochem J. 2012;446:415–425.
- Guardia-Laguarta C, Area-Gomez E, Rüb C, et al. α-Synuclein is localized to mitochondria-associated ER membranes. J Neurosci. 2014;34:249–259.
- de Brito OM, Scorrano L. Mitofusin 2 tethers endoplasmic reticulum to mitochondria. Nature. 2008;456:605–610.
- Cosson P, Marchetti A, Ravazzola M, et al. Mitofusin-2 independent juxtaposition of endoplasmic reticulum and mitochondria: an ultrastructural study. PLoS ONE. 2012;7:e46293.
- McLelland GL, Fon EA. MFN2 retrotranslocation boosts mitophagy by uncoupling mitochondria from the ER. Autophagy. 2018;14:1658–1660.
- Vettori A, Bergamin G, Moro E, et al. Developmental defects and neuromuscular alterations due to mitofusin 2 gene (MFN2) silencing in zebrafish: a new model for Charcot-Marie-Tooth type 2A neuropathy. Neuromuscul Disord. 2011;21:58–67.
- Debattisti V, Pendin D, Ziviani E, et al. Reduction of endoplasmic reticulum stress attenuates the defects caused by Drosophila mitofusin depletion. J Cell Biol. 2014;204:303–312.
- Antonioli M, Ciccosanti F, Dengjel J, et al. Methods to study the BECN1 interactome in the course of autophagic responses. Methods Enzymol. 2017;587:429–445.
- Itakura E, Mizushima N. Characterization of autophagosome formation site by a hierarchical analysis of mammalian Atg proteins. Autophagy. 2010;6:764–776.
- Kimura S, Noda T, Yoshimori T. Dissection of the autophagosome maturation process by a novel reporter protein, tandem fluorescent-tagged LC3. Autophagy. 2007;3:452–460.
- Matarrese P, Garofalo T, Manganelli V, et al. Evidence for the involvement of GD3 ganglioside in autophagosome formation and maturation. Autophagy. 2014;10:750–765.
- Levine TP, Patel S. Signalling at membrane contact sites: two membranes come together to handle second messengers. Curr Opin Cell Biol. 2016;39:77–83.
- Betz C, Stracka D, Prescianotto-Baschong C, et al. Feature article: mTOR complex 2-Akt signaling at mitochondria-associated endoplasmic reticulum membranes (MAM) regulates mitochondrial physiology. Proc Natl Acad Sci USA. 2013;110:12526–12534.
- de Brito OM, Scorrano L. An intimate liaison: spatial organization of the endoplasmic reticulum-mitochondria relationship. EMBO J. 2010;29:2715–2723.
- Hayashi T, Rizzuto R, Hajnoczky G, et al. MAM: more than just a housekeeper. Trends Cell Biol. 2009;19:81–88.
- Simmen T, Lynes EM, Gesson K, et al. Oxidative protein folding in the endoplasmic reticulum: tight links to the mitochondria-associated membrane (MAM). Biochim Biophys Acta. 2010;1798:1465–1473.
- Vance JE. MAM (mitochondria-associated membranes) in mammalian cells: lipids and beyond. Biochim Biophys Acta. 2014;1841:595–609.
- Annunziata I, Sano R, d’Azzo A. Mitochondria-associated ER membranes (MAMs) and lysosomal storage diseases. Cell Death Dis. 2018;9:328.
- Cheng X, Ma X, Ding X, et al. Pacer mediates the function of class III PI3K and HOPS complexes in autophagosome maturation by engaging Stx17. Mol Cell. 2017;65:1029:1043.e5.
- Sano R, Annunziata I, Patterson A, et al. GM1-ganglioside accumulation at the mitochondria-associated ER membranes links ER stress to Ca(2+)-dependent mitochondrial apoptosis. Mol Cell. 2009;36:500–511.
- Strappazzon F, Vietri-Rudan M, Campello S, et al. Mitochondrial BCL-2 inhibits AMBRA1-induced autophagy. EMBO J. 2011;30:1195–1208.
- Sorice M, Matarrese P, Tinari A, et al. Raft component GD3 associates with tubulin following CD95/Fas ligation. FASEB J. 2009;23:3298–3308.
- Sorice M, Matarrese P, Manganelli V, et al. Role of GD3-CLIPR-59 association in lymphoblastoid T cell apoptosis triggered by CD95/Fas. PLoS One. 2010;5:e8567.
- Cebollero E, van der Vaart A, Zhao M, et al. Phosphatidylinositol-3-phosphate clearance plays a key role in autophagosome completion. Curr Biol. 2012;22:1545–1553.
- Filadi R, Greotti E, Turacchio G, et al. Mitofusin 2 ablation increases endoplasmic reticulum-mitochondria coupling. Proc Natl Acad Sci U S A. 2015;112:E2174–E2181.
- Ciarlo L, Vona R, Manganelli V, et al. Recruitment of mitofusin 2 into “lipid rafts” drives mitochondria fusion induced by Mdivi-1. Oncotarget. 2018;9:18869–18884.
- Hailey DW, Rambold AS, Satpute-Krishnan P, et al. Mitochondria supply membranes for autophagosome biogenesis during starvation. Cell. 2010;141:656–667.
- Di Rita A, Peschiaroli A, Acunzo DP, et al. HUWE1 E3 ligase promotes PINK1/PARKIN-independent mitophagy by regulating AMBRA1 activation via IKKα. Nat Commun. 2018;9:3755.
- Mizushima N, Yoshimori T, Levine B. Methods in mammalian autophagy research. Cell. 2010;140:313–326.
- Wieckowski MR, Giorgi C, Lebiedzinska M, et al. Isolation of mitochondria-associated membranes and mitochondria from animal tissue and cells. Nat Protoc. 2009;4:1582–1590.
- Stryer L. Fluorescence energy transfer as a spectroscopic ruler. Annu Rev Biochem. 1978;47:819–846.
- Riemann D, Tcherkes A, Hansen GH, et al. Functional co-localization of monocyticaminopeptidase N/CD13 with the Fc gamma receptors CD32 and CD64. Biochem Biophys Res Commun. 2005;331:1408–1412.
- De Leo A, Colavita F, Ciccosanti F, et al. Inhibition of autophagy in EBV-positive Burkitt’s lymphoma cells enhances EBV lytic genes expression and replication. Cell Death Dis. 2015;6:e1876.