
ABSTRACT
Senile osteoporosis (OP) is often concomitant with decreased autophagic activity. OPTN (optineurin), a macroautophagy/autophagy (hereinafter referred to as autophagy) receptor, is found to play a pivotal role in selective autophagy, coupling autophagy with bone metabolism. However, its role in osteogenesis is still mysterious. Herein, we identified Optn as a critical molecule of cell fate decision for bone marrow mesenchymal stem cells (MSCs), whose expression decreased in aged mice. Aged mice revealed osteoporotic bone loss, elevated senescence of MSCs, decreased osteogenesis, and enhanced adipogenesis, as well as optn–/ – mice. Importantly, restoring Optn by transplanting wild-type MSCs to optn–/ – mice or infecting optn–/ – mice with Optn-containing lentivirus rescued bone loss. The introduction of a loss-of-function mutant of OptnK193R failed to reestablish a bone-fat balance. We further identified FABP3 (fatty acid binding protein 3, muscle and heart) as a novel selective autophagy substrate of OPTN. FABP3 promoted adipogenesis and inhibited osteogenesis of MSCs. Knockdown of FABP3 alleviated bone loss in optn–/ – mice and aged mice. Our study revealed that reduced OPTN expression during aging might lead to OP due to a lack of FABP3 degradation via selective autophagy. FABP3 accumulation impaired osteogenesis of MSCs, leading to the occurrence of OP. Thus, reactivating OPTN or inhibiting FABP3 would open a new avenue to treat senile OP.
Abbreviations: ADIPOQ: adiponectin, C1Q and collagen domain containing; ALPL: alkaline phosphatase, liver/bone/kidney; BGLAP/OC/osteocalcin: bone gamma carboxyglutamate protein; BFR/BS: bone formation rate/bone surface; CALCOCO2/NDP52: calcium binding and coiled-coil domain 2; CDKN1A/p21: cyclin-dependent kinase inhibitor 1A; CDKN2A/p16: cyclin dependent kinase inhibitor 2A; CDKN2B/p15: cyclin dependent kinase inhibitor 2B; CEBPA: CCAAT/enhancer binding protein (C/EBP), alpha; COL1A1: collagen, type I, alpha 1; Ct. BV/TV: cortical bone volume fraction; Ct. Th: cortical thickness; Es. Pm: endocortical perimeter; FABP4/Ap2: fatty acid binding protein 4, adipocyte; H2AX: H2A.X variant histone; HE: hematoxylin and eosin; MAP1LC3B: microtubule-associated protein 1 light chain 3 beta; MAR: mineral apposition rate; MSCs: bone marrow mesenchymal stem cells; NBR1: NBR1, autophagy cargo receptor; OP: osteoporosis; OPTN: optineurin; PDB: Paget disease of bone; PPARG: peroxisome proliferator activated receptor gamma; Ps. Pm: periosteal perimeter; qRT-PCR: quantitative real-time PCR; γH2AX: Phosphorylation of the Serine residue of H2AX; ROS: reactive oxygen species; RUNX2: runt related transcription factor 2; SA-GLB1: senescence-associated (SA)-GLB1 (galactosidase, beta 1); SP7/Osx/Osterix: Sp7 transcription factor 7; SQSTM1/p62: sequestosome 1; TAX1BP1: Tax1 (human T cell leukemia virus type I) binding protein 1; Tb. BV/TV: trabecular bone volume fraction; Tb. N: trabecular number; Tb. Sp: trabecular separation; Tb. Th: trabecular thickness; μCT: micro computed tomography.
Introduction
Senile osteoporosis is characterized by osteoporotic bone loss during aging. In the bone of aged mice, osteopenia is associated with lower autophagic activity [Citation1–3], which is alleviated by autophagy activation [Citation4,Citation5] and enhanced by autophagy suppression [Citation6]. The mechanistic study shows that autophagy regulates osteoclast differentiation [Citation7,Citation8], osteoblast mineralization [Citation9] and chondrocyte differentiation [Citation10]. Although master regulators in autophagy pathways have been investigated in the regulation of bone metabolism [Citation6,Citation11–13], whether and how these factors play a role in MSCs fate determination and osteoporotic bone loss during aging remains unknown.
OPTN is an autophagy receptor that plays a central role in selective autophagy [Citation14–16], degrading the organelles and aggregates under stress conditions. However, the evidence is still lacking that whether selective autophagy has specificity to degrade the targeted proteins. Studies from the last decades showed that selective autophagy could be mediated by autophagy receptors, such as NBR1 (NBR1, autophagy cargo receptor), CALCOCO2/NDP52 (calcium binding and coiled-coil domain 2), SQSTM1/p62 (sequestosome 1), TAX1BP1 (Tax1 binding protein 1) and OPTN [Citation17]. OPTN and SQSTM1 formed a complex to co-regulate selective autophagy [Citation15]. Current genome-wide studies revealed that OPTN mutation was associated with Paget disease of bone (PDB), which was characterized by excessive and disorganized unsystematic bone remodeling [Citation18–21]. Obaid et al. (2015) reported that PDB mutant mice (OptnD477N/D477N, OptnΔEx12) had increased osteoclasts and OPTN suppressed osteoclast activity by inhibiting NFKB signaling pathway in an autophagy-independent manner [Citation22]. However, evaluation of autophagic activity was lacking in this study. Thus, whether OPTN affects bone metabolism in an autophagy-dependent manner and the effects on osteogenesis are still unknown.
MSCs, characterized by self-renew and differentiation ability into osteoblasts, adipocytes and chondrocytes, play a critical role in bone homeostasis. During aging, MSCs partially lose their self-renewal capacity and differentiate into adipocytes instead of osteoblasts, causing bone loss and fat accumulation [Citation4,Citation23,Citation24]. Autophagy can regulate the senescence of MSCs [Citation4]. However, the underlying molecular mechanism of MSCs’ aging needs more precise elucidation.
Herein, optn–/ – mice showed decreased bone mass and bone rigidity. optn–/ – MSCs had elevated senescence markers, impaired autophagic activity, decreased osteogenesis, and increased adipogenesis. We further identified FABP3 as a novel selective autophagy substrate of OPTN. FABP3 is mainly expressed in skeletal muscle, heart and placenta, plays a role in the intracellular transport of long-chain fatty acids and their acyl-CoA esters [Citation25]. In our study, we found that accumulation of FABP3 in optn–/ – mice induced senescence and adipogenesis, inhibited autophagic activity and osteogenesis. Our work determined that OPTN downregulates the senescence and adipogenesis of MSCs via clearing FABP3.
Results
Optn-deficient mice exhibit elevated bone loss and senescence of MSCs
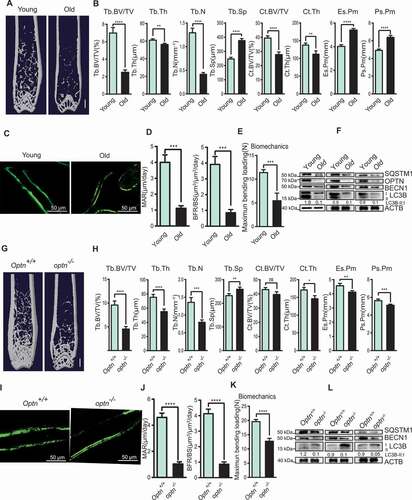
Aged mice represent a typical scenario where decreased bone mass meet with elevated adipocytes accumulation in bone tissue, concomitant with reduced autophagic activity [Citation1–3]. μCT analysis of the femora revealed less bone mass and impaired microarchitecture in aged (16-month) mice as compared with young (2-month) mice: trabecular bone volume fraction (Tb. BV/TV) was 63% lower, Tb. Th (trabecular thickness) and Tb. N (trabecular number) were respectively 8% and 67% lower, Tb. Sp (trabecular separation) was 52% higher, Ct. BV/TV (cortical bone volume fraction) and Ct. Th (cortical thickness) were lower, Ps. Pm (periosteal perimeter) and Es. Pm (endocortical perimeter) were significantly larger by 29% and 34% respectively (). Bone formation was also declined during aging as assessed by calcein double labeling, the quantification of MAR (mineral apposition rate), and BFR (bone formation rate) (). The bone rigidity was impaired in old mice as measured by a three-point bending test (). The mRNA levels of autophagy-related genes (Sqstm1, Optn, Becn1/Beclin1, Map1lc3b/Lc3b [microtubule-associated protein 1 light chain 3 beta], Atg7 [autophagy related 7]), as well as protein levels of SQSTM1, BECN1 and LC3B-II:LC3B-I ratio, were lower in femora of aged mice as compared with those in young mice (, S1A and S1B). We found that optn–/ – mice were smaller than the Optn+/+ littermates (Fig. S1C and S1D). The absence of OPTN in the bone of optn–/ – mice was confirmed by western blot (Fig. S1E). μCT analysis of the femora also demonstrated that optn–/ – mice, as compared with Optn+/+ mice, had less bone mass and impaired microarchitecture: Tb. BV/TV was 47% lower, Tb. Th and Tb. N were respectively 27% and 41% lower, Tb. Sp was higher, no difference for Ct. BV/TV, Ct. Th was slightly lower, Ps. Pm and Es. Pm were both 10% smaller (). Bone formation was declined in optn–/ – mice as assessed by calcein double labeling, the quantification of MAR and BFR (). The bone rigidity was also impaired in optn–/ – mice as determined by a three-point bending test (). In addition, the mRNA levels of autophagy-related genes (Sqstm1, Becn1, Lc3b, Atg7), as well as protein levels of SQSTM1, BECN1 and LC3B-II:LC3B-I ratio, were lower in femora of optn–/ – mice as compared with those in Optn+/+ mice (, S1F and S1G). The result was inconsistent with previous work showing that SQSTM1 was the best-known substrate of autophagy and accumulated in autophagy deficiency status [Citation26]. The paradox of dropped LC3B-II:LC3B-I ratio and declined SQSTM1 and OPTN protein levels might be due to the reduction in synthesis of SQSTM1and OPTN. Although degradation of SQSTM1 and OPTN was impaired in optn–/ – mice, the synthesis reduction effect was greater than the degradation. We also determined other autophagy receptors, such as CALCOCO2, TAX1BP1 and NBR1 in aged mice, showing reduction or no significant change while comparing with those in young mice (Fig. S1H). Furthermore, we determined the autophagic flux in Optn+/+ and optn–/ – MSCs. The SQSTM1 and LC3B-II:LC3B-I ratio are indicators of autophagic flux, and elevated SQSTM1 level and LC3B-II:LC3B-I ratio with an autophagy inhibitor bafilomycin A1 treatment demonstrate increased autophagosome formation [Citation27]. Herein, upon treatment of bafilomycin A1, SQSTM1 level and LC3B-II:LC3B-I ratio were lower in optn–/ – MSCs as compared with those in Optn+/+ MSCs (Fig. S1I), suggesting that loss of Optn leads to a reduction in autophagosome formation.
Figure 1. Optn-deficient mice exhibit elevated bone loss and impaired autophagy similar to the aged mice. (A-B) Representative μCT images (A) and quantitative μCT analysis of bone mass and microarchitecture (B) in femora from young (2-month) and old (16-month) mice. Scale bar: 1 mm. n ≥ 5 per group. Tb. BV/TV, trabecular bone volume fraction; Tb. Th, trabecular thickness; Tb. N, trabecular number; Tb. Sp, trabecular separation; Ct.BV/TV, cortical bone volume fraction; Ct. Th, cortical thickness; Es. Pm, endocortical perimeter; Ps. Pm, periosteal perimeter. (C-D) Representative images of calcein double labeling of trabecular bone of young and old mice (C) with quantification of MAR and BFR (D). Scale bar: 50 μm. n= 5 per group. MAR, mineral apposition rate; BFR, bone formation rate. (E) Quantification of biomechanics of femora from young and old mice. n≥ 5 per group. (F) Western blot analysis of SQSTM1, OPTN, BECN1, LC3B in femora from 3 pairs of young and old mice. ACTB was used as a loading control. (G-H) Representative μCT images (G) and quantitative μCT analysis of bone mass and microarchitecture (H) in femora from 4-month-old Optn+/+ and optn–/ – mice. Scale bar: 1 mm. n≥ 14 per group. (I-J) Representative images of calcein double labeling of trabecular bone of Optn+/+ and optn–/ – mice (I) with quantification of MAR and BFR (J). Scale bar: 50 μm. n= 5 per group. (K) Quantification of biomechanics of femora from Optn+/+ and optn–/ – mice. n≥ 14 per group. (L) Western blot of SQSTM1, BECN1, LC3B in femora from 3 pairs of Optn+/+ and optn–/–mice. All data are presented as mean ± sd. **P< 0.05, **P< 0.01, *** P< 0.001, **** P< 0.0001 by Student’s t test
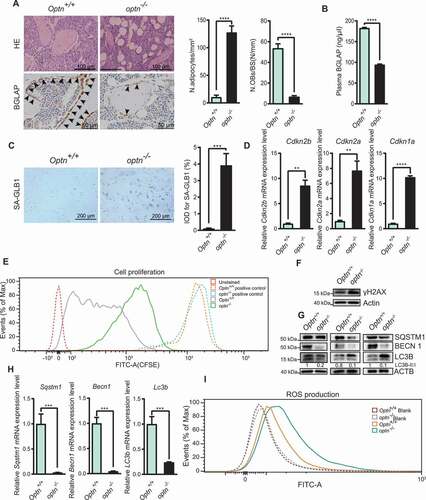
To explore the underlying mechanism of severe bone loss upon Optn deficiency, we found that adipocyte numbers were remarkably increased, while osteoblast numbers were notably decreased, as illustrated by HE staining and BGLAP staining ( and S2A). Serum BGLAP concentration was also decreased in optn–/ – mice (). Moreover, we found that the senescence of optn–/ – MSCs was significantly higher than that of Optn+/+ MSCs, as shown by SA-GLB1 (senescence-associated [SA]-GLB1 [galactosidase, beta 1]) staining (). We also observed that mRNA and protein levels of CDKN2B/p15 (cyclin dependent kinase inhibitor 2B), CDKN2A/p16 (cyclin dependent kinase inhibitor 2A), CDKN1A/p21 (cyclin-dependent kinase inhibitor 1A), markers of senescence, were significantly higher in optn–/ – MSCs as compared with Optn+/+ MSCs ( and S2B). We further found that the proliferation ability was impaired in optn–/ – MSCs relative to Optn+/+ MSCs, as shown by the carboxyfluorescein diacetate succinimidyl ester (CFSE) cell proliferation test (). The protein level of γH2AX (Phosphorylation of the Serine residue of H2AX), a marker of DNA damage, was higher in optn–/ – MSCs than that in Optn+/+ MSCs (). These results suggested that elevated senescence of MSCs occurred in optn–/ – mice. Furthermore, we experimentally determined whether compromised autophagic activity is associated with the senescence of MSC in optn–/ – mice. The mRNA levels of autophagy-related genes (Sqstm1, Becn1, Lc3b, Atg7), as well as protein levels of SQSTM1, BECN1 and LC3B-II:LC3B-I ratio, were lower in optn–/ – MSCs as compared with those in Optn+/+ MSCs ( and S2H). Significant increase of ROS was also observed in optn–/ – MSCs relative to Optn+/+ MSCs (). We also observed increased number of adipocytes and decreased number of osteoblasts in femora of aged mice than young mice (Fig. S2C). Serum BGLAP concentration was lower in aged mice than young mice (Fig. S2D). Enhanced SA-GLB1 staining (Fig. S2E), reduced cell proliferation capacity (Fig. S2F), and increased ROS accumulation (Fig. S2G) were also observed in MSCs isolated from aged mice compared with those in MSCs isolated from young mice. These results suggested that autophagy deficiency might be responsible for the senescence and fate commitment of MSCs during skeleton aging.
Figure 2. Optn deficiency exacerbated bone-fat imbalance and enhanced senescence of MSCs. (A) Representative HE and BGLAP staining and quantification of adipocyte number per tissue area (N. adipocytes/mm2) and osteoblast number per bone surface (N. OBs/BS) in femora from Optn+/+ and optn–/ – mice. Scale bars: 100 μm (top), 50 μm (bottom). n= 5 per group. (B) ELISA of serum BGLAP in Optn+/+ and optn–/ – mice. n= 3 per group. (C) Representative SA-GLB1 staining of MSCs from Optn+/+ and optn–/ – mice and integrated optical density (IOD) quantification. Scale bar: 200 μm. n= 5 per group. (D) The expression level of Cdkn2b, Cdkn2a, and Cdkn1a in MSCs from Optn+/+ and optn–/ – mice, as determined by qRT-PCR. n= 3 per group. (E) Flow cytometry analysis of the proliferation of MSCs from Optn+/+ and optn–/ – mice, as assessed MSCs with CFSE labeling after 2 d of culturing. Unstained MSCs were used as a negative control, MSCs with CFSE labeling before flow cytometry were used as a positive control. (F-G) Western blot of γH2AX (F), SQSTM1, BECN1, LC3B (G) in MSCs from Optn+/+ and optn–/ – mice. (H) The expression level of Lc3b, Becn1, and Sqstm1 in MSCs from Optn+/+ and optn–/ – mice, as determined by qRT-PCR. n= 3 per group. (I) Flow cytometry analyzed reactive oxygen species (ROS) of MSCs from Optn+/+ and optn–/ – mice, as assessed after staining with ROS Detection Solution. Unstained MSCs were used as a negative control. All data are presented as mean ± sd. **P< 0.05, **P< 0.01, *** P< 0.001, **** P< 0.0001 by Student’s t test
Optn regulates the fate commitment of MSCs during skeleton aging
Next, the osteogenesis and adipogenesis ability of MSCs from optn–/ – and Optn+/+ mice, as well as aged and young mice, were analyzed in vitro. Upon osteogenic induction, the number of mineralized nodes and the ALPL formation were significantly lower in optn–/ – MSCs than Optn+/+ MSCs, as shown by ARS (alizarin red staining) and ALPL staining (). On the contrary, under adipogenic differentiation, lipid droplet formation was much higher in optn–/ – MSCs than Optn+/+ MSCs, as evidenced by oil red O staining (). Western blot showed that RUNX2 protein level was lower under osteogenic differentiation, and ADIPOQ (adiponectin, C1Q and collagen domain containing) protein level was higher under adipogenic differentiation in optn–/ – MSCs than Optn+/+ MSCs (). Under osteogenic induction for 0, 3, 4, and 7 d, qRT-PCR showed that the mRNA levels of osteogenesis-related genes (Runx2 [runt related transcription factor 2], Col1a1 [collagen, type I, alpha 1], Sp7/Osx/Osterix [Sp7 transcription factor 7], Bglap/OC/osteocalcin [bone gamma carboxyglutamate protein], Alpl [alkaline phosphatase, liver/bone/kidney]) were much lower in optn–/ – MSCs than Optn+/+ MSCs (). In contrast, under adipogenic induction for 0, 4 and 7 d, qRT-PCR showed that mRNA levels of adipogenesis-related genes (Pparg [peroxisome proliferator activated receptor gamma], Adipoq, Fabp4/Ap2 [fatty acid binding protein 4, adipocyte], Cebpa [CCAAT/enhancer binding protein {C/EBP}, alpha]) were remarkably higher in optn–/ – MSC than Optn+/+ MSCs (). Moreover, upon osteogenic and adipogenic induction, MSCs isolated from aged mice had suppressed osteogenesis and elevated adipogenesis as compared with MSCs isolated from young mice, as evidenced by ARS, ALPL staining, oil red O staining and western blot analysis of mineralized nodes, ALPL formation, lipid droplet formation and RUNX2 and ADIPOQ protein levels, respectively (Fig. S3A-C).
Figure 3. Optn controls osteogenic and adipogenic differentiation of MSCs. (A-B) Representative images of alizarin red S staining (left), ALPL staining (middle), and oil red O staining (right) of MSCs from Optn+/+ and optn–/ – mice under osteogenic and adipogenic differentiation respectively (A), and quantification of IOD (B). Scale bars: 200 μm (left, middle), 50 μm (right). n= 5 per group. IOD, integrated optical density. (C) Western blot detection of RUNX2 and ADIPOQ in Optn+/+ and optn–/ – MSCs under osteogenic and adipogenic differentiation, respectively. ACTB was used as a loading control. (D-E) mRNA expression levels of osteogenesis-related genes (Runx2, Bglap, Alpl, Col1a1, Sp7) under osteogenic induction for 0, 3, 4, and 7 d (D) and adipogenesis-related genes (Cebpa, Adipoq, Fabp4, Pparg) under adipogenic induction for 0, 4, and 7 d (E) in Optn+/+ and optn–/ – MSCs as determined by qRT-PCR. n= 3 per group. (F-H) Representative μCT images (F), quantitative μCT analysis of bone mass and microarchitecture (G), and quantification of biomechanics (H) in femora from optn–/ – mice transplanted with optn–/ – or Optn+/+ MSCs in the bone marrow cavity (IBM). Scale bar: 1 mm. n= 8 per group. (I-J) The representative of HE staining (left), BGLAP staining (middle), and calcein double labeling (right) in femora from optn–/ – mice transplanted with optn–/ – or Optn+/+ MSCs (IBM) (I), and quantification of N.adipocytes/mm2, N.OBs/BS, MAR and BFR (J). Scale bars: 100 μm (left), 50 μm (middle, right) 50 μm. n= 8 per group. (K) ELISA of serum BGLAP in optn–/ – mice transplanted with optn–/ – or Optn+/+ MSCs (IBM). n= 3 per group. All data are presented as mean ± sd. **P< 0.05, **P< 0.01, *** P< 0.001, **** P< 0.0001 by Student’s t test
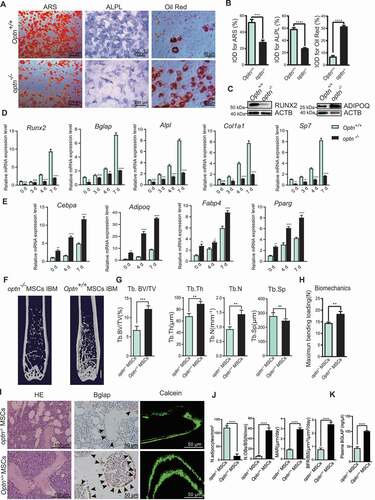
Furthermore, we transplanted optn–/ – MSCs and Optn+/+ MSCs into optn–/ – mice to determine whether the Optn could restore bone loss of optn–/ – mice. Both intra-bone marrow (IBM) injection and intravenous (IV) injection of Optn+/+ MSCs, but not optn–/ – MSCs, rescued both spongy and compact bone loss in optn–/ – mice, as revealed by the μCT reconstruction of femora and the significantly elevated Tb. BV/TV, Tb. Th, Tb. N and Ps. Pm ( and S3D-F). Bone rigidity was also restored in optn–/ – mice with transplantation of Optn+/+ MSCs, but not optn–/ – MSCs, as evidenced by three-point bending test ( and S3G). Adipogenesis was alleviated, and osteogenesis was elevated in optn–/ – mice with transplantation of Optn+/+ MSCs, but not optn–/ – MSCs, as revealed by fewer adipocytes and more osteoblasts in the bone tissues, increased serum BGLAP concentration, as well as increased MAR and BFR (). In optn–/ – mice transplanted with Optn+/+ MSCs, but not optn–/ – MSCs, we observed increased mRNA and protein expression levels of autophagy-related genes (Sqstm1, Becn1, Lc3b, Atg7) and osteogenesis-related genes (Runx2, Col1a1, Sp7, Bglap, Alpl), as well as decreased expression levels of senescence-related genes (Cdkn2b, Cdkn2a, Cdkn1a) and adipogenesis-related genes (Pparg, Adipoq, Fabp4, Cebpa) (Fig. S3H and S3I).
Optn function in autophagy contributes to senescence and fate commitment of MSCs
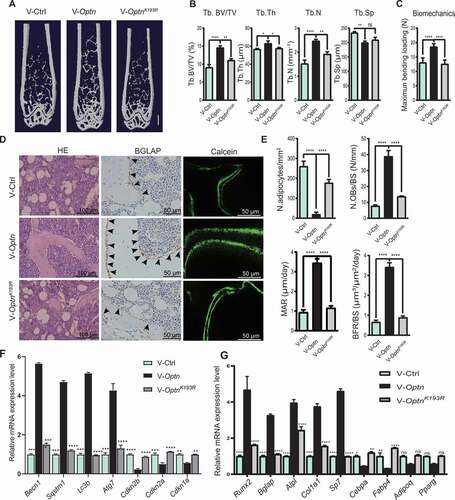
We re-expressed WT Optn and the mutated form OptnK193R, a mutation in the ubiquitination site impairing autophagic activity of OPTN [Citation15], into optn–/ – MSCs by lentiviral infection. Exogenous HA-tagged OPTN expression in optn–/ – MSCs was confirmed by western blot with a HA antibody (). OPTNK193R was distributed in the cytoplasm and nucleus, exactly the same as WT OPTN (). Previous studies have shown that autophagy is responsible for eliminating intracellular sources of ROS, including mitochondria and peroxisomes [Citation28], thus, autophagy defect leads to accumulation of ROS [Citation29]. In our study, we observed more ROS accumulation in optn–/ – MSCs as compared to Optn+/+ MSCs (), and the accumulation of ROS in optn–/ – MSCs was inhibited by infection of Optn lentivirus, but not OptnK193R lentivirus (). Furthermore, the SA-GLB1 (a marker of cellular senescence)-positive cell number, as well as γH2AX (Phosphorylation of the Ser-139 residue of H2AX) protein level, were significantly reduced in optn–/ – MSCs infected by lentivirus carrying Optn, but not OptnK193R, as evidenced by SA-GLB1 staining and western blot (). CFSE-labeling assay showed that the proliferation ability was significantly enhanced in optn–/ – MSCs infected with Optn, but not OptnK193R (). In vitro differentiation assays revealed enhanced osteogenesis and reduced adipogenesis in optn–/ – MSCs infected with Optn, but not OptnK193R, as evaluated by ARS, ALPL and oil red O staining of mineralized nodes, ALPL formation and lipid droplet formation respectively (), qRT-PCR analysis of mRNA expression levels of osteogenesis-related genes (Runx2, Bglap, Alpl, Col1a1, Sp7) and adipogenic genes (Cebpa, Fabp4, Adipoq, Pparg) (Fig. S4A and S4B), as well as western blot detection of RUNX2 and ADIPOQ protein levels (). Moreover, we overexpressed WT and mutated OPTN in optn–/ – mice via intravenous injection of lentivirus carrying Optn and OptnK193R respectively. Overexpression of Optn, but not OptnK193R, rescued optn–/ – mice from low bone mass and strength phenotypes ( and S5A), exhibited decreased adipocyte numbers and increased osteoblast number as shown by HE staining and BGLAP IHC staining respectively (), increased MAR and BFR as shown by calcein double labeling (), enhanced mRNA levels of autophagy- and osteogenesis-related genes and decreased senescence- and adipogenesis-related genes in femora as shown by qRT-PCR (). In parallel, optn–/ – MSCs, expressing Optn, OptnK193R or control vector, were intravenously transplanted into optn–/ – mice. The expressions of OPTN and OPTNK193R in femora of optn–/ – mice after MSCs transplantation were confirmed by western blot (Fig. S5G). Consistently, MSCs transplantation exhibited similar results as the lentivirus administration. optn–/ – mice with transplantation of optn–/ – MSCs expressing Optn, but not OptnK193R, exhibited restored bone mass and strength as shown by μCT analysis and three-point bending test respectively (Fig. S5B-D), decreased adipocyte numbers and increased osteoblast number as shown by HE staining and BGLAP IHC staining respectively (Fig. S5E and S5F), increased MAR and BFR as shown by calcein double labeling (Fig. S5E and S5F), as well as decreased mRNA levels of senescence- and adipogenesis-related genes and increased mRNA levels of autophagy- and osteogenesis-related genes in femora as shown by qRT-PCR (Fig. S5H and S5I), and increased autophagy-related proteins as determined by western blot (Fig. S5G). Therefore, it can be concluded that OPTNK193R fails to rescue disrupted bone-fat balance phenotype in optn–/ – mice. Meanwhile, our previous study has shown that OPTNK193R mutant could not be modified by ubiquitin to form a complex with SQSTM1 to promote the autophagic flux, and lower autophagic activity was determined in cells transfected with OptnK193R as compared with Optn [Citation15].
Figure 4. Induction of Optn but not OptnK193R restored osteogenic differentiation of optn–/ – MSCs. (A) Western blot of HA-tagged OPTN and γH2AX in optn–/ – MSCs infected with lentivirus Ctrl vector, or lentivirus carrying Optn or OptnK193R. ACTB was used as a loading control. (B) Representative immunofluorescence images show the localization of OPTN the OPTNK193R in MSCs with anti-HA antibody. Scale bar: 20 μm. n= 5 per group. (C) Flow cytometry analyzed ROS in optn–/ – MSCs infected with lentivirus Ctrl vector, or lentivirus carrying Optn or OptnK193R, as assessed after staining with ROS Detection Solution. Unstained MSCs were used as a negative control. (D) Representative of SA-GLB1 staining in optn–/ – MSCs infected with lentivirus Ctrl vector, or lentivirus carrying Optn or OptnK193R, and quantification of IOD. Scale bar: 200 μm. n= 5 per group. (E) Flow cytometry analyzed cell proliferation in optn–/ – MSCs infected with lentivirus Ctrl vector, or lentivirus carrying Optn or OptnK193R, as assessed MSCs with CFSE labeling after 2 d culturing. Unstained MSCs were used as a negative control, MSCs with CFSE labeling before flow cytometry were used as positive control. (F-H) Representative images of alizarin red S staining (top), ALPL staining (middle), oil red O staining (bottom) (F), quantification of IOD (G), western blot of RUNX2 and ADIPOQ (H) in optn–/ – MSCs overexpressing Ctrl vector, Optn, or OptnK193R under osteogenic and adipogenic differentiation respectively. Scale bars: 200 μm (top, middle), 50 μm (bottom). n= 5 per group. All data are presented as mean ± sd. **P< 0.05, **P< 0.01, *** P< 0.001, **** P< 0.0001 by one-way ANOVA with Dunettee’s post hoc test
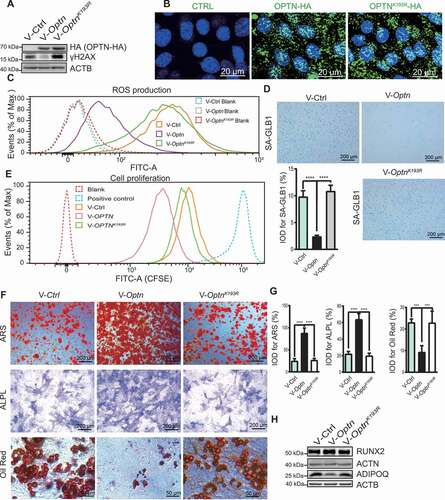
Figure 5. Induction of Optn but not OptnK193R mitigated bone loss in optn–/ – mice. (A-C) Representative μCT images (A), quantitative μCT analysis of bone mass and microarchitecture (B), and quantification of biomechanics (C) in femora from optn–/–mice infected with lentivirus Ctrl vector, or lentivirus carrying Optn or OptnK193R, (IV). Scale bar: 1 mm. n= 5 per group. (D-E) The representative of HE staining (left), BGLAP staining (middle), and calcein double labeling (right) and quantification of N.adipocytes/mm2, N.OBs/BS, MAR and BFR in femora of optn–/–mice infected with lentivirus Ctrl vector, or lentivirus carrying Optn or OptnK193R, (IV). Scale bars: 100 μm (left), 50 μm (middle, right). n= 5 per group. (F-G) mRNA expression levels of senescence-related genes (Cdkn2b, Cdkn2a, Cdkn1a), autophagy-related genes (Becn1, Sqstm1, Lc3b, Atg7) (F), osteogenesis-related genes (Runx2, Bglap, Alpl, Col1a1, Sp7) and adipogenesis-related genes (Cebpa, Adipoq, Fabp4, Pparg) (G) in femora of optn–/ – mice infected with lentivirus Ctrl vector, or lentivirus carrying Optn or OptnK193R, as determined by qRT-PCR. n= 3 per group. All data are presented as mean ± sd. **P< 0.05, **P< 0.01, *** P< 0.001, **** P< 0.0001 by one-way ANOVA with Dunettee’s post hoc test
FABP3 is regulated via OPTN-dependent autophagy pathway
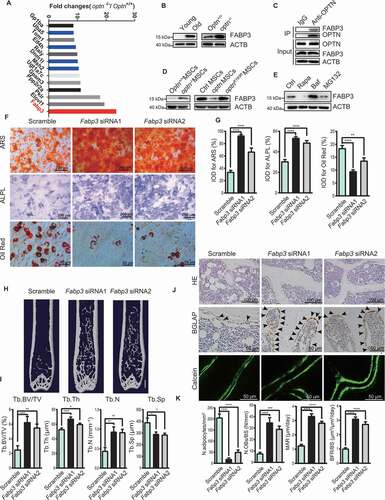
We affirmed that OPTN was critical for senescence of MSCs and bone-fat balance during aging. We further explored the underlying mechanism. We compared protein profiles of the bone tissues from Optn+/+ and optn–/ – mice by mass spectrometry. Among the top 13 upregulated proteins, FABP3 was the most upregulated one, as 28-fold higher in optn–/ – mice than Optn+/+ mice ( and S6A). The FABP3 accumulation in optn–/ – mouse suggested that OPTN might be a modulator of FABP3. Since OPTN functions as an autophagy receptor in selective autophagy process, we hypothesized that FABP3 would be degraded through OPTN-mediated autophagy pathway. Western blot further confirmed that FABP3 protein level was much higher in the femora of optn–/ – and aged mice compared to Optn+/+ and young mice, respectively (). Co-immunoprecipitation assays revealed protein-protein interaction between OPTN and FABP3 (), and enhanced association of OPTN and FABP3 upon treatment with bafilomycin A1 (Fig. S6B). Furthermore, western blot showed that FABP3 protein level was significantly higher in optn–/ – MSCs compared to Optn+/+ MSCs, and re-expression of Optn, but not OptnK193R, reduced FABP3 protein level in optn–/ – MSCs (). Additionally, FABP3 protein level was substantially decreased in Optn+/+ MSCs treated with an autophagy inducer rapamycin, and elevated when treated with an autophagy inhibitor bafilomycin A1, but not obviously changed upon the treatment of a proteasome inhibitor MG132, as evidenced by western blot (). Immunofluorescent images showed colocalization of FABP3 and OPTN (Fig. S6C), as well as FABP3 and LC3B (Fig. S6D), in MSCs and femora from Optn+/+ mice. These results suggest that OPTN functions to regulate FABP3 levels specifically by autophagy.
Figure 6. FABP3 is a downstream regulator of OPTN. (A) Mass spectrum showing FABP3 accumulated in bone tissue of optn–/ – mice. (B) Western blot of FABP3 expression in femora of each group. (C) Co-Immunoprecipitation showing FABP3 interacted with OPTN in mice bone tissue. (D) Western blot of FABP3 in MSCs isolated from femora of each group. (E) Western blot of FABP3 in MSCs treated with indicated compounds. (F-G) Representative images of alizarin red S staining (top), ALPL staining (middle), and oil red O staining (bottom) (F) and quantification of IOD (G) in optn–/ – MSCs overexpressing Scramble siRNA, Fabp3 siRNA1, or Fabp3 siRNA2 under osteogenic and adipogenic differentiation respectively. Scale bars: 200 μm (top, middle), 50 μm (bottom). n= 5 per group. (H-I) Representative μCT images (H), and quantitative μCT analysis of bone mass and microarchitecture (I) in femora of optn–/ – mice infected with lentivirus carrying Scramble siRNA, Fabp3 siRNA1, or Fabp3 siRNA2. Scale bar: 1 mm. n= 9 per group. (J-K) The representative of HE staining (top), BGLAP staining (middle), and calcein double labeling (bottom) (J) and quantification of N. adipocytes/mm2, N.OBs/BS, MAR, and BFR (K) in femora of optn–/–mice infected with lentivirus carrying Scramble siRNA, Fabp3 siRNA1 or Fabp3 siRNA2. Scale bars: 100 μm (top), 50 μm (middle, bottom). n= 5 per group. All data are presented as mean ± sd. **P< 0.05, **P< 0.01, *** P< 0.001, **** P< 0.0001 by one-way ANOVA with Dunettee’s post hoc test
Elimination of FABP3 protein rescues osteoporotic phenotypes
We silenced Fabp3 expression in MSCs with Fabp3 siRNAs. Fabp3 siRNA1 and siRNA2 could completely knockdown Fabp3 expression as determined by western blot (Fig. S7A). As compared to optn–/ – MSCs transfected with scramble siRNA, optn–/ – MSCs transfected with Fabp3 siRNAs exhibited enhanced osteogenesis under osteogenic induction and reduced adipogenesis under adipogenic induction, as revealed by ARS, ALPL and oil red O staining of mineralized nodes, ALPL formation and lipid droplet formation respectively (), as well as western blot detection of RUNX2 and ADIPOQ protein levels (Fig. S7A). Moreover, the proliferation ability of optn–/ – MSCs was also restored by siRNAs-induced knockdown of Fabp3 (Fig. S7B), associated with reduced SA-GLB1 staining (Fig. S7C), declined ROS production (Fig. S7D). Furthermore, we speculated that the elimination of Fabp3 might ameliorate the bone loss phenotype in optn–/ – mice. FABP3 was almost completely eliminated as determined by the western blot in femora of optn–/ – mice after Fabp3 siRNAs infection (Fig. S7E). Compared to the scramble siRNA group, the Fabp3 siRNA groups showed improved bone mass and bone rigidity (, S7F and S7G), more osteoblasts and less adipocytes (), elevated MAR and BFR (), increased serum BGLAP concentration (Fig. S7H), as well as higher mRNA levels of autophagy- and osteogenesis-related genes and lower mRNA levels of senescence- and adipogenesis-related genes (Fig. S7I and S7J). These results suggest that FABP3 may be a selected substrate of OPTN, accumulating in optn–/ – mice, causing senescence and adipogenesis of MSCs, disrupting bone-fat balance.
Intravenous injection of Optn or Fabp3 siRNA attenuates bone loss in aged mice
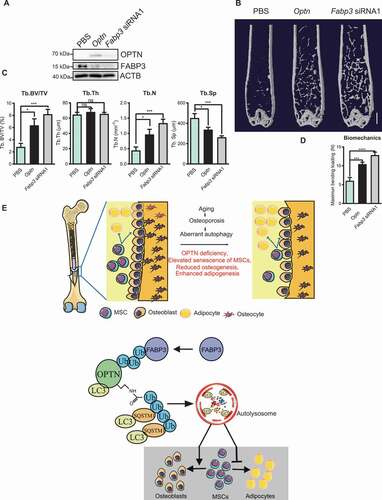
To further evaluate whether Optn regulated fate determination of MSCs could attenuate bone loss during aging, we introduced Optn cDNA or Fabp3 siRNA1 into aged mice (16-month-old) intravenously. Two months after treatment, overexpression of OPTN and knockdown of FABP3 in femora of aged mice were confirmed by western blot (). μCT analysis and three-point bending test showed increased Tb. BV/TV, Tb. Th, Tb. N, decreased Tb. Sp, and improved bone rigidity in femora of both Optn overexpressing and Fabp3 eliminating groups compared to vehicle group (). Overall, our results demonstrate that OPTN regulates MSCs fate and bone-fat balance during aging through modulating FABP3 ().
Figure 7. Optn mitigated osteoporosis through Fabp3. (A) Western blot of OPTN and FABP3 in femora of old mice infected with lentivirus carrying Optn or Fabp3 siRNA1 (IV). (B-D) Representative μCT images (B), quantitative μCT analysis of bone mass and microarchitecture (C), and quantification of the biomechanics (D) in femora of old mice infected with lentivirus carrying Optn or Fabp3 siRNA1 (IV). PBS injection was used as a control. Scale bar: 1 mm. n= 10 per group. (E) Model by which Optn regulates the aging of MSCs. All data are presented as mean ± sd. **P< 0.05, **P< 0.01, *** P< 0.001, **** P< 0.0001 by one-way ANOVA with Dunettee’s post hoc test
Discussion
Autophagy regulated bone metabolism [Citation12,Citation30–32]. Inhibition of autophagy accelerated bone loss [Citation33], and activation of autophagy pathway alleviated osteoporosis [Citation12]. However, the intimate molecular mechanism was not thoroughly explored. Ma et al. (2018) reported that autophagy was reduced in aged MSCs and activation of autophagy partially reversed aging of MSCs and restored bone loss in aged mice [Citation4]. However, the molecular mechanism of the aging of MSCs related to autophagy deficiency remains unclear. Our findings revealed that aged MSCs, as compared with young MSCs, had reduced osteogenesis, elevated adipogenesis, reduced proliferation and enhanced senescence, consistent with the previous findings [Citation4,Citation23,Citation24]. Our present study further revealed the detailed mechanisms: Optn expression level was much lower in MSCs from aged mice as compared with MSCs from young mice; re-expression of Optn reversed aging of optn–/ – MSCs and reduced bone loss in optn knockout mice; FABP3 was firstly identified as a substrate for OPTN-mediated autophagic degradation, its accumulation caused by OPTN deficiency and induced bone loss; overexpression of Optn or elimination of Fabp3 alleviated bone loss in aged mice. These results suggest that OPTN-FABP3 axis may be responsible for the aging of MSCs.
OPTN has been reported to be involved in the regulation of bone metabolism [Citation22,Citation34]. Obaid et al. (2015) revealed that OPTN mutant mice (OptnD477N/D477N, OptnΔEx12) had increased osteoclasts and OPTN suppressed osteoclast activity by inhibiting NFKB signaling pathway [Citation22]. However, evaluation of autophagic activity was lacking in this study. Our study focused on determining the changes of autophagic activity comparing optn–/ – mice with Optn+/+ mice, and found that global knockout of Optn caused reduction of autophagic activity, senescence of MSCs, reduction of osteogenesis, elevation of adipogenesis, and bone loss. Moreover, OPTN might participate in regulating protein degradation of NFKB signaling pathway. This speculation needs further study. In another study, Wong et al. (2020) reported that optn knockout mice developed abnormal bone morphology at 22-month of age [Citation34]. They generated global optn knockout (CMV-Cre; Optnflox/flox) mice by targeting vector-inserted LoxP site that flanks the exon 1 (untranslated region). The Cre recombinase activity and recombinant efficacy might be different from tissue to tissue. Their study did not determine whether OPTN expression was eliminated in the bone tissue. Here, we used the optn–/ – mice (Optntm1a(EUCOMM)Wtsi; MASV; EPD0116_2_G06), which was an Optn global knockout mouse model. We observed obvious bone loss as early as in 4-month-old mice, which might be due to complete depletion of OPTN.
We further found that FABP3 abundantly accumulated in bone tissue of optn–/ – mouse, and was degraded by the OPTN-mediated autophagy pathway. We firstly identified FABP3 as a novel selective autophagy substrate of OPTN. The accumulation of FABP3 in MSCs reduced proliferation and enhanced adipogenesis of these cells. Elimination of FABP3 reversed bone loss phenotype caused by Optn deficiency. Furthermore, overexpression of Optn or inhibition of Fabp3 alleviated bone loss in aged mice.
A central finding of our study is that autophagy receptor OPTN affects bone metabolism by promoting osteogenesis and attenuating adipogenesis of MSCs, and FABP3 is a novel selective autophagic substrate of OPTN. Overexpression of Optn or inhibition of Fabp3 in aged mice can alleviate bone loss. Our research provides new ideas and target sites for the treatment of senile osteoporosis.
Materials and methods
Ethics statement and animal handling
All procedures involving animals and their care in this study were reviewed and approved by the Ethical Review Board at Xiangya Hospital of Central South University. The optn–/ – mice (Optntm1a(EUCOMM)Wtsi; MASV; EPD0116_2_G06) were generated in the European Conditional Mouse Mutagenesis Program (EUCOMM) [Citation35] and distributed by the University of Oulu, Finland. Animal maintaining, and genotyping of optn–/ – mice were following the protocol in the previous study [Citation15]. Male mice were used for animal experiments.
Packaging of lentivirus
Lentivirus was prepared as described previously [Citation15,Citation36]. Briefly, 293 T cells (ATCC, CRL-3216) in 10 cm plate were transfected with 10 μg lentiviral vectors and along with ∆8.91, VSVG vectors (pCDH or piLenti-siRNA-GFP: ∆ 8.91: VSVG = 5: 3: 2). After 24 h of culture, we collected and filtered supernatants, then concentrated with 1/4 V pre-cold PEG8000 concentration buffer (200 g/L PEG8000 (Solarbio life science, P8260); 146.1 g/L NaCl) at 4°C for 4 h, collected the pellet after centrifugation at 2500 × g for 20 min, and resuspended in 100 μL PBS (Solarbio life science, P1022). The lentiviral titer was about 2 × 10⁹ PFU/mL.
Isolation of the MSCs
MSCs were isolated from 2–3 weeks C57BL/6 mice as previously described [Citation37]. Briefly, mice were sacrificed by cervical dislocation, followed by immersing in 75% ethanol for 3 min and isolation of the femur, humerus, and tibia under sterile condition. Samples were soaked in α-MEM medium (Thermo Fisher Scientific, SH30265.01) supplemented with 2% FBS (CellMax, SA211.02), 100 U/mL penicillin, and 100 μg/mL streptomycin (Solarbio life science, P1400). Then, bone marrow was flushed out with α-MEM, and compact bones were dissected into 1–3 mm3 bone chips. Then bone chips were digested with 1 mg/mL collagenase II (Thermo Fisher Scientific, 17101015) in 3 mL α-MEM containing 10% FBS for 1–2 h at 37°C in a shaking incubator. After aspirating and discarding the digestion medium, bone chips were washed three times with α-MEM and seeded into a 25-cm2 flask in 6 mL culture medium (α-MEM supplemented with 10% FBS, 100 U/mL penicillin and 100 μg/mL streptomycin). After 3 d of cultivation at 37°C in a 5% CO2 incubator, the culture medium was changed to remove nonadherent cells, and the remaining cells were cultured for another 5 d in a culture medium. Adherent cells were collected by trypsin digestion (3 mL of 0.25% trypsin-EDTA [Thermo Fisher Scientific, 25–200-056]) and passaged at a split ratio of 1:3. Bone chips and cells were re-seeded together to allow MSCs to continue to migrate out from the chips for another 3 d. At passage 4, cells were harvested by trypsinization and analyzed by fluorescent-activated cell sorting (FACS). For FACS analysis, cells were washed twice with cold PBS and centrifuged at 300 g for 8 min at 4°C. 1 × 10⁶ cells were resuspend in 100 μL of cold PBS per sample and stained with PE-cy7-conjugated anti-Sca1 (BD, 558162; 1:100), APC-conjugated anti-CD11b (ebioscience, 17–0112-82; 1:100), FITC-conjugated anti-CD34 (BD, 560238; 1:100), anti-CD44 (Biolegend, 103005; 1:200), anti-CD45 (BD, 561088; 1:200), anti-CD90.2 (Biolegend, 105305; 1:200) respectively. One hundred thousand events per sample were collected (BD, FACS Canto II), and data were analyzed with FlowJo software (BD, Version 10.5.3). Cell gating was based on the comparison with isotype controls. Isolated MSCs were characterized as ATXN1/SCA1+; CD44+; THY1b/CD90.2+; ITGAM/CD11b–; PTPRC/CD45–; CD34–.
Cell culture and multilineage differentiation
MSCs of passage 3–10 were used in differentiation assays. MSCs were maintained in α-MEM supplemented with 10% FBS. All transfection experiments were performed using Lipofectamine 3000 (Thermo Fisher Scientific, L3000015), following the manufacturer’s instruction. For osteogenic differentiation, cells were seeded at a density of 1 × 10⁵ per well in a 48-well plate with osteogenic induction medium (α-MEM supplemented with 10% FBS, 100 nM dexamethasone, 10 mM beta-glycerol phosphate and 50 μM ascorbate-2-phosphate) (Cyagen Biosciences Inc., MUBMX-90021). The medium was changed every 3 d. After three days of differentiation, cells were washed with PBS, fixed in 4% PFA for 2 min, and then assayed with ALP Staining Kit (Yeasen, 40749ES60) following the manufacturer’s instructions. After 14 d of differentiation, cells were washed with PBS, fixed in 4% PFA for 2 min, and then stained with 2% ARS (Alizarin Red S) solution (Solarbio, G1450) at pH 4.2 for 10 min. For adipogenic differentiation, cells were seeded at a density of 1 × 10⁵ per well in a 48-well plate in the adipogenesis induction medium (Cyagen Biosciences Inc., GUXMX-90031) and incubated for 21 d. Oli Red O staining was performed by incubating with Oli Red O solution (cyagen) for 30 min. Images were taken by Leica microscopy (Leica, DMI6000B; Germany). After induction, cells were lysed, and proteins were extracted as previously described for western blot assays. At 0, 4, 7 days of osteogenic differentiation and 0, 7, 14 d of adipogenic differentiation, mRNA of each sample was collected as previously described for testing the expression of osteogenesis-related and adipogenesis-related genes, respectively.
Tail vein injection
Tail vein injection was performed to deliver the lentivirus (1 × 10⁸ PFU/mL) or MSCs (2 × 10⁶ cells) into mice. Briefly, mice were fixed on the mouse fixator and wiped the tail with alcohol to expose the tail vein. A needle connected to a 1-mL syringe with a hosepipe was inserted to the tail vein with a small angle. The needle was pumped back before injection, confirming insertion into the vein. We injected up to 100 μL liquid per mouse. MSCs injection/lentivirus injection was performed once a week for two months.
IBM (Intra-bone marrow cavity injection)
The intra-bone marrow cavity injection was carried out as previously described [Citation38]. Mice were anesthetized with 5 μL/g 5% pentobarbital sodium. The hair surrounding the knee joint were shaved, showing the proximal side of tibia drawn to anterior. A 26-gauge needle was inserted into the femur through the patellar tendon and then down into the bone marrow cavity. 1ˣ106/30 μL MSCs were transplanted into the bone marrow cavity through the bone hole with Hamilton syringe equipped with a 28-gauge needle.
Reagents and plasmids used in this study
Anti-OPTN (Santa Cruz Biotechnology, sc-166576); anti-LC3B (Sigma-Aldrich, L7543); anti-SQSTM1 (Abcam, ab56416); anti-BECN1 (Cell Signaling Technology, 3495S); anti-γH2AX (Abcam, ab26350); anti-FABP3 (Abcam, ab45966); anti-RUNX2 (Santa Cruz Biotechnology, sc-390351); anti-ADIPOQ (Cell Signaling Technology, 2789S); anti-HA (Invitrogen, 26183); anti-ACTB (TransGen Biotech, HC201); anti-ALP (Santa Cruz Biotechnology, sc-271431); anti-CALCOCO2 (Proteintech, 12229-1-AP); anti-TAX1BP1(Abcam, ab176572); anti-NBR1(Proteintech, 16004-1-AP); anti-CEBPA (Abcam, ab40764); anti-FABP4 (Abcam, Ab92501); anti-CDKN2B (Santa Cruz Biotechnology, sc-390515); anti-CDKN2A (Abcam, ab211542); anti-CDKN1A (Abcam, ab188224).
Plasmids used in this study were as follows: The Optn and OptnK193R were cloned into the pCDH plasmid (System biosciences, CD510B-1) with an HA tag at the C terminus. piLenti-Scramble siRNA-GFP (abm Inc., LV015-G), piLenti-Fabp3 siRNA1-GFP (abm Inc., 196,370,940,495), and piLenti- Fabp3 siRNA2-GFP (abm Inc., 196,370,940,595) were purchased from Applied Biological Materials (abm).
μCT analysis
Femora dissected from mice were fixed 48 h in 4% paraformaldehyde and analyzed by high-resolution µCT (VIVACT 80; SCANCO Medical AG, Switzerland) as described previously [Citation39]. The scanner was set to 55 kV and 145 µA at 11.4 µm resolution. The image reconstruction software (NRecon), data analysis software (CTAn v1.9) and three-dimensional model visualization software (µCT Vol v2.0) were applied to analyze the distal femoral metaphyseal trabecular bone and the parameters of the diaphyseal cortical bone. Cross-sectional images of the femora were established for three-dimensional histomorphometry analysis of the trabecular bone and two-dimensional morphometric analyses of the cortical bone. We defined a region of interest (ROI) as the area between 2% – 7% proximal to the growth plate in the distal femora. The BV/TV, Tb. Th, Tb. N, and Tb. Sp were analyzed. We chose from 20% – 30% as cortical bone ROI, by which we calculated the Ct. BV/TV, Ct. Th, Ps. Pm and Es. Pm.
Calcein double labeling
Mice received intraperitoneal injections of the first dose of calcein (0.5 mg/mouse, Sigma-Aldrich) 10 d before euthanasia. Second calcein injections were given 3 d before euthanasia. Femora were soaked in 70% ethanol after isolation and embedded in methyl methacrylate. 5 μm longitudinal sections were examined under fluorescent microscopy to evaluate MAR and BFR using Image-Pro Plus 6.0. MAR is the distance between the two labels divided by the time between labels. Mineralizing surface per bone surface (MS/BS) represents the percentage of bone surface exhibiting mineralizing activity (MS/BS = [dLS + sLS/2]/BS). BFR is the volume of mineralized bone formed per unit time and per unit bone surface. It is calculated by multiply the MAR by MS/BS (BFR = MAR * [MS/BS]). dLS, double labeling surface; sLS, single labeling surface; BS, bone surface.
Three-point bending test
Three-point bending test was performed using a material testing machine (Instron 3343; INSTRON, USA) following the instruction. Femora isolated from mice were fixed for 48 h in 4% PFA. In this test, a specimen with rectangular or flat cross-section is placed on two parallel supporting pins. The loading force was applied in the middle by means loading pin. Maximal bending loading (N) of each femur was calculated by Bluehill Universal software.
LC-MS analysis and data analysis
Proteins from the mouse bone tissue were extracted as described [Citation40]. Briefly, each femur was homogenized in liquid nitrogen, and dissolved in RIPA buffer: 50 mM Tris, pH 7.4, 150 mM NaCl, 1% Triton X-100 (Thermo Fisher Scientific, 9002–93-1), 1 mM EDTA, 1 mM Na3VO4, 25 mM beta-glycerophosphate (Sigma-Aldrich, G9422), 1% sodium deoxycholate (Sigma-Aldrich, 30970), 0.1% SDS (Sigma-Aldrich, L3771), 2 mM sodium pyrophosphate (Sigma-Aldrich, S6422), 1 mM leupeptin (Sigma-Aldrich, L2884), 200 mM AEBSF (Sigma-Aldrich, A8456), 30 μM aprotinin (Roche, 10236624001), 13 mM bestatin (Roche, 10874515001), 1.4 mM E64 (Sigma-Aldrich, E3132). Then, the mixture was incubated on ice for 30 min, and the crude extract was sonicated for 2 min and centrifuged at 12,000 × g for 20 min at 4°C. Digesting at 37°C for 16 h, samples were then desalted and concentrated using StageTip (Thermo Fisher Scientific, NC0028383), and the eluted peptides were loaded for mass spectrometric analysis. Liquid chromatography separation was performed on an Easy nLC 1000 system (Thermo Fisher Scientific, EASY-nLC 1000). The home-made column (15-cm in length, 75-µm inner diameter) was packed with ReproSil-Pur C18-AQ 3 μm resin (Dr. Maisch GmbH, Ammerbuch, Germany). For high mass accuracy data acquisition, a Q-Exactive mass spectrometer (Thermo Fisher Scientific, Germany) was used and equipped with a nanoelectrospray ion source (Thermo Fisher Scientific). Peptides were loaded onto the column and separated with a linear gradient of 7% – 35% buffer B (ACN with 0.1% formic acid) at a flow rate of 300 nL/min over 103 min. Data were acquired in the data-dependent “top12” mode, in which 12 most abundant precursor ions were selected with high resolution (70,000 @ m/z 200) from the full scan (300–1,500 m/z) for HCD fragmentation. Precursor ions with singly charged and charge information unassigned were excluded. Resolution for MS/MS spectra was set to 17,500 @ m/z 200, target value was 1E5 (AGC control enabled) and isolation window was set to 2.0 m/z. The normalized collision energy was 30%. All mass spectrometric data were analyzed using MaxQuant 1.5.2.8 [Citation41] against the UniProt mouse database (201607, 59550 proteins). Carbamidomethyl cysteine was searched as a fixed modification and oxidized methionine, and protein N-terminal acetylation was searched as variable modifications. Enzyme specificity was set to trypsin/P. Two missing cleavage site was allowed. For MS and MS/MS, the tolerances of the main search for peptides were set at 7 ppm and 20 ppm, respectively. The peptide and protein false discovery rate (FDR) was fixed at a significant level not greater than 0.01. Protein raw intensity and label-free quantitation (LFQ) values were calculated using MaxQuant search engine, as previously described [Citation42]. Top 13 differentially high expressed proteins were picked out and drawing by using Morpheus (Online tools).
CFSE proliferation assay
CFSE proliferation assays were performed following the instruction of CellTrace™ CFSE Cell Proliferation Kit (Thermo Fisher Scientific, C34554). Briefly, MSCs were collected and stained in cell trace CFSE solution for 20 min at 37°C, then distribute into culture plates. Two days after culturing, cells were harvested and analyzed using BD FACS Canto II. Data were analyzed by FlowJo V10.5.3 software.
ROS assay
MSCs were transfected with genes of interest, and ROS production was detected using the total ROS detection kit (ENZO, ENZ-51011) as described before [Citation15]. Briefly, after transfection, cells were detached, and cell pellets were resuspended in 500 μL ROS Detection Solution, followed by staining for 30 min at 37°C in the dark. Then, cells were analyzed using BD FACS Canto II. Data were analyzed using FlowJo V10.5.3 software.
qRT-PCR
Total RNA was extracted from mouse bone and MSCs using the standard Trizol method. Synthesis of cDNA was performed using GoScript™ Reverse Transcriptase according to the manufacturer’s instruction (Promega Corporation, A5001). Quantitative PCR amplification of indicated genes was performed using GoTaq® qPCR Master Mix (Promega Corporation, A6001) on an FTC-3000 real-time PCR machine (Funglyn biotech; China) with GAPDH as a normalization control. After initial denaturation (2 min at 95°C), amplification was performed with 40 cycles of 15 s at 95°C and 60 s at 60°C. Sequences of primers are listed below: m-Atg7: F5′- AGATTTGAGGGAGGAGGACTTT −3′, R5′- CAGCAGAGTCACCATTGTAGT −3′; m-Optn: F5′- ACAGGTGGCTACAGGTATCC −3′, R5′- TGGGTGTAGGGCAGTTCTTC −3′; m-Sqstm1: F5′- GGGAACACAGCAAGCTCATC −3′, R5′- TGTCAACCTCAATGCCTAGAG −3′; m-Lc3b: F5′- AGCAGCACCCCACCAAGAT −3′, R5′- CACCATGCTGTGCCCATTC −3′; m-Becn1: F5′- CTGGACACTCAGCTCAATGT −3′, R5′- ACTATACTCCCGCTGGTACTG −3′; m-Runx2: F5′- GACTGTGGTTACCGTCATGGC −3′, R5′- ACTTGGTTTTTCATAACAGCGGA −3′; m- Bglap: F5′- CTTGGTGCACACCTAGCAGA −3′, R5′- CTCCCTCATGTGTTGTCCCT −3′; m-Alpl: F5′- GGACAGGACACACACACACA −3′, R5′- CAAACAGGAGAGCCACTTCA −3′; m-Col1a1: F5′- GCTCCTCTTAGGGGCCACT −3′, R5′- CCACGTCTCACCATTGGGG −3′; m-Sp7: F5′- AGCGACCACTTGAGCAAACAT −3′, R5′- GCGGCTGATTGG CTTCTTCT −3′; m-Fabp4: F5′- AACACCGAGATTTCCTT −3′, R5′- ACACATTCCACCACCAG −3′; m-Adipoq: F5′- CCCAAGGGAACTTGTGCAGGTTGGATG −3′, R5′- GTTGGTATCATGGTAGAGAAGAAAGCC −3′; m-Pparg: F5′- GGAAAGACAACGGACAAATCAC −3′, R5′- TACGGATCGAAACTGGCAC −3′; m-Cebpa: F5′- CAAAGCCAAGAAGTCGGTGGACAA −3′, R5′- TCATTGTGACTGGTCAACTCCAGC −3′; m-Cdkn2b: F5′- TCTTGCATCTCCACCAGCTG −3′, R5′- CTCCAGGTTTCCCATTTAGC −3′; m-Cdkn2a: F5′- CGGTCGTACCCCGATTCAG −3′, R5′- GCACCGTAGTTGAGCAGAAGAG −3′; m-Cdkn1a: F5′- CCAGGCCAAGATGGTGTCTT −3′, R5′- TGAGAAAGGATCAGCCATTGC −3′.
Enzyme-linked immunosorbent assay (ELISA)
The serum was collected from all animal groups. Serum BGLAP concentration was determined using the Mouse BGLAP ELISA Kit (Elabscience, E-EL-M0864) according to the manufacturer’s instruction. Measurement of absorption was performed using Varioskan LUX multimode microplate reader (Thermo Fisher Scientific; USA).
SA-GLB1 staining
The SA-GLB1 activity was detected in MSCs using senescence beta-galactosidase staining kit (Beyotime Biotechnology, c0602) following the manufacturer’s instructions. The MSCs at passage 3 were seeded in 6-well plate at a density of 4 × 10⁵ cells per well, followed by SA-GLB1 staining when cells adhered to the plate after overnight culturing. Quantifications of SA-GLB1 were analyzed by measuring integrated optical density (IOD) as described previously with minor modification [Citation43]. We first select the blue-colored staining region as the ROI on Image-Pro, calculate the IOD, and normalized to the IOD of the entire image (the IOD is the same if the image size is the same). The calculated IOD indicates the ratio of the ROI area to the entire picture.
Histochemistry and immunohistochemistry staining
After experimental treatment, mice were sacrificed for HE staining and BGLAP staining. Femora were quickly removed and fixed in 4% paraformaldehyde for 48 h at 4°C, decalcified in 14% ethylene diamine tetra acetic acid (EDTA, pH 7.4) for 7 d. Immunohistochemistry was performed following IHC-paraffin protocol (Abcam). Tissues were dehydrated, embedded in paraffin, sectioned into 4.0 μm, deparaffinized, and rehydrated, followed by antigen retrieving, immunohistochemically staining, dehydrating, and stabilizing with mounting medium and viewing the staining under the microscope. Briefly, bone sections were incubated at 4°C overnight with anti-BGLAP (Bioss Antibodies, bs-4917 R; 1:400) antibody. After a rinse in 10.0 mM PBS three times (5 min each), sections were applied with secondary antibodies anti-rabbit IgG horseradish peroxidase (HRP; (Sigma-Aldrich, AP307P; 1:200) at room temperature for 2 h, followed by rinses (5 min each) in 10 mM PBS three times. The peroxidase reaction was performed using 3, 3ʹ-diaminobenzidine (DAB; Sigma-Aldrich, D3939) for 2–8 min, and then covered with neutral balsam for microscopic detection. Images were acquired with a microscope (Olympus, CX31; Japan). For HE and BGLAP staining, numbers of adipocytes per square millimeter of bone marrow area (N/mm2) and osteoclasts per adjacent bone surface (N/mm) were calculated with Image-Pro Plus V6.0.0.
Immunoblotting analysis
MSCs or the bone tissue extracts were prepared in the RIPA buffer with protease inhibitors (50.0 mM Tris-Cl, 150.0 mM NaCl, 0.1% SDS, 1.0 mM EDTA, 1.0% [v:v] Triton X-100, 1.0% sodium deoxycholate, 2.0 mM sodium pyrophosphate, 25.0 mM beta-glycerophosphate, 1.0 mM Na3VO4, 0.5 ug/mL leupeptin, pH 7.4) for 30 min and then centrifuged at 20,000 × g at 4°C for 15 min to remove cell debris. Supernatants were separated by SDS-PAGE and blotted on polyvinylidene fluoride membranes (Millipore, IPFL00010). Membranes were blocked with 5% nonfat milk (Yili, skimmed milk powder) in TBST (Solarbio life science, T1081) for 1 h at room temperature, then incubated with primary antibodies at 4°C overnight, followed by incubation with HRP-conjugated secondary antibodies at 37°C for 1 h. Protein bands were visualized using enhanced chemiluminescence reagent (Thermo Fisher Scientific, 32,106) and imaged by ChemiDoc XRS Plus luminescent image analyzer (Bio-Rad Laboratories, USA).
Co-immunoprecipitation analysis
The bone tissue was harvested and homogenized in liquid nitrogen, followed by dissolving in immunoprecipitation (IP) buffer (20 mM Tris-Cl, 150 mM NaCl, 1 mM EDTA, 1 mM EGTA, 1% [v:v] Triton X-100, 2.5 mM sodium pyrophosphate, 1 mM beta-glycerophosphate, 1 mM Na3VO4, and protease inhibitor cocktail [Roche, 11873580001], pH 7.5) by Bio-ruptor UCD-200 (Diagenode Inc., USA) and then centrifuged at 14,000 × g at 4°C for 15 min to remove cell debris. Expressing indicated proteins in the lysates was checked by immunoblotting analysis using relevant antibodies to normalize total amounts of inputs. After normalization, supernatants were incubated with appropriate antibody and equal amounts of protein G beads (Millipore, 16–266) overnight at 4°C. The protein G beads with the bound antibodies and interacting proteins were pelleted and washed three times with IP buffer before boiling in 1 × SDS-PAGE buffer. The boiled samples were then resolved in SDS-PAGE and subject to immunoblotting analysis with indicated antibodies.
Statistical analysis
Data were analyzed using Prism 7 (GraphPad Software) and presented as mean ± sd. An unpaired t-test was applied while comparing two groups with one variance. Shapiro-Wilk normality test was also performed to check out the distribution style. Multiple comparisons were carried out using ANOVA (analysis of variance), with one-way ANOVA test employed when only one variance was studied, and two-way ANOVA employed when more than one variance was present. Dunnett’s multiple comparison tests were further carried out for post hoc analysis to address whether there is a statistically significant difference between the two groups. In all experiments, P-value <0.05 was statistically significant, **** p < 0.0001, ***p < 0.001, ** p < 0.01, * p < 0.05, ns means no significance.
Supplemental Material
Download Zip (221.8 MB)Acknowledgments
We thank Hong-Bin Lu, and Jian-Zhong Hu from Central South University for providing experimental platforms. We thank Li-Hong Zhong from Shenzhen University for sample preparation and formatting-related writing assistance.
Disclosure statement
No potential competing interest was reported by the authors.
Supplementary material
Supplemental data for this article can be accessed here.
Additional information
Funding
Related Research Data
References
- Hansen M, Rubinsztein DC, Walker DW. Autophagy as a promoter of longevity: insights from model organisms. Nat Rev Mol Cell Biol. 2018 Sep;19(9):579–593.
- Sacitharan PK. Ageing and osteoarthritis. Subcell Biochem. 2019;91:123–159.
- Chen K, Yang YH, Jiang SD, et al. Decreased activity of osteocyte autophagy with aging may contribute to the bone loss in senile population. Histochem Cell Biol. 2014 Sep;142(3):285–295.
- Ma Y, Qi M, An Y, et al. Autophagy controls mesenchymal stem cell properties and senescence during bone aging. Aging Cell. 2018 Feb;17(1):e12709.
- Luo D, Ren H, Li T, et al. Rapamycin reduces severity of senile osteoporosis by activating osteocyte autophagy. Osteoporos Int. 2016 Mar;27(3):1093–1101.
- Onal M, Piemontese M, Xiong J, et al. Suppression of autophagy in osteocytes mimics skeletal aging. J Biol Chem. 2013 Jun 14;288(24):17432–17440.
- DeSelm CJ, Miller BC, Zou W, et al. Autophagy proteins regulate the secretory component of osteoclastic bone resorption. Dev Cell. 2011 Nov 15;21(5):966–974.
- Owen HC, Vanhees I, Gunst J, et al. Critical illness-induced bone loss is related to deficient autophagy and histone hypomethylation. Intensive Care Med Exp. 2015 Dec;3(1):52.
- Nollet M, Santucci-Darmanin S, Breuil V, et al. Autophagy in osteoblasts is involved in mineralization and bone homeostasis. Autophagy. 2014;10(11):1965–1977.
- Cinque L, Forrester A, Bartolomeo R, et al. FGF signalling regulates bone growth through autophagy. Nature. 2015 Dec 10;528(7581):272–275.
- Arai A, Kim S, Goldshteyn V, et al. Beclin1 modulates bone homeostasis by regulating osteoclast and chondrocyte differentiation. J Bone Miner Res. 2019 Sep;34(9):1753-1766.
- Yin X, Zhou C, Li J, et al. Autophagy in bone homeostasis and the onset of osteoporosis. Bone Res. 2019;7(28).doi: .
- Whitehouse CA, Waters S, Marchbank K, et al. Neighbor of brca1 gene (Nbr1) functions as a negative regulator of postnatal osteoblastic bone formation and p38 MAPK activity. Proc Natl Acad Sci U S A. 2010 Jul 20;107(29):12913–12918.
- Wild P, Farhan H, McEwan DG, et al. Phosphorylation of the autophagy receptor optineurin restricts salmonella growth. Science. 2011 Jul 8;333(6039):228–233.
- Liu Z, Chen P, Gao H, et al. Ubiquitylation of autophagy receptor Optineurin by HACE1 activates selective autophagy for tumor suppression. Cancer Cell. 2014 Jul 14;26(1):106–120.
- Slowicka K, Vereecke L, van Loo G. Cellular functions of optineurin in health and disease. Trends Immunol. 2016 Sep;37(9):621–633.
- Gatica D, Lahiri V, Klionsky DJ. Cargo recognition and degradation by selective autophagy. Nat Cell Biol. 2018 Mar;20(3):233–242.
- Albagha OM, Visconti MR, Alonso N, et al. Genome-wide association study identifies variants at CSF1, OPTN and TNFRSF11A as genetic risk factors for Paget’s disease of bone. Nat Genet. 2010 Jun;42(6):520–524.
- Albagha OM, Wani SE, Visconti MR, et al. Genome-wide association identifies three new susceptibility loci for Paget’s disease of bone. Nat Genet. 2011 May 29;43(7):685–689.
- Ralston SH, Langston AL, Reid IR. Pathogenesis and management of Paget’s disease of bone. Lancet. 2008 Jul 12;372(9633):155–163.
- Kurihara N, Hiruma Y, Yamana K, et al. Contributions of the measles virus nucleocapsid gene and the SQSTM1/p62(P392L) mutation to Paget’s disease. Cell Metab. 2011 Jan 5;13(1):23–34.
- Obaid R, Wani SE, Azfer A, et al. Optineurin negatively regulates osteoclast differentiation by modulating NF-kappaB and interferon signaling: implications for paget’s disease. Cell Rep. 2015 Nov 10;13(6):1096–1102.
- Sethe S, Scutt A, Stolzing A. Aging of mesenchymal stem cells. Ageing Res Rev. 2006 Feb; 5(1):91–116.
- Moerman EJ, Teng K, Lipschitz DA, et al. Aging activates adipogenic and suppresses osteogenic programs in mesenchymal marrow stroma/stem cells: the role of PPAR-gamma2 transcription factor and TGF-beta/BMP signaling pathways. Aging Cell. 2004 Dec; 3(6):379–389.
- Islam A, Kagawa Y, Sharifi K, et al. Fatty acid binding protein 3 Is involved in n-3 and n-6 PUFA transport in mouse trophoblasts. J Nutr. 2014 Oct;144(10):1509–1516.
- Sahani MH, Itakura E, Mizushima N. Expression of the autophagy substrate SQSTM1/p62 is restored during prolonged starvation depending on transcriptional upregulation and autophagy-derived amino acids. Autophagy. 2014 Mar;10(3):431–441.
- Klionsky DJ, Abdelmohsen K, Abe A, et al. Guidelines for the use and interpretation of assays for monitoring autophagy (3rd edition). Autophagy. 2016;12(1):1–222.
- Kongara S, Karantza V. The interplay between autophagy and ROS in tumorigenesis. Front Oncol. 2012;2:171.
- Scherz-Shouval R, Elazar Z. ROS, mitochondria and the regulation of autophagy. Trends Cell Biol. 2007 Sep;17(9):422–427.
- Starling S. A role for autophagy in bone biology. Nat Rev Endocrinol. 2019 Aug;15(8):438-439.
- Wang T, He H, Liu S, et al. Autophagy: A promising target for age-related osteoporosis. Curr Drug Targets. 2019;20(3):354–365.
- Shapiro IM, Layfield R, Lotz M, et al. Boning up on autophagy: the role of autophagy in skeletal biology. Autophagy. 2014 Jan;10(1):7–19.
- Pantovic A, Krstic A, Janjetovic K, et al. Coordinated time-dependent modulation of AMPK/Akt/mTOR signaling and autophagy controls osteogenic differentiation of human mesenchymal stem cells. Bone. 2013 Jan;52(1):524–531.
- Wong SW, Huang BW, Hu X, et al. Global deletion of Optineurin results in altered type I IFN signaling and abnormal bone remodeling in a model of Paget’s disease. Cell Death Differ. 2020 Jan;27(1):71–84.
- Skarnes WC, Rosen B, West AP, et al. A conditional knockout resource for the genome-wide study of mouse gene function. Nature. 2011 Jun 15;474(7351):337–342.
- Liu Z, Li H, Hong C, et al. ALS-Associated E478G mutation in human OPTN (Optineurin) promotes inflammation and induces neuronal cell death. Front Immunol. 2018;9:2647.
- Zhu H, Guo ZK, Jiang XX, et al. A protocol for isolation and culture of mesenchymal stem cells from mouse compact bone. Nat Protoc. 2010 Mar; 5(3):550–560.
- Kushida T, Inaba M, Hisha H, et al. Intra-bone marrow injection of allogeneic bone marrow cells: a powerful new strategy for treatment of intractable autoimmune diseases in MRL/lpr mice. Blood. 2001 May 15;97(10):3292–3299.
- Xie H, Cui Z, Wang L, et al. PDGF-BB secreted by preosteoclasts induces angiogenesis during coupling with osteogenesis. Nat Med. 2014 Nov;20(11):1270–1278.
- Wisniewski JR, Nagaraj N, Zougman A, et al. Brain phosphoproteome obtained by a FASP-based method reveals plasma membrane protein topology. J Proteome Res. 2010 Jun 4;9(6):3280–3289.
- Cox J, Mann M. MaxQuant enables high peptide identification rates, individualized p.p.b.-range mass accuracies and proteome-wide protein quantification. Nat Biotechnol. 2008 Dec;26(12):1367–1372.
- Cox J, Hein MY, Luber CA, et al. Accurate proteome-wide label-free quantification by delayed normalization and maximal peptide ratio extraction, termed MaxLFQ. Mol Cell Proteomics. 2014 Sep;13(9):2513–2526.
- Chen X, Wang L, Hou J, et al. Study on the dynamic biological characteristics of human bone marrow mesenchymal stem cell senescence. Stem Cells Int. 2019;2019:9271595.