
ABSTRACT
Macroautophagy/autophagy (hereafter autophagy), the process of mass degradation of unnecessary elements within the cell, is often dysregulated in many diseases such as cancer, atherosclerosis, and neurodegenerative diseases. Hence, autophagy modulating agents have a great potential to be therapeutic agents for the autophagy-related diseases. Here we report that an anti-depressant drug sertraline (Sert) is an autophagy-inducing agent. Mechanistically, Sert potentially binds to and antagonizes the mitochondrial VDAC1 (voltage dependent anion channel 1), resulting in reduced cellular ATP (adenosine triphosphate) level, activation of AMP-activated protein kinase (AMPK) and inhibition of its downstream, MTOR (mechanistic target of rapamycin kinase)-RPS6KB1 (ribosomal protein S6 kinase B1) signaling pathway. Cells lacking VDAC1 expression completely abrogate the modulatory effect of Sert on AMPK-MTOR pathway and autophagy-inducing activity. We further show that Sert suppresses tauopathy by promoting the autophagic degradation of MAPT (microtubule associated protein tau) protein via inducing autophagy. Our study demonstrates the potential of Sert as a novel small molecule autophagy-inducing agent and provides a new drug candidate to treat autophagy related diseases by targeting VDAC1.
Abbreviations: AMP: adenosine monophosphate; AMPK: AMP-activated protein kinase; ATP: adenosine triphosphate; Baf: bafilomycin A1; BiFC: biomolecular fluorescence complementation; CAMKK2/CAMKKB: calcium/calmodulin dependent protein kinase kinase 2; CC: compound C; DARTS: drug affinity responsive target stability; HUVECs: human umbilical vein endothelial cells; Inda: indatraline; STK11/LKB1: serine/threonine kinase 11; MAPT: microtubule associated protein tau; MAP1LC3/LC3: microtubule associated protein 1 light chain 3; 3-MA: 3-methyladenine; MEFs: mouse embryonic fibroblasts; MTOR: mechanistic target of rapamycin kinase; PI3K: phosphoinositide 3-kinase; Rapa: rapamycin; Sert: sertraline; RPS6KB1: ribosomal protein S6 kinase B1; SQSTM1/p62: sequestosome 1; SLC6A4/SERT1: solute carrier family 6 member 4; TFEB: transcription factor EB; VDAC1: voltage dependent anion channel 1; WT: wild-type; WM: wortmannin.
Introduction
Autophagy is a highly conserved intracellular process that clears the misfolded or aged proteins, and recycles damaged organelles in cells. It plays a pivotal role for maintaining cellular homeostasis as it modulates catabolic metabolism, alleviates reactive oxygen species (ROS) generation by recycling damaged or long-lived mitochondria, and protects cells against exogenous or endogenous stimuli such as nutrient deprivation, oxygen depletion, pathogens invasion including bacteria and viruses, and ultraviolet exposure [Citation1]. Consequently, dysregulation of autophagy has been related with various diseases such as neurodegenerative diseases, restenosis, leukemia, cancer and aging [Citation1]. Therefore, the development of autophagy regulating agents became an important strategy to treat the diseases [Citation2].
Alzheimer disease is one of the neurodegenerative disorders, which involves inflammation and defective autophagy [Citation3,Citation4]. It is characterized by an irreversible and massive loss of cognitive abilities and formation of morbid plaque complex, composed of MAPT (microtubule associated protein tau) aggregates and amyloid β in the neuronal cortex. Autophagy inducers have been suggested to promote the degradation of noxious proteins in the AD brain. Therefore, there has been high demand for the development of potent autophagy inducers that can be used together with other AD treatments.
In the previous study, we conducted a phenotypic screen for autophagy-inducing small molecule drugs from the Johns Hopkins Drug Library consisting of mostly FDA-approved drugs [Citation5]. From the screening, we found that several anti-depressant drugs, including Sert and indatraline (Inda), have potential autophagy-inducing activity [Citation6]. Sert is a serotonin-selective reuptake inhibitor that has been used as an antidepressant approved for medical use with appropriate biocompatibility in the United States in 1991 [Citation7]. Herein, we explored molecular mechanism of the autophagy-inducing activity of Sert and its potential in clinical applications for autophagy-related diseases. We here report that a mitochondrial outer membrane protein, VDAC1 [Citation8] is a biologically relevant target of Sert responsible for its autophagy-inducing activity. We demonstrate that Sert antagonizes VDAC1 protein, modulates the downstream effector by down-regulating cellular ATP level, AMPK-MTOR-RPS6KB1 signaling axis, resulting in autophagy induction. We further show that Sert suppresses tauopathy by inducing autophagy, suggesting its potential to be applied as an anti-neurodegenerative drug. This study reports for the first time that Sert could be a useful chemical probe to investigate the relationship between VDAC1 and autophagy and have a potential to be applied as a new drug candidate to treat autophagy related disorders including a neurodegenerative disease.
Results
Sert induces autophagic flux
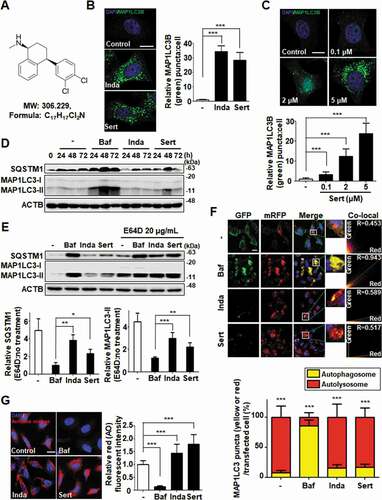
Sert ()) is a clinical drug as an antidepressant by inhibiting serotonin transporter. Previously, we discovered that Sert induced a crucial autophagy marker, MAP1LC3/LC3 (microtubule associated protein 1 light chain 3)-I conversion to MAP1LC3-II [Citation6–8]. MAP1LC3 conversion occurs during autophagy induction or late-stage autophagic flux inhibition such as fusion of autophagosome and lysosome or inhibition of lysosomal degradation [Citation9]. In this study, we explored the detail mechanism of Sert on autophagic flux. First, autophagy induction by Sert was examined by counting GFP-MAP1LC3 puncta. Notably, Sert-treated cells exhibited significant MAP1LC3 induction dose-dependently in cytoplasm, similar to Inda treatment, a known autophagy inducer and antidepressant from nonselective monoamine transporter inhibitor () and (C)). Autophagy induction by Sert was further investigated by staining autophagic vacuoles using monodansylcadaverine [Citation10], a fluorescent dye that is incorporated into autophagic vacuoles (Fig. S1). In addition, a series of available methods were used to detect kinetics of autophagy and to monitor autophagic flux. First, MAP1LC3-II and SQSTM1/p62 (sequestosome 1) kinetics were measured using immunoblotting in a time-dependent manner. Both MAP1LC3-II and SQSTM1 are essential to activate autophagy in terms of autophagosome formation and the translocation of ubiquitinated proteins to autophagic vesicles, respectively [Citation11,Citation12]. Interestingly, Sert treatment rapidly increased the levels of MAP1LC3-II and SQSTM1 in 24 h, with a peak at 48 h and then decreased at 72 h ()). The V-ATPase inhibitor bafilomycin A1 (Baf) highly increased the levels of MAP1LC3-II and SQSTM1 in 24 h, and the high level of the two proteins was maintained until 72 h post treatment. SQSTM1, a cargo receptor protein, in general is itself degraded upon the delivery of ubiquitinated proteins to autophagosomes [Citation13]. Conversely, SQSTM1 can be accumulated when autophagy is inhibited, although in some cases the increase in SQSTM1 level is observed when autophagy is activated [Citation11]. In addition, the increase in MAP1LC3-II can be observed either during the induction of autophagic flux or when autophagy is inhibited, we sought to test whether Sert induces or inhibits autophagy by observing the levels of MAP1LC3-II and SQSTM1 in the presence or absence of the lysosomal protease inhibitor E64D [Citation14]. Our results showed that co-treatment of cells with E64D and Sert further increased the levels of these proteins compared to the Sert treatment alone. A similar result was observed in Inda treatment, while no further increase in SQSTM1 or MAP1LC3-II was observed in Baf when E64D was co-treated ()). These results indicated the dynamic degradation of SQSTM1 by Sert and hence the induction of autophagic flux. Based on this data, we believe that the increase in SQSTM1 by Sert is likely to occur at the transcription level or at the level of translational control, rather than due to the SQSTM1 protein accumulation as a consequence of autophagic inhibition. The increase in SQSTM1 expression by Sert seemed to be autophagy-independent manner, but could positively contribute to the Sert-induced autophagic flux. For further validation, a double-tagged MAP1LC3 (mRFP-GFP) plasmid was used to visualize transition from neutral autophagosomes to acidic autolysosomes based on the different pH stabilities between mRFP-MAP1LC3 and GFP-MAP1LC3. The GFP fluorescence is unstable in acidic compartments, whereas that of mRFP is relatively stable even within acidic environment of lysosomes [Citation15]. Accordingly, autophagic flux can be monitored as a decrease in colocalization of green with red fluorescence (yellow; autophagosomes) and increase in red fluorescence (autolysosomes). Notably, Sert treatment resulted in increase of red fluorescence (R value = 0.517), whereas Baf treatment accumulated yellow fluorescence in HUVECs (human umbilical vein endothelial cells) (R value = 0.943) ()). Additionally, we examined lysosome activity using acridine orange staining, a well-known assay to examine the function and integrity of lysosome [Citation16]. Sert treatment significantly increased acridine orange intensity, indicating that Sert induces autophagic flux by activating lysosome activity ()). These results further validated that Sert activates autophagic flux.
Figure 1. Sert induces autophagic flux in HUVECs. (A) Chemical structure of Sert. (B) MAP1LC3B-positive autophagosomes (green) were increased by both Sert (5 μM) and Inda (5 μM) in HUVECs. The cells were treated with Sert or Inda for 24 h in HUVECs. And then, the cells were harvested, followed by treatment with MAP1LC3B (green) antibody for 1 h. Nuclei were stained with DAPI. MAP1LC3B puncta was monitored by confocal microscopy. Scale bar: 5 μm. Graph of fluorescence is shown in (B). Values are means ± SEM; n = 20 cells. ***p < 0.001. (C) The MAP1LC3B immunofluorescence (green) also exhibited an increased number of cells containing vacuoles in the cytoplasm after Sert treatment as dose-dependent manner. The cells were treated with Sert (5 μM) or Inda (5 μM) for 24 h in HUVECs. And then, the cells were harvested, followed by treatment with MAP1LC3B (green) antibody for 1 h. Nuclei were stained with DAPI. MAP1LC3B puncta was monitored by confocal microscopy. Scale bar: 5 μm. Graph of fluorescence is shown in (C). Values are means ± SEM; n = 20 cells. ***p < 0.001. (D) Western blot analysis of the levels of MAP1LC3-II and SQSTM1 in cells after Baf (10 nM) or Inda (5 μM) or Sert (5 μM) treatment for 24, 48, and 72 h. (E) The effect of E64D on the levels of SQSTM1 and MAP1LC3-II in cells after treatment with autophagy-regulating compounds. Cells were treated with E64D (20 μg/mL) for 1 h pretreatment, and then Baf (10 nM), Inda (5 μM), or Sert (5 μM) treated for 24 h prior to harvesting for western blot analysis of SQSTM1, MAP1LC3 and ACTB. The levels of SQSTM1 and MAP1LC3-II was quantitated from the western blot data and normalized with the ACTB level. The E64D effect on SQSTM1 and MAP1LC3-II levels was expressed as the fold change after calculating the ratio of SQSTM1 or MAP1LC3-II level in E64D treated cells to untreated cells (E64D:no treatment). Graph of fluorescence is shown in (E). Values represent means ± SEM of fold-changes; n = 3, **p < 0.01, ***p < 0.001 between two indicated groups. (F) Autophagic flux evaluation in HUVEC cells using mCherry-GFP MAP1LC3 in the presence of each compound. Representative images of merged channels are shown; scale bar: 10 μm. Pearson coefficient for the colocalization analysis is shown. Quantification of data is shown in (F). Values are means ± SEM; n > 10 cells, ***p < 0.001. (G) Acridine orange (red) staining was used to visualize lysosomal uptake. The samples were treated with Sert (5 μM), Inda (5 μM), and Baf (10 nM) for 24 h. Cells were treated with acridine orange (2 μg/mL) for 20 min before fixation. After fixation, samples were examined by confocal microscopy. Scale bar: 10 μm. Quantification of data is shown in (G). Values are means ± SEM; n > 20 cells. ***p < 0.001
Sert activates canonical autophagy by modulating AMPK-MTOR-RPS6KB1 signaling
To characterize which signaling pathway is involved in Sert-induced autophagy, the effects on canonical pathway were examined [Citation17]. AMPK-MTOR canonical pathway is involved in response to insufficient cellular energy generation, leading to autophagy [Citation18]. We therefore examined the effect of Sert on the cellular ATP level in HUVECs. The cellular ATP level was decreased in a time-dependent manner at Sert treatment between 0–360 min ()). An increase in the cellular AMP (adenosine monophosphate):ATP ratio in turn activates AMPK pathway [Citation19]. Sert induced AMPK (T172 phosphorylation) activation leading to inhibition of MTOR (S2448)-RPS6KB1 (T389) signaling that was distinct from the effect caused by rapamycin (Rapa) treatment, which inhibited MTOR-RPS6KB1 signaling pathway by directly binding to MTOR without affecting AMPK ()). Another canonical substrate of AMPK is ACACA/ACC1 (acetyl-CoA carboxylase alpha), which is inactivated upon phosphorylation at S79 by AMPK. Notably, Sert, but not Rapa, treatment increased S79 phosphorylation of ACACA, indicating that Sert activates AMPK activity ()). Furthermore, pretreatment of cells with Compound C (CC), an AMPK inhibitor, significantly abrogated Sert-induced increase in MAP1LC3 puncta, whereas it did not affect Rapa-induced increase in MAP1LC3 puncta, implying that autophagy inducing activity of Sert is dependent on AMPK activity ()).
Figure 2. Sert induces autophagy by affecting the AMPK-MTOR-RPS6KB1 signaling axis. (A) ATP levels in HUVECs were measured using an ATPlite luminescence assay system. ATP levels decreased following treatment with Sert (5 μM) for 6 h. Values are means ± SEM; n = 4. **p < 0.01, ***p < 0.001. (B) Western blot analysis of the levels of p-AMPK, AMPK, p-MTOR, MTOR, p-RPS6KB1, and RPS6KB1 in cells after each compound treatment for 30 min. Quantification of data is shown in (B) from three independent experiments. Values are means ± SEM. *p < 0.05, **p < 0.01, ***p < 0.001. (C) Western blot analysis of the levels of p-ACACA, ACACA, and ACTB in cells after each compound treatment for 30 min. (D) The cells were co-treated with CC (10 μM) 1 h prior to Sert (5 μM) or Rapa (10 μM). And then, the cells were harvested, followed by treatment with MAP1LC3B (green) antibody for 1 h. Nuclei were stained with DAPI. Scale bar: 10 μm. Quantification of data is shown in (D). Values are means ± SEM; n > 20 cells. ***p < 0.001; scale bar: 10 μm
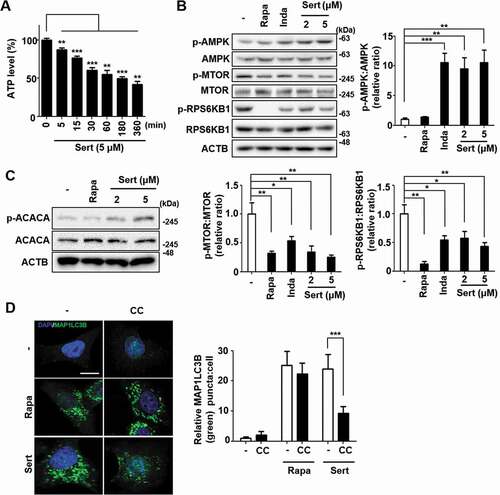
The T172 phosphorylation of AMPK can be triggered by two independent upstream kinases including STK11/LKB1 (Serine/threonine kinase 11) and CAMKK2/CAMKKB (calcium/calmodulin-dependent protein kinase kinase 2) [Citation8]. STK11 is one of the AMPK kinases, which phosphorylates AMPK after AMP binding to the γ subunit of AMPK when the cellular AMP:ATP ratios are high, whereas CAMKK2 is activated by augmented cellular calcium efflux. We observed that STK11 phosphorylation was increased by Sert within 15 min of treatment and then decreased upon the longer exposure of Sert ()). The biphasic or multiphasic phosphorylation of STK11-AMPK has been observed when activated with different stimuli [Citation8,Citation20], hence indicating that STK11 activation was involved in AMPK activation by Sert. Next, to investigate the involvement of CAMKK2 in the Sert activation of AMPK, we used CAMKK2 activator ionomycin and its inhibitor STO-609. As expected, both ionomycin and Sert increased ACACA phosphorylation. While STO-609 inhibited the ionomycin-induced phosphorylation of ACACA, it did not inhibit the Sert-induced ACACA phosphorylation, suggesting that Sert-induced AMPK activation was not mediated by CAMKK2 activation ()). These results indicated that Sert activated STK11-AMPK- ACACA pathway. Activation of AMPK can inhibit MTOR via phosphorylating two independent substrate proteins, including TSC (activating phosphorylation) and RPTOR (regulatory associated protein of MTOR complex 1) (inhibitory phosphorylation) [Citation21], hence explaining the inhibitory effect of Sert on MTOR. To investigate the possible involvement of other MTOR upstream signaling in Sert-induced autophagy, effects of known autophagy regulating compounds including 3-MA (PI3K inhibitor) [Citation22], wortmannin (PI3K-AKT inhibitor) [Citation23], and PD98059 (MAP2K/MEK-MAPK inhibitor) [Citation24] on Sert-induced MAP1LC3 were examined. The preparation of the compounds was identical to that described in the previous studies [Citation10,Citation25] and the inhibitory effects on their corresponding targets were verified (Fig. S2). Both PI3K (phosphoinositide 3-kinase)-AKT and MAP2K/MEK-MAPK pathways act as upstream activators of MTOR by phosphorylating and inhibiting TSC complex, a negative regulator of MTOR [Citation26,Citation27]. Sert-induced EGFP-MAP1LC3 positive puncta remained high in the cells regardless of the presence of the inhibitors of PI3K-AKT or MAP2K/MEK-MAPK ()), suggesting that Sert induced autophagy does not involve the PI3K-AKT and MAP2K/MEK-MAPK signaling regulation.
Figure 3. Sert induces STK11-mediated autophagy without TFEB translocation. (A) The effect of Sert on STK11 pathway. HUVECs were treated with DMSO or Sert (5 μM) for indicated time points before harvesting for western blot analysis of STK11 and phosphorylated STK11 at S428 (p-STK11-S428). Western blot data were quantitated and the ratio of phosphorylation vs total STK11 is shown in the bar graph (right panel). (B) The effect of Sert on CAMKK2 pathway. HUVECs were treated with the CAMKK2 inhibitor STO-609 (10 μM) for 30 min and then subsequently treated with ionomycin (Iono, 3 μM) or Sert (5 μM) for an additional 30 min before harvesting for western blot analysis of ACACA, phosphorylated ACACA (p-ACACA), and ACTB. (C) MAP1LC3B positive puncta (green) were increased by Sert treatment in HUVECs. Each autophagy inhibitors (3-MA, WM, PD98059) were treated 1 h prior to Sert treatment. Images are obtained from confocal microscopy. Quantification of data is shown in (C) shows quantitative analysis of MAP1LC3B puncta from three independent experiments. Values are means ± SEM. **p < 0.01, ***p < 0.001; scale bar: 10 μm. (D) TFEB nuclear translocation assay through EGFP-TFEB transfection of HUVECs under DMSO or MSL (100 μM) treatment for 3 h or Sert (5 μM) treatment from 2 to 24 h. And then, the cells were harvested, followed by treatment with TFEB (green) antibody for 1 h. Nuclei were stained with DAPI. Scale bar: 20 μm. Quantification of data is shown in (D)
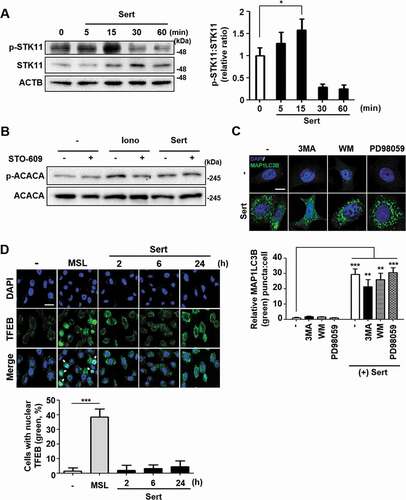
Recently, MTOR signaling pathway has been shown to communicate with TFEB (transcription factor EB), a master regulator of autophagy induction and lysosomal biogenesis [Citation28]. Activated MTOR signaling can phosphorylate TFEB and inhibit nuclear translocation of TFEB, blocking the target gene expression [Citation29]. To investigate whether Sert triggers TFEB translocation into nucleus, an enhanced green fluorescence protein (EGFP)-TFEB plasmid was transfected into HUVECs to directly observe the nuclear translocation of TFEB ()). The nuclear translocation of TFEB was not observed by Sert treatment from 2 h to 24 h, while MSL [4-(4-fluorophenyl)sulfonyl-5-methylthio-2-phenyloxazole], a known small molecule activator of TFEB and autophagy, induced TFEB nuclear translocation in HUVECs. In addition, Sert treatment induced MAP1LC3-II conversion in both wild-type (WT) and TFEB−/- HeLa cells, indicating that Sert induces autophagy in a TFEB-independent manner (Fig. S3) [Citation28].
Sert induces autophagy by targeting VDAC1 protein
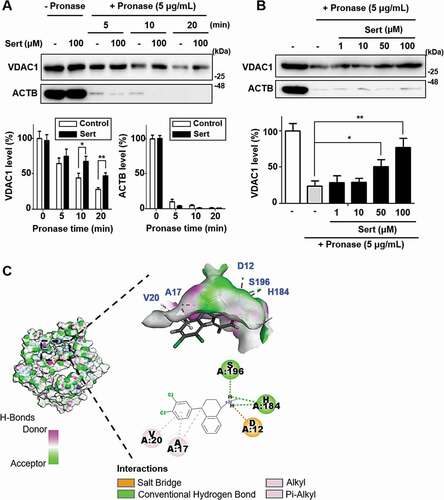
As mitochondria play the pivotal role in ATP production through oxidative phosphorylation, and Sert activated autophagy independently from PI3K-AKT and MAP2K/MEK-MAPK signaling pathways, mitochondrial outer membrane protein VDAC1 can be involved in Sert induced autophagy. VDAC1 plays a key role in cell metabolism by transporting ATP and other small metabolites across the outer mitochondrial membrane and is known to be associated with MTOR activity [Citation8]. Recently, a small molecule antagonist of VDAC1, itraconazole, is revealed as an inhibitor of angiogenesis by regulating AMPK-MTOR signaling axis. To investigate the direct interaction between VDAC1 and Sert, the drug affinity responsive target stability (DARTS) assay was employed. DARTS is a label-free method for target identification and validation of small molecules that utilizes alterations in protein’s proteolytic susceptibility due to conformation change of the protein upon small molecule binding [Citation30]. The DARTS assay with immunoblotting showed the increased stability of VDAC1 against pronase after treating Sert, whereas ACTB, a protein with no Sert binding affinity, showed no change in proteolytic susceptibility upon Sert treatment ()). Notably, the stability of VDAC1 was increased in a dose-dependent manner by Sert treatment, while no change in the ACTB stability was observed, demonstrating that Sert specifically binds to VDAC1 ()). For further validation, SLC6A4/SERT1 (solute carrier family 6 member 4) protein, a known target protein of Sert related with its antidepressant activity was examined by DARTS assay. Sert-induced desensitization of SLC6A4 has been demonstrated in nanomolar concentrations. In a nanomolar concentration, Sert increased the stability of SLC6A4, but not VDAC1, against pronase for up to 20 min (Fig. S4), suggesting that Sert has a higher binding affinity to SLC6A4 than VDAC1. Nonetheless, these results demonstrate that Sert potentially binds to VDAC1 in cells. Furthermore, in silico docking analysis showed that Sert could directly bind to the ATP binding domain of VDAC1 ()). Hydrogen bond (H184, S196) and hydrophobic (A17, V20) interactions with Sert contributed to its high binding energy to VDAC1 as with ATP [Citation31] (Fig. S5A) and DIDS [Citation32] (Fig. S5B), a known VDAC1 inhibitor (CDOCKER energy of ATP: −39.65 kcal/mol; DIDS: −7.98 kcal/mol; Sert: −22.43 kcal/mol).
Figure 4. Biophysical validation reveals VDAC1 as a new protein target of Sert. (A) The DARTS assay for target validation. VDAC1 protein stability was increased upon Sert (100 μM) treatment in HUVECs lysates. Pronase treatment was conducted for 5, 10, and 20 min. The graph plots the quantification data is shown in (A). n = 3, *p < 0.05, **p < 0.01. (B) The DARTS assay demonstrated the dose-dependent binding of Sert to VDAC1. Treatment with pronase (5 μg/mL) was conducted for 10 min. The graph plots the quantification data is shown in (B). n = 3, *p < 0.05, **p < 0.01. (C) In silico docking model of Sert interacting with VDAC1 (human VDAC1, RCSB PDB ID: 2JK4). Sert bound to the VDAC1 between α-helix and β-sheet in the most stable pose and binding motifs were depicted with several high-affinity interactions between Sert and the VDAC1 pocket. Ligands are shown as gray sticks in displayed hydrogen bond surfaces. Bonds are shown as dashed lines color-coded as follows: hydrophobic interactions in orange, electrostatic interaction in purple, and hydrogen bonds in green and sky blue
We next investigated whether the modulation of AMPK-MTOR-RPS6KB1 signaling by Sert is initiated by targeting VDAC1. We used VDAC1 WT and null (vdac1−/-) mouse embryonic fibroblasts (MEFs). AMPK activation and MTOR-RPS6KB1 inhibition were assessed either with Rapa or Sert treatment in both WT and vdac1−/- MEFs ()). In WT MEFs, Sert strongly activated AMPK and inhibited MTOR-RPS6KB1 phosphorylation. In contrast, the Sert modulation of AMPK-MTOR-RPS6KB1 signaling was completely abolished in vdac1−/- MEFs, whereas Rapa was still able to inhibit MTOR activity regardless of the VDAC1 expression status. Since VDAC1 acts as an ATP transporter, we next measured cytosolic ATP level in both WT and vdac1−/- MEFs treated with or without Sert. Interestingly, cellular ATP level in vdac1−/- MEFs was nearly same (96%) as that in WT VDAC1 MEFs (100%) (Fig. S6A). Sert treatment significantly reduced the cellular ATP level in a time-dependent manner in WT VDAC1 MEFs, while it showed a marginal effect in vdac1−/- MEFs (Fig. S6A). This data suggested that there could be an alternative ATP transport pathway that compensates VDAC1 functions in vdac1−/- cells, which could be very little or marginally affected by Sert. In addition, both Rapa and Sert significantly increased EGFP-MAP1LC3 puncta in WT MEFs. However, Sert, but not Rapa, was not able to increase the EGFP-MAP1LC3 puncta in vdac1−/- MEFs ()).
Figure 5. Biological validation using vdac1-knockout cells reveals that VDAC1 is a biological relevant protein target of Sert. (A) Western blot analysis of the levels of VDAC1, p-MTOR, MTOR, p-AMPK, AMPK, and ACTB in cells after each compound treatment for 30 min in WT MEFs or vdac1-knockout MEFs. The graph plots the quantification data is shown in (A). n = 3, *p < 0.05, **p < 0.01. (B) MAP1LC3 positive puncta (green) were increased by Sert (5 μM) treatment in WT MEFs, whereas vdac1-knockout MEFs treated with Sert did not induce autophagic vesicles formation. The cells were treated with Sert (5 μM) or Rapa (10 μM) for 24 h in HUVECs. And then, the cells were harvested, followed by treatment with MAP1LC3B (green) antibody for 1 h. Nuclei were stained with DAPI. Images were obtained from confocal microscopy. Quantification of data is shown in (B). Values are means ± SEM; n > 10 cells, ***p < 0.001; scale bar: 10 μm. (C) Autophagic flux evaluation in WT MEFs or vdac1-knockout MEFs using mCherry-GFP MAP1LC3 in the presence of each compound. Representative images of merged channels are shown; scale bar: 10 μm. Pearson coefficient for the colocalization analysis is shown. Quantification of data is shown in (C). Values are means ± SEM; n > 10 cells, **p < 0.01, ***p < 0.001. (D) Effect of Sert treatment on the proliferation of WT MEFs and vdac1-knockout MEFs. All cells were treated with Sert (0–5 μM) for 72 h, and cell growth was measured using an MTT colorimetric assay. N = 3, Values are means ± SEM. **p < 0.01, ***p < 0.001
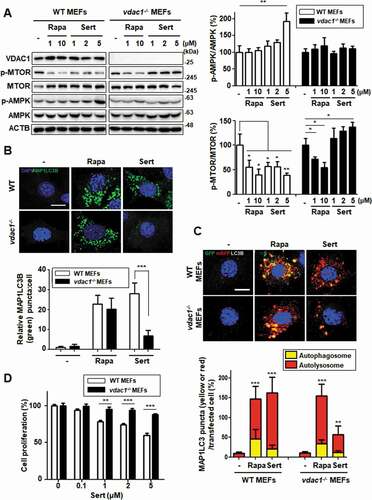
To further demonstrate whether the Sert-induced autophagy is VDAC1-dependent, a double-tagged MAP1LC3 (mRFP-GFP) plasmid was used to examine autophagic flux. Notably, Sert highly increased the autolysosomes in WT MEFs, whereas this effect was significantly attenuated in vdac1−/- MEFs ()), suggesting that the autophagy-inducing activity of Sert is largely dependent on VDAC1. One of the biological effects on VDAC1 inhibition has been reported as anti-proliferative activity. For example, VDAC1 knockdown profoundly inhibits MTOR activity and cell proliferation in HUVECs [Citation8]. To investigate further the dependency of Sert’s biological activity on VDAC1, cells were treated with Sert for 72 h and cell proliferation and mitochondrial activity were assessed. Cell proliferation remained greater than 50% at 72 h in vdac1−/- MEFs up to the highest dose (5 μM) Sert tested, whereas WT MEFs exhibited steady inhibition of cell proliferation by Sert ()). Sert did not reduce the cell viability of either WT VDAC1 or vdac1−/- MEFs at the same concentration range (Fig. S6B). These results clearly demonstrate that VDAC1 is a biologically relevant target protein of Sert for its modulatory effect on AMPK-MTOR-RPS6KB1 signaling and autophagy-inducing activity. Since we observed a marginal increase in autophagic vacuoles by Sert in vdac1−/- cells () and (C)), we investigated possible off-target effects of Sert, i.e. the effect on the isoforms of VDAC1, including VDAC2 and 3. Although the biological functions of human VDAC2 or 3 are largely unknown with no structural information, the alignment of their protein sequences showed a high similarity with human VDAC1 (identity of human VDAC2 with VDAC1: 75%, human VDAC3 with VDAC1: 67%). Especially, most amino acid sequences in the assumed Sert binding site were identical among the three VDAC isoforms (Fig. S7A). The analysis of structure alignment of Vdac2 (zebrafish, 83% homology with human VDAC2) using an available protein crystal structure showed the superposition, indicating a structural similarity between VDAC1 with VDAC2 including the binding site of Sert (Fig. S7B). Molecular docking simulation of the binding of Sert on the zebrafish Vdac2 revealed that it has −9.81 kcal/mol of binding energy that is approximately 2.2-fold higher than VDAC1 (−22.43 kcal/mol) (Fig. S7C). These observations suggest that Sert could also bind to VDAC2 (and possibly to VDAC3), albeit with less affinity than VDAC1.
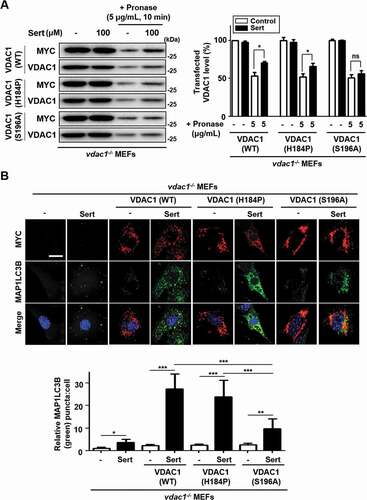
In order to identify the binding site of Sert on VDAC1 protein, we explored the two amino acid residues within the ATP binding domain, H184 and S196, which were predicted from the docking simulation for the binding of Sert ()). We generated the WT and two mutant versions of VDAC1 expression plasmids, including MYC-VDAC1H184P and MYC-VDAC1S196A, and transfected them in vdac1−/- MEFs to see whether the WT and mutant versions of VDAC1 are able to reintroduce the Sert effects on biophysical interaction with VDAC1 and autophagic flux. The DARTS assay with immunoblotting showed the increased stability of VDAC1 with the transfection of WT MYC-VDAC1 (recovery ratio: 17.4%) or MYC-VDAC1H184P (recovery ratio: 14.7%) against pronase after treating Sert, whereas the transfection of MYC-VDAC1S196A (recovery ratio: 5.2%) showed no meaningful change in proteolytic susceptibility upon Sert treatment ()). As shown previously, Sert did not effectively increase the MAP1LC3 puncta in vdac1−/- MEFs (), Sert only treatment). The transfection of WT MYC-VDAC1 or MYC-VDAC1H184P, but not MYC-VDAC1S196A, was able to reintroduce the ability of Sert to increase the number of MAP1LC3 puncta ()), up to the level similar to that seen in WT MEFs ()). This data indicates that Sert-induced autophagic flux is indeed through modulating VDAC1, and that the S196 is a key amino acid residue of VDAC1 serving the possibility of binding site of Sert on the ATP binding domain of VDAC1.
Figure 6. Validation of the binding site of Sert on VDAC1 (A) For DARTS assay, vdac1−/- MEF cells were transfected with WT MYC-VDAC1, MYC-VDAC1H184P or MYC-VDAC1S196A vectors at 1500 nM each for 48 h. And then, the cells were harvested, lysed, followed by treatment with (Sert, 100 μM) treatment. Pronase treatment (5 μg/mL) was conducted for 10 min. The graph plots the quantification data is shown in (A). n = 3, *p < 0.05. (B) VDAC1−/- MEF cells were transfected with WT MYC-VDAC1, MYC-VDAC1H184P or MYC-VDAC1S196A vectors at 200 nM each for 24 h. Then, the cells were treated with Sert (5 μM) for an additional 24 h. And then, the cells were harvested, followed by treatment with MYC (red) and MAP1LC3B (green) antibody for 3 h. Nuclei were stained with DAPI. Images were obtained from confocal microscopy. Quantification of data is shown in (B). Values are means ± SEM; n > 10 cells, *p < 0.05, **p < 0.01, ***p < 0.001; scale bar: 10 μm
Autophagy inducer, Sert, inhibits tauopathy by promoting degradation of MAPT protein
Next, the effects of Sert on tauopathy were investigated to explore its potential as an autophagy therapeutic agent. MAPT protein was used as a substrate because it is known to undergo degradation via autophagy, and the generation of MAPT aggregates is especially important at early stages of Alzheimer disease. Cellular MAPT was generated using a HEK293-derived cell line that expressed high levels of the longest central nervous system isoform of human MAPT (hTau40) upon doxycycline induction (inducible MAPT cell line) [Citation33]. Firstly, degradative kinetics of MAP1LC3-II was measured to assess autophagic flux induced by Sert in this system. Both Sert and Rapa as autophagy inducers significantly increased the level of MAP1LC3-II until 48 h and then decreased at 72 h by autophagy mediated degradation ()). The levels of MAPT and truncated MAPT, which are known to be toxic causing neuronal cells necrosis, were decreased by Rapa treatment ()). This effect is known to attenuate the progression of MAPT pathology by inducing MTOR-dependent autophagy [Citation34]. Similar to Rapa, Sert treatment significantly reduced MAPT and truncated MAPT levels.
Figure 7. Sert-induced autophagy degrades MAPT protein in vitro. (A) MAP1LC3-II level after compound treatment for 24, 48, and 72 h. Sert treatment induced autophagic degradation of MAP1LC3-II level for 48–72 h, as like Rapa treatment. (B) Inducible MAPT cells were treated with DMSO or doxycycline (1 ng/mL) with DMSO or Rapa (10 μM), or Sert (1 μM) for 48 h. Samples were subjected to SDS–polyacrylamide gel electrophoresis/IB. (C) The aggregated nature and cellular localization of MAPT oligomers. MAPT-BiFC cells were incubated with DMSO or okadaic acid (OA, 30 nM) with DMSO or Rapa (10 μM), or Sert (1 μM) for 48 h (upper panel). After fixation, each sample was examined by confocal microscopy. Scale bar: 5 μm. Graph of fluorescence in down panel. Values are means ± SEM; n = 10 cells. ***p < 0.001, **p < 0.01. (D) Inducible MAPT cells were pretreated with Sert (1 μM) for 6 h with doxycycline (1 ng/mL) before the co-treatment with either MG132 (20 μM) or chloroquine (CQ, 5 μM) for additional 40 h
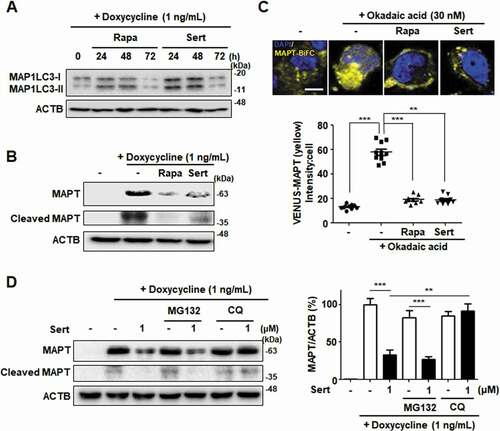
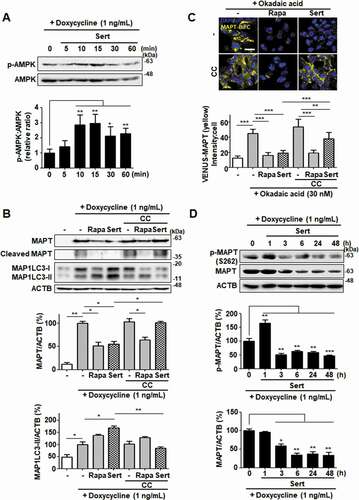
To visualize and quantify MAPT oligomerization in living cells, we utilized a MAPT cell line with biomolecular fluorescence complementation (BiFC). Amino-terminal and carboxyl-terminal parts of Venus proteins are independently fused to MAPT, which exhibits basal fluorescence signals under normal conditions. However, the fluorescence becomes strongly “turned-on” on chemical induction of MAPT hyper-phosphorylation, such as okadaic acid, consistent with consequent MAPT oligomerization. Similar to that seen in inducible MAPT cells, Rapa or Sert significantly reduced MAPT aggregation induced by okadaic acid in MAPT-BiFC cells ()). To investigate whether Sert affects MAPT protein levels by triggering the lysosome- or proteasome-dependent degradation pathway, the specific inhibitors of these pathways were examined. Inhibition of the lysosome with chloroquine prevented the Sert-induced degradation of MAPT and truncated MAPT, whereas the proteasome inhibitor MG132 did not show these effects ()). Next, we examined the effect of Sert on AMPK activity in inducible MAPT cell line. Sert treatment rapidly increased the phosphorylation of AMPK at T172, with the peak at 15 min of its treatment ()). In addition, Sert-induced degradation of MAPT and truncated MAPT was completely abolished by the treatment with the AMPK inhibitor, CC. CC, however, did not affect the Rapa-induced degradation of MAPT and truncated MAPT ()). Similarly, only the Sert-induced MAP1LC3-II conversion was reversed by the CC treatment ()). Furthermore, the Sert-mediated reduction of MAPT oligomerization was significantly reversed by the CC treatment in MAPT-BiFC cells ()). These results indicate that the autophagy inducer, Sert, can promote the degradation of MAPT proteins during proteotoxic stress. Phosphorylation of AMPK has been known to trigger MAPT phosphorylation at S262 paradoxically resulting in its aggregation. To investigate whether Sert-induced phosphorylation of AMPK can facilitate MAPT phosphorylation, the levels of phosphorylated MAPT at S262 and total MAPT were measured in the inducible MAPT cells treated with Sert ()). Although Sert transiently increased the levels of MAPT phosphorylation at S262 within 1 h, the levels dropped rapidly after 1 h in parallel with the reduction of total MAPT protein levels. These results demonstrate that the reduction of p-S262 is likely due to the degradation of total MAPT proteins via Sert-induced autophagy.
Figure 8. Sert degrades both MAPT proteins in vitro via AMPK-induced autophagy. (A) Inducible MAPT cells were treated with DMSO or doxycycline (1 ng/mL) with Sert (1 μM) in a time-dependent manner. Western blot analysis of the levels of p-AMPK and AMPK in cells after each compound treatment. (B) Inducible MAPT cells were pretreated with doxycycline (1 ng/mL) for 24 h. And then, Sert (1 μM) was treated for 48 h. The graph plots the quantification data is shown in (B). n = 3, *p < 0.05, **p < 0.01. (C) Degradation of MAPT oligomers (yellow) was visualized in BiFC cells when cells were co-treated with CC (10 μM) 1 h prior to Sert (1 μM) or Rapa (10 μM). Scale bar: 20 μm. Quantification of data is shown in (C). Values are means ± SEM; n > 20 cells. **p < 0.01, ***p < 0.001. (D) Western blot analysis of the level of p-MAPT (S262), total MAPT, and ACTB in inducible MAPT cells after Sert (1 μM) treatment. The graph plots the quantification data is shown in (D). n = 3, *p < 0.05, **p < 0.01, ***p < 0.001
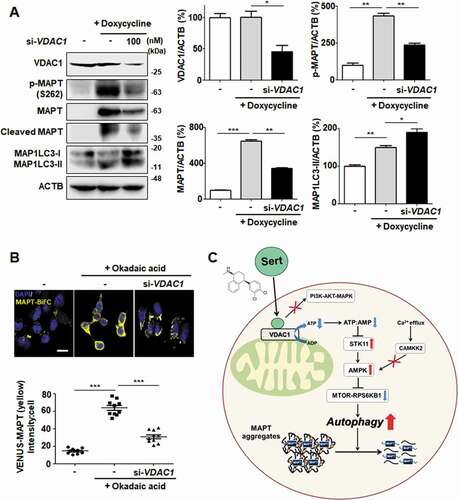
We next investigated whether the knockdown of VDAC1 expression mimics the biological MAPT degradation by Sert. VDAC1 knockdown by a specific siRNA effectively inhibited both MAPT and cleaved MAPT accumulation with increased MAP1LC3-II in MAPT inducible cell line ()). Likewise, downregulating VDAC1 promoted the degradation of MAPT oligomers in MAPT-BiFC cell line ()). These results demonstrate that VDAC1 is a biologically relevant target protein of Sert and responsible for promoting the degradation of MAPT proteins ()).
Figure 9. VDAC1 is a biologically relevant target protein of Sert-induced biological activity on tauopathy. (A) Western blot analysis of the level of VDAC1, p-MAPT, MAPT, Cleaved MAPT, MAP1LC3, and ACTB in inducible MAPT cells after transfection with si-VDAC1 (100 nM) for 48 h. The graph plots the quantification data is shown in (A). n = 3, *p < 0.05, **p < 0.01, ***p < 0.001. (B) Degradation of MAPT oligomers was visualized in MAPT-BiFC cells when cells were transfected with si-VDAC1 (100 nM) for 48 h. Scale bar: 20 μm. Quantification of data is shown in (B). Values are means ± SEM; n > 20 cells. ***p < 0.001. (C) Schematic summary of VDAC1-mediated autophagy modulation upon Sert treatment
Discussion
Sert is a selective serotonin reuptake inhibitor (SSRI) approved for clinical use as an antidepressant. It was discovered as a hit compound from our phenotypic screening for autophagy induction. Notably, a nanomolar concentration of Sert, which was enough to bind to serotonin reuptake transporter in DARTS assay, did not induce autophagy. To address unknown molecular mechanism underlying Sert-induced autophagy, our studies identified the mitochondrial outer membrane protein, VDAC1, as a new target protein of Sert for its autophagy inducing activity. Consequently, we were able to elucidate previously unknown mechanism of Sert that it interrupted VDAC1 functions, reduced cellular ATP level, activated AMPK, inhibited MTOR and thereby induced autophagy. We further provided evidences that Sert, by inducing autophagy, could be effective in reducing MAPT-derived toxicity (summarized in )).
Instead of applying conventional approaches depending largely on affinity-based binding, which involves the chemical modification of small molecules, we used the label-free methodology DARTS, which enables to identify target proteins of small molecules without chemical modification [Citation30]. Systemic target validations, including DARTS western assay, in silico docking simulation, and the phenotype reversal by the overexpression of WT and mutant versions of VDAC1 in vdac1 null cells demonstrated VDAC1 as a biologically relevant target of Sert for its autophagy-inducing activity. VDAC1 is an important channel protein that allows ATP to diffuse out of the mitochondria into cytosol [Citation35,Citation36]. It also functions as a scaffold for proteins to regulate cellular metabolism and death. However, VDAC1 is not an essential protein as its knockout is viable [Citation37]. This suggests that cells could have an alternative pathway to compensate a part of functions when VDAC1 is absent. vdac1−/- MEFs are an established cell line that has adapted its own ATP metabolism without VDAC1. We believe that this is why vdac1−/- cells have similar level of ATP or MAP1LC3 puncta to that in WT VDAC1 cells. It is likely that in WT VDAC1 cells, VDAC1, as the most abundant VDAC among the isoforms [Citation38], is the primary protein that governs the ATP diffusion and metabolic regulation, and hence cells are heavily rely on its function for ATP metabolism. When VDAC1 is inhibited by Sert or siRNA knockdown in WT VDAC1 cells, cells are not ready for an alternative option for its functional defect and thus the ATP diffusion and metabolic regulation can be heavily impacted. This model explains why the phenotypes of VDAC1 siRNA in WT VDAC1 cells vs vdac1−/- cells are different. Our sequence homology analysis and molecular docking simulation suggested that other VDAC isoforms, including VDAC2 and/or 3 could be potential compensatory mechanisms that appeared to be to some extent sensitive to Sert. Further study is needed to elucidate the compensatory mechanisms of VDAC1 in vdac1−/- cells and possible off target effects of Sert.
Sert has long been used as an SSRI class of antidepressant since its approval in 1991. It is mainly used to treat major depressive disorder and also sometimes other neuronal disorders, including obsessive-compulsive disorder, panic disorder and post-traumatic stress disorder. Depression is a complicated disease caused by a number of different factors. Several recent studies highlighted the possible involvement of neuronal autophagy in depression [Citation39,Citation40]. Autophagy is an important cellular homeostatic process that facilitates the continuous turnover of nonfunctional proteins and organelles. In particular, such an autophagic action is important for the neuronal differentiation and synaptic plasticity, as well as for protecting neurons under stress conditions [Citation41]. Dysregulation of neuronal autophagy can lead to the accumulation of damaged or nonfunctional organelles and proteins, causing neuronal dysfunction and death [Citation42]. This can eventually lead to neurodegenerative diseases, such as tauopathy and depression. Conversely, stimulation of autophagy is neuroprotective and reduces such neurodegenerations [Citation43,Citation44]. Thereafter, the stimulation of neuronal autophagy has been considered as a pharmacological target to improve the treatment of depression [Citation41]. In line with this, a number of recent studies show that several antidepressant drugs induce autophagy [Citation45–47], although the mechanistic and causative relationships between autophagy and antidepressant effect have not been much explored. Based on these observations and our current study, it can be postulated that the autophagy-inducing effect of Sert could be a part of its antidepressant effects in vivo. Although the effective concentration of Sert for VDAC1 and autophagy is higher than its therapeutic serum concentrations (30–200 ng/mL), the possible Sert accumulation in certain brain areas (this was known for several antidepressants) could make its concentrations that are sufficient for the autophagy induction relevant for the in vivo situation. Further study is needed to determine the concentration of Sert in brain with its antidepressant dosage regimen and its autophagic inducing effects in vivo.
Biochemical inhibition of VDAC1 by small molecule inhibitors, such as itraconazole and DIDS, has presented the phenotypic link between VDAC1 and angiogenesis, and VDAC1 and mitochondrial metabolism [Citation48,Citation49]. In addition, inhibition of VDAC1 prevented Ca2+-mediated oxidative stress and apoptosis [Citation32], which has been clarified in previous studies. However, the link between VDAC1 and autophagy has not been established. Our findings highlight VDAC1 as a promising target for inducing autophagy, which can be applied to neurodegenerative diseases with defective autophagy. In this study, we suggested that VDAC1-mediated autophagy of Sert with anti-tauopathy effect can be practically applied as autophagy therapy without cytotoxic effect. Furthermore, the identification of VDAC1 as a potential target protein of Sert will not only facilitate the future development of novel therapeutic agents for autophagy-related diseases, but also provide a novel chemical probe to explore VDAC1 functions in autophagy signaling and autophagy-related diseases.
Materials and methods
Compounds and agents
Sert was screened from among 2, 386 chemicals obtained from Johns Hopkins Drug Library. All compounds were stored as 10 mM stock solutions in DMSO at – 20C and diluted with DMEM (Gibco, 11995065) or EBM-2 (Lonza Bioscience, cc-3156) medium before in vitro experiments. The working solution was freshly prepared in basal medium, and the control group was treated with the same amount of DMSO (Sigma-Aldrich, D2650) as a vehicle control. Baf (B1793), Rapa (553210), 3-MA (M9281), WM (W1628), PD98059 (P215), CC (P5499) and E64D cysteine protease inhibitor (E8640) were purchased from Sigma-Aldrich. Pronase (10165921001) was purchsed from Roche. Protease and phosphatase inhibitor solution (1861281) and Triton X-100 (T8787) were purchased from Sigma-Aldrich. Hoechst 33342 (H3570), Lipofectamine LTX (94756), Lipofectamine 2000 (52887), DMEM (Gibco, 11995065), EBM-2 (Lonza Bioscience, cc-3156), and fetal bovine serum (FBS) (Gibco, 16000044) were purchased from Invitrogen. mRFP-GFP-MAP1LC3B plasmids were provided from Dr. Jaewhan Song at Yonsei University (Seoul, Korea). Both MSL compound and TFEB−/- HeLa cells were provided from Dr. Myung-Shik Lee at Yonsei University (Seoul, Korea). HEK293-trex-MAPT cells and MAPT-BiFC cells were provided from Dr. Min Jae Lee at Seoul National University (Seoul, Korea), vdac1−/- MEFs were gifts from Dr. Jun O. Liu at Johns Hopkins School of Medicine (Baltimore, USA) and Dr. W. J. Craigen at Baylor College of Medicine (Houston, USA).
Cell culture
Early passage (passages 4–8) HUVECs were grown in EBM-2 (Lonza Bioscience, cc-3156), supplemented 10% FBS (Gibco, 16000044) and 1% antibiotics (Gibco, 15240062). HEK290-trex-MAPT cells and MAPT-BiFC cells were grown in DMEM (Gibco, 11995065) containing 10% FBS (Gibco, 16000044) and 1% antibiotics (Gibco, 15240062). All cell cultures were maintained at pH 7.4 in a humidified incubator at 37C under 5% CO2 in air.
In silico docking study
All molecular docking analysis were performed with Discovery Studio 2016 software (Accelrys, San Diego, CA, USA) adopting the CHARMm force field. The crystal structure of the human Hsp70 nucleotide-binding domain (PDB ID 2JK4) was obtained from the RCSB protein data bank. The protein structures of the human VDAC1 were energy-minimized using the Powell algorithm. The ligands were docked using Ligandfit. The Ligandfit parameters were validated using the ligand from the human VDAC1 crystal structure with 9 poses generated. The most predictive binding modes were determined based on various scoring functions (Ligscore1_Dreiding, Ligscore2_Dreiding, PLP1, PLP2, PMF, DOCK_SCORE), and binding energies were calculated in Ligandfit.
Immunoblotting
Soluble proteins were harvested from cells by using SDS lysis buffer (50 mM Tris HCl, pH 6.8 containing 10% glycerol, 2% SDS, 10 mM dithiothreitol, 0.005% bromophenol blue). Equal volumes of proteins were separated by 8% or 12.5% SDS-PAGE and transferred to polyvinylidene fluoride membranes (Merck Millipore, IPVH00010). Blots were then blocked and immunolabeled overnight at 4C with primary antibodies, anti-MAP1LC3 (MBL International Corporation, PM036), p-MTOR (S2448) (Cell Signaling Technology, 2971), MTOR (Cell Signaling Technology, 4517), p-RPS6KB1 (T389) (Cell Signaling Technology, 9206), RPS6KB1 (Cell Signaling Technology, 9202), SQSTM1 (BD Biosciences, BD610833), TFEB (Cell Signaling Technology, 4240), VDAC1 (Abcam, 154,856), SLC6A4 (Abcam, 102,048), and ACTB (Abcam, 8226). Immunolabeling was visualized using an enhanced chemiluminescence kit (Bio-Rad Laboratories, 170–5061) according to the manufacturer’s instructions. Images were quantified using Image Lab software (Bio-Rad, Hercules, CA, USA). ACTB was used as an internal control. All band intensity is proportional the amount of target protein on the membrane with the linear range of detection.
DARTS method
Cell lysates were obtained from HUVECs. Cells were scraped and lysed with M-PER lysis buffer (Thermo Fisher Scientific, 89842Y). After centrifugation for 15 min at 16,000 × g, the supernatant was obtained, and protein content was quantified using Bradford reagent (Bio-Rad Laboratories, 500–0006). Before drug treatment, protein concentration was diluted to 1 mg/mL. Samples were treated with the drugs Sert and DMSO (Sigma-Aldrich, D2650) for 4 h at 4C. Drug concentrations for DARTS were chosen based on the standardized DARTS protocol described previously [Citation50,Citation51]. Samples were then incubated with pronase (Roche, 10,165,921,001) or distilled water, as indicated, for 5, 10, and 20 min at 25C. All portion of each sample was used for western blot analysis. ACTB was used as an internal control.
Acridine orange staining
HUVECs were seeded at a density of 1.5 × 10⁵ cells/well in 6-well plates and incubated overnight. The cells were treated with drugs for the time periods indicated, followed by treatment with 5 μg/mL acridine orange (Sigma-Aldrich, A6014). Nuclei were stained with DAPI (Sigma-Aldrich, D9542). Following incubation for 20 min, the cell samples were fixed with 4% formaldehyde (Sigma-Aldrich, 252,549; diluted in PBS) and washed with 1X PBS (CureBio, P0213; diluted in distilled water) three times. Images were obtained using a confocal microscope at a 400× magnification. Red fluorescence intensity was quantified using Image J software (NIH, Bethesda, MD, USA).
Immunocytochemistry staining
To determine the effect on autophagy, both WT MEFs and vdac1−/- MEFs were seeded at a density of 1.5 × 10⁵ cells/well in 6-well plates and incubated overnight. Following incubation for overnight, the cells samples were fixed with 4% formaldehyde (Sigma-Aldrich, 252,549; diluted in PBS) and washed with 1X PBS (CureBio, P0213; diluted in distilled water) three times. And then, the cells were treated with compounds for the time periods indicated, followed by treatment with MAP1LC3 antibody (Abcam, 51,520) for 1 h. Nuclei were stained with DAPI (Sigma-Aldrich, D9542). Images were obtained using a confocal microscope at a 400 ×.
EGFP-TFEB Nuclear translocation assay
HUVECs were seeded into six-well plates and incubated for 24 h, and EGFP (enhanced green fluorescence protein)-TFEB vector was transfected into the cell using Lipofectamine LTX transfection reagent (Invitrogen, 94,756), according to the manufacturer’s instructions. Then, Sert treatment was performed, lasting 2 − 24 h, as indicated. Results were normalized using negative (DMEM medium) and positive (MSL treatment, 3 h, as specified in references) control samples in the same plates. Cells were then washed, fixed, and stained with DAPI (Sigma-Aldrich, D9542). Images were obtained using a confocal microscope at a 400 × .
ATP-monitoring luminescence assay
To determine the effect of cellular ATP levels on cell proliferation, an ATPlite 1-step Luminescence Assay Kit (Perkin Elmer, 6,016,736) was purchased and used according to the manufacturer’s instruction. HUVECs were seeded in 96-well white plates at 2,000 cells/well and incubated overnight. After drug treatments, luminescence was measured using a Victor 3 Multilabel Plate Reader (Perkin Elmer, Waltham, MA, USA).
Cell proliferation assay
WT MEFs and vdac1−/- MEFs were seeded in 96-well plates at 3,000 cells/well and incubated overnight. Sert was added to the cells to determine their effects on cell proliferation. Cells were grown from 0 to 72 h, and growth was analyzed by the 3-(4,5-dimehylthiazol-2-yl)-2,5-diphenyl tetrazolium bromide (MTT; VWR International, 0793) colorimetric assay. MTT-formazan in each well was dissolved in 150 μL DMSO (Sigma-Aldrich, D2650), and the absorbance at 540 nm was read with a microplate reader.
Amino acid sequence alignment and protein superposition modeling
Sequence alignment and visualization were performed using BLASTp and Clustal Omega [Citation52]. Conserved amino acids are marked with color (black, gray or white) and symbol (* or: or .). The FASTA format of amino acid sequence of VDAC1, VDAC2, and VDAC3 were obtained from Uniprot. Protein superposition and visualization were performed using TopMatch [Citation53] and SuperPose 1.0 [Citation54]. The crystal structure of the VDAC1 (human, PDB ID 2JK4) and Vdac2 (zebrafish, PDB ID 4BUM) were obtained forma the RCSB protein data bank. Structural similarity (SCORE) was calculated based on spatial distance between each atomic pairs after optimal superposition (see [Citation53]). If the structurally equivalent parts in query and target match perfectly, SCORE is equal to LEN. With increasing spatial deviation of the aligned residues, SCORE approaches 0.
mRFP-GFP-MAP1LC3B plasmid transfection
HUVECs were seeded in 6-well plates at 1.5 × 10⁵ cells/well and incubated overnight. HUVECs were transfected with negative control or mRFP-GFP-MAP1LC3B plasmids using Lipofectamine LTX transfection reagent (Invitrogen, 94,756) for 4 h. The cells were treated with drugs for 24 h, followed by treatment with mRFP-GFP-MAP1LC3B plasmid (1000 ng). Nuclei were stained with DAPI (Sigma-Aldrich, D9542). Following incubation for 20 min, the cells was fixed with 4% formaldehyde (Sigma-Aldrich, 252,549; diluted in PBS) and washed with 1X PBS (CureBio, P0213; diluted in distilled water) three times. Images were obtained using a confocal microscope at a 400× magnification. Colocalization analysis was performed using the “colocalization” module of the ImageJ2 software.
Recombinant VDAC1 plasmid transfection analysis
For transient overexpression of VDAC1, MYC-VDAC1 (Origene, RC209949) was purchased. MYC-VDAC1H184P and MYC-VDAC1S196A were generated by Bioneer (Daejeon, Korea). For overexpression of VDAC1, vdac1−/- MEFs were transfected with negative control or WT MYC-VDAC1 or MYC-VDAC1H184P or MYC-VDAC1S196A for 24 h using Lipofectamine 2000 transfection reagent (Invitrogen, 52,887) according to the manufacturer’s instructions. The expression of exogenous VDAC1 protein was validated by immunostaining analysis.
Endogenous MAPT degradation using inducible MAPT cell line
HEK293-trex-MAPT cells were seeded in a 12-well plate at a density of 5 × 10⁴ cells per well and treated with DMSO or doxycycline (1 ng/mL) with DMSO (Sigma-Aldrich, D2650) or Rapa (10 μM; Sigma-Aldrich, 553,210), or Sert (1 μM) for 48 h. For immunoblotting, soluble proteins were harvested from cells by using SDS lysis buffer (50 mM Tris HCl, pH 6.8 containing 10% glycerol, 2% SDS, 10 mM dithiothreitol, and 0.005% bromophenol blue). Equal volumes of proteins were separated by 8% or 12.5% SDS-PAGE and transferred to polyvinylidene fluoride membranes (EMD Millipore, IPVH00010). Blots were then blocked and immunolabeled overnight at 4C with primary antibodies, anti-MAP1LC3 (MBL International Corporation, PM036), and ACTB (Abcam, 8226). Immunolabeling was visualized using an enhanced chemiluminescence kit (Bio-Rad Laboratories, 170–5061) according to the manufacturer’s instructions. Images were quantified using Image Lab software (Bio-Rad, Hercules, CA, USA). ACTB was used as an internal control.
MAPT-BiFC cell analysis
MAPT-BiFC cells were seeded in a 6-well plate at a density of 105 cells per well and treated with DMSO or 30 nM of okadaic acid (Sigma-Aldrich, O0981) with DMSO (Sigma-Aldrich, D2650) or Rapa (10 μM; Sigma-Aldrich, 553,210), or Sert (1 μM) for 48 h. Nuclei were stained with DAPI (Sigma-Aldrich, D9542). Following incubation for 20 min, the cells and tissue samples were fixed with 4% paraformaldehyde (Sigma-Aldrich, P6148) and washed with 1X PBS (CureBio, P0213; diluted in distilled water) three times. Images were obtained using a confocal microscope at a 400× magnification. Fluorescence intensity was quantified using ImageJ sofrware.
Statistical analysis
All data are expressed as the means ± SEM with GraphPad Prism (ver. 5.00 for Windows; GraphPad Software, Inc., San Diego, CA, USA). Data were obtained from at least three independent experiments. Statistical analyses were performed using an unpaired, two-tailed Student’s t-test. P-values less than 0.05 were considered statistically significant (* indicates p < 0.05, ** indicates p < 0.01, *** indicates p < 0.001).
Supplemental Material
Download Zip (4.5 MB)Disclosure statement
There were no potential conflicts of interest to be disclosed.
Supplementary material
Supplemental data for this article can be accessed here.
Additional information
Funding
Related Research Data
References
- Levine B, Kroemer G. Autophagy in the pathogenesis of disease. Cell. 2008;132:27–42.
- Hwang HY, Cho SM, Kwon HJ. Approaches for discovering novel bioactive small molecules targeting autophagy. Expert Opin Drug Discov. 2017;12:909–923.
- Uddin MS, Stachowiak A, Mamun AA, et al. Autophagy and alzheimer’s disease: from molecular mechanisms to therapeutic implications. Front Aging Neurosci. 2018;10:04.
- Zhang K, McQuibban GA, Silva C, et al. HIV-induced metalloproteinase processing of the chemokine stromal cell derived factor-1 causes neurodegeneration. Nat Neurosci. 2003;6:1064–1071.
- Rovira M, Huang W, Yusuff S, et al. Chemical screen identifies FDA-approved drugs and target pathways that induce precocious pancreatic endocrine differentiation. Proc Natl Acad Sci U S A. 2011;108:19264–19269.
- Cho YS, Yen CN, Shim JS, et al. Antidepressant indatraline induces autophagy and inhibits restenosis via suppression of mTOR/S6 kinase signaling pathway. Sci Rep. 2016;6:34655.
- MacQueen G, Born L, Steiner M. The selective serotonin reuptake inhibitor sertraline: its profile and use in psychiatric disorders. CNS Drug Rev. 2001;7:1–24.
- Head SA, Shi W, Zhao L, et al. Antifungal drug itraconazole targets VDAC1 to modulate the AMPK/mTOR signaling axis in endothelial cells. Proc Natl Acad Sci U S A. 2015;112:E7276–7285.
- Klionsky DJ, Abdalla FC, Abeliovich H, et al. Guidelines for the use and interpretation of assays for monitoring autophagy. Autophagy. 2012;8:445–544.
- Choi IK, Cho YS, Jung HJ, et al. Autophagonizer, a novel synthetic small molecule, induces autophagic cell death. Biochem Biophys Res Commun. 2010;393:849–854.
- Chen C, Deng M, Sun Q, et al. Lipopolysaccharide stimulates p62-dependent autophagy-like aggregate clearance in hepatocytes. Biomed Res Int. 2014;2014:267350.
- Pugsley HR. Assessing autophagic flux by measuring LC3, p62, and LAMP1 co-localization using multispectral imaging flow cytometry. J Vis Exp. 2017 125.
- Mauvezin C, Neufeld TP. Bafilomycin A1 disrupts autophagic flux by inhibiting both V-ATPase-dependent acidification and Ca-P60A/SERCA-dependent autophagosome-lysosome fusion. Autophagy. 2015;11:1437–1438.
- Mizushima N, Yoshimori T, Levine B. Methods in mammalian autophagy research. Cell. 2010;140:313–326.
- Zhou C, Zhong W, Zhou J, et al. Monitoring autophagic flux by an improved tandem fluorescent-tagged LC3 (mTagRFP-mWasabi-LC3) reveals that high-dose rapamycin impairs autophagic flux in cancer cells. Autophagy. 2012;8:1215–1226.
- Kim D, Hwang HY, Kim JY, et al. FK506, an Immunosuppressive drug, induces autophagy by binding to the V-ATPase catalytic subunit a in neuronal cells. J Proteome Res. 2017;16:55–64.
- Alers S, Loffler AS, Wesselborg S, et al. Role of AMPK-mTOR-Ulk1/2 in the regulation of autophagy: cross talk, shortcuts, and feedbacks. Mol Cell Biol. 2012;32:2–11.
- Jung CH, Ro SH, Cao J, et al. mTOR regulation of autophagy. FEBS Lett. 2010;584:1287–1295.
- Mihaylova MM, Shaw RJ. The AMPK signalling pathway coordinates cell growth, autophagy and metabolism. Nat Cell Biol. 2011;13:1016–1023.
- Fu D, Wakabayashi Y, Lippincott-Schwartz J, et al. Bile acid stimulates hepatocyte polarization through a cAMP-Epac-MEK-LKB1-AMPK pathway. Proc Natl Acad Sci U S A. 2011;108:1403–1408.
- Gwinn DM, Shackelford DB, Egan DF, et al. AMPK phosphorylation of raptor mediates a metabolic checkpoint. Mol Cell. 2008;30:214–226.
- Seglen PO, Gordon PB. 3-methyladenine: specific inhibitor of autophagic/lysosomal protein degradation in isolated rat hepatocytes. Proc Natl Acad Sci U S A. 1982;79:1889–1892.
- Abliz A, Deng W, Sun R, et al. Wortmannin, PI3K/Akt signaling pathway inhibitor, attenuates thyroid injury associated with severe acute pancreatitis in rats. Int J Clin Exp Pathol. 2015;8:13821–13833.
- Cerioni L, Palomba L, Cantoni O. The Raf/MEK inhibitor PD98059 enhances ERK1/2 phosphorylation mediated by peroxynitrite via enforced mitochondrial formation of reactive oxygen species. FEBS Lett. 2003;547:92–96.
- Kim YM, Namkoong S, Yun YG, et al. Water extract of Korean red ginseng stimulates angiogenesis by activating the PI3K/Akt-dependent ERK1/2 and eNOS pathways in human umbilical vein endothelial cells. Biol Pharm Bull. 2007;30:1674–1679.
- Ma L, Chen Z, Erdjument-Bromage H, et al. Phosphorylation and functional inactivation of TSC2 by Erk implications for tuberous sclerosis and cancer pathogenesis. Cell. 2005;121:179–193.
- Dibble CC, Cantley LC. Regulation of mTORC1 by PI3K signaling. Trends Cell Biol. 2015;25:545–555.
- Lim H, Lim YM, Kim KH, et al. A novel autophagy enhancer as a therapeutic agent against metabolic syndrome and diabetes. Nat Commun. 2018;9:1438.
- Pena-Llopis S, Vega-Rubin-de-Celis S, Schwartz JC, et al. Regulation of TFEB and V-ATPases by mTORC1. Embo J. 2011;30:3242–3258.
- Chang J, Kim Y, Kwon HJ. Advances in identification and validation of protein targets of natural products without chemical modification. Nat Prod Rep. 2016;33:719–730.
- Yehezkel G, Hadad N, Zaid H, et al. Nucleotide-binding sites in the voltage-dependent anion channel: characterization and localization. J Biol Chem. 2006;281:5938–5946.
- Chen H, Gao W, Yang Y, et al. Inhibition of VDAC1 prevents Ca(2)(+)-mediated oxidative stress and apoptosis induced by 5-aminolevulinic acid mediated sonodynamic therapy in THP-1 macrophages. Apoptosis. 2014;19:1712–1726.
- Bandyopadhyay B, Li G, Yin H, et al. Tau aggregation and toxicity in a cell culture model of tauopathy. J Biol Chem. 2007;282:16454–16464.
- Caccamo A, Magri A, Medina DX, et al. mTOR regulates tau phosphorylation and degradation: implications for Alzheimer’s disease and other tauopathies. Aging Cell. 2013;12:370–380.
- Rostovtseva T, Colombini M. ATP flux is controlled by a voltage-gated channel from the mitochondrial outer membrane. J Biol Chem. 1996;271:28006–28008.
- Rostovtseva T, Colombini M. VDAC channels mediate and gate the flow of ATP: implications for the regulation of mitochondrial function. Biophys J. 1997;72:1954–1962.
- Baines CP, Kaiser RA, Sheiko T, et al. Voltage-dependent anion channels are dispensable for mitochondrial-dependent cell death. Nat Cell Biol. 2007;9:550–555.
- De Pinto V, Guarino F, Guarnera A, et al. Characterization of human VDAC isoforms: a peculiar function for VDAC3? Biochim Biophys Acta. 2010;1797:1268–1275.
- Gassen NC, Rein T. Is there a role of autophagy in depression and antidepressant action? Front Psychiatry. 2019;10:337.
- Rein T. Is autophagy involved in the diverse effects of antidepressants? Cells. 2019;8:44.
- Jia J, Le W. Molecular network of neuronal autophagy in the pathophysiology and treatment of depression. Neurosci Bull. 2015;31:427–434.
- Hara T, Nakamura K, Matsui M, et al. Suppression of basal autophagy in neural cells causes neurodegenerative disease in mice. Nature. 2006;441:885–889.
- Schaeffer V, Lavenir I, Ozcelik S, et al. Stimulation of autophagy reduces neurodegeneration in a mouse model of human tauopathy. Brain. 2012;135:2169–2177.
- Schaeffer V, Goedert M. Stimulation of autophagy is neuroprotective in a mouse model of human tauopathy. Autophagy. 2012;8:1686–1687.
- Zschocke J, Rein T. Antidepressants encounter autophagy in neural cells. Autophagy. 2011;7:1247–1248.
- Jeon SH, Kim SH, Kim Y, et al. The tricyclic antidepressant imipramine induces autophagic cell death in U-87MG glioma cells. Biochem Biophys Res Commun. 2011;413:311–317.
- Gulbins A, Schumacher F, Becker KA, et al. Antidepressants act by inducing autophagy controlled by sphingomyelin-ceramide. Mol Psychiatry. 2018;23:2324–2346.
- Head SA, Shi WQ, Yang EJ, et al. Simultaneous targeting of NPC1 and VDAC1 by itraconazole leads to synergistic inhibition of mTOR signaling and angiogenesis. ACS Chem Biol. 2017;12:174–182.
- Shoshan-Barmatz V, Maldonado EN, Krelin Y. VDAC1 at the crossroads of cell metabolism, apoptosis and cell stress. Cell Stress. 2017;1:11–36.
- Lomenick B, Jung G, Wohlschlegel JA, et al. Target identification using drug affinity responsive target stability (DARTS). Curr Protoc Chem Biol. 2011;3:163–180.
- Lomenick B, Hao R, Jonai N, et al. Target identification using drug affinity responsive target stability (DARTS). Proc Natl Acad Sci U S A. 2009;106:21984–21989.
- Chenna R, Sugawara H, Koike T, et al. Multiple sequence alignment with the Clustal series of programs. Nucleic Acids Res. 2003;31:3497–3500.
- Wiederstein M, Sippl MJ. TopMatch-web: pairwise matching of large assemblies of protein and nucleic acid chains in 3D. Nucleic Acids Res. 2020;48:W31–W5.
- Maiti R, Van Domselaar GH, Zhang H, et al. SuperPose: a simple server for sophisticated structural superposition. Nucleic Acids Res. 2004;32:W590–4.