
ABSTRACT
A key mediator of macroautophagy/autophagy induction is the class III phosphatidylinositol 3-kinase complex I (PtdIns3K-C1) consisting of PIK3C3/VPS34, PIK3R4/VPS15, BECN1, and ATG14. Although several proteins are known to enhance or decrease PtdIns3K-C1 activity, our understanding of the molecular regulation of PtdIns3K-C1 is still incomplete. Previously, we identified a Golgi-associated protein, GLIPR2, in a screen for proteins that interact with amino acids 267–284 of BECN1, a region of BECN1 sufficient to induce autophagy when fused to a cell penetrating leader sequence. In this study, we used CRISPR-Cas9-mediated depletion of GLIPR2 in cells and mice to investigate the role of GLIPR2 in the regulation of autophagy and PtdIns3K-C1 activity. Depletion of GLIPR2 in HeLa cells increased autelophagic flux and generation of phosphatidylinositol 3-phosphate (PtdIns3P). GLIPR2 knockout resulted in less compact Golgi structures, which was also observed in autophagy-inducing conditions such as amino acid starvation or Tat-BECN1 peptide treatment. Importantly, the binding of GLIPR2 to purified PtdIns3K-C1 inhibited the in vitro lipid kinase activity of PtdIns3K-C1. Moreover, the tissues of glipr2 knockout mice had increased basal autophagic flux as well as increased recruitment of the PtdIns3P-binding protein, WIPI2. Taken together, our findings demonstrate that GLIPR2 is a negative regulator of PtdIns3K-C1 activity and basal autophagy.
Abbreviations: ATG14: autophagy related 14; Baf A1: bafilomycin A1; BARA: β-α repeated, autophagy-specific; CQ: chloroquine; GFP: green fluorescent protein; GLIPR2: GLI pathogenesis related 2; HBSS: Hanks’ balanced salt solution; KO: knockout; MAP1LC3/LC3: microtubule associated protein 1 light chain 3; PBS: phosphate-buffered saline; PtdIns3K-C1: phosphatidylinositol 3-kinase complex I; PtdIns3P: phosphatidylinositol-3-phosphate; SEM: standard error of the mean; WIPI2: WD repeat domain, phosphoinositide interacting 2
Introduction
Macroautophagy/autophagy initiation requires two kinase complexes, the ULK1 (unc-51 like autophagy activating kinase 1) protein kinase complex and the class III phosphatidylinositol 3-kinase I (PtdIns3K-C1) complex [Citation1]. The PtdIns3K-C1 complex, composed of PI3KC3/VPS34, PI3KR4/VPS15, BECN1/Beclin 1, ATG14 (autophagy related 14) and NRBF2 (nuclear receptor binding factor 2), generates phosphatidylinositol-3-phosphate (PtdIns3P) for autophagosome nucleation [Citation1,Citation2]. Autophagy upregulation due to a gain-of-function mutation in the PtdIns3K-C1 subunit BECN1 in mice extends lifespan and healthspan, reduces tumorigenesis and rescues neurodegenerative phenotypes [Citation3–5]. Another PtdIns3K lipid kinase complex, PtdIns3K-C2, contains UVRAG (UV radiation resistance associated) instead of ATG14 and functions in autophagosome maturation, endocytosis, and MAP1LC3/LC3 (microtubule associated protein 1 light chain 3)-associated phagocytosis [Citation2,Citation6]. Depletion of RUBCN/Rubicon, a negative regulator of the PtdIns3K-C2 complex, increases autophagy and extends lifespan and healthspan of invertebrate and vertebrate model organisms [Citation7].
Recent studies reveal potential roles for Golgi proteins in autophagy regulation [Citation8–10]. For example, the Golgi stacking protein, GORASP2/GRASP55, facilitates autophagosome-lysosome fusion by interacting with PtdIns3K-C2 [Citation10]. We previously identified GLIPR2/GAPR-1 (GLI pathogenesis related 2), an evolutionarily conserved Golgi-associated protein [Citation11] as a candidate regulator of autophagy [Citation12]. We found that GLIPR2 binds to amino acids 267–284 of BECN1 and showed that GLIPR2 siRNA knockdown increased autophagosome formation in HeLa cells [Citation12]. Moreover, we found that a cell-permeable peptide derived from amino acids 267–284 of BECN1, Tat-BECN1, a potent inducer of autophagy in vitro and in different rodent tissues [Citation6,Citation12–14], decreased BECN1 binding to GLIPR2 in the Golgi [Citation12]. These findings led us to hypothesize that GLIPR2 may be a negative regulator of autophagy and that Tat-BECN1 may induce autophagy through a mechanism involving GLIPR2.
Notably, the GLIPR2-interacting region of BECN1 belongs to a β-α repeated, autophagy-specific (BARA) domain that is indispensable for targeting PtdIns3K complexes to membrane [Citation15,Citation16]. Structural studies of PtdIns3K reveal that this region becomes more accessible when the complex is associated with liposomes [Citation17,Citation18]. Conversely, two negative regulators of PtdIns3K-C2, RUBCN and the HIV-encoded protein Nef, interact with this region of BECN1 and decrease its accessibility [Citation19]. Thus, conformational changes in the GLIPR2-binding region of the BARA domain, governed both by membrane association and protein/protein interactions, are crucial for the regulation of PtdIns3K activity. Accordingly, we postulated that GLIPR2 may act directly on the PtdIns3K-C1 complex to negatively regulate autophagy.
Here we report that GLIPR2, a previously identified BECN1 binding protein [Citation12,Citation20] is a negative regulator of basal autophagy. Depletion of GLIPR2 in cells leads to increased autophagic flux and recruitment of the PtdIns3P-binding protein WIPI2 (WD repeat domain, phosphoinositide interacting 2) which functions in autophagosome formation [Citation21]. GLIPR2 binds to purified PtdIns3K-C1 and inhibits its in vitro lipid kinase activity. Moreover, the tissues of glipr2 knockout (KO) mice have greater basal autophagic flux. Thus, GLIPR2 is a newly identified negative regulator of autophagy that inhibits PtdIns3K-C1 complex activity.
Results
GLIPR2 is a negative regulator of autophagy but is not required for Tat-BECN1-induced autophagy
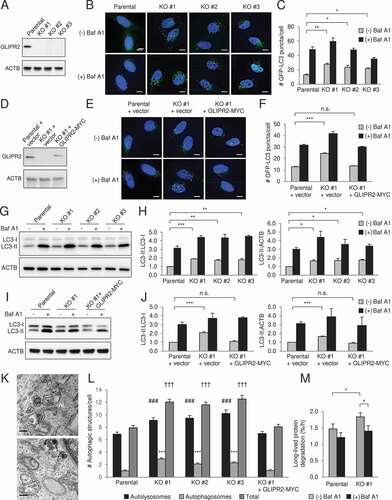
To determine whether GLIPR2 is a bona fide negative regulator of autophagy, we used CRISPR-Cas9-mediated gene editing to delete GLIPR2 in HeLa cells. In three independent GLIPR2 knockout (KO) clones (), the numbers of GFP-LC3 puncta, a marker of autophagosomes, was higher during normal growth conditions (). This did not represent a block in autophagosomal maturation, as GFP-LC3 numbers further increased when GLIPR2 KO cells were treated with the lysosomal inhibitor, bafilomycin A1 (Baf A1). The increased autophagic flux in GLIPR2-deleted cells was not due to off-target effects of CRISPR-Cas9-mediated gene deletion, as reconstitution of GLIPR2 KO cells with wild-type GLIPR2-MYC restored numbers of GFP-LC3 puncta numbers to levels similar to those observed in parental wild-type cells (). Similar findings were observed when autophagic flux was assessed by western blot analysis of the conversion of endogenous LC3 from its soluble form, LC3-I, to its autophagosome-associated, lipidated form, LC3-II. GLIPR2 KO increased the ratio of LC3-II to LC3-I as well as the ratio of LC3-II:ACTB/actin, and this was reversed by reconstitution with GLIPR2-MYC (). We next examined autophagic structures by transmission electron microscopy (). GLIPR2 KO increased the numbers of both autolysosomes and autophagosomes, which was reversed by reconstitution with GLIPR2-MYC (). Furthermore, in long-lived protein degradation assays we found a higher degradation rate in GLIPR2 KO cells (). Thus, using four independent assays, we demonstrate that GLIPR2 negatively regulates autophagy in cultured cells.
Figure 1. GLIPR2 knockout cells have increased autophagic flux. (A) Western blot analysis of GLIPR2 expression in HeLa parental cells and HeLa CRISPR-Cas9-mediated GLIPR2 knockout (KO) cells. Clones #1-3 are from three independent targeting experiments. (B and C) Representative images (B) and quantification (C) of GFP-LC3 puncta in HeLa parental and GLIPR2 KO cells ± 50 nM Baf A1 for 2 h. Bars represent mean ± SEM of triplicate samples (30–70 cells analyzed per sample). Scale bars: 10 µm. Similar results were observed in four independent experiments. n.s., not significant, *p < 0.05, **p < 0.01; one-way ANOVA with Dunnett’s test for multiple comparisons. (D) Western blot analysis of GLIPR2 expression in HeLa parental cells, HeLa GLIPR2 KO clone #1 and HeLa GLIPR2 KO clone #1 reconstituted with GLIPR2-MYC. (E and F) Representative images (E) and quantification (F) of GFP-LC3 puncta in HeLa parental cells, HeLa GLIPR2 KO clone #1 and GLIPR2 KO clone #1 reconstituted with wild-type GLIPR2-MYC ± 50 nM Baf A1 for 2 h. Bars represent mean ± SEM of triplicate samples (30–70 cells analyzed per sample). Scale bars: 10 µm. Similar results were observed in four independent experiments. n.s., not significant, ***p < 0.001; one-way ANOVA with Dunnett’s test for multiple comparisons. (G and H) Representative western blots (G) of endogenous LC3 in indicated cell lines cultured in the absence or presence of 100 nM Baf A1 for 2 h. Similar results were observed in three independent experiments and the relative quantification (H) of LC3-II to LC3-I and LC3-II to ACTB/actin. Bars represent mean ± SEM. *p < 0.05, **p < 0.01, ***p < 0.001; one-way ANOVA with Dunnett’s test for multiple comparisons. (I and J) Representative western blots (I) of endogenous LC3 in indicated cell lines cultured in the absence or presence of 100 nM Baf A1 for 2 h. Similar results were observed in three independent experiments and the relative quantification (J) of LC3-II to LC3-I and LC3-II to ACTB/actin. Bars represent mean ± SEM. n.s., not significant, ***p < 0.001; one-way ANOVA with Dunnett’s test for multiple comparisons. (K and L) Representative images of autolysosomes (AL) and autophagosomes (AP) in GLIPR2 KO cells (K) and quantification (L) of autolysosomes and autophagosomes in indicated cell lines. Bars represent mean ± SEM (40 cells per sample). For autolysosomes, ###, p < 0.001; for autophagosomes, ***p < 0.001; for total autophagic structures, †††p < 0.001; one-way ANOVA with Dunnett’s test for multiple comparisons. Scale bars: 200 nm. (M) The degradation rate of long-lived proteins in indicated cells in the absence or presence of 50 nM Baf A1 was calculated from six independent experiments. Bars represent mean ± SEM. *p < 0.05; paired, two-tailed t-test
To test whether GLIPR2 is required for Tat-BECN1-induced autophagy, GLIPR2 KO and parental cells were treated with the autophagy-inducing Tat-BECN1 peptide or a control inactive mutant peptide, Tat-BECN1F270S, that contains a single amino acid substitution (Phe->Ser) at the site corresponding to amino acid 270 in human BECN1 [Citation13]. Although numbers of GFP-LC3 were higher in GLIPR2 KO versus wild-type cells treated with control peptide, Tat-BECN1 did increase GFP-LC3 puncta in GLIPR2 KO cells (). Furthermore, Tat-BECN1 induced LC3-I to LC3-II conversion in a dose-dependent manner in GLIPR2 KO cells (). GLIPR2 KO increased the ratio of LC3-II to LC3-I in the absence of peptides (), the absolute value of which was slightly different from normal growth conditions () as the treatment of peptides was carried out in serum-reduced medium. Taken together, these results indicate that GLIPR2 is neither the sole target for Tat-BECN1 nor essential for Tat-BECN1-induced autophagy.
Figure 2. GLIPR2 knockout cells respond to Tat-BECN1 peptide. (A) Quantification of GFP-LC3 puncta in indicated HeLa cell lines treated for 2 h with either 10 µM autophagy-inducing peptide (Tat-BECN1) or an inactive, control mutant peptide (Tat-BECN1F270S). Bars represent mean ± SEM of triplicate samples (30–70 cells analyzed per sample). Similar results were observed in three independent experiments. n.s., not significant, *p < 0.05, **p < 0.01, ***p < 0.001; one-way ANOVA with Tukey’s test for multiple comparisons. (B and C) Representative western blots (B) of endogenous LC3 in indicated cell lines treated with indicated concentration of Tat-BECN1 or control Tat-BECN1F270S peptides for 2 h. Similar results were observed in six independent experiments and the relative quantification (C) of LC3-II to LC3-I. Bars represent mean ± SEM. n.s., not significant, *p < 0.05, ***p < 0.001; one-way ANOVA with Dunnett’s test for multiple comparisons. (D) Relative quantification of LC3-II to LC3-I in indicated cells without peptide treatments (B and C). Bars represent mean ± SEM (n = 12). **p < 0.01; unpaired, two-tailed t-test
GLIPR2 deletion, starvation, and Tat-BECN1 treatment result in alterations in Golgi morphology
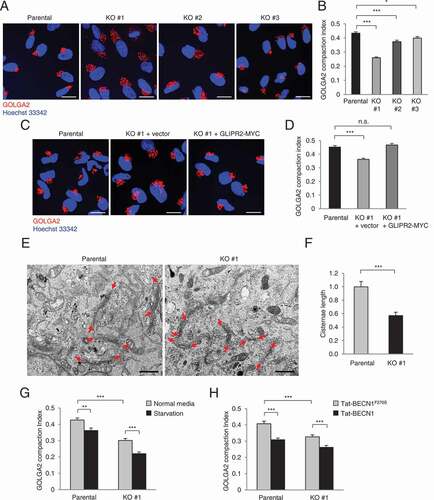
Because GLIPR2 is a Golgi-localized protein [Citation11], we examined the effects of GLIPR2 deletion on Golgi morphology. Using immunostaining to detect GOLGA2/GM130, a marker of the cis-Golgi network, we found increased dispersion of the Golgi () which corresponded to a lower Golgi compaction index [Citation22] () in GLIPR2 KO cells. This decrease in Golgi compaction/increase in Golgi dispersion was reversed by reconstitution of GLIPR2 KO cells with GLIPR2-MYC (). Moreover, ultrastructural analyses revealed a decrease in Golgi cisternae length in GLIPR2 KO HeLa cells compared to parental, wild-type HeLa cells (). Similar to our observations upon deletion of GLIPR2, we also detected decreased Golgi compaction in HeLa cells treated with two different autophagy-inducing stimuli, including amino acid starvation () or Tat-BECN1 peptide treatment (). The effects of starvation or Tat-BECN1 on Golgi dispersion were additive, rather than redundant, with GLIPR2 deletion (). Thus, these data demonstrate that Golgi dispersion is a common feature of several distinct stimuli that induce autophagy. Furthermore, while the absence of the Golgi-associated GLIPR2 increases Golgi dispersion, its presence at endogenous levels does not block amino acid starvation-induced or Tat-BECN1 peptide-induced Golgi dispersion.
Figure 3. Increased Golgi dispersion in cells with GLIPR2 deletion or exposure to autophagy inducers. (A and B) Representative images of GOLGA2 Golgi marker staining (A) and GOLGA2 compaction index (B) of indicated cells. Bars represent mean ± SEM (150–200 cells per sample). Similar results were observed in three independent experiments. *p < 0.05, ***p < 0.001; one-way ANOVA with Dunnett’s test for multiple comparisons. Scale bars, 20 µm. (C and D) Representative images of GOLGA2 Golgi marker staining (C) and GOLGA2 compaction index (D) of indicated cells. Bars represent mean ± SEM (150–200 cells per sample). Similar results were observed in three independent experiments. n.s., not significant, ***p < 0.001; one-way ANOVA with Dunnett’s test for multiple comparisons. Scale bars, 20 µm. (E) Representative TEM images of indicated cells. Red arrowheads indicate the edges of Golgi cisternae. Scale bars, 2 µm. (F) Quantification of Golgi cisternae length in indicated cells. Bars represent mean ± SEM (10 cell per sample). *** p < 0.001; unpaired, two-tailed t-test. (G and H) GOLGA2 compaction index of indicated cells upon treatment with autophagy-inducing stimuli, including starvation (HBSS, 2 h) (G) or Tat-BECN1 peptide (10 µM, 2 h) (H). Bars represent mean ± SEM (100 cells per sample). Similar results were observed in three independent experiments. **p < 0.01, ***p < 0.001; one-way ANOVA with Tukey’s test for multiple comparisons
GLIPR2 negatively regulates the lipid kinase activity of the PtdIns3K-C1 complex
We sought to elucidate the mechanism by which GLIPR2 negatively regulates autophagy initiation. The GLIPR2-interacting region of BECN1 has been shown to regulate PtdIns3K membrane targeting and lipid kinase activity [Citation15–19]. We therefore tested the hypothesis that GLIPR2 directly inhibits the lipid kinase activity of the autophagy-initiating PtdIns3K-C1 complex.
First, we confirmed that depletion of GLIPR2 increased total PtdIns3P level and PtdIns3K-C1 activity in intact cells, as measured by staining with a fluorescent PtdIns3P binding probe, PX-Alexa Fluor 555 [Citation17,Citation23] () and WIPI2 (a marker of PtdIns3P generation at sites of autophagosome generation [Citation21]) (). Next, we used a previously established in vitro reconstitution system to examine the effects of recombinant GLIPR2 purified from E. coli [Citation20] on an enzymatically active Strep-tagged PtdIns3K-C1 complex purified from mammalian HEK293F cells [Citation24]. Wild-type (WT) GLIPR2, but not a mutant form of GLIPR2 (mtGLIPR2) with five substitutions in the conserved equatorial groove required for binding to BECN1 (H54A E86A G102K H103A N138G) [Citation20], was pulled down by Strep-tagged PtdIns3K-C1, as demonstrated by Coomassie Brilliant Blue gel staining or western blot analysis (). We then used quantitative mass spectrometry analyses to measure the PtdIns3K-C1 lipid kinase activity in the presence of PtdIns-containing small unilamellar vesicles. PtdIns3P levels were decreased in control reactions either lacking ATP, containing the PIK3C3/VPS34 inhibitor PIK-III [Citation25], or with vesicular membrane disruption by the detergent CHAPS (). WT GLIPR2, but not the PtdIns3K-C1 binding-defective mtGLIPR2, decreased PtdIns3P generation (). Conversely, consistent with previous findings described by Chang et al. [Citation19], Tat-BECN1 peptide, but not a loss-of-function point mutant peptide Tat-BECN1F270S, increased PtdIns3P generation by PtdIns3K-C1 (). These findings demonstrate that GLIPR2 directly inactivates the PtdIns3K-C1 complex.
Figure 4. GLIPR2 inhibits PtdIns3K-C1 complex lipid kinase activity. (A and B) PtdIns3P probe staining (A) and quantification (B) of PtdIns3P puncta in indicated cells. Bars represent mean ± SEM for triplicate samples (50 cells analyzed per sample). Similar results were observed in three independent experiments. n.s., not significant, ***p < 0.01; one-way ANOVA with Dunnett’s test for multiple comparisons. Scale bars, 10 µm. (C and D) Immunostaining (C) and quantification (D) of WIPI2 puncta in indicated cells. Bars represent mean ± SEM for triplicate samples (100–150 cells analyzed per sample). Similar results were observed in three independent experiments. n.s., not significant, ***p < 0.001; one-way ANOVA with Dunnett’s test for multiple comparisons. Scale bars, 10 µm. (E) In vitro pull-down assays of purified Strep-tagged PtdIns3K-C1 with wild-type GLIPR2 (WT GLIPR2) or mutant GLIPR2 (H54A E86A G102K H103A N138G) (mt GLIPR2) analyzed by SDS-PAGE and stained with Coomassie Blue. (F) In vitro pull-down assays of Strep-tagged PtdIns3K-C1 with WT GLIPR2 or mt GLIPR2, analyzed by western blotting. The left and right panels were cropped from the same gel. (G) Effect of PIK-III and CHAPS on in vitro lipid kinase activity of PtdIns3K-C1 as measured by mass spectrometry analyses. Bars represent mean ± SEM from five independent experiments. ***p < 0.001; one-way ANOVA with Dunnett’s test for multiple comparisons. (H) Effect of GLIPR2 on in vitro lipid kinase activity of PtdIns3K-C1 as measured by mass spectrometry analyses. Bars represent mean ± SEM from five independent experiments. n.s., not significant, *p < 0.05; one-way ANOVA with Dunnett’s test for multiple comparisons. (I) Effect of Tat-BECN1 on in vitro lipid kinase activity of PtdIns3K-C1 as measured by mass spectrometry analyses. Bars represent mean ± SEM from six independent experiments. n.s., not significant, ***p < 0.001; one-way ANOVA with Dunnett’s test for multiple comparisons. (J and K) Effects of Tat-BECN1 and GLIPR2 on PtdIns3K-C1 membrane association assessed using liposome flotation assays. Four fractions were collected from each sample and subjected to SDS-PAGE and immunodetection of BECN1 and PIK3C3/VPS34. Representative western blots (J) of BECN1 and PIK3C3/VPS34 in fractions with indicated treatments. Similar results were observed in four independent experiments and the relative quantification (K) of BECN1 and PIK3C3/VPS34 in liposome-containing Fraction 1. Bars represent mean ± SEM. n.s., not significant, *p < 0.05, **p < 0.01, ***p < 0.001; one-way ANOVA with Dunnett’s test for multiple comparisons
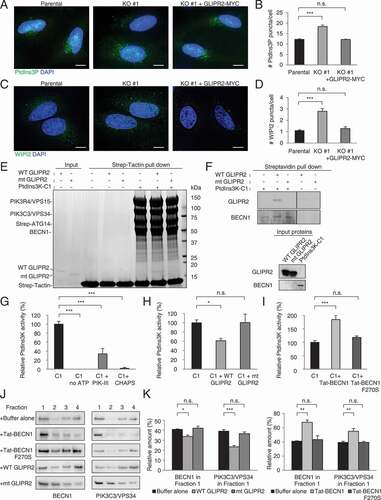
To examine the molecular mechanism(s) by which PtdIns3K-C1 lipid kinase activity is regulated, we employed liposome flotation assays to evaluate whether GLIPR2 or Tat-BECN1 peptide altered PtdIns3K-C1 association with PtdIns-containing small unilamellar vesicles. Compared to buffer control or inactive mutant peptide, Tat-BECN1 increased the association of PtdIns3K-C1 with liposomes (, fraction 1), whereas wild-type GLIPR2 but not mt GLIPR2 lowered the association (). The effects of GLIPR2 or Tat-BECN1 on PtdIns3K-C1 membrane association () are consistent with their effects on PtdIns3K-C1 lipid kinase activities (). Thus, taken together, our findings indicate that GLIPR2 negatively regulates and Tat-BECN1 positively regulates PtdIns3K-C1 activity through a mechanism that may involve alterations in PtdIns3K-C1 association with membranes.
GLIPR2 is a negative regulator of autophagy in mice
Our results above demonstrate that endogenous GLIPR2 negatively regulates autophagy in cultured cells and that recombinant GLIPR2 directly inhibits PtdIns3K-C1 activity in vitro. To determine whether GLIPR2 inhibits autophagy in vivo, we used CRISPR-Cas9-mediated gene editing to generate glipr2-/- (KO) mice. Using normalized mouse multiple tissue cDNA panels, we detected Glipr2 expression by quantitative real-time PCR in adult spleen, heart, liver, skeletal muscle and lung tissue (with highest abundance in spleen), as well as in 11, 15, and 17-day embryos (Fig. S1A). Western blot analysis of GLIPR2 in murine embryonic fibroblasts (MEFs) or spleen from glipr2 KO mice showed no detectable GLIPR2 protein expression (Fig. S1B).
To measure autophagic flux in basal conditions, glipr2 KO mice were crossed with mice that transgenically express the fluorescent autophagy protein, GFP-LC3 [Citation26]. We found that basal numbers of GFP-LC3 puncta were increased in all tissues examined from glipr2-/-:GFP-LC3 (KO) mice as compared to those in Glipr2+/+:GFP-LC3 (WT) mice including in the heart, liver and skeletal muscle (). This was not due to a block in autophagosome maturation as numbers of GFP-LC3 mice increased further when mice were treated with an inhibitor of lysosomal acidification, chloroquine (CQ). Moreover, the levels of SQSTM1/p62, an autophagy substrate, were decreased in the tissues of WT versus KO mice ().
Figure 5. Glipr2 KO mouse tissues have increased autophagic flux. (A-F) Representative images (A, C, E) and quantification (B, D, F) of GFP-LC3 puncta in the hearts (A and B), livers (C and D), and skeletal muscles (E and F) of Glipr2+/+:GFP-LC3 (WT) and glipr2-/-:GFP-LC3 (KO) mice ± chloroquine (CQ) (50 mg kg−1, 4 h). Bars represent mean ± SEM (4 mice per group, 20 randomly chosen fields per mouse). *p < 0.05, **p < 0.01; unpaired, one-tailed t-test. Scale bars, 10 μm. (G and H) Western blots (G) and relative quantification (H) of SQSTM1/p62 protein in heart, liver and skeletal muscle from Glipr2+/+ (WT) and glipr2-/- (KO) mice. Bars represent mean ± SEM (3 mice per group). *p < 0.05, **p < 0.01; unpaired, one-tailed t-test
To examine PtdIns3K-C1 activity in tissues, we stained endogenous WIPI2, a PtdIns3P-binding protein, in skeletal muscles of wild-type and glipr2 KO mice. (Available antibodies did not work to detect endogenous WIPI2 in liver and heart.) We found that under basal conditions, the number of WIPI2 puncta was increased in skeletal muscles of glipr2 KO mice (). Taken together, these data reveal increased autophagic flux and PtdIns3K-C1 activity in glipr2-/-mice, providing evidence that GLIPR2 functions as a negative regulator of autophagy in vivo.
Figure 6. Glipr2 KO mouse muscles have increased WIPI2 puncta. (A and B) Representative images (A) and quantification (B) of WIPI2 puncta in skeletal muscles from Glipr2+/+ (WT) and glipr2-/- (KO) mice. Bars represent mean ± SEM (4 mice per group, 20 randomly chosen fields per mouse). Scale bars, 10 μm. **p < 0.01; unpaired, two-tailed t-test
Discussion
Our results demonstrate that the BECN1-interacting protein, GLIPR2, is a newly identified negative regulator of autophagy in mammals. Using CRISPR-Cas9-mediated gene deletion, we show that cells and mice lacking GLIPR2 have increased autophagic flux. Moreover, we found that GLIPR2 regulates the in vitro lipid kinase activity of the ATG14-containing PtdIns3K-C1 complex. These results expand our understanding of the molecular regulation of the autophagy-initiating PtdIns3K-C1 complex.
There is a growing body of literature suggesting that the GLIPR2-interacting region of the BECN1 BARA domain plays a crucial role in regulation of the lipid kinase activity of autophagy-specific PtdIns3K-C1 and PtdIns3K-C2 complexes. We originally identified amino acids 267–284 of BECN1 as important for its autophagy function and showed that this region interacts with the virally-encoded protein, HIV Nef, as well as the cellular protein, GLIPR2 [Citation12]. Hydrogen deuterium exchange (HDX) studies of yeast PtdIns3K-C2 [Citation17] and human PtdIns3K-C1 and -C2 [Citation18] showed increased exposure of this region of Vps30/Atg6/BECN1 in the presence of liposomes. More recently, the cellular protein, RUBCN, was shown to inhibit PtdIns3K-C2 activity by interacting with this region of BECN1 (β sheet 1 of the BARA domain) and conferring HDX protection to BECN1 BARA residues 265–287 [Citation19]. Furthermore, Chang et al. demonstrated that Tat-BECN1 (corresponding to amino acids 268–278 of BECN1) activated PtdIns3K-C1 and PtdIns3K-C2 activity through a mechanism requiring the hydrophobic residues (F270 and F274) in the BECN1 BARA domain β sheet [Citation19].
Thus, one emerging model is that the first β-sheet of the BECN1 BARA domain undergoes conformational changes to facilitate membrane anchoring and lipid kinase activity of the PtdIns3K-C1 and C2 complexes in a manner that is bidirectionally regulated to stimulate or inhibit autophagy [Citation27]. Our data with GLIPR2 and Tat-BECN1 peptide strongly support this model. We found that GLIPR2, a protein previously identified by mass spectrometry to interact with BECN1 amino acids 267–284 [Citation12], negatively regulates PtdIns3K-C1 activity in vitro on liposomes, in cultured cells, and in vivo in mouse muscle. The effects in vitro are associated with a block in PtdIns3K-C1 association with liposomes. Conversely, similar to Chang et al [Citation19], we found that Tat-BECN1 increases PtdIns3K-C1 activity and PtdIns3K-C1 association with liposomes. Although the cryo-EM structure of PtdIns3K-C1 reveals a similar shape as PtdIns3K-C2, the BECN1 BARA adopts distinct configurations in the two complexes [Citation18,Citation24] and a high-resolution structure of the BECN1 BARA within PtdIns3K-C1 is still lacking. Further structural and biophysical analyses of PtdIns3K-C1 with GLIPR2 and Tat-BECN1 are needed to better understand the molecular mechanisms of PtdIns3K-C1 regulation via the first β-sheet of the BECN1 BARA domain.
Moreover, additional studies are needed to determine whether GLIPR2, similar to HIV Nef and RUBCN, also inhibits PtdIns3K-C2 activity. Our finding that GLIPR2 inhibits PtdIns3K-C1 lipid kinase activity in vitro is consistent with our observation that GLIPR2-depleted cells have increased PtdIns3P generation and autophagosome formation. However, we cannot exclude the possibility that GLIPR2 may also play an inhibitory role in autophagosomal maturation. Recent studies of the Golgi stacking protein GORASP2 showed that GORASP2 facilitates the assembly and membrane association of PtdIns3K-C2 (but not PtdIns3K-C1) and competes with GLIPR2 for binding to BECN1 binding during amino acid starvation [Citation10]. Thus, in theory, this competitive binding of GORASP2 and GLIPR2 to BECN1 could diminish GLIPR2 inhibition of PtdIns3K-C2 activity. It will be interesting to determine whether GORASP2 binds to the same region of the BECN1 BARA domain as GLIPR2 and RUBCN (but exerts opposite effects on PtdIns3K activity) or whether it functions via a different mechanism to regulate PtdIns3K membrane association.
Our findings provide further evidence of an association between Golgi proteins, alterations in Golgi morphology and autophagy. We observed dispersed Golgi morphology under conditions that induce autophagy, including GLIPR2 depletion, amino acid starvation and Tat-BECN1 treatment. Similar Golgi morphological changes upon amino acid starvation have been previously observed [Citation8–10]. A small proportion of dispersed Golgi vesicles colocalize with autophagosomes [Citation10], consistent with the concept of the Golgi-derived ATG9 vesicles as a membrane source of autophagosomes [Citation28]. However, it is unclear whether Golgi dispersion is necessary for – or merely a consequence of – autophagy induction. Interestingly, there is a growing list of Golgi proteins that regulate autophagy. For instance, the cis-Golgi protein, GOLGA2/GM130, negatively regulates autophagy by sequestering the ATG8 family protein GABARAP to the Golgi [Citation8]. The Golgi stacking protein, GORASP2, regulates autophagosome maturation by bridging autophagosomes and the lysosome and facilitating the assembly and membrane association of PtdIns3K-C2 [Citation9,Citation10]. Here, we demonstrate that the Golgi-associated lipid raft protein, GLIPR2, prevents Golgi dispersion and inhibits the activity of the PtdIns3K-C1 complex. Previously, we showed that GLIPR2 overexpression sequestered BECN1 in the Golgi [Citation12], but it is not yet known where in the cell endogenous GLIPR2 acts to inhibit PtdIns3K activity and whether Golgi dispersion is necessary to block such inhibition. The subcellular localization of GLIPR2, its potential crosstalk with GORASP2 [Citation10], changes in its monomeric/dimeric states [Citation20], and additional as-of-yet unidentified GLIPR2 binding partners and GLIPR2 post-translational modifications may contribute to GLIPR2-dependent regulation of autophagy.
The previous report indicating that Tat-BECN1 bound to GLIPR2 and decreased BECN1 Golgi localization raised the possibility that Tat-BECN1 might induce autophagy through GLIPR2 [Citation12], However, we found that Tat-BECN1 can induce autophagy in cells depleted of GLIPR2, suggesting that GLIPR2 is not the sole target of Tat-BECN1. Rather, our results are consistent with the model from Chang et al. [Citation19] in which Tat-BECN1 directly targets PtdIns3K-C1 for autophagy induction. These results, as well as our identification of GLIPR2 as a β sheet 1 BECN1 BARA domain binding protein that inhibits PtdIns3K-C1 activity and autophagy, provide additional support for the concept that the BECN1 BARA domain is an attractive target for the generation of novel autophagy-modulatory agents.
Our newly generated glipr2 knockout mice provide a valuable tool both for future studies of the physiological functions of the GLIPR2 protein as well as the health effects of increased basal autophagy. Although functional studies of GLIPR2 are limited, there are reports that it promotes the epithelial-mesenchymal transition (EMT) in human kidney proximal tubular cells [Citation29] and hepatocellular carcinoma cells [Citation30] and that it activates Type I interferon signaling in monocytes in response to TLR4 [Citation31]. It is thus possible that GLIPR2-mediated inhibition of BECN1 and/or autophagy may regulate EMT and/or enhanced interferon signaling, two phenotypes that have been observed in the setting of BECN1 deficiency [Citation32,Citation33]. Of note, we found that high GLIPR2 expression (as determined by analysis of the TCGA database) is a strong predictor of poor survival in patients with renal clear cell carcinoma (Fig. S2), a malignancy in which EMT is strongly implicated in pathogenesis [Citation34].
Two mouse models have previously been reported with mutations that increase autophagy by altering the regulation of PtdIns3K complex activity, including mice with a knockin mutation in BECN1 that decreases its binding to the negative regulator, BCL2 [Citation3–5], and mice lacking RUBCN [Citation7], an inhibitor of PtdIns3K-C2. These mice have extended lifespan and improved healthspan, including decreased cardiac and renal fibrosis, decreased age-related spontaneous cancers, and decreased neurodegeneration. We observed that middle-aged male glipr2 knockout mice were leaner and reacted faster to find buried food pellets after starvation (Fig. S3). Future studies are needed to determine whether glipr2 knockout mice that have increased basal autophagy also have similar age-related phenotypes as the other two models with increased autophagy.
Materials and methods
Chemicals
Bafilomycin A1 (Sigma-Aldrich, B1793) (Baf A1) was dissolved in sterile-filtered DMSO (Sigma-Aldrich, D2650) as 100 µM stock solutions and stored in small aliquots at −20°C. Chloroquine (Sigma-Aldrich, C6628) was freshly dissolved in phosphate-buffered saline (PBS; Sigma-Aldrich, D8537). PIK-III (Selleck Chemicals, S7683) was dissolved in DMSO as 4 mM stock solutions and stored in small aliquots at −20°C. Tat-BECN1 (YGRKKRRQRRR-GG-VWNATFHIWHD, active) and Tat-BECN1F270S, (YGRKKRRQRRR-GG-VSNATFHIWHD, inactive) peptides were synthesized by the University of Texas Southwestern Medical Center (UTSW) Protein Chemistry Technology Core and purified to >95% by HPLC (confirmed by mass spectrometry) [Citation13]. Peptides were dissolved in PBS and stored at −80°C.
Cell culture
HeLa cells (ATCC, CCL-2) were cultured in Dulbecco’s Modified Eagle Medium (Gibco, 11965092) supplemented with 10% fetal bovine serum (Gibco, 16000044), and 1% penicillin-streptomycin (Gibco, 15140122). GLIPR2 KO HeLa cells were generated by CRISPR-Cas9-induced double-strand break at the Genome Engineering and iPSC Center (GEiC) of Washington University (St. Louis, MO, USA). Sequences targeted by candidate guide RNA (gRNA) sites were analyzed for common (>1%) single nucleotide polymorphisms (SNPs) using the UCSC genome browser, and no common SNPs were detected in the selected four gRNAs for each gene. The targeting sequences of gRNAs are as follows:
5ʹ-GCTTCTGCCGGTACTCATTG-3ʹ, 5ʹ-AATGAGTACCGGCAGAAGCA-3ʹ,
5ʹ-ACGAGGGAGACGGCGAGGTC-3ʹ, 5ʹ-CGAGGGAGACGGCGAGGTCC-3ʹ.
GLIPR2 KO cells with exogenous expression of GLIPR2 were generated by transfection with plasmid pCMV-GLIPR2-MYC [Citation12] using Lipofectamine 2000 (Invitrogen, 11668019) and selection in medium containing 800 ng/mL of geneticin (Gibco, 10131027).
To assess autophagic flux HeLa cells were transfected with plasmid pIRES-GFP-LC3 [Citation12] using Lipofectamine 2000. For Baf A1 treatment, cells were washed with PBS and then treated in culture medium with Baf A1 (50 or 100 nM, 2 h). For peptide treatment, cells were washed with PBS and then treated with peptides (2.5–10 μM, 2 h) dissolved in Opti-MEM (Gibco, 3,985070). For amino acid starvation, cells were washed with PBS and then treated with Hanks’ balanced salt solution HBSS (Sigma-Aldrich, H9269) for 2 h.
HEK293F cells (Sino Biological) were grown in suspension culture in SMM 293-TI medium (Sino Biological, M293TI) supplemented with 1% penicillin-streptomycin at 37°C with 8% CO2.
Primary murine embryonic fibroblasts (MEFs) were isolated from mouse embryos at day E13.5 and cultured as described [Citation35]. Primary MEFs were maintained in DMEM containing 15% fetal bovine serum, 1% penicillin-streptomycin, 120 μM β-mercaptoethanol (Sigma-Aldrich, M7522), and 1× MEM non-essential amino acids (Gibco, 11140050) and passaged no more than four times.
Mouse strains
C57BL/6 J mice were obtained from The Jackson Laboratories (000664). To generate KO mice, gRNAs targeting Glipr2 (NM_027450.3) exon 2 were designed, validated and synthesized (in U6-gRNA vector; Sigma-Aldrich, P03) by Sigma-Aldrich. The targeting sequences of gRNAs are as follows:
5ʹ-TCCAAACAGTTTAATAACG-3ʹ, 5ʹ-GAAGGCCCACAACGAGTAC-3ʹ,
5ʹ-GGCCCAGCACGGTGTCCCG-3ʹ, 5ʹ-GCTTTGTAAGAAGCTCAAC-3ʹ.
Injection of gRNAs and cas9 mRNA (T7-gRNA vector, Sigma-Aldrich) into fertilized eggs from C57BL/6 J mice was performed by the UTSW Transgenic Core Facility. The F1 mice were genotyped by subcloning and sequencing fragments of genomic DNA around the predicted double-strand break site. Genomic DNAs from mice were prepared from mouse tails using DirectPCR Lysis Reagent (VIAGEN Biotech, 101 T) and proteinase K (Roche, 3115828001). PCR was performed using TaKaRa SapphireAmp Fast PCR Master Mix (Clontech, RR350A) with the primer pair GAGCTCTGAAGAGGGTGATG (forward) and GAGTAGGTCCTTAAGTCTGGC (reverse). PCR products were then subcloned into pCRII vector using the TOPO TA Cloning Kit (Thermo Fisher Scientific, K462001) for sequencing with an Sp6 promoter primer. An animal harboring a deletion of 8 bp in exon 2, starting at nucleotide 40 of the coding sequence of Glipr2, was selected for breeding and backcrossed to C57BL/6 J breeders for more than 12 generations. For genotyping, PCR was performed on genomic DNAs from mice with the primer pair GAGCTCTGAAGAGGGTGATG (forward) and GAGTAGGTCCTTAAGTCTGGC (reverse). PCR products were denatured and reannealed and subjected to T7 endonuclease I (NEB, M0302) digestion. Fragments were visualized by agarose gel electrophoresis. The first round of genotyping distinguished Glipr2+/-mice (400-bp band and 200-bp band) from either Glipr2+/+ or glipr2-/- mice (400-bp band only). For the second round of genotyping, samples yielding only 400-bp fragments were mixed with genomic DNA from Glipr2+/+ and subjected to the same PCR procedure and T7 endonuclease I digestion. For Glipr2+/+ mice, only 400-bp bands were observed and for glipr2-/- mice, both 400-bp and 200-bp bands were observed. glipr2-/- mice are viable and fertile. No overt phenotypes were observed for young animals. Among 284 offspring from Glipr2+/-and Glipr2+/- breeding, 82 were Glipr2+/+,137 Glipr2+/-, and 65 glipr2-/-, suggesting that glipr2-/- mice are born at expected Mendelian ratios (Chi-square = 2.39, Chi-square test p > 0.3, df = 2). Glipr2+/+ and glipr2-/- mice were crossed with GFP-LC3 transgenic mice [Citation26] to generate Glipr2+/+:GFP-LC3 and glipr2-/-:GFP-LC3 mice.
All animal procedures were performed in accordance with institutional guidelines and with approval from the UT Southwestern Medical Center Institutional Animal Care and Use Committee.
Fluorescence imaging
HeLa cells were cultured on Nunc Lab-Tek II 4-well glass chamber slides (Thermo Fisher Scientific, 154526). Cells were rapidly fixed with 2% paraformaldehyde (PFA; Electron Microscopy Sciences, 15710) in PBS for 12 min at room temperature and then washed three times with PBS. For GFP-LC3 fluorescence microscopy, chamber slides were mounted with Mounting Medium with DAPI (Vector Laboratories, H1200). For immunofluorescence microscopy, HeLa cells were permeabilized with 0.5% Triton X-100 (Sigma-Aldrich, T9284) in PBS for 3 min at room temperature and blocked with 0.5% bovine serum albumin (BSA; Sigma-Aldrich, A9647) in PBS, stained with mouse anti-WIPI2 (2A2) antibody (Bio-Rad, MCA5780GA) or mouse anti-GOLGA2/GM130 (35) antibody (BD Transduction Laboratories, 610822) for 1 h at room temperature and then washed three times with PBS. Cells were incubated with Alexa Fluor secondary antibodies (Invitrogen, A11029 or A21203) for 1 h at room temperature, washed three times with PBS and mounted with Mounting Medium containing DAPI (Vector Laboratories, H-1200-10) or Hoechst staining (Sigma-Aldrich, B2261). For PtdIns3P fluorescence microscopy, HeLa cells were fixed with 4% PFA in PBS for 20 min at room temperature followed by a single quick wash with DMEM. Cells were permeabilized with PBS containing 0.1% N-lauroylsarcosine sodium (Sigma-Aldrich, L9150) and 2% BSA for 5 min, and then incubated with a PtdIns3P-specific fluorescent probe PX-Alexa555 [Citation17,Citation23] for 15 min. After washing twice with PBS containing 2% BSA, slides were mounted with ProLong Diamond Antifade Mountant with DAPI (Thermo Fisher Scientific, P36962). To minimize fluorescent signal decay, slides were stored at 4°C and imaged on the second day after mounting. Slides were imaged using a 40x or 63x objective on a Zeiss AxioImager Z2 microscope equipped with a Photometrics CoolSnap HQ2 CCD camera. Z-stack images were acquired with the same acquisition settings for samples prepared in each batch of experiment. Z-stack images were deconvolved with AutoDeBlur (Bitplane) and further analyzed with Imaris version 7.4.0 (Bitplane) using the same settings for each batch of samples. Random images were chosen from triplicate samples for each condition for analysis by an observer blinded to experimental condition.
The areas (A) and perimeters (P) of GOLGA2-positive Golgi structures were measured in ImageJ. The GOLGA2 compaction index (the perimeter of a circle with the same area as the object of interest divided by the actual perimeter of the object of interest) was calculated as 2π × (A/π)−2/P [Citation22].
For assessment of autophagy levels in different tissues, Glipr2+/+:GFP-LC3 and glipr2-/-:GFP-LC3 mice (4 mice per group) were treated with either PBS or chloroquine (50 mg kg−1) for 4 h. Mice were perfused with 4% PFA in PBS and tissues were collected and processed for frozen sectioning as described [Citation26]. The mouse tissue sections were imaged using a 63x objective on a Zeiss AxioPlan 2 microscope. The total numbers of GFP-LC3 puncta were counted per 2500 μm2 area (20 randomly chosen fields were used per mouse) and the average value for each tissue for each mouse was determined by an observer blinded to genotype.
For immunofluorescence microscopy of skeletal muscle sections, sections were treated with Liberate Antibody Binding Solution (Polysciences, 24310–500) for 15 min at room temperature and washed three times with PBS. Sections were blocked with 0.5% BSA in PBS, stained with anti-WIPI2 (2A2) antibody (Bio-Rad, MCA5780GA) overnight at 4°C and washed three times with PBS. Sections were incubated with Alexa-Fluor secondary antibodies (Invitrogen, A21203) for 1 h at room temperature, washed three times with PBS, mounted with Mounting Medium (Vector Laboratories), and imaged using a 63x objective on a Zeiss AxioImager Z2 microscope. The total numbers of WIPI2 puncta were counted per 1000 μm2 area (20 randomly chosen fields were used per mouse).
Transmission electron microscopy
HeLa cells were fixed with 2.5% glutaraldehyde (Electron Microscopy Sciences, 16120), post-fixed with 1% OsO4 (Electron Microscopy Sciences, 19150) and embedded in Lx-112 (Ladd Research Industries, Inc., 21210) and Embed-812 (Electron Microscopy Sciences, 14120). Thin sections were cut on an MT-700 RMC, stained with uranyl acetate and lead citrate, and imaged using a JEOL 1200EX or Tecnai Spirit electron microscope equipped with an SIS Morada CCD camera. The lengths of Golgi cisternae were measured in ImageJ. The numbers of autophagic structures were manually counted under electron microscope.
Long-lived protein degradation assay
Long-lived protein degradation assays were performed as described [Citation36] with modifications. HeLa cells were cultured in 12-well plates in triplicate wells. When confluency was reached, cells were labeled in culture medium containing 0.1 μCi/mL 14C-L-valine (PerkinElmer, NEC291EU050UC) for 24 h. Cells were then washed three times with PBS and pre-chased for 1 h in culture medium containing 10 mM cold L-valine (Sigma-Aldrich, V0513) to allow short-lived protein degradation. Cells were chased for another 1 or 2 h in 500 μL culture medium containing 10 mM cold L-valine, in the absence or presence of 50 nM Baf A1. To each well 100 μL 2% BSA and 400 μL 25% trichloroacetic acid (TCA; Sigma-Aldrich, T0699) were added to precipitate intact proteins. After overnight precipitation at 4°C, the solution in each well was centrifuged at 16,000 x g for 10 min and the supernatant was transferred to a scintillation vial (TCA-soluble fraction, S). KOH (500 μL of 0.2 M) was added to each pellet after centrifugation and to the remaining protein precipitates in the well, respectively. After solubilization for 1 h at room temperature, KOH-solubilized solutions were combined and transferred to a scintillation vial (TCA-insoluble fraction, I). Five mL 3a70B Complete Counting Cocktail (RPI, 111154) was added to each sample and radioactivity was measured using a Tri-Carb 2910TR liquid scintillation analyzer (PerkinElmer). For each sample, the percentage of long-lived protein degradation (D) was calculated as the radioactivity in S/(radioactivity in S + radioactivity in I). The degradation rate of long-lived protein for each condition in each independent experiment was calculated as (D at 2 h- D at 1 h)/(2 h − 1 h) from triplicates.
Immunoblotting
For western blot analysis, cells or frozen tissues were lysed in ice-cold lysis buffer (50 mM Tris-HCl, pH 7.5, 150 mM NaCl, 1 mM EDTA, 1% Triton X-100) with cOmplete, mini protease (Roche, 1183617001) and Halt phosphatase inhibitor cocktail (Thermo Fisher Scientific, 78427) for 30 min at 4°C. Lysates were centrifuged at 16,000 × g for 30 min. Cleared lysates were diluted in 2× SDS-PAGE loading buffer, denatured for 10 min at 100°C, separated on 4–20% Mini-PROTEAN TGX precast protein gels (Bio-Rad, 4561096) and transferred to PVDF membranes (Bio-Rad, 1620255). The following antibodies were used for immunodetection: mouse anti-SQSTM1/p62 (2C11; Abnova, H00008878-M01), rabbit anti-LC3B (Novus Biologicals, NB100-2220), mouse anti-ACTB/actin (C4)-HRP (Santa Cruz Biotechnology, sc-47778 HRP) and rabbit anti-GLIPR2 [Citation11] (gift of D.V. Kaloyanova, University of Utrecht). Protein bands were visualized with Pierce ECL Plus Western Blotting Substrate (Thermo Fisher Scientific, 32134) on a ChemiDoc imaging system (Bio-Rad) or Light Labs Ultra Blue X-ray film (Light Labs) within the linear range. Densitometry analysis of protein bands was performed using ImageJ.
Protein purification
Wild-type GLIPR2 and H54A E86A G102K H103A N138G mutants in pGEX-6P-1 vectors (GE healthcare, 28–9546-48) were purified from E. coli as described previously [Citation20]. GST was removed with PreScission protease (GE healthcare, 27–0843-01).
The plasmids of human PtdIns3K-C1 subunits (pCAG-OSF-ATG14L, pCAG-NT-P150, pCAG-NT-VPS34 and pCAG-NT-BECN1) were described previously [Citation24]. HEK293F cells (Sino Biological) were grown in suspension culture in SMM 293-TI medium (Sino Biological, M293TI) supplemented with 1% penicillin-streptomycin at 37°C with 8% CO2. When the cell density reached 1.0 × 10⁶ cells/mL, the four plasmids for PtdIns3K-C1 were co-transfected into HEK293F cells with PEI (Polysciences, 23966). For every 1 L culture, 0.5 mg of each plasmid (totaling 2 mg) and 3 mg PEI were used.
The cells were harvested 72 h after transfection and lysed in buffer containing 20 mM Tris-HCl, pH 8.0, 150 mM NaCl, 1 mM DTT, 1% Triton X-100 and protease inhibitor cocktail (Roche, 1183617001). After centrifugation at 13,000 x g for 30 min at 4°C and filtration through a 0.45-μm filter (Millipore, SLHV033RS), the supernatant was loaded onto a StrepTactin Sepharose High Performance (GE Healthcare, 28–9355-99) column with a peristaltic pump. The column was then washed with buffer containing 100 mM Tris-HCl, pH 8.0, 300 mM NaCl, 1 mM DTT. The Strep-tagged PtdIns3K-C1 proteins were eluted with buffer containing 20 mM Tris-HCl, pH 8.0, 150 mM NaCl, 1 mM DTT, 10 mM desthiobiotin (Sigma-Aldrich, D1411). Protein eluates were pooled together and concentrated with a 100 kDa cutoff Amicon centrifugal filter (Millipore, UFC510096) prior to gel filtration on a Superose6 Increase 3.2/300 (GE Healthcare, 29–0915-98) column equilibrated with gel filtration buffer containing 20 mM Tris-HCl, pH 8.0, 150 mM NaCl, 1 mM DTT. All the above operations were executed in a 4°C cold room. Peak fractions of purified PtdIns3K-C1 were snap-frozen in liquid nitrogen and stored at −80°C in aliquots for subsequent assays.
In vitro affinity-isolation assay
PtdIns3K-C1 immobilized on Strep-Tactin Sepharose (IBA, 2–1201-010), Streptavidin Agarose (GenScript, L00353) or empty resins were incubated with GLIPR2 variants in binding buffer (PBS with 0.5% Triton X-100) for 1 h at 4°C. The resins were then washed four times with binding buffer and analyzed by SDS-PAGE and Coomassie Brilliant Blue staining using SimplyBlue Safe Stain (Thermo Fisher Scientific, LC6060), or analyzed by western blotting using rabbit anti-BECN1 (H-300; Santa Cruz Biotechnology, sc-11427) and rabbit anti-GLIPR2 [Citation11].
Lipid kinase assays
PtdIns-containing liposomes were composed of 30% phosphatidylcholine (POPC; Avanti Polar Lipids, 850457), 55% phosphatidylethanolamine (DOPE; Avanti Polar Lipids, 850725), 15% bovine liver PtdIns (Avanti Polar Lipids, 840042). Lipid components were mixed together in 1:1 (vol:vol) chloroform:methanol and dried in glass tubes under a stream of nitrogen. The lipid film was further vacuum-dried for 60 min at room temperature and then rehydrated into liposome buffer (10 mM Tris-HCl, pH 8.0, 100 mM NaCl, 1 mM DTT). Suspended lipids were subjected to 10 cycles of freeze and thaw between liquid nitrogen and a 42°C water bath, and then extruded 21 times through polycarbonated filters (Avanti Polar Lipids, 610005) with pore sizes of 100 nm to form small unilamellar vesicles. Liposomes were stored in glass vials at 4°C and used for in vitro lipid kinase assay within three days.
Liposomes (1.6 mM) were incubated with 80 nM PtdIns3K-C1 in the absence and presence of 10 µM GLIPR2 variants, 10 µM Tat-BECN1 active peptide or inactive mutant F270S, 100 nM PIK-III (PIK3C3/VPS34 inhibitor) or 0.6% CHAPS (RPI, C41010), for 30 min at 37°C in liposome buffer with 5 mM MgCl2 before 50 µM ATP (Promega, V915A) was added for 30 min at 37°C to start the kinase reaction. Upon completion of the reaction, lipid samples were extracted with methyl chloride:methanol (2:1), air dried and then processed as described [Citation37] prior to HPLC analysis. Samples were resuspended in 0.5 mL of 40% methylamine: water: n-butanol: methanol (36:8:9:47) solution, incubated for 45 min at 5°C, dried in a vacuum centrifuge, and resuspended in 0.5 mL of n-butanol:petroleum ether:ethyl formate (20:40:1). The deacylated lipids were recovered by addition of 0.5 mL water, vortexing, centrifugation, and collection of the aqueous phase. The butanol phase was re-extracted with 0.5 mL water. The second aqueous phase was combined with the first, and the pool was vacuum-dried. The deacylated lipid headgroups were resuspended in water and analyzed by a TSQ Quantiva mass spectrometer (Thermo Fisher Scientific) at Tsinghua University Technology Center of Protein Research Proteomics and Metabolomics Platform. Peaks are presented as molar percentage of the charged lipids detected by the system. The retention time (RT) for PtdInsP is 10.3, PtdIns 3.3. The ratio of PtdInsP/(PtdIns+ PtdInsP) were calculated to measure the lipid kinase activity of PtdIns3K-C1.
Lipid flotation assay
PtdIns3K-C1 (20 nM) and 0.5 mM PtdIns-containing liposomes (15%) in the absence and presence of 1 μM GLIPR2 variants, 1 µM Tat-BECN1 active peptide or inactive mutant F270S were incubated for 30 min at 37°C in liposome buffer (10 mM Tris-HCl, pH 8.0, 100 mM NaCl, 1 mM DTT) in a 200-μL reaction system. The mixture was added to 60% (w:v) sucrose (Sigma- Aldrich, S0389) to generate a 400-μL protein-liposome solution with a final concentration of 30% sucrose and loaded into a centrifuge tube. Then, 160 μL 25% sucrose, 160 μL 20% sucrose and 80 μL liposome buffer were sequentially overlaid onto the protein-liposome solution in a thick-wall polycarbonate tube (Beckman, 343778). After centrifugation in a TLS-55 rotor (Beckman) at 259,000 x g for 1 h at 4°C, a total of 4 fractions (200 μL/fraction) were collected from each sample and subjected to SDS-PAGE and analyzed by western blotting using rabbit anti-BECN1 (H-300) (Santa Cruz Biotechnology, sc-11427) and rabbit anti-PIK3C3VSP34 (D9A5; Cell Signaling Technology, 42635). Protein bands were visualized with Pierce ECL Plus Western Blotting Substrate (Thermo Fisher Scientific, 32134) on a ChemiDoc imaging system (Bio-Rad) within the linear range. Densitometry analysis of protein bands was performed using ImageJ. Percentage of proteins in liposome-containing fraction 1 in each condition was calculated.
Quantitative real-time PCR
Normalized cDNAs of mouse tissues were obtained from Mouse Multiple Tissue cDNA (MTC) Panel I (Takara Bio, 636745). Primer pairs for Glipr2 were ATGGGCAAATCAGCTTCCAAA (forward) and GCTTCCCGGTTGAGCTTCTT (reverse), which amplify a 116 bp fragment. Quantitative real-time PCR was performed using the QuantiFast SYBR Green PCR kit (Qiagen, 204054) and detected using a 7500 Fast Real-Time PCR System (Applied Biosystems).
Renal clear cell carcinoma survival analysis
The Cancer Genome Atlas Project (TCGA) provisional dataset of renal clear cell carcinoma mRNA gene expression and clinical data was downloaded from www.cBioPortal.org. TCGA RNASeqV2 gene expression was measured using the Illumina HiSeq RNA Sequencing platform and normalized using RSEM (RNA-Seq by Expectation-Maximization). Five hundred thirty-three patients were grouped based on the mRNA expression of GLIPR2, with the upper 50% and lower 50% representing the high and low expression groups, respectively. Survival curves of the two groups were estimated by the Kaplan–Meier method and the log-rank test was used to compare differences in the overall survival curves of the two groups.
Buried food test
The buried food test was performed as described [Citation38] with modifications. Middle-aged (14–17 months old) male mice were transferred to clean home cages without chow pellet. After food deprivation for 24 h, each subject animal was weighed and introduced to a clean test cage containing 3-cm deep clean bedding. The subject was allowed to acclimate to the cage for 5 min before transferring to another empty clean “waiting” cage. A chow pellet (Envigo, 2016S) was quickly buried approximately 1 cm beneath the surface of bedding in a random corner of the test cage. The subject was then re-introduced to the test cage. The latency to find and eat the buried pellet was recorded by an observer 2 m away from the test cage.
Statistical analysis
Experimental results were analyzed by Excel or GraphPad Prism7 (GraphPad Software) software and presented as Mean ± SEM, for the indicated (n) independent experiments or samples. Data were further analyzed with unpaired, two-tailed Student’s t-test for two group comparisons if not specified otherwise, one-way ANOVA with Dunnett’s or Tukey’s test for multiple comparisons. For Kaplan-Meier survival curve, log-rank test was performed.
Supplemental Material
Download Zip (163.8 KB)Acknowledgments
We thank H.Wang and Y. Li for help on protein complex purification; X. Liu for helpful discussions on mass spectrometry analyses; N. Ktistakis, D.V. Kaloyanova and N. Mizushima for providing critical reagents; B. Ci for help with analyses of TCGA data; and H. Smith for assistance with manuscript preparation.
Disclosure statement
B.L. was a Scientific Co-Founder of Casma Therapeutics, Inc.
Supplementary material
Supplemental data for this article can be accessed here.
Additional information
Funding
Related Research Data
References
- Hurley JH, Young LN. Mechanisms of autophagy initiation. Annu Rev Biochem. 2017;86:225–244.
- Levine B, Liu R, Dong XN, et al. Beclin orthologs: integrative hubs of cell signaling, membrane trafficking, and physiology. Trends Cell Biol. 2015;25:533–544.
- Fernandez AF, Sebti S, Wei YJ, et al. Disruption of the beclin 1-BCL2 autophagy regulatory complex promotes longevity in mice. Nature. 2018;558:136–140.
- Rocchi A, Yamamoto S, Ting T, et al. A Becn1 mutation mediates hyperactive autophagic sequestration of amyloid oligomers and improved cognition in Alzheimer’s disease. Plos Genet. 2017;13(8):e1006962.
- Vega-Rubin-de-Celis S, Zou ZJ, Fernandez AF, et al. Increased autophagy blocks HER2-mediated breast tumorigenesis. Proc Natl Acad Sci U S A. 2018;115:4176–4181.
- Levine B, Kroemer G. Biological functions of autophagy genes: a disease perspective. Cell. 2019;176:11–42.
- Nakamura S, Oba M, Suzuki M, et al. Suppression of autophagic activity by Rubicon is a signature of aging. Nat Commun. 2019;10:847.
- Joachim J, Jefferies HBJ, Razi M, et al. Activation of ULK kinase and autophagy by GABARAP trafficking from the centrosome is regulated by WAC and GM130. Mol Cell. 2015;60:899–913.
- Zhang XY, Wang LB, Lak B, et al. GRASP55 senses glucose deprivation through O-GlcNAcylation to promote autophagosome-lysosome fusion. Dev Cell. 2018;45:245–261.
- Zhang XY, Wang LB, Ireland SC, et al. GORASP2/GRASP55 collaborates with the PtdIns3K UVRAG complex to facilitate autophagosome-lysosome fusion. Autophagy. 2019;15:1787–1800.
- Eberle HB, Serrano RL, Fullekrug J, et al. Identification and characterization of a novel human plant pathogenesis-related protein that localizes to lipid-enriched microdomains in the Golgi complex. J Cell Sci. 2002;115:827–838.
- Shoji-Kawata S, Sumpter R, Leveno M, et al. Identification of a candidate therapeutic autophagy-inducing peptide. Nature. 2013;494:201–206.
- Peraro L, Zou ZJ, Makwana KM, et al. Diversity-oriented stapling yields intrinsically cell-penetrant inducers of autophagy. J Am Chem Soc. 2017;139:7792–7802.
- Forte M, Bianchi F, Cotugno M, et al. Pharmacological restoration of autophagy reduces hypertension-related stroke occurrence. Autophagy. 2020;16(8):1468-1481
- Noda NN, Kobayashi T, Adachi W, et al. Structure of the novel c-terminal domain of vacuolar protein sorting 30/autophagy-related protein 6 and its specific role in autophagy. J Biol Chem. 2012;287:16256–16266.
- Huang WJ, Choi WY, Hu WQ, et al. Crystal structure and biochemical analyses reveal Beclin 1 as a novel membrane binding protein. Cell Res. 2012;22:473–489.
- Rostislavleva K, Soler N, Ohashi Y, et al. Structure and flexibility of the endosomal Vps34 complex reveals the basis of its function on membranes. Science. 2015;350:aac7365.
- Ohashi Y, Tremel S, Masson GR, et al. Membrane characteristics tune activities of endosomal and autophagic human VPS34 complexes. Elife. 2020;9:e58281.
- Chang CM, Young LN, Morris KL, et al. Bidirectional Control of Autophagy by BECN1 BARA Domain Dynamics. Mol Cell. 2019;73:339–353.
- Li Y, Zhao YT, Su MF, et al. Structural insights into the interaction of the conserved mammalian proteins GAPR-1 and Beclin 1, a key autophagy protein. Acta Crystallogr D. 2017;73:775–792.
- Polson HEJ, de Lartigue J, Rigden DJ, et al. Mammalian Atg18 (WIPI2) localizes to omegasome-anchored phagophores and positively regulates LC3 lipidation. Autophagy. 2010;6(4):506–522.
- Narendra DP, Kane LA, Hauser DN, et al. p62/SQSTM1 is required for Parkin-induced mitochondrial clustering but not mitophagy; VDAC1 is dispensable for both. Autophagy. 2010;6:1090–1106.
- Axe EL, Walker SA, Manifava M, et al. Autophagosome formation from membrane compartments enriched in phosphatidylinositol 3-phosphate and dynamically connected to the endoplasmic reticulum. J Cell Biol. 2008;182:685–701.
- Ma MS, Liu JJ, Li Y, et al. Cryo-EM structure and biochemical analysis reveal the basis of the functional difference between human PI3KC3-C1 and-C2. Cell Res. 2017;27:989–1001.
- Dowdle WE, Nyfeler B, Nagel J, et al. Selective VPS34 inhibitor blocks autophagy and uncovers a role for NCOA4 in ferritin degradation and iron homeostasis in vivo. Nat Cell Biol. 2014 Nov;16(11):1069–1079.
- Mizushima N, Yamamoto A, Matsui M, et al. In vivo analysis of autophagy in response to nutrient starvation using transgenic mice expressing a fluorescent autophagosome marker. Mol Biol Cell. 2004;15:1101–1111.
- Chang CM, Young LN, Hurley JH. The BARA necessities of PtdIns 3-kinase activation in autophagy. Autophagy. 2019;15:1122–1123.
- Young ARJ, Chan EYW, Hu XW, et al. Starvation and ULK1-dependent cycling of mammalian Atg9 between the TGN and endosomes. J Cell Sci. 2006;119:3888–3900.
- Huang SG, Liu F, Niu Q, et al. GLIPR-2 overexpression in HK-2 cells promotes cell EMT and migration through ERK1/2 activation. Plos One. 2013;8:e58574.
- Huang SG, Zhang LL, Niu Q, et al. Hypoxia promotes epithelial - mesenchymal transition of hepatocellular carcinoma cells via inducing GLIPR-2 expression. Plos One. 2013;8:e77497.
- Zhou Q, Hao L, Huang WR, et al. The Golgi-associated plant pathogenesis-related protein GAPR-1 enhances type i interferon signaling pathway in response to toll-like receptor 4. Inflammation. 2016;39:706–717.
- Li S, Zhang HY, Du ZX, et al. Induction of epithelial-mesenchymal transition (EMT) by Beclin 1 knockdown via posttranscriptional upregulation of ZEB1 in thyroid cancer cells. Oncotarget. 2016;7:70364–70377.
- Heckmann BL, Teubner BJW, Boada-Romero E, et al. LC3-associated endocytosis facilitates beta-amyloid clearance mitigates neurodegeneration in murine Alzheimer’s disease. Cell. 2019;178:536–551.
- Piva F, Giulietti M, Santoni M, et al. Epithelial to mesenchymal transition in renal cell carcinoma: implications for cancer therapy. Mol Diagn Ther. 2016;20:111–117.
- Su T, Suzui M, Wang L, et al. Deletion of histidine triad nucleotide-binding protein 1/PKC-interacting protein growth in mice enhances cell growth and carcinogenesis. Proc Natl Acad Sci U S A. 2003;100:7824–7829.
- Pattingre S, Tassa A, Qu X, et al. Bcl-2 antiapoptotic proteins inhibit Beclin 1-dependent autophagy. Cell. 2005 Sep 23;122(6):927–939.
- Pan WJ, Choi SC, Wang H, et al. Wnt3a-mediated formation of phosphatidylinositol 4,5-bisphosphate regulates LRP6 phosphorylation. Science. 2008;321:1350–1353.
- Yang M, Crawley JN. Simple behavioral assessment of mouse olfaction. Curr Protoc Neurosci. 2009;48(1). Chapter 8:Unit8.24. DOI:https://doi.org/10.1002/0471142301.ns0824s48