
ABSTRACT
The pathogenetic mechanism of contrast-induced acute kidney injury (CI-AKI), which is the third most common cause of hospital-acquired AKI, has not been elucidated. Previously, we demonstrated that renal injury and cell apoptosis were attenuated in nlrp3 knockout CI-AKI mice. Here, we investigated the mechanism underlying NLRP3 inhibition-mediated attenuation of apoptosis in CI-AKI. The RNA sequencing analysis of renal cortex revealed that the nlrp3 or casp1 knockout CI-AKI mice exhibited upregulated cellular response to hypoxia, mitochondrial oxidation, and autophagy when compared with the wild-type (WT) CI-AKI mice, which indicated that NLRP3 inflammasome inhibition resulted in the upregulation of hypoxia signaling pathway and mitophagy. The nlrp3 or casp1 knockout CI-AKI mice and iohexol-treated HK-2 cells with MCC950 pretreatment exhibited upregulated levels of HIF1A, BECN1, BNIP3, and LC3B-II, as well as enhanced colocalization of LC3B with BNIP3 and mitochondria, and colocalization of mitochondria with lysosomes. Additionally, roxadustat, a HIF prolyl-hydroxylase inhibitor, protected the renal tubular epithelial cells against iohexol-induced injury through stabilization of HIF1A and activation of downstream BNIP3-mediated mitophagy in vivo and in vitro. Moreover, BNIP3 deficiency markedly decreased mitophagy, and also significantly exacerbated apoptosis and renal injury. This suggested the protective function of BNIP3-mediated mitophagy in CI-AKI. This study elucidated a novel mechanism in which NLRP3 inflammasome inhibition attenuated apoptosis and upregulated HIF1A and BNIP3-mediated mitophagy in CI-AKI. Additionally, this study demonstrated the potential applications of MCC950 and roxadustat in clinical CI-AKI treatment.
Abbreviations: BNIP3: BCL2/adenovirus E1B interacting protein 3; Ctrl: control; DAPI: 4′,6-diamidino-2-phenylindole dihydrochloride; EGLN2/PHD1: egl-9 family hypoxia-inducible factor 2; HIF1A: hypoxia inducible factor 1, alpha subunit; H-E: hematoxylin and eosin; IL18: interleukin 18; IL1B: interleukin 1 beta; LAMP1: lysosomal-associated membrane protein 1; MAP1LC3B/LC3B: microtubule-associated protein 1 light chain 3 beta; mRNA: messenger RNA; NFKB/NF-κB: nuclear factor of kappa light polypeptide gene enhancer in B cells; NLRP3: NLR family, pyrin domain containing 3; NS: normal saline; PRKN/Parkin: parkin RBR E3 ubiquitin protein ligase; PINK1: PTEN induced putative kinase 1; RNA: ribonucleic acid; SEM: standard error of the mean; siRNA: small interfering RNA; TEM: transmission electron microscopy; TUBA/α-tubulin: tubulin, alpha; TUNEL: terminal deoxynucleotidyl transferase-mediated dUTP nick end labeling; VDAC: voltage-dependent anion channel; WT: wild-type
Introduction
The intravascular administration of contrast media can result in contrast-induced acute kidney injury (CI-AKI), which is reported to be the third most common cause of hospital-acquired acute kidney injury (AKI) [Citation1]. Patients with diabetes mellitus or chronic kidney disease and aged individuals are susceptible to CI-AKI, which is associated with poor clinical outcomes [Citation2]. Recent studies have demonstrated that routine antioxidant and alkaline therapies are not beneficial for patients with CI-AKI [Citation3]. The pathogenetic mechanisms of CI-AKI have not been completely elucidated. Previous studies have reported that the etiological factors of CI-AKI involve the cytotoxic effect of iodinated contrast media-induced oxidative stress, endothelial damage, and vasoconstrictor secretion on the renal tubular epithelial cells [Citation1]. Thus, elucidating the molecular mechanisms underlying CI-AKI will aid in the development of novel preventive and therapeutic strategies.
NLRP3 (NLR family, pyrin domain containing 3) inflammasome is reported to be activated in the AKI and chronic kidney disease (CKD) mouse models and human kidney diseases [Citation4–8]. Previously, we reported that NLRP3 inflammasome activation and the consequent secretion of IL1B (interleukin 1 beta) and IL18 exacerbate renal injury and apoptosis in the in vivo and in vitro CI-AKI models [Citation9,Citation10]. The inhibition of NLRP3 inflammasome alleviates kidney injury through the attenuation of inflammation, infection, and vascular damage [Citation11–13]. However, NLRP3 inflammasome is also reported to regulate mitochondrial homeostasis [Citation14–16]. Yu et al. demonstrated that CASP1 (caspase 1), which is activated by NLRP3 inflammasome, downregulates mitophagy and exacerbates mitochondrial damage through the cleavage of PRKN (parkin RBR E3 ubiquitin protein ligase) [Citation14]. In the lungs, NLRP3 deficiency promotes macroautophagy/autophagy, which aids in maintaining mitochondrial homeostasis [Citation15]. Kim et al. reported that the function of inflammasome-independent NLRP3 involves inhibition of mitophagy and regulation of mitochondrial function in unilateral ureter obstruction (UUO) [Citation16]. The role of NLRP3 inflammasome in regulating mitophagy in AKI is unknown.
Mitophagy, which contributes to the maintenance of mitochondrial homeostasis by degrading the damaged mitochondria, is involved in renal cell survival and kidney function stabilization [Citation17]. The PRKN-dependent and PRKN-independent pathways mediate mitophagy [Citation18]. Mitophagy is reported to protect against ischemia-reperfusion-induced [Citation19] and cisplatin-induced AKI [Citation20]. Previously, we demonstrated that mitophagy protects against CI-AKI [Citation10] using the pink1 or prkn knockout mice. The PRKN-independent mitophagy pathway, which is mostly mediated by BNIP3 (BCL2/adenovirus E1B interacting protein 3), is reported to protect the renal tubular epithelial cells against ischemia-reperfusion injury through mitochondrial quality control [Citation21]. This study aimed to examine the role of NLRP3 inflammasome in regulating mitophagy by knocking out nlrp3 or casp1 in the CI-AKI mouse model. Additionally, the signaling pathway regulated by NLRP3 inflammasome in the CI-AKI mouse model was identified using RNA sequencing to examine the potential therapeutic targets for CI-AKI.
Results
NLRP3 or CASP1 deficiency alleviated iohexol-induced renal injury and apoptosis
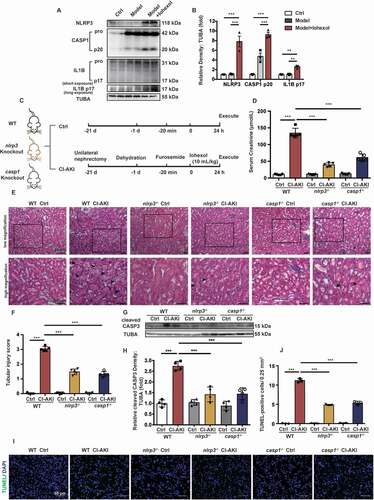
Previously, we reported the procedure for the construction of CI-AKI mouse model. The mice were subjected to unilateral nephrectomy, dehydration, furosemide treatment, and low-osmolar nonionic monomer iohexol (10 mL/kg bodyweight) through the tail vein to generate the CI-AKI model [Citation9,Citation10,Citation22]. Iohexol upregulated the expression of NLRP3, CASP1 p20, and IL1B p17, which suggested that NLRP3 inflammasome was activated in the kidneys of CI-AKI mice (). The role of NLRP3 inflammasome in CI-AKI was examined using the nlrp3 knockout (nlrp3−/−) and casp1 knockout (casp1−/−) mice (). The serum creatinine levels in the wild-type (WT) CI-AKI mice (134.2 ± 6.484 μmol/L) were higher than that in the nlrp3−/− (39.2 ± 2.728 μmol/L) and casp1−/− CI-AKI mice (61.2 ± 4.630 μmol/L) (). Hematoxylin and eosin (H-E) staining revealed that the renal cortex of CI-AKI mice exhibited intraepithelial vacuolar degeneration and interstitial inflammation. The intraepithelial vacuolar degeneration, interstitial inflammation, and tubular injury score in the renal cortex of the nlrp3−/− or casp1−/− CI-AKI mice were lower than that in the renal cortex of the WT CI-AKI mice (). Next, apoptosis in the renal tissues of the WT, nlrp3−/−, and casp1−/− CI-AKI mice was examined. Immunoblotting analysis revealed that iohexol upregulated the expression of cleaved CASP3 (caspase 3), a proapoptotic protein. Compared with those in the WT CI-AKI mice, the cleaved CASP3 levels were lower in the nlrp3−/− and casp1−/− CI-AKI mice (). Consistent with the results of immunoblotting analysis, the results of terminal deoxynucleotidyl transferase-mediated dUTP nick end labeling (TUNEL) assay revealed that the number of apoptotic renal tubular epithelial cells in the nlrp3−/− or casp1−/− CI-AKI mice was lower than that in the WT CI-AKI mice (, and Fig. S1A). These findings suggested that NLRP3 inflammasome was activated in the CI-AKI mice and that the knockout of nlrp3 or casp1 alleviated iohexol-induced renal injury and apoptosis.
Figure 1. NLRP3 or CASP1 deficiency alleviated iohexol-induced renal injury and apoptosis. Unilateral nephrectomy, dehydration, furosemide (10 mL/kg, tail vein) were used to establish mice model. CI-AKI mice were established by iohexol (10 mL/kg bodyweight; injected through the tail vein, Model+Iohexol), and negative control group was injected with the same volume of normal saline (Model). (A and B) Immunoblotting analysis and quantification of NLRP3, CASP1 p20, IL1B p17. (C) Diagrammatic representation of Ctrl and CI-AKI in different groups of mice: WT(C57BL/6), nlrp3 and casp1 knockout. (D) The renal function was evaluated by serum creatinine. (E and F) Representative histology and pathological tubular injury score in the renal cortex by H-E staining. The tubular injury was indicated by arrows. Scale bar: 50 μm. (G and H) Immunoblotting analysis and quantification of cleaved CASP3. (I and J) Apoptosis was also evaluated by TUNEL staining and quantification of TUNEL-positive cells. Scale bar: 50 μm. Data were presented as mean ± SEM. n = 3–5. *p < 0.05, **p < 0.01, ***p < 0.001
nlrp3 and casp1 knockout affected mitochondria, autophagy, response to hypoxia, and reactive oxygen species (ROS) production.
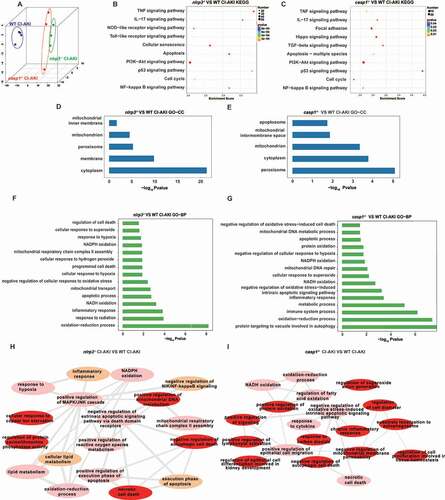
The renal cortex of the WT, nlrp3−/−, and casp1−/− CI-AKI mice was subjected to RNA sequencing to identify the signaling pathways regulating by NLRP3 inflammasome in CI-AKI (3 samples per experimental group). Principal component analysis (PCA) revealed distinct gene expression between nlrp3−/− and WT CI-AKI mice, and between casp1−/− and WT CI-AKI mice (). The Kyoto Encyclopedia of Genes and Genomes (KEGG) pathway analysis of differentially expressed genes (DEGs) between the nlrp3−/− CI-AKI and WT CI-AKI mice revealed that the downregulated genes were significantly enriched in the pathways regulating TNF signaling, apoptosis, NFKB signaling, PI3K-AKT signaling, and cell cycle (). Additionally, the analysis of DEGs between the casp1−/− CI-AKI and WT CI-AKI mice revealed that the downregulated genes were significantly enriched in the pathways regulating PI3K-AKT signaling, NFKB signaling, and apoptosis (). The KEGG pathway analysis indicated that the inhibition of NLRP3 inflammasome decreases inflammation and promotes autophagy. The Gene Ontology (GO) analysis of the cellular component (CC) ontology revealed that both NLRP3 and CASP1 regulated the mitochondrial function in the CI-AKI mice (). Additionally, the DEGs between the WT CI-AKI and nlrp3−/− CI-AKI mice were enriched in the biological process (BP) of oxidation-reduction, apoptosis, and cellular response to hypoxia and superoxide (), while those between the WT CI-AKI and casp1−/− CI-AKI mice were enriched in the BP of vacuole targeting of autophagy-related proteins, oxidation-reduction, cellular response to superoxide, and apoptosis (). The GO enrichment maps of DEGs between the nlrp3−/− or casp1−/− CI-AKI and WT CI-AKI mice indicated that NLRP3 inhibition mitigates apoptosis through the regulation of cellular response to hypoxia, mitochondrial oxidation, and autophagy (). Previous studies on the cellular response to hypoxia have revealed that hypoxia can regulate mitophagy and apoptosis [Citation23,Citation24]. Thus, we examined the roles of HIF1A and its downstream effector (BNIP3) in mitophagy to evaluate the role of NLRP3 inflammasome in apoptosis.
Figure 2. Renal cortex RNA-sequencing analysis of the WT, nlrp3−/− and casp1−/- CI-AKI mice. (A) PCA of RNA-sequencing results comparing nlrp3−/− or casp1−/- CI-AKI mice with WT CI-AKI mice. (B and C) KEGG analysis in nlrp3−/− versus WT CI-AKI and casp1−/- versus WT CI-AKI groups. GO set enrichment analysis on CC (D and E) and BP (F and G) comparing nlrp3−/− or casp1−/- with WT CI-AKI mice. (H and I) GO enrichment map of genes with nlrp3−/− versus WT CI-AKI, casp1−/- CI-AKI versus WT CI-AKI. n = 3
Iohexol promoted mitophagy in the renal tubular epithelial cells through HIF1A and BNIP3
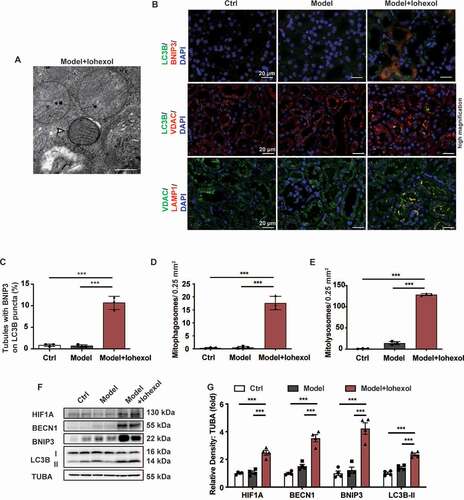
To verify the results of RNA sequencing, the role of HIF1A and BNIP3 in mitophagy was examined using the WT mice. Transmission electron microscopy (TEM) analysis revealed the formation of mitophagosomes in the renal tubular epithelial cells of the WT CI-AKI mice (). Immunofluorescence analysis revealed the enhanced colocalization of LC3B with BNIP3 and VDAC, as well as the enhanced colocalization of VDAC with LAMP1 in the renal tubules of the WT CI-AKI mice. The renal tubules exhibiting enhanced expression of BNIP3 were associated with an increased number of mitophagosomes and mitolysosomes (, and Fig. S2A) [Citation25]. The expression levels of HIF1A, BECN1, BNIP3, and LC3B-II were upregulated in the renal cortex of the WT CI-AKI mice (). This indicated that iohexol promoted mitophagy through the activation of HIF1A and BNIP3 in the renal tubular epithelial cells.
Figure 3. Iohexol promoted mitophagy in the renal tubular epithelial cells through HIF1A and BNIP3. (A) Representative TEM images of a mitophagosome (arrow) in renal tubular epithelial cells in CI-AKI. Scale bar: 500 nm. (B-E) The colocalization of BNIP3 and autophagic flux was showed by immunofluorescence and quantification of BNIP3 and LC3B (autophagy marker). Mitophagosomes and Mitolysosomes were evaluated by LC3B and VDAC (mitochondrial marker), VDAC and LAMP1 (lysosomal marker), respectively. Scale bar: 20 μm. (F and G) Immunoblotting analysis and quantification of HIF1A, BECN1, BNIP3, LC3B-II. Data were presented as mean ± SEM. n = 3–4. *p < 0.05, **p < 0.01, ***p < 0.001
NLRP3 or CASP1 deficiency attenuated mitochondrial injury in the CI-AKI mice through HIF1A and BNIP3-mediated mitophagy
The effect of NLRP3 deficiency on the HIF1A and BNIP3-mediated mitophagy was examined. The expression levels of HIF1A, BECN1, BNIP3, and LC3B-II in the renal cortex of the nlrp3−/− or casp1−/− CI-AKI mice were higher than that in the renal cortex of the WT CI-AKI mice (). Consistent with immunoblotting analysis, the results of immunofluorescence analysis revealed that the expression levels of BNIP3 and LC3B in the nlrp3−/− or casp1−/− CI-AKI mice were higher than those in the WT CI-AKI mice. Additionally, the nlrp3−/− and casp1−/− CI-AKI mice exhibited enhanced colocalization of LC3B with BNIP3 and VDAC, as well as enhanced colocalization of VDAC with LAMP1. This indicated that NLRP3 or CASP1 deficiency promoted the BNIP3-mediated formation of mitophagosomes and mitolysosomes ( and Fig. S2B). The renal tubular epithelial cells of the WT CI-AKI mice exhibited an increased number of mitophagosomes and enhanced mitochondrial damage (mitochondrial swelling and loss of mitochondrial cristae), compared to WT Ctrl mice. The mitophagosomes were increased and the pathological changes of mitochondria were alleviated in the nlrp3−/− and casp1−/− CI-AKI mice (). This indicated that inhibition of NLRP3 inflammasome upregulated HIF1A and BNIP3-mediated mitophagy, and alleviated mitochondrial damage in CI-AKI.
Figure 4. NLRP3 or CASP1 deficiency attenuated mitochondrial injury in the CI-AKI mice through HIF1A and BNIP3-mediated mitophagy. (A and B) Immunoblotting analysis and quantification of HIF1A, BECN1, BNIP3, LC3B-II. (C-F) Representative images and quantification of immunofluorescence double-labeling of LC3B and BNIP3, LC3B and VDAC, VDAC and LAMP1. Scale bar: 20 μm. (G) Representative TEM images of mitochondrial morphology in renal tubular epithelial cells of Ctrl and CI-AKI groups of WT, nlrp3−/−, casp1−/- mice. Mitophagosomes were indicated by arrows. Scale bar: 500 nm. (H and I) Immunoblotting analysis and quantification of EGLN2. Data were presented as mean ± SEM. n = 3–4. *p < 0.05, **p < 0.01, ***p < 0.001
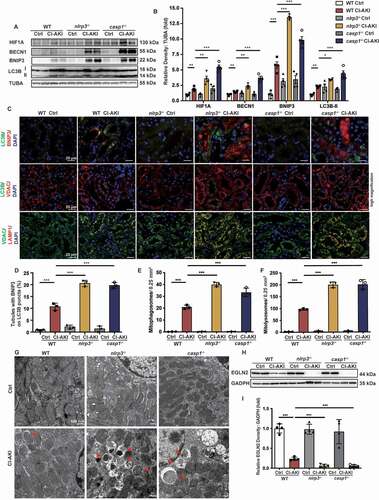
RNA sequencing data revealed that the expression of Egln2/Phd1 (egl-9 family hypoxia-inducible factor 2), a HIF1A prolyl-hydroxylase, was downregulated in the renal cortex of nlrp3−/− CI-AKI mice. The mRNA and protein levels of EGLN2 were examined using quantitative real-time polymerase chain reaction (qRT-PCR) and western blot, respectively. The mRNA and protein levels of EGLN2 in the renal cortex of nlrp3−/− or casp1−/− CI-AKI mice were downregulated when compared with those in the renal cortex of WT CI-AKI mice (Fig. S3, and ). These findings indicated that the inhibition of NLRP3 inflammasome downregulated EGLN2 expression and upregulated HIF1A expression.
MCC950 upregulated HIF1A and BNIP3-mediated mitophagy, and attenuated apoptosis in the HK-2 cells in response to iohexol treatment
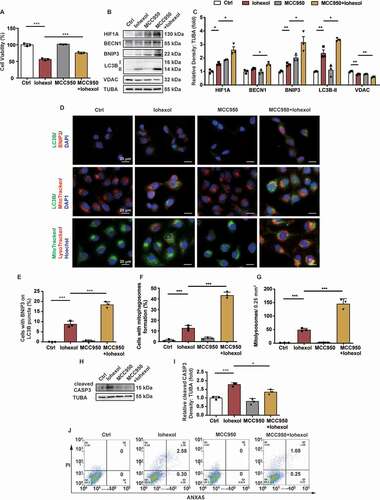
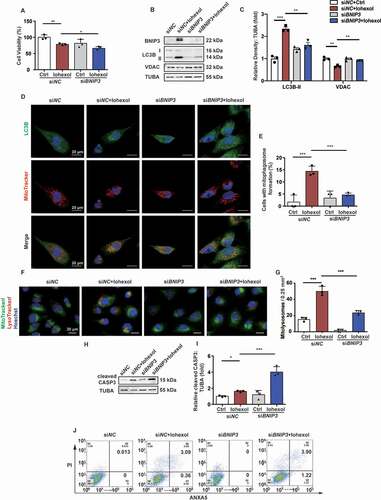
Immunoblotting and immunofluorescence analyses revealed that iohexol upregulated the expression levels of BNIP3 and LC3B, and decreased the expression of VDAC in the HK-2 cells (Fig. S4A and B). Additionally, the enhanced colocalization of LC3B with BNIP3 and mitochondria, and that of mitochondria with the lysosomes in the iohexol-treated HK-2 cells indicated that iohexol promoted BNIP3-mediated mitophagy (Fig. S4C–F). Next, the role of NLRP3 inflammasome in HIF1A and BNIP3-mediated mitophagy was examined in vitro. The HK-2 cells were pretreated with MCC950 (10 μM), a selective NLRP3 inflammasome inhibitor, for 4 h before iohexol treatment. Pretreatment with MCC950 mitigated the iohexol-induced decreased viability of the HK-2 cells (). The iohexol-treated HK-2 cells pretreated with MCC950 exhibited upregulated expression levels of HIF1A, BECN1, BNIP3, and LC3B-II, and reduced expression level of VDAC (). Immunofluorescence analysis revealed that iohexol treatment increased the colocalization of LC3B with BNIP3 and mitochondria, and the colocalization of mitochondria with lysosomes in the MCC950-pretreated HK-2 cells. This indicated that the inhibition of NLRP3 inflammasome enhanced BNIP3-mediated mitophagy (). Pretreatment with MCC950 mitigated the iohexol-induced upregulated levels of cleaved CASP3, an indicator of apoptosis, in the HK-2 cells (). Apoptosis was also examined using flow cytometry and TUNEL staining. The proportion of ANXA5/annexin V-positive and TUNEL-positive HK-2 cells markedly decreased upon pretreatment with MCC950 (, and Fig. S5A and B).
Figure 5. MCC950 upregulated HIF1A and BNIP3-mediated mitophagy, and attenuated apoptosis in the HK-2 cells in response to iohexol treatment. HK-2 cells were incubated in DMEM/F-12 media with iohexol (20 mg I/mL) for 72 h. MCC950 (10 μM) pretreated cells 4 h before iohexol treatment. (A) Cell viability of iohexol-treated HK-2 cells with MCC950 was evaluated by CCK-8. (B and C) Immunoblotting analysis and quantification of HIF1A, BECN1, BNIP3, LC3B-II, VDAC. (D-F) Representative images and quantification immunofluorescence double-labeling LC3B and BNIP3, LC3B and MitoTracker, MitoTracker and LysoTracker in MCC950-pretreated HK-2 cells. Scale bar: 20 μm. (G and H) Immunoblotting analysis and quantification of cleaved CASP3. (I) Representative images of cell apoptosis by flow cytometry. Data were presented as mean ± SEM. n = 3. *p < 0.05, **p < 0.01, ***p < 0.001
The findings of in vivo and in vitro experiments suggested that inhibiting NLRP3 inflammasome by knocking out nlrp3 or casp1 gene, or by treatment with selective inhibitor protected the renal tubular epithelial cells against the effects of iohexol through the upregulation of HIF1A and BNIP3-mediated mitophagy and attenuation of apoptosis.
Roxadustat activated the HIF1A-BNIP3 signaling pathway and attenuated apoptosis in the CI-AKI mice
The functions of HIF1A and its downstream effectors in CI-AKI were examined by treating the CI-AKI mice with roxadustat, a HIF prolyl-hydroxylase inhibitor. Briefly, the mice were intraperitoneally injected with roxadustat (10 mg/kg bodyweight/day) for 5 days before iohexol administration (). Treatment with roxadustat significantly decreased the serum creatinine levels in the CI-AKI mice (). The intraepithelial vacuolar degeneration and interstitial inflammation in the roxadustat-treated CI-AKI mice were lower than that in the untreated CI-AKI mice (). The tubular injury scores concurred with the findings of H-E staining (). The expression levels of HIF1A, BECN1, BNIP3, and LC3B-II in the renal cortex of the roxadustat-treated CI-AKI mice were higher than that in the renal cortex of the untreated CI-AKI mice (). Additionally, the increased colocalization of LC3B with BNIP3 and VDAC, and the increased colocalization of VDAC with LAMP1 indicated that BNIP3-mediated mitophagy in the renal tubules of the roxadustat-treated CI-AKI mice was higher than that in the renal tubules of the untreated CI-AKI mice (, and Fig. S2C). TEM revealed that roxadustat mitigated the CI-AKI-induced pathological changes in the mitochondria (loss of cristae and swelling) of the renal tubular epithelial cells (). Additionally, roxadustat decreased the levels of cleaved CASP3 and the proportion of TUNEL-positive cells in the renal tubules, which indicated that roxadustat alleviated iohexol-induced apoptosis (, and Fig. S1B). These data suggested that roxadustat promoted BNIP3-mediated mitophagy and alleviated renal injury and apoptosis in CI-AKI.
Figure 6. Roxadustat activated HIF1A-BNIP3 signaling pathway and attenuated apoptosis in the CI-AKI mice. (A) Diagrammatic representation of roxadustat to Ctrl and CI-AKI mice. Briefly, the mice were intraperitoneally injected with roxadustat (10 mg/kg bodyweight/day) for 5 days. (B-D) The role of roxadustat on Ctrl and CI-AKI mice was evaluated by serum creatinine, H-E staining and tubular injury score. The tubular injury was indicated by arrows. Scale bar: 50 μm. (E and F) Immunoblotting analysis and quantification of HIF1A, BECN1, BNIP3, LC3B-II. (G-J) Representative images and quantification of immunofluorescence double-labeling LC3B and BNIP3, LC3B and VDAC, VDAC and LAMP1. Scale bar: 20 μm. (K) Representative TEM images of mitochondrial morphology in renal tubular epithelial cells. Scale bar: 500 nm. (L-O) Apoptosis was evaluated by immunoblotting analysis of cleaved CASP3 and TUNEL staining. Scale bar: 50 μm. (P) DEGs in renal cortex of nlrp3−/−, casp1−/- CI-AKI and roxadustat-treated CI-AKI in a Venn diagram. The number of overlapping genes was shown in the overlapping regions. n = 3–5. Data were presented as mean ± SEM. *p < 0.05, **p < 0.01, ***p < 0.001
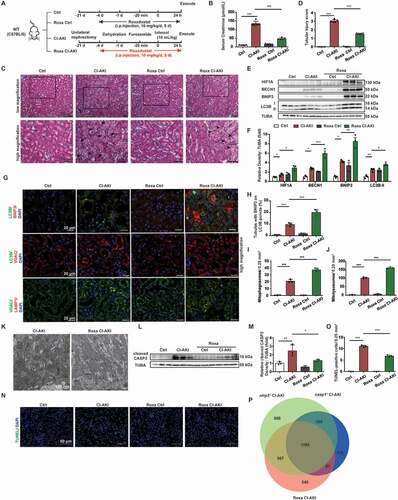
The renal cortex of the roxadustat-treated CI-AKI mice was subjected to RNA sequencing. As shown in , 2071 genes overlapped between the nlrp3−/− CI-AKI and roxadustat CI-AKI mice, while 1185 genes overlapped between the casp1−/− CI-AKI and roxadustat CI-AKI mice (). In total, 1104 genes overlapped among the nlrp3−/−, casp1−/−, and roxadustat CI-AKI groups. This suggested that the effects of roxadustat might be similar to those of nlrp3 or casp1 knockout in CI-AKI.
Roxadustat protected the HK-2 cells against iohexol-induced apoptosis in vitro through the upregulation of mitophagy
The HK-2 cells were pretreated with roxadustat (10 μM) for 4 h before treatment with iohexol. The results of CCK-8 (cell counting kit-8) assay revealed that roxadustat mitigated the iohexol-induced decreased viability in the HK-2 cells (). Immunoblotting analysis revealed that pretreatment with roxadustat upregulated the expression of HIF1A, BECN1, BNIP3 and LC3B-II, and decreased the expression of VDAC in the iohexol-treated HK-2 cells (). Additionally, the colocalization of LC3B with BNIP3 and mitochondria, as well as the colocalization of mitochondria with the lysosomes, in the iohexol-treated HK-2 cells pretreated with roxadustat were higher than that in the iohexol-treated HK-2 cells. This indicated that roxadustat promoted BNIP3-mediated mitophagy in the HK-2 cells (). Apoptosis in the HK-2 cells was examined using immunoblotting (cleaved CASP3), flow cytometry, and TUNEL staining. Pretreatment with roxadustat mitigated the iohexol-induced enhanced levels of cleaved CASP3 and decreased number of ANXA5/annexin V-positive and TUNEL-positive cells (, and Fig. S5C and D).
Figure 7. Roxadustat protected the HK-2 cells against iohexol-induced apoptosis in vitro through the upregulation of mitophagy. Roxadustat (10 μM) pretreated cells 4 h before iohexol treatment. (A) Cell viability of iohexol-treated HK-2 cells with roxadustat was evaluated by CCK-8. (B and C) Immunoblotting analysis and quantification of HIF1A, BECN1, BNIP3, LC3B-II, VDAC. (D-G) Representative images and quantification of immunofluorescence double-labeling LC3B and BNIP3, LC3B and MitoTracker, MitoTracker and LysoTracker. Scale bar: 20 μm. (G and H) 3-MA (5 mM) with roxadustat pretreated HK-2 cells 4 h before iohexol treatment. Immunoblotting analysis of LC3B-II, VDAC and cleaved CASP3. (I) Representative images of cell apoptosis by flow cytometry. Data were presented as mean ± SEM. n = 3. *p < 0.05, **p < 0.01, ***p < 0.001
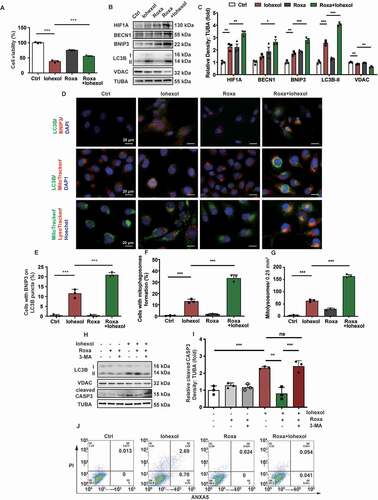
The role of HIF1A and BNIP3-medated mitophagy in apoptosis attenuation was examined by pretreating the HK-2 cells with 3-MA (inhibitor of autophagy) and roxadustat before iohexol treatment. Immunoblotting analysis of cleaved CASP3 revealed that pretreatment with roxadustat mitigated iohexol-induced apoptosis in the HK-2 cells. However, pretreatment with 3-MA inhibited the roxadustat-mediated attenuation of apoptosis ().
These findings indicated that roxadustat attenuated iohexol-induced renal injury and apoptosis through the activation of HIF1A and BNIP3-mediated mitophagy.
BNIP3 deficiency exacerbated mitochondrial damage and apoptosis in the CI-AKI mice
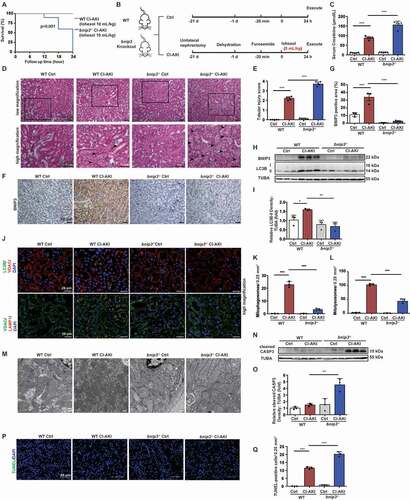
The regulation of BNIP3-mediated mitophagy in CI-AKI was examined using the bnip3 knockout (bnip3−/−) CI-AKI mouse model. The bnip3−/− mice (n = 10) were administered with iohexol at a dose of 10 mL/kg bodyweight. However, all bnip3−/− mice died due to the complications from CI-AKI (). Hence, the WT and bnip3−/− mice were administered with iohexol at a dose of 5 mL/kg bodyweight to generate the CI-AKI model (). The serum creatinine levels in the WT and bnip3−/− CI-AKI mice were 87.8 ± 3.693 and 156.0 ± 8.556 μmol/L, respectively (). H-E staining revealed that more than 75% of the tubular cells exhibited intraepithelial vacuolar degeneration and that the tubular injury score was approximately 3.7 in the bnip3−/− CI-AKI mice (). Immunohistochemical staining revealed that iohexol upregulated the expression of BNIP3 in the renal tubules of the WT mice (). Immunoblotting and immunofluorescence analyses revealed that the expression of LC3B-II was downregulated in the bnip3−/− CI-AKI mice (). The decreased colocalization of VDAC with LC3B and LAMP1 indicated that the number of mitophagosomes and mitolysosomes in the renal tubules of bnip3−/− CI-AKI mice was markedly lower than that in the renal tubules of WT CI-AKI mice (, and Fig. S2D). The analysis of mitochondrial DNA (mtDNA) to nuclear DNA (nDNA) ratio revealed that the number of mitochondria in the bnip3−/− CI-AKI mice was higher than that in the WT CI-AKI mice (Fig. S6). Mitochondrial swelling in the renal tubular epithelial cells of the bnip3−/− CI-AKI mice was more severe than that in the renal tubular epithelial cells of the WT CI-AKI mice. Additionally, the injured mitochondria were abnormally accumulated in the renal tubular epithelial cells of the bnip3−/− CI-AKI mice (). The cleaved CASP3 levels were markedly upregulated in the renal cortex of the bnip3−/− CI-AKI mice (). The number of TUNEL-positive cells in the renal cortex of the bnip3−/− CI-AKI mice was higher than that in the renal cortex of the WT CI-AKI mice (, and Fig. S1C). Immunoblotting analysis also revealed that the expression levels of NLRP3 inflammasome were not significantly different between the WT CI-AKI and bnip3−/− CI-AKI mice (Fig. S7). These data suggested that BNIP3-mediated mitophagy protects against iohexol-induced renal injury and that the deficiency of BNIP3 exacerbated iohexol-induced renal injury and apoptosis in vivo.
Figure 8. BNIP3 deficiency exacerbated mitochondrial damage and apoptosis in the CI-AKI mice. (A) Survival of WT CI-AKI and bnip3−/− CI-AKI mice with iohexol treatment (10 mL/kg bodyweight) after 24 h (n = 10). (B) Diagrammatic representation of modified WT and bnip3−/− CI-AKI models. Briefly, the dose of iohexol reduced to 5 mL/kg bodyweight. (C) The renal function was evaluated by serum creatinine. (D and E) Representative histology and pathological tubular injury score in the renal cortex by H-E staining. The tubular injury was indicated by arrows. Scale bar: 50 μm. (F and G) Representative IHC images and quantification of BNIP3 in kidney cortex. Scale bar: 50 μm. (H and I) Immunoblotting analysis and quantification of BNIP3 and LC3B-II. (J-L) Representative images and quantification of immunofluorescence double-labeling LC3B and VDAC, VDAC and LAMP1. Scale bar: 20 μm. (M) Representative TEM images of mitochondrial morphology in renal tubular epithelial cells of WT and bnip3−/− mice. Scale bar: 500 nm. (N-Q) Apoptosis was measured by immunoblotting analysis of cleaved CASP3 and TUNEL staining of renal tubular epithelial cells of WT and bnip3−/− CI-AKI mice. Scale bar: 50 μm. n = 3–5. Data were presented as mean ± SEM. *p < 0.05, **p < 0.01, ***p < 0.001
Silencing BNIP3 downregulated mitophagy in the HK-2 cells and exacerbated apoptosis
The HK-2 cells were transfected with si-BNIP3 (50 nm) for 8 h before exposure to iohexol. The results of CCK-8 assay demonstrated that transfection with si-BINP3 impaired the viability of iohexol-treated HK-2 cells (). Immunoblotting analysis revealed that iohexol upregulated the expression of LC3B-II and downregulated the expression of VDAC, which was inhibited in the si-BNIP3-transfected HK-2 cells (). Confocal microscopy analysis demonstrated that iohexol activated mitophagy, which was measured based on the colocalization of LC3B with mitochondria, in the HK-2 cells. However, BNIP3 knockdown decreased the number of LC3B puncta and the colocalization of LC3B with mitochondria, which indicated that BNIP3 promoted mitophagy in response to iohexol (). The number of mitolysosomes, which were identified based on the colocalization of mitochondria and lysosomes, decreased in the iohexol-treated BNIP3 knockdown HK-2 cells (). Next, the role of BNIP3-mediated mitophagy in apoptosis was examined using immunoblotting (cleaved CASP3), flow cytometry, and TUNEL staining. The cleaved CASP3 levels were significantly upregulated in iohexol-treated BNIP3 knockdown HK-2 cells (). The iohexol-treated BNIP3 knockdown HK-2 cells exhibited an enhanced number of ANXA5/annexin V-positive and TUNEL-positive cells (, and Fig. S5E and F).
Figure 9. Silencing BNIP3 downregulated mitophagy in the HK-2 cells and exacerbated apoptosis. (A) Cell viability was evaluated by CCK-8. (B and C) Immunoblotting analysis and quantification of BNIP3, LC3B-II, VDAC. (D and E) Representative images and quantification of immunofluorescence double-labeling LC3B and MitoTracker. Scale bar: 20 μm. (F and G) Representative images and quantification of MitoTracker and LysoTracker. Scale bar: 20 μm. (H and I) Immunoblotting analysis and quantification of cleaved CASP3. (J) Representative images of cell apoptosis by flow cytometry. Data were presented as mean ± SEM. n = 3. *p < 0.05, **p < 0.01, ***p < 0.001
These findings indicated that iohexol activated BNIP3-mediated mitophagy in vivo and in vitro, which protected the renal tubular epithelial cells against iohexol-induced renal injury.
Discussion
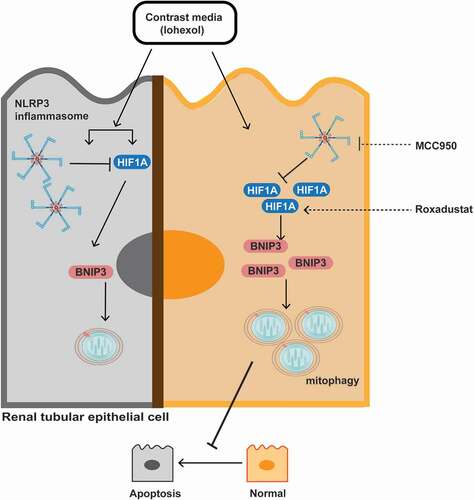
In this study, the effect of NLRP3 inhibition on iohexol-induced renal injury and apoptosis was examined using the nlrp3−/− and casp1−/− CI-AKI mice. According to the results of RNA sequencing, we demonstrated that HIF1A and BNIP3-mediated mitophagy upregulated in the nlrp3−/− and casp1−/− CI-AKI mice and iohexol-treated HK-2 cells with MCC950 pretreatment, a selective NLRP3 inhibitor. Additionally, the mouse and cell models were treated with roxadustat to examine the protective effects of HIF1A on CI-AKI. Mitophagy was inhibited in the bnip3−/− mice, which exhibited increased mortality, renal injury, and apoptosis. These findings indicated a novel correlation between NLRP3 inflammasome, HIF1A and BNIP3-mediated mitophagy, and apoptosis. Additionally, the findings of this study indicated that MCC950 and roxadustat were potential therapeutic agents for CI-AKI in humans ().
Figure 10. Schematic representation of NLRP3 inflammasome, HIF1A and BNIP3 mediated mitophagy, and apoptosis in CI-AKI. Contrast media (iohexol) activated NLRP3 inflammasome and increased HIF1A expression. HIF1A and BNIP3-mediated mitophagy further were upregulated by inhibiting NLRP3 inflammasome in vivo and in vitro. Additionally, roxadustat, a HIF prolyl-hydroxylase inhibitor, enhanced HIF1A-BNIP3-mediated mitophagy to alleviate iohexol-induced apoptosis. Both inhibition of NLRP3 inflammasome and stabilization of HIF1A, protected the renal tubular epithelial cells against apoptosis through BNIP3-mediated mitophagy in CI-AKI
NLRP3 inflammasome, an innate immune signaling receptor, mediates the pathogenesis of common noninfectious diseases through the activation of potent inflammatory cytokines [Citation26]. Recent studies have suggested that the inhibition of mitophagy results in NLRP3 inflammasome activation and IL1B secretion [Citation10,Citation27–29]. There are limited studies on the downstream effectors of NLRP3 inflammasome and inflammatory cytokines in AKI. In the lipopolysaccharide (LPS)-primed bone marrow-derived macrophages, NLRP3 promotes mitochondrial damage by mediating the CASP1-dependent cleavage of PRKN, which results in the downregulation of mitophagy [Citation14]. The inhibition of NLRP3 inflammasome through knocking out nlrp3 and casp1 or treatment with MCC950 enhances autophagy and mitophagy in the lethal oxidant injury [Citation15], aged [Citation30], and UUO mouse models [Citation16]. RNA sequencing of the renal tissues of WT, nlrp3−/− and casp1−/− mice suggested the effect of NLRP3 inflammasome inhibition on the hypoxia pathway. The expression levels of HIF1A, BECN1, BNIP3, and LC3B-II were upregulated in the renal cortex of the nlrp3−/− and casp1−/− mice, as well as the MCC950-pretreated HK-2 cells (, and ). Additionally, the inhibition of NLRP3 inflammasome increased the colocalization of LC3B with BNIP3 and mitochondria, and the colocalization of mitochondria with lysosomes in vivo and in vitro, which indicated that mitophagy was mediated by BNIP3 (, and ). These data suggested that inhibiting NLRP3 inflammasome upregulated BNIP3-mediated mitophagy.
Hypoxia inducible factor 1 (HIF1), a transcriptional complex, regulates cellular and systemic homeostatic responses to oxygen availability. HIF1 comprises the following two subunits: HIF1A, an oxygen-sensitive subunit; HIF1B, a constitutively expressed subunit. Under normoxic conditions, HIF1A rapidly undergo ubiquitin-mediated degradation. In contrast, HIF1A is stable under hypoxic conditions [Citation31]. Previous studies evaluating the correlation between hypoxia and inflammation have suggested that hypoxia induces inflammation. However, inflamed lesions can also lead to the formation of severe hypoxic microenvironment [Citation32]. In inflammatory bowel disease, the surgically excised mucosa and inflamed intestine exhibit upregulated levels of HIF1A and hypoxia [Citation33,Citation34]. At low doses, IL1B upregulates hypoxia and HIF1A level in the human fibroblast-like synoviocytes and human breast cancer cell line, which indicates that inflammation promotes hypoxia in the cells. Interestingly, the expression of HIF1A decreases with the increase in IL1B concentration [Citation35,Citation36]. This study demonstrated that iohexol promoted hypoxia and activated NLRP3 inflammasome and that the inhibition of NLRP3 inflammasome resulted in further enhanced expression of HIF1A ( and ). To examine the effect of NLRP3 inflammasome on HIF1A in CI-AKI, the expression levels of EGLN2, a HIF1A prolyl-hydroxylase, was examined according to RNA sequencing result. EGLN2 initiates HIF1A ubiquitylation and degradation through the hydroxylation of two conserved proline residues on HIF1A [Citation37,Citation38]. In the CI-AKI mice, the mRNA and protein levels of EGLN2 were downregulated, which were further downregulated in the nlrp3−/− and casp1−/− CI-AKI mice (, and Fig S3). Hence, we hypothesized that the inhibition of NLRP3 inflammasome and inflammatory cytokines downregulated the expression of EGLN2 and promoted the protective function of HIF1A in CI-AKI.
Some studies have examined the effect of roxadustat, a HIF prolyl-hydroxylase inhibitor that stabilizes HIF1A, on the kidneys with a focus on hypoxia and HIF1A. In animal models of ischemia-reperfusion injury, hif1a knockout downregulates the levels of miR-688, which regulates the mitochondrial function and consequently enhances the renal tubular epithelial cell survival through the repression of MTP18 [Citation39]. Intraperitoneal administration of roxadustat is reported to alleviate cisplatin-induced renal injury and apoptosis through the upregulation of HIF1A [Citation40]. To the best of our knowledge, there are no studies that have evaluated the effect of roxadustat on HIF1A in CI-AKI models. In this study, we demonstrated that the administration of iohexol increased the expression of HIF1A, which was further increased upon treatment with roxadustat in vivo and in vitro (, , and ). Consistent with the results of previous studies, roxadustat alleviated the enhanced serum creatinine level, pathology injury, mitochondrial dysfunction, and apoptosis in the CI-AKI mice in this study (, , , and 7H–J). The findings of this study indicated that roxadustat is a potential therapeutic agent for CI-AKI. Meanwhile, roxadustat preserves renal function and fibrosis in the adenine-induced chronic tubulointerstitial inflammation model [Citation41]. Additionally, roxadustat significantly alleviates renal anemia in CKD and dialysis patients in China, which is confirmed in phase III clinical trials [Citation42,Citation43]. Future studies should focus on the role of HIF1A in CKD. The effects of HIF1A on the progression of kidney disease must be further examined using an AKI-to-CKD model.
Recent studies have suggested that HIF1A promotes mitophagy during hypoxia. In the nonalcoholic steatohepatitis mouse model and human macrophages, the upregulated HIF1A level is associated with a concomitant increase in the levels of BECN1, BNIP3, and LC3-II [Citation44]. Under hypoxic conditions, HIF1A and BNIP3-mediated mitophagy delays tumor growth and progression in breast cancer by inhibiting the accumulation of dysfunctional mitochondria and mitochondrial ROS production [Citation45]. Hypoxia-induced ROS production activates HIF1A and BNIP3-induced mitophagy, which promotes epidermal keratinocyte migration during wound healing [Citation46]. Consistent with this finding, this study demonstrated that HIF1A and BNIP3-mediated mitophagy is activated in response to iohexol in the mice and HK-2 cells (, , and ). Treatment with roxadustat upregulated HIF1A-BNIP3-mediated mitophagy, which protected the renal tubular epithelial cells against iohexol-induced renal injury ( and ). Meanwhile, 3-MA inhibited the roxadustat-mediated attenuation of apoptosis (). Thus, we suggest that roxadustat protects against CI-AKI through the activation of HIF1A and BNIP3-mediated mitophagy, which alleviated apoptosis and renal injury.
BNIP3 is a cell death factor that belongs to the BCL2 proapoptotic family. Previous studies have demonstrated that BNIP3 promotes cell death in tumor and cardiac disease through the induction of apoptosis, which aggravates the progression of tumor and cardiac ischemia-reperfusion injury [Citation47–49]. Recently, BNIP3 is reported to regulate mitophagy. Under hypoxic conditions, BNIP3 promotes mitochondrial depolarization and directly activates mitophagy by delivering the mitochondria to autophagosomes [Citation50,Citation51]. Dong et al. reported that BNIP3 deficiency suppresses mitophagy and that BNIP3-mediated mitophagy is involved in maintaining mitochondrial quality control and tubular cell survival during ischemia-reperfusion-induced injury [Citation21]. These findings were consistent with those of this study. Iohexol promoted BNIP3-mediated mitophagy in vitro and in vivo (, and Fig. S4C). Additionally, iohexol-treated bnip3−/− mice and si-BNIP3-treated HK-2 cells exhibited a decreased number of mitophagosomes and mitolysosomes (, and ), which indicated the important role of BNIP3-mediated mitophagy in CI-AKI. BNIP3 is reported to promote both apoptosis and mitophagy. This study demonstrated that BNIP3 promoted mitophagy. The knockout of bnip3 enhanced the serum creatinine level, tubular injury score and cell viability, which suggested the protective function of BNIP3 (, and ). Apoptosis was evaluated using immunoblotting analysis (cleaved CASP3), TUNEL staining, and flow cytometry. The number of apoptotic cells in the renal cortex of bnip3−/− CI-AKI mice and iohexol-treated BNIP3 knockdown HK-2 cells was significantly higher than that in the WT groups (, and ). Treatment with MCC950 or roxadustat mitigated iohexol-induced apoptosis and renal injury through the activation of BNIP3-mediated mitophagy. This indicated the potential clinical applications of NLRP3 inflammasome inhibitor or HIF prolyl-hydroxylase inhibitor.
Mitophagy is commonly activated through the PRKN-dependent and PRKN-independent pathways. BNIP3 is an important regulator of the PRKN-independent mitophagy pathway [Citation52]. There are no studies that have examined the PINK1-PRKN-mediated and BNIP3-mediated mitophagy pathways using the same disease model. The CI-AKI mice were generated using iohexol (10 mL/kg bodyweight), following the protocols described in a previous study [Citation10] in WT, pink1−/−, and prkn−/− mice (). However, treatment with iohexol at a dose of 10 mL/kg bodyweight for 24 h was lethal to the bnip3−/− mice (). This indicated that deficiency of BNIP3 is more lethal than that of PINK1 or PRKN in CI-AKI. The studies on the correlation between PINK1-PRKN-mediated and BNIP3-mediated mitophagy pathways in CI-AKI are currently ongoing.
In summary, this study has demonstrated that NLRP3 inflammasome inhibition protects against CI-AKI through the upregulation of HIF1A and BNIP3-mediated mitophagy. The inhibition of NLRP3 inflammasome enhanced the protective effects of HIF1A and BNIP3-mediated mitophagy, which alleviated the iohexol-induced apoptosis and renal injury. MCC950 and roxadustat enhanced BNIP3-mediated mitophagy and inhibited renal tubular epithelial cell apoptosis. The findings of this study indicated that NLRP3 inflammasome inhibitor and HIF prolyl-hydroxylase inhibitor are potential therapeutic targets for the clinical prevention and treatment of CI-AKI.
Materials and methods
Cells, small interfering RNA, antibodies, and reagents
Human renal proximal tubular cell line (HK-2 cell) was gained from American Type Culture Collection (ATCC®, CRL-2190). We obtained iohexol from GE Healthcare (Omnipaque 350), mannitol (M9546) from SigmaAldrich, MCC950 (HY-12815), roxadustat (HY-13426) and 3-MA (HY-19312) from MedChemExpress. We obtained antibodies targeting NLRP3 (15101), GAPDH (5174), and cleaved CASP3 (9664) from Cell Signal Technology; CASP1 (sc-56036), BECN1 (sc-48341), and BNIP3 (sc-56167) from Santa Cruz Biotechnology; IL1B (AF-401-NA) from R&D Systems; LC3B (L7543) from Sigma-Aldrich; HIF1A (NB100-105) from Novas Biologicals; VDAC/voltage-dependent anion channel (ab14734), LAMP1/lysosomal-associated membrane protein 1 (ab25630), EGLN2/PHD1/egl-9 family hypoxia-inducible factor 2 (ab108980) from Abcam; TUBA from (AF0001) from Beyotime. We obtained fluorescence secondary antibodies from Abcam: Donkey anti-rabbit IgG (Alexa Fluor® 555, ab150074; Alexa Fluor® 488, ab150073), donkey anti-mouse IgG (Alexa Fluor® 488, ab150105; Alexa Fluor® 555, ab150110). We obtained MitoTracker Red (M7512), and MitoTracker Green (M7514) from ThermoFisher Scientific, and LysoTracker Red (C1046) from Beyotime. The sequences of small interfering RNA (siRNA) were as follows: BNIP3 siRNA 5′- CGUUCCAGCCUCGGUUUCUAUUUAU-3′.
Animals and CI-AKI model
nlrp3−/− and casp1−/− mice with a C56BL/6 genetic background were purchased from Jackson Laboratory (021302, 016621). bnip3−/− mice were constructed at Shanghai Model Organisms Center, Inc. as described previously [Citation49]. The mice were housed in pathogen-free conditions. All animal experiments were performed according to the Animal Protocol Committee of Shanghai Jiao Tong University and were approved by the Animal Care Committee of Renji Hospital, School of Medicine, Shanghai Jiao Tong University.
The CI-AKI mice were constructed as described in previous studies [Citation9,Citation10,Citation22]. Briefly, the model was established by subjecting the mice to unilateral nephrectomy, dehydration, and furosemide (Sigma-Aldrich, F4381; diluted to 10 mg/mL) treatment (10 mL/kg bodyweight, injected through the tail vein). To establish the CI-AKI mouse model, the model mice were injected with iohexol (GE Healthcare, Omnipaque 350; 10 mL/kg bodyweight; injected through the tail vein) (). The negative control group was established by injecting the model mice with saline (10 mL/kg bodyweight; injected through the tail vein). The WT and CI-AKI mice were intraperitoneally injected with roxadustat (MedChemExpress, HY-13426; 10 mg/kg bodyweight/day) for 5 days (). All mice were sacrificed at 24 h post-iohexol/saline administration. The serum and kidney were harvested for further analysis.
RNA extraction, library construction, and Illumina sequencing
Total RNA was extracted from the renal cortex of WT, nlrp3 −/− and casp1−/− CI-AKI mice, and roxadustat-treated CI-AKI mice using the mRNA Isolation kit (ThermoFisher Scientific, AM1561). RNA integrity was examined using 2100 Bioanalyzer (Agilent Technologies). The libraries were constructed using the TruSeq Stranded mRNA LT Sample Prep Kit (Illumina, RS-122-2101), following the manufacturer’s instructions. RNA sequencing was performed on the Illumina platform (HiSeqTM 2500, Illumina, Shanghai OE Biotech. Co., Ltd.). The DEGs were identified based on the following criteria: P < 0.05 and fold changes <0.5 or >2.
In vitro iohexol treatment
The HK-2 cells were cultured in Dulbecco’s modified Eagle’s medium (DMEM)/F-12 (ThermoFisher Scientific, 11330057) supplemented with 10% fetal bovine serum (ThermoFisher Scientific, 10099158). The HK-2 cells were transfected with siRNA (50 nM) for 8 h using Lipofectamine™ 3000 Transfection Reagent (ThermoFisher Scientific, L3000150). At 4 h before-iohexol treatment, the cells were treated with MCC950 (10 μM), roxadustat (10 μM), or 3-MA (5 mM). Next, the HK-2 cells were treated with 20 mg I/mL iohexol for 72 h as previously described [Citation9]. Experiments were performed in triplicates.
Renal function, histopathology, immunofluorescence, and immunohistochemical staining
The serum creatinine levels were analyzed using the standard spectrophotometric assay (Roche Diagnostic GmbH, cobasC501). H-E staining of kidneys was performed as described previously [Citation10]. The tubular injury was scored based on the percentage of damaged tubules (grade 0, no damage; grade 1, <25%; grade 2, 25–49%; grade 3, 50–75%; grade 4, >75%).
For immunofluorescence and immunohistochemical analyses, the paraffin-embedded kidney sections (4 μm) were deparaffinized using dimethylbenzene. The antigen in the renal sections was retrieved using ethylenediaminetetraacetic acid. The renal sections were incubated with the anti-BNIP3, anti-LC3B, anti-VDAC, and anti-LAMP1 antibodies (all 1:100) at 4°C overnight. The images were captured using a fluorescence microscope (ZEISS, Axio Vert A1) and analyzed using digital image analyzer (Ocular 2.0).
To label the mitochondria or lysosome, the HK-2 cells were cultured on cell slides in a 24-well plate. The HK-2 cells were treated with MitoTracker Red (500 nM), MitoTracker Green (50 nM), or LysoTracker Red (50 nM) and Hoechst (5 μg/mL), following the manufacturer’s instructions. The cells were fixed and immunostained with the antibody. The images were captured using a confocal microscope (ZEISS 710). The staining intensity was quantified in 10 random fields of each section. Two pathologists who were blinded to the samples independently quantified the staining intensity of each section.
Transmission electron microscopy
The freshly harvested renal cortex (1 mm3) was processed as described previously [Citation10] by the Public Technology Platform of Basic Medicine, Shanghai Jiao Tong University School of Medicine. The sections with a thickness of 70 nm were observed under an H-7650 transmission electron microscope (Hitachi, H-7650).
Cell viability analysis
The viability of HK-2 cells was analyzed using the CCK-8 kit (Dojindo, CK04), following the manufacturer’s instruction. Briefly, the HK-2 cells cultured in a 96-well plate were treated with siRNA, drugs, or iohexol. Next, the cells were incubated with 10 μL of CCK-8 solution at 37°C for 2 h. The absorbance of the mixture was measured at 450 nm using BioTak CytationTM3.
Immunoblot analysis
The proteins were subjected to sodium dodecyl sulfate-polyacrylamide gel electrophoresis using 8%-12% gels. The resolved proteins were transferred to a polyvinylidene difluoride membrane (0.45 μm) and blocked by 5% skimmed milk. The membrane was then incubated with the primary antibodies at 4°C overnight and secondary antibodies at room temperature for 1 h. Densitometry analysis was performed using the Image J software. The density of the target proteins was normalized to that of TUBA/α-tubulin.
Apoptosis analysis
Apoptosis was analyzed using immunoblotting (quantification of cleaved CASP3), TUNEL assay, and flow cytometry. TUNEL staining (Beyotime, C1088) and flow cytometry (BD Biosciences, 556,547) were performed following the manufacturer’s instructions. The TUNEL-positive cells were quantified in an area of 0.25 mm2. The ANXA5/annexin V-positive cells were considered as apoptotic cells.
qRT-PCR analysis
The mRNA level of Egln2 was assessed using qRT-PCR. The primers for amplifying mouse Egln2 were purchased from Sangon Biotech: forward, 5′- TTACCTGCCCTGCCCTCTGC -3′; reverse, 5′- CACCATCCTGCCCACCAAAGC-3.
Quantification of mitochondrial DNA
The mtDNA and nDNA were quantified based on the levels of mt-Nd1 (mitochondrially encoded NADH dehydrogenase 1) and B2m (beta-2 microglobulin) genes, respectively. The primers and amplification have been described elsewhere [Citation10].
Statistical analysis
All statistical analyses were performed using Prism 8 (GraphPad). Qualitative data were expressed as mean ± standard error of the mean (SEM). The differences between two groups were analyzed using Student’s t-test, while those between multiple groups were analyzed using one-way analysis of variance, followed by Tukey’s post-hoc test. The differences were considered significant at P < 0.05.
Supplemental Material
Download MS Word (4.9 MB)Acknowledgments
This study was supported by grants from National Natural Science Foundation of China [81770666, 81570604, 81370794], Shanghai Municipal Health Commission and Family Planning [ZY (2018–2020)-FWTX-1001], Shanghai Municipal Commission of Health and Family Planning, and Office for Traditional Chinese Medicine Development of Shanghai [ZHYY-ZXYJHZX-1-02] to ZN; and sponsored by Shanghai Sailing Program [20YF1424900] to SL; Public health Industry Project of Shanghai Municipal Health commission [20194Y0332], Outstanding Youth Project from Shanghai key laboratory of nucleic acid chemistry and nanomedicine [2020ZYA002] to HJ and National Natural Science Foundation of China [81700586] to JS.
Disclosure statement
The authors declare that they have no conflict of interest.
Data availability
The data that support the findings of this study were openly available in NCBI SRA database (https://www.ncbi.nlm.nih.gov/bioproject/657330, BioProject Accession number: PRJNA657330).
Supplemental material
Supplemental data for this article can be accessed here.
Additional information
Funding
References
- Fahling M, Seeliger E, Patzak A, et al. Understanding and preventing contrast-induced acute kidney injury. Nat Rev Nephrol. 2017 Mar;13(3):169–180.
- McCullough PA, Adam A, Becker CR, et al. Risk prediction of contrast-induced nephropathy. Am J Cardiol. 2006 Sep 18;98(6A):27K–36K.
- Weisbord SD, Gallagher M, Jneid H, et al. Outcomes after Angiography with Sodium Bicarbonate and Acetylcysteine. N Engl J Med. 2018 Feb 15;378(7):603–614.
- Tang TT, Lv LL, Pan MM, et al. Hydroxychloroquine attenuates renal ischemia/reperfusion injury by inhibiting cathepsin mediated NLRP3 inflammasome activation. Cell Death Dis. 2018 Mar 2;9(3):351.
- Anders HJ. Of inflammasomes and alarmins: IL-1beta and IL-1alpha in kidney disease. J Am Soc Nephrol. 2016 Sep;27(9):2564–2575.
- Xiao YD, Huang YY, Wang HX, et al. Thioredoxin-Interacting Protein Mediates NLRP3 Inflammasome Activation Involved in the Susceptibility to Ischemic Acute Kidney Injury in Diabetes. Oxid Med Cell Longev. 2016;2016:2386068.
- Vilaysane A, Chun J, Seamone ME, et al. The NLRP3 inflammasome promotes renal inflammation and contributes to CKD. J Am Soc Nephrol. 2010 Oct;21(10):1732–1744.
- Li S, Lin Q, Shao X, et al. NLRP3 inflammasome inhibition attenuates cisplatin-induced renal fibrosis by decreasing oxidative stress and inflammation. Exp Cell Res. 2019 Oct 1;383(1):111488.
- Shen J, Wang L, Jiang N, et al. NLRP3 inflammasome mediates contrast media-induced acute kidney injury by regulating cell apoptosis. Sci Rep. 2016 Oct 10;6:34682.
- Lin Q, Li S, Jiang N, et al. PINK1-parkin pathway of mitophagy protects against contrast-induced acute kidney injury via decreasing mitochondrial ROS and NLRP3 inflammasome activation. Redox Biol. 2019;26:101254.
- Bakker PJ, Butter LM, Kors L, et al. Nlrp3 is a key modulator of diet-induced nephropathy and renal cholesterol accumulation. Kidney Int. 2014 May;85(5):1112–1122.
- Lin L, Xu L, Lv W, et al. An NLRP3 inflammasome-triggered cytokine storm contributes to Streptococcal toxic shock-like syndrome (STSLS). PLoS Pathog. 2019 Jun;15(6):e1007795.
- Bruder-Nascimento T, Ferreira NS, Zanotto CZ, et al. NLRP3 inflammasome mediates aldosterone-induced vascular damage. Circulation. 2016 Dec 6;134(23):1866–1880.
- Yu J, Nagasu H, Murakami T, et al. Inflammasome activation leads to Caspase-1-dependent mitochondrial damage and block of mitophagy. Proc Natl Acad Sci U S A. 2014 Oct 28;111(43):15514–15519.
- Zhang Y, Sauler M, Shinn AS, et al. Endothelial PINK1 mediates the protective effects of NLRP3 deficiency during lethal oxidant injury. J Immunol. 2014 Jun 1;192(11):5296–5304.
- Kim SM, Kim YG, Kim DJ, et al. Inflammasome-independent role of NLRP3 mediates mitochondrial regulation in renal injury. Front Immunol. 2018;9:2563.
- Bhatia D, Chung KP, Nakahira K, et al. Mitophagy dependent macrophage reprogramming protects against kidney fibrosis. JCI Insight. 2019 Dec ;4(23):e132826.
- Youle RJ, Narendra DP. Mechanisms of mitophagy. Nat Rev Mol Cell Biol. 2011 Jan;12(1):9–14.
- Tang C, Han H, Yan M, et al. PINK1-PRKN/PARK2 pathway of mitophagy is activated to protect against renal ischemia-reperfusion injury. Autophagy. 2018;14(5):880–897.
- Wang Y, Tang C, Cai J, et al. PINK1/Parkin-mediated mitophagy is activated in cisplatin nephrotoxicity to protect against kidney injury. Cell Death Dis. 2018 Nov 1;9(11):1113.
- Tang C, Han H, Liu Z, et al. Activation of BNIP3-mediated mitophagy protects against renal ischemia-reperfusion injury. Cell Death Dis. 2019 Sep 12;10(9):677.
- Zhang Z, Shao X, Jiang N, et al. Caspase-11-mediated tubular epithelial pyroptosis underlies contrast-induced acute kidney injury. Cell Death Dis. 2018 Sep 24;9(10):983.
- Lee HJ, Jung YH, Choi GE, et al. BNIP3 induction by hypoxia stimulates FASN-dependent free fatty acid production enhancing therapeutic potential of umbilical cord blood-derived human mesenchymal stem cells. Redox Biol. 2017;13:426–443.
- Korski KI, Kubli DA, Wang BJ, et al. Hypoxia prevents mitochondrial dysfunction and senescence in human c-Kit(+) cardiac progenitor cells. Stem Cells. 2019 Apr;37(4):555–567.
- Klionsky DJ, Abdelmohsen K, Abe A, et al. Guidelines for the use and interpretation of assays for monitoring autophagy (3rd edition). Autophagy. 2016;12(1):1–222.
- Mangan MSJ, Olhava EJ, Roush WR, et al. Targeting the NLRP3 inflammasome in inflammatory diseases. Nat Rev Drug Discov. 2018 Aug;17(8):588–606.
- Zhong Z, Umemura A, Sanchez-Lopez E, et al. NF-kappaB restricts inflammasome activation via elimination of damaged mitochondria. Cell. 2016 Feb 25;164(5):896–910.
- Kim MJ, Bae SH, Ryu JC, et al. SESN2/sestrin2 suppresses sepsis by inducing mitophagy and inhibiting NLRP3 activation in macrophages. Autophagy. 2016 Aug 2;12(8):1272–1291.
- Kang R, Zeng L, Xie Y, et al. A novel PINK1- and PARK2-dependent protective neuroimmune pathway in lethal sepsis. Autophagy. 2016;Dec;12(12):2374–2385.
- Marin-Aguilar F, Castejon-Vega B, Alcocer-Gomez E, et al. NLRP3 inflammasome inhibition by MCC950 in aged mice improves health via enhanced autophagy and PPARalpha activity. J Gerontol A Biol Sci Med Sci. 2020 Jul ;75(8):1457-1464.
- Giaccia A, Siim BG, Johnson RS. HIF-1 as a target for drug development. Nat Rev Drug Discov. 2003 Oct;2(10):803–811.
- Eltzschig HK, Carmeliet P. Hypoxia and inflammation. N Engl J Med. 2011 Feb 17;364(7):656–665.
- Karhausen J, Furuta GT, Tomaszewski JE, et al. Epithelial hypoxia-inducible factor-1 is protective in murine experimental colitis. J Clin Invest. 2004 Oct;114(8):1098–1106.
- Giatromanolaki A, Sivridis E, Maltezos E, et al. Hypoxia inducible factor 1alpha and 2alpha overexpression in inflammatory bowel disease. J Clin Pathol. 2003 Mar;56(3):209–213.
- Tsuji F, Seki I, Aono H, et al. Bucillamine mechanism inhibiting IL-1beta-induced VEGF production from fibroblast-like synoviocytes. Int Immunopharmacol. 2007 Dec 5;7(12):1569–1576.
- Naldini A, Filippi I, Miglietta D, et al. Interleukin-1beta regulates the migratory potential of MDAMB231 breast cancer cells through the hypoxia-inducible factor-1alpha. Eur J Cancer. 2010 Dec;46(18):3400–3408.
- Masson N, Willam C, Maxwell PH, et al. Independent function of two destruction domains in hypoxia-inducible factor-alpha chains activated by prolyl hydroxylation. Embo J. 2001 Sep 17;20(18):5197–5206.
- Foxler DE, Bridge KS, James V, et al. The LIMD1 protein bridges an association between the prolyl hydroxylases and VHL to repress HIF-1 activity. Nat Cell Biol. 2012 Jan 29;14(2):201–208.
- Wei Q, Sun H, Song S, et al. MicroRNA-668 represses MTP18 to preserve mitochondrial dynamics in ischemic acute kidney injury. J Clin Invest. 2018 Dec 3;128(12):5448–5464.
- Yang Y, Yu X, Zhang Y, et al. Hypoxia-inducible factor prolyl hydroxylase inhibitor roxadustat (FG-4592) protects against cisplatin-induced acute kidney injury. Clin Sci (Lond). 2018 Apr 16;132(7):825–838.
- Schley G, Klanke B, Kalucka J, et al. Mononuclear phagocytes orchestrate prolyl hydroxylase inhibition-mediated renoprotection in chronic tubulointerstitial nephritis. Kidney Int. 2019 Aug;96(2):378–396.
- Chen N, Hao C, Peng X, et al. Roxadustat for Anemia in Patients with Kidney Disease Not Receiving Dialysis. N Engl J Med. 2019 Sep 12;381(11):1001–1010.
- Chen N, Hao C, Liu BC, et al. Roxadustat treatment for anemia in patients undergoing long-term dialysis. N Engl J Med. 2019 Sep 12;381(11):1011–1022.
- Wang X, de Carvalho Ribeiro M, Iracheta-Vellve A, et al. Macrophage-specific hypoxia-inducible factor-1alpha contributes to impaired autophagic flux in nonalcoholic steatohepatitis. Hepatology. 2019 Feb;69(2):545–563.
- Chourasia AH, Tracy K, Frankenberger C, et al. Mitophagy defects arising from BNip3 loss promote mammary tumor progression to metastasis. EMBO Rep. 2015 Sep;16(9):1145–1163.
- Zhang J, Zhang C, Jiang X, et al. Involvement of autophagy in hypoxia-BNIP3 signaling to promote epidermal keratinocyte migration. Cell Death Dis. 2019 Mar 8;10(3):234.
- Sowter HM, Ratcliffe PJ, Watson P, et al. HIF-1-dependent regulation of hypoxic induction of the cell death factors BNIP3 and NIX in human tumors. Cancer Res. 2001 Sep 15;61(18):6669–6673.
- Bacon AL, Fox S, Turley H, et al. Selective silencing of the hypoxia-inducible factor 1 target gene BNIP3 by histone deacetylation and methylation in colorectal cancer. Oncogene. 2007 Jan 4;26(1):132–141.
- Diwan A, Krenz M, Syed FM, et al. Inhibition of ischemic cardiomyocyte apoptosis through targeted ablation of Bnip3 restrains postinfarction remodeling in mice. J Clin Invest. 2007 Oct;117(10):2825–2833.
- Zhang T, Xue L, Li L, et al. BNIP3 Protein Suppresses PINK1 Kinase Proteolytic Cleavage to Promote Mitophagy. J Biol Chem. 2016 Oct 7;291(41):21616–21629.
- O’Sullivan TE, Johnson LR, Kang HH, et al. BNIP3- and BNIP3L-Mediated Mitophagy Promotes the Generation of Natural Killer Cell Memory. Immunity. 2015 Aug 18;43(2):331–342.
- Zhang J, Ney PA. Role of BNIP3 and NIX in cell death, autophagy, and mitophagy. Cell Death Differ. 2009 Jul;16(7):939–946.