
 ?Mathematical formulae have been encoded as MathML and are displayed in this HTML version using MathJax in order to improve their display. Uncheck the box to turn MathJax off. This feature requires Javascript. Click on a formula to zoom.
ABSTRACT
Mitochondrial dysfunction causes energy deficiency and nigrostriatal neurodegeneration which is integral to the pathogenesis of Parkinson disease (PD). Clearance of defective mitochondria involves fission and ubiquitin-dependent degradation via mitophagy to maintain energy homeostasis. We hypothesize that LRRK2 (leucine-rich repeat kinase 2) mutation disrupts mitochondrial turnover causing accumulation of defective mitochondria in aging brain. We found more ubiquitinated mitochondria with aberrant morphology associated with impaired function in aged (but not young) LRRK2R1441G knockin mutant mouse striatum compared to wild-type (WT) controls. LRRK2R1441G mutant mouse embryonic fibroblasts (MEFs) exhibited reduced MAP1LC3/LC3 activation indicating impaired macroautophagy/autophagy. Mutant MEFs under FCCP-induced (mitochondrial uncoupler) stress showed increased LC3-aggregates demonstrating impaired mitophagy. Using a novel flow cytometry assay to quantify mitophagic rates in MEFs expressing photoactivatable mito-PAmCherry, we found significantly slower mitochondria clearance in mutant cells. Specific LRRK2 kinase inhibition using GNE-7915 did not alleviate impaired mitochondrial clearance suggesting a lack of direct relationship to increased kinase activity alone. DNM1L/Drp1 knockdown in MEFs slowed mitochondrial clearance indicating that DNM1L is a prerequisite for mitophagy. DNM1L knockdown in slowing mitochondrial clearance was less pronounced in mutant MEFs, indicating preexisting impaired DNM1L activation. DNM1L knockdown disrupted mitochondrial network which was more evident in mutant MEFs. DNM1L-Ser616 and MAPK/ERK phosphorylation which mediate mitochondrial fission and downstream mitophagic processes was apparent in WT using FCCP-induced stress but not mutant MEFs, despite similar total MAPK/ERK and DNM1L levels. In conclusion, aberrant mitochondria morphology and dysfunction associated with impaired mitophagy and DNM1L-MAPK/ERK signaling are found in mutant LRRK2 MEFs and mouse brain.
Abbreviations: ATP: adenosine triphosphate; BAX: BCL2-associated X protein; CDK1: cyclin-dependent kinase 1; CDK5: cyclin-dependent kinase 5; CQ: chloroquine; CSF: cerebrospinal fluid; DNM1L/DRP1: dynamin 1-like; ELISA: enzyme-linked immunosorbent assay; FACS: fluorescence-activated cell sorting; FCCP: carbonyl cyanide-4-(trifluoromethoxy)phenylhydrazone; GAPDH: glyceraldehyde-3-phosphate dehydrogenase; LAMP2A: lysosomal-associated membrane protein 2A; LRRK2: leucine-rich repeat kinase 2; MAP1LC3/LC3: microtubule-associated protein 1 light chain 3; MAPK1/ERK2: mitogen-activated protein kinase 1; MEF: mouse embryonic fibroblast; MFN1: mitofusin 1; MMP: mitochondrial membrane potential; PAmCherry: photoactivatable-mCherry; PD: Parkinson disease; PINK1: PTEN induced putative kinase 1; PRKN/PARKIN: parkin RBR E3 ubiquitin protein ligase; RAB10: RAB10, member RAS oncogene family; RAF: v-raf-leukemia oncogene; SNCA: synuclein, alpha; TEM: transmission electron microscopy; VDAC: voltage-dependent anion channel; WT: wild type; SQSTM1/p62: sequestosome 1.
Introduction
Mitochondria are key cellular organelles which provide energy (i.e. ATP) supply, regulate calcium homeostasis and apoptosis, being strikingly abundant in energy-demanding neurons. Mitochondrial dysfunction is a key pathological feature in both sporadic and familial PD [Citation1,Citation2]. Compared to other neuronal cell types, nigrostriatal dopamine neurons are also particularly vulnerable to energy deficiency for various reasons including their unique characteristic of autonomous pacemaker activity, considerable energy requirement for synaptic vesicle recycling and their large complex axonal harbor in the nigrostriatal network [Citation3]. Therefore, maintaining healthy mitochondrial energy supply is crucial to the survival and function of these brain cells.
In order for mitochondria to maintain their function, they require constant turnover to maintain quality control which involves mitochondrial fission. This process divides the organelle into a healthier part which is preserved, and a less healthy part containing defective mitochondrial contents which is removed through ubiquitination and macroautophagy via autophagosomes (i.e., mitophagy) [Citation4–8]. Mitochondrial fission is mediated by processes such as DNM1L (dynamin 1-like) activation which is controlled by other upstream processes such as MAPK/ERK (mitogen-activated protein kinase) activation [Citation9]. Impaired mitophagy will result in accumulation of defective mitochondria resulting in aberrant morphology and function, causing mitochondrial dysfunction, insufficient cellular energy supply and ultimately cell death [Citation10]. Hence, cellular clearance of defective mitochondria is essential to maintain mitochondrial and hence cellular function.
LRRK2 mutations represent one of the commonest genetic risks in both familial and sporadic PD, with increasing penetrance with age [Citation11–14]. Patients with LRRK2-associated PD demonstrate clinical features indistinguishable from typical idiopathic cases [Citation15]. LRRK2 protein is abundantly expressed in the striatal synaptic terminals projecting from dopaminergic neuronal cell bodies in SNpc. At the subcellular level, LRRK2 is associated with synaptic vesicles. There are various pathogenic mutations residing in different domains of this large gene, including R1441G and G2019 mutations. Animals with LRRK2 mutations are established experimental models of PD [Citation16–18]. We previously reported the development of our knockin LRRK2R1441G mouse colony describing its aberrant characteristics including early nigral pre-synaptic dysfunction in young mice [Citation19], susceptibility to rotenone toxicity [Citation20] and age-related accumulation of toxic oligomeric α-synuclein in their striatum caused in part by impaired chaperone-mediated autophagy in mutant mice compared to their wild-type (WT) littermates [Citation21].
Impaired mitophagy has been shown to be one of the key features in both familial and sporadic PD [Citation22]. LRRK2 function and dysfunction have played a role in regulation and control of vesicular trafficking and autophagic pathways [Citation23]. However, the processes linking aberrant mitochondria, mitophagy and its regulatory pathways to LRRK2 are unclear. Elucidation of such processes has important pathogenic and therapeutic implications in PD because of the pivotal role that mitochondria dysfunction plays in its pathogenesis. In this study, we aimed to examine for aberrant mitochondrial morphology and function in our mouse model with LRRK2R1441G knockin mutation, and determine whether these features are linked to impaired mitophagy and some its regulatory pathways.
Results
Higher proportion of ubiquitinated relative to total mitochondria in aged LRRK2R1441G mutant mouse striatum compared to age-matched wild-type controls
LRRK2R1441G knockin mutant mice have been shown to be more vulnerable to mitochondrial dysfunction [Citation20], and exhibited impairment in lysosomal protein degradation in the brain [Citation21]. Here we determined whether LRRK2 mutation impaired clearance of damaged mitochondria under cellular stress. Selective ubiquitination of defective mitochondria is one of the initial events for mitophagy. We isolated total mitochondria from the whole striatum of both young (3-month old) and aged (24-month old) WT and mutant mice to examine the levels of mitochondrial ubiquitination. Total mitochondria were co-stained with antibody against ubiquitin and a mitochondrial dye, MitoTracker Red (). The amount of ubiquitinated mitochondria (FITC-positive and Texas Red-positive; Q2) was shown as percentage of total mitochondria (Texas Red-positive; Q2+ Q3) examined in flow cytometry. We found that the proportion of ubiquitinated relative to total mitochondria in young WT and mutant mice was similar (WT: 7.51 ± 0.28% vs. mutant: 7.99 ± 0.52%; N = 3 pairs of WT and mutant mice). For WT mice, the amount of ubiquitinated mitochondrial between young and aged mice was also similar (young WT: 7.51 ± 0.28% vs. aged WT: 6.93 ± 0.79%; N = 3 pairs of WT and mutant mice). However, the proportion of ubiquitinated mitochondria in aged mutant mice was significantly higher than young mutant mice (young mutant: 7.99 ± 0.52% vs. aged mutant: 11.83 ± 1.9%; N = 3 pairs of WT and mutant mice). Also, the amount of ubiquitinated mitochondria was significantly higher in aged mutant mice compared with age-matched WT mice (WT: 6.93 ± 0.79% vs mutant: 11.83 ± 1.9%; N = 3) (aged WT: 91.8 ± 7.1% vs. aged mutant: 156.0 ± 20.0% of young WT; p < 0.05; N = 3 pairs of WT and mutant mice) (). Furthermore, western blot analysis of ubiquitin level in mitochondrial lysates also showed that ubiquitinated protein level had significantly increased by 44% in aged mutant mice compared with age-matched WT mice (unpaired t-test; p < 0.05; N = 5 pairs of WT and mutant mice) (). To demonstrate the purity of mitochondria isolates, immunoblotting of mitochondrial lysates showed highly enriched mitochondrial marker protein, VDAC (voltage dependent anion channels), whereas only trace amounts of lysosomal protein, LAMP2A, and ACTB were detected in the isolates ().
Figure 1. Accumulation of ubiquitinated mitochondria in aged LRRK2R1441G mutant mouse striata compared to levels in age-matched wild-type (WT) controls. (a) Representative flow cytometry outputs of isolated mitochondria from 6- and 24-month-old WT and LRRK2R1441G mutant mouse striatum co-stained with MitoTracker Red (Texas Red channel) and anti-ubiquitin antibody (FITC channel). A total of ~65 µg of freshly isolated mitochondria were obtained from each 6- and 24-month-old WT and LRRK2 mutant mouse whole striatum, and were resuspended in 125 µl suspension buffer for staining. (b) Relative amount of ubiquitinated mitochondria (Q2) was significantly higher in aged mutant mice (N = 3). (c) Representative immunoblot showing levels of ubiquitinated protein in isolated striatal mitochondrial lysates in 24 month-old WT and mutant mice (WT: wild-type; RG: LRRK2R1441G mutant); COX4 levels indicate loading of mitochondria; Densitometry analysis showing higher level of ubiquitination in striatal mitochondria of aged mutant mice compared with age-matched WT controls. Data represents mean ± standard error of mean (SEM) from three independent experiments (N = 5). Statistical significance between groups was analyzed by unpaired Student’s t-test. * represents statistical significance at p < 0.05. The “N” represents the number of mice used for measurements. (d) Western blot of mitochondrial lysates to demonstrate the purity of mitochondrial isolates. Mitochondrial lysates showed highly enriched mitochondrial marker protein, VDAC, whereas only trace amounts of lysosomal LAMP2A and ACTB protein were detected in the isolates. (e) MitoTracker Red staining efficiency in isolated mitochondria from aged WT and mutant mice. Total mitochondria were stained against a mitochondrial specific marker protein, VDAC (voltage-dependent anion channel), and subsequently stained with MitoTracker Red. The percentage of double-stained mitochondria (Q2) between WT and mutant mice were similar
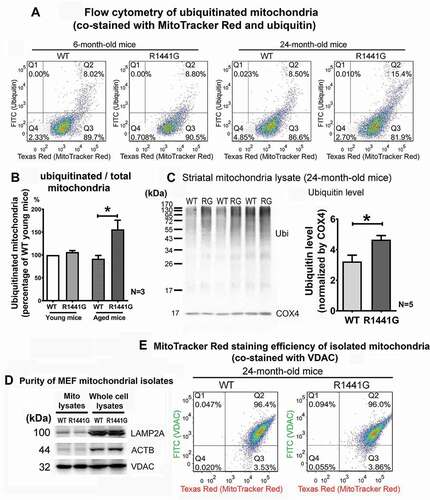
To confirm that mitochondria staining using MitoTracker™ Red was not biased by mitochondrial membrane potential, we compared the staining efficiency of MitoTracker™ Red in freshly isolated mitochondria from aged WT and mutant mouse striata. Total mitochondria were immuno-stained using antibody against a mitochondrial specific marker protein, VDAC. The efficiency of such antibody-based staining is not dependent on mitochondrial membrane potential. Simultaneously, we co-stained these mitochondria with MitoTracker™ Red. The percentage of double-stained mitochondria between WT (Q2: 96.4%) and mutant mice (Q2: 96.0%) in flow cytometry were similar (). Thus the flow cytometry finding of higher levels of ubiquitinated mitochondria in mutant mice was genuine and not due to bias from MitoTracker™ Red preferentially staining depolarized mitochondria.
More small-sized and dumb bell-shaped mitochondria in aged LRRK2 mutant mouse striatum compared to WT mice
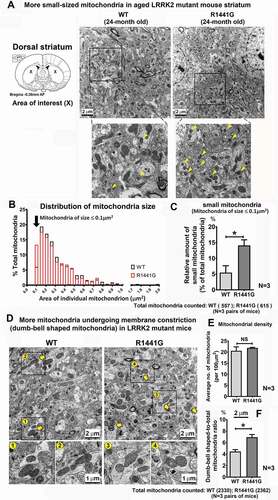
We then examined the mitochondria sizes and morphology in mutant mice compared with age-matched WT mice. A total of 20 random two-dimensional TEM photomicrographs per mouse were taken from the cross-sectional slices of dorsal striatum from 24-month-old WT and LRRK2 mutant mice (). The cross-section areas of individual mitochondrion were determined using image analysis software (Adobe PhotoShop™). Mitochondria of different sizes in each mouse were ranked to reveal their distribution (). There were 1.7-fold more small-sized mitochondria (≤0.1 μm2) in LRRK2 mutant compared with age-matched WT control mice (WT: 5.47 ± 2.18% vs. mutant: 14.09 ± 1.78% of small-to-total mitochondria; unpaired t-test; p < 0.05; N = 3 pairs of WT and mutant mice) (). There was no significant difference in mitochondria density between WT and mutant mice (WT: 20.59 ± 1.77 vs. mutant: 21.88 ± 0.26 mitochondria per 100 µm2; N = 3 pairs of WT and mutant mice) (). However, the ratio of “dumb-bell” shaped to total mitochondria was higher in mutant mice than WT (WT: 4.35 ± 0.41% vs. mutant: 6.92 ± 0.54%; p < 0.05; unpaired t-test; p < 0.05; N = 3 pairs of WT and mutant mice) ().
Figure 2. Small-sized mitochondria and large, “dumb bell”-shaped mitochondria are more abundant in aged LRRK2R1441G mutant mouse striatum compared to numbers in age-matched wild-type mice. (a) Representative TEM photomicrographs showing cross-section of dorsal striatum of aged 24-month old WT and LRRK2 mutant mice; Scale bar: 2 µm. (b) Cross-sectional area of each individual mitochondrion was calculated using image analysis software. Mitochondria of different sizes were ranked to demonstrate their distribution. (c) There were more small-sized (≤0.1 μm2) mitochondria in LRRK2R1441G mutant mice compared with age-matched WT mice (N = 3). Total mitochondria were counted in 5 random micrographs from each of 3 pairs of WT and mutant mice. (Total mitochondria counted: WT: 557; mutant: 615) (d) Representative EM photomicrographs showing more “dumb bell”-shaped mitochondria in aged LRRK2 mutant mouse striatum than in age-matched WT mice. “Dumb-bell” shaped mitochondria are magnified and indicated by yellow arrows (scale bar: 2 µm) and magnified (scale bar: 1 µm). (e) There was no significant difference in mitochondria density between WT and mutant mice. (f) However, the ratio of “dumb-bell” shaped to total mitochondria was higher in mutant than WT mice (N = 3). Total mitochondria were counted in 20 random micrographs from each of 3 pairs of WT and mutant mice. (Total mitochondria counted: WT: 2330; mutant: 2362). Statistical significance between groups was analyzed using Student’s unpaired t-test, * and ** represent p < 0.05 and p < 0.01, respectively
Mitochondria from aged LRRK2 mutant mouse brain showed disrupted cristae and lower ATP production
Given such differences in mitochondria ubiquitination, morphology, and size in aged LRRK2 mutant mice compared to WT mice, we determined whether there is functional deficit in the mitochondria in these aged mutant mice. Under electron microscopy, mitochondria at the striatal pre-synaptic terminal in mutant mice showed disrupted cristae (). In contrast, mitochondria in age-matched WT mice appeared intact with orderly packed cristae structure.
Figure 3. Mitochondria from aged LRRK2R1441G mutant mouse brain showed disordered cristae and lower ATP production. (a) Representative EM photomicrographs showing four cross-sections of mitochondria (M) in striatal presynaptic terminals of aged (18-month old) WT and LRRK2 mutant mice. In WT mice the cristae are in an ordered formation, whereas in the LRRK2 mutant mice the cristae are in a disordered state; Scale bar: 0.4 µm. (b) Typical oxygraph produced using freshly isolated mitochondria were incubated in a microcell of Clarke-type oxygen electrode, maintained at 37°C with glutamate/malate (complex I substrate) and ADP (0.3 mM). ATP extraction buffer was added into the microcell to stop mitochondrial activity after 2 min of incubation. ATP level was determined by luciferase bioluminescence assay to determine the amount of newly synthesized ATP in mitochondria. (c) Isolated mitochondria from aged LRRK2 mutant mice produced less ATP compared with mitochondria from the age-matched WT controls. Basal ATP level of striatal mitochondria isolated from 18-month old WT and mutant mice was similar (WT: 2.668 ± 0.224 nmol/mg mitochondrial protein; LRRK2R1441G: 3.352 ± 0.443 nmol/mg mito protein). (d) Representative western blots of mitochondrial marker protein, VDAC, demonstrates equal loading of mitochondria in microcell. Data represents mean ± standard error of mean (SEM) from five independent experiments (N = 5). The “N” represents the number of mice used for measurements. Each experiment was performed in duplicate. Statistical significance between groups was analyzed by Student’s unpaired t-test. *P < 0.05. M: mitochondria
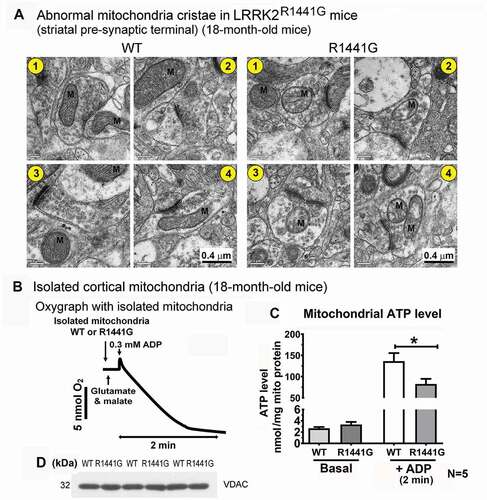
Since structural disruption of cristae may impair oxidative phosphorylation and ATP production, we isolated total mitochondria from WT and mutant mouse brains to determine their basal ATP levels and their ability to synthesize ATP. There was no significant difference in the basal ATP level of freshly isolated striatal mitochondria from 18-month old WT and mutant mice (WT: 2.668 ± 0.224 nmol/mg mitochondrial protein; mutant: 3.352 ± 0.443 nmol/mg mitochondrial protein; N = 5). Freshly isolated mitochondria were incubated in an airtight and temperature-controlled microcell with mitochondrial Complex-I substrate and ADP to induce oxidative phosphorylation and ATP synthesis (i.e. State-3 respiration). During incubation, changes in oxygen consumption in the microcell were monitored with a Clarke-type oxygen electrode. After addition of substrates, oxygen level in the microcell dropped gradually indicating oxidative phosphorylation and ATP synthesis in State-3 respiration (). As ADP inside the microcell was consumed, the rate of oxygen consumption decreased until the mitochondria exhibited State-4 respiration. At this point, the oxidative phosphorylation reaction was stopped to determine the amount of newly synthesized ATP in the mitochondria. Given the same amount of ADP added into the microcell, WT mitochondria synthesized a net amount of 133.8 nmol ATP/mg mitochondrial protein, whereas mutant mitochondria only synthesized 79.3 nmol ATP/mg mitochondrial protein. Thus, mutant mitochondria produced 41% less ATP than WT mitochondria (unpaired t-test; p < 0.05, N = 5) (). Western blot of mitochondrial marker protein, VDAC (voltage-dependent anion channel) verified that there was similar loading of mitochondria in each sample ().
LRRK2 mutant MEFs were more susceptible to FCCP-induced ATP deficiency compared to WT cells
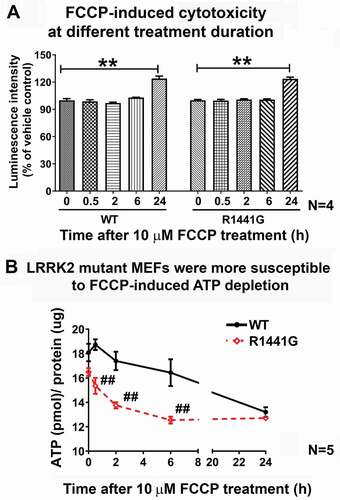
We determined the susceptibility of LRRK2 mutant cells to mitochondrial stress induced by carbonyl cyanide-4-(trifluoromethoxy)phenylhydrazone (FCCP) using MEFs derived from LRRK2R1441G knockin mice and their WT littermates [Citation21]. FCCP is an oxidative phosphorylation uncoupler which depolarizes and causes damage to mitochondria. Initially, we determined a specific time point when FCCP treatment (10 µM) had not caused cell death. Cells were treated with FCCP at 10 μM from 0–24 h. At 6 h of FCCP treatment, no obvious cell death was observed in both WT and mutant MEFs compared to time zero (N = 4) (). In contrast, FCCP treatment for 24 h resulted in significant cell death in both WT and mutant MEFs (one-way ANOVA; p < 0.01; N = 4). Moreover, FCCP treatment caused a gradual decrease in total intracellular ATP levels in both WT and mutant MEFs. However, LRRK2 mutant MEFs showed significantly lower ATP level than those levels in WT cells at 0.5 h (18.0%), 2 h (
21.0%) and 6 h (
23.7%) after FCCP exposure (one-way ANOVA; all p < 0.01, N = 5) (). These results indicated that LRRK2 mutant cells were more susceptible to FCCP-induced ATP depletion.
Figure 4. LRRK2R1441G mutant mouse embryonic fibroblasts (MEFs) were more susceptible to FCCP-induced ATP depletion than WT control cells. (a) FCCP is an oxidative phosphorylation uncoupler which depolarizes and causes damage to mitochondria. A treatment time point of FCCP (10 µM) before cell death occurred was determined in WT and LRRK2 mutant MEFs using the ToxiLight™ Nondestructive Cytotoxicity BioAssay Kit. No obvious cell death was observed under FCCP (10 μM) toxicity within 6 h of treatment in both WT and mutant MEFs (N = 4). Each experiment was performed in triplicate. Statistical significance between groups was analyzed by one-way ANOVA. **P < 0.01. (b) Intracellular ATP level was significantly lower in mutant MEFs compared to WT at 0.5, 2 and 6 h after FCCP (10 μM) treatment. Data represents mean ± standard error of mean (SEM) from five independent experiments (N = 5). Statistical significance among groups was analyzed by one-way ANOVA. ##P < 0.01 represents statistical significance between WT and mutant MEFs at the same time point of FCCP treatment
Level of SQSTM1 recruitment to mitochondria was higher in LRRK2 mutant MEFs
Recruitment of SQSTM1 (a cargo receptor which delivers ubiquitinated substrates for autophagic degradation) to ubiquitinated mitochondria is one of the key early events to initiate mitophagic degradation [Citation24]. FCCP treatment which induces mitochondrial depolarization can initiate mitophagy [Citation25,Citation26]. We compared the levels of SQSTM1 recruitment to mitochondria in WT and mutant MEFs after FCCP treatment in flow cytometry. To confirm that FCCP treatment depolarized mitochondria in our MEF cultures, we measured the relative mitochondrial membrane potential (MMP) of WT and LRRK2 mutant MEFs after FCCP treatment at 0, 15, 30 min by TMRM staining in flow cytometry. Before FCCP treatment, LRRK2 mutant MEFs under normal culture condition exhibited more depolarized mitochondria as shown by significantly lower TMRM fluorescence intensity compared to WT cells (p < 0.01; N = 4) (). Treatment with FCCP (10 µM) caused significant mitochondrial depolarization in both WT and mutant MEFs as shown by decreased TMRM fluorescence intensity compared to their corresponding treatment groups at time = 0 (unpaired t-test; all p < 0.01; N = 4).
Figure 5. Levels of SQSTM1 recruitment to mitochondria was significantly higher in LRRK2R1441G mutant MEFs. (a) Depolarization of mitochondrial membrane potential (MMP) by FCCP treatment was determined by TMRM staining. FCCP (10 µM) treatment caused mitochondrial depolarization as indicated by decrease of TMRM fluorescence over 6 h as measured by flow cytometry. Mitochondria from mutant MEFs were more depolarized compared to those from WT cells (unpaired t-test; p < 0.01; N = 4). Also, mutant mitochondria were significantly more depolarized compared to mitochondria of WT cells under the same FCCP treatment (unpaired t-test; p < 0.01 for 15 & 30 min; N = 4). (b) Total mitochondria were isolated from WT and mutant MEFs after treatment with FCCP to determine the levels of SQSTM1 recruitment to mitochondria. Isolated mitochondria were immuno-stained against SQSTM1 (FITC-channel) and counter-stained with MitoTracker Red (Texas-Red channel). Double-stained particles as illustrated in Q2 represent SQSTM1 conjugated mitochondria. (c) LRRK2 mutant MEFs under normal condition showed significantly higher level of mitochondrial SQSTM1 recruitment than WT cells under normal condition (p < 0.01; N = 3). However, FCCP exposure for 2 h caused 54% increase (i.e. 18.4% → 30.4%; p < 0.05) in SQSTM1 recruitment for WT MEFs, whereas only 12% increase (i.e. 25.6% → 26.6%; not statistically significant) in mutant cells. Data represents mean ± standard error of mean (SEM). Statistical significance between groups was analyzed by unpaired Student’s t-test. *P < 0.05, **P < 0.01
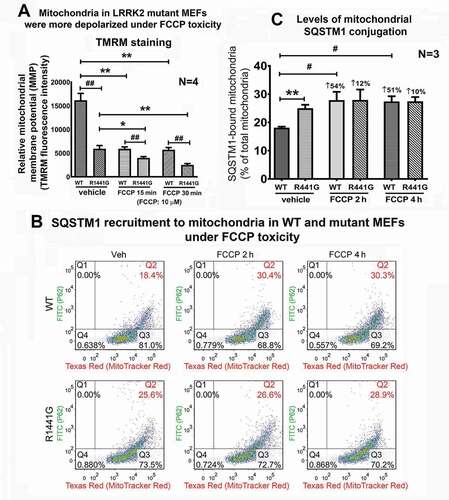
To compared the levels of SQSTM1 recruitment to mitochondria, isolated mitochondria were immuno-stained against SQSTM1 (FITC channel) and co-stained with MitoTracker™ Red (Texas Red channel) (). Our results showed that level of SQSTM1 recruitment to mitochondria (as illustrated at Q2) in mutant MEFs was significantly higher than WT cells under normal culture condition (unpaired t-test; WT: 18.4% vs. mutant: 25.6%; p < 0.01, N = 3) (), indicating that more mitochondria were labeled for mitophagy in mutant cells. FCCP treatment for 2 and 4 h significantly increased SQSTM1 recruitment in WT cells by 54% and 51%, respectively compared to their vehicle-treated WT control cells (unpaired t-test; p < 0.05; N = 3). However, similar FCCP treatment for 2 and 4 h only increased SQSTM1 recruitment by 12% and 10% respectively in mutant cells. Both time points did not reach statistical significance compared to their corresponding vehicle-treated mutant control cells (N = 3) ().
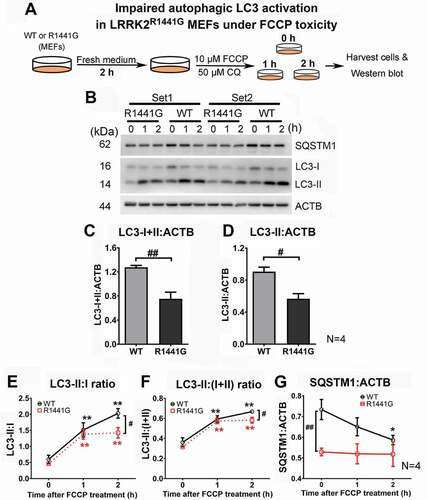
Lower LC3-II:(I+ II) ratio and SQSTM1 level in LRRK2 mutant MEFs under FCCP toxicity
In view of our findings that there was an accumulation of ubiquitinated mitochondria and impaired ATP production in aged LRRK2 mutant brains, we explored whether these defects were associated with impaired autophagic clearance of mitochondria. Mitochondrial damage was induced by treating both WT and mutant MEFs with 10 μM FCCP for 2 h (). Autophagic activation was determined by measuring LC3-I and LC3-II levels and normalized by a housekeeping protein, ACTB/actin. Before FCCP treatment, MEFs were refreshed with new medium for 2 h to minimize basal autophagy. A macroautophagy inhibitor, chloroquine (CQ), was added in culture medium throughout the experiment to inhibit downstream degradation of autophagosomes which enabled quantification of LC3-II (). Total LC3 (LC3-I+ II:ACTB ratio), an indicator of cellular capacity to undergo macroautophagy, was significantly lower in mutant MEFs compared with WT MEFs by 41.1% (unpaired t-test; p < 0.01, N = 4) (). Similar measurement of LC3-II:ACTB ratio was significantly lower in mutant than WT cells after FCCP treatment (unpaired t-test; p < 0.05, N = 4) (). Although FCCP (10 μM) treatment over 2 h resulted in a gradual increase in LC3-II:I+ II and LC3-II:I ratios in both WT and mutant MEFs compared with their corresponding ratios prior to treatment (one-way ANOVA; p < 0.05 for both WT and mutant; N = 4), these two ratios in mutant MEFs were significantly lower than those in WT cells at 2 h of FCCP treatment [LC3-II:I ratio: ̶ 29.8%; LC3-II:(I+ II) ratio: ̶ 12.8% as compared to WT; all p < 0.05, N = 4], indicating impaired autophagic LC3 activation in mutant MEFs (). Furthermore, the level of SQSTM1, a cargo receptor which delivers ubiquitinated substrates for autophagic degradation, was also significantly lower in mutant MEFs compared with WT MEFs by 27.9% (one-way ANOVA; p < 0.05, N = 4) ().
Figure 6. Cytosolic LC3-II:(I+II) ratio and SQSTM1 level were lower in LRRK2R1441G mutant MEFs than in WT under FCCP-induced toxicity. (a) Level of autophagic LC3 activation was compared between WT and mutant MEFs after FCCP treatment. MEFs were refreshed with new medium for 2 h to minimize basal autophagy before FCCP treatment. Chloroquine (CQ) was added to prevent degradation of autophagosomes and allowed quantitation of activated LC3-II; (b) Two representative sets of western blots showing changes of autophagy markers, LC3-II:I and SQSTM1 in WT and mutant MEFs under FCCP toxicity. (c) Both ratios of LC3-I+II:ACTB and (d) LC3-II:ACTB in mutant MEFs were significantly lower than WT cells (all p < 0.05; N = 4). (e) Similarly, ratios of LC3-II (active):LC3-I (inactive) and (f) LC3-II:(LC3-I+II) (total LC3) were also significantly lower in mutant MEFs compared to WT cells after FCCP treatment for 2 h (all p < 0.05; N = 4). (g) SQSTM1, a reporter protein of autophagy activity, was significantly lower in mutant MEFs. Data represent mean ± standard error of mean (SEM) from four independent experiments (N = 4). Statistical significance between groups was analyzed by one-way ANOVA, *P < 0.05; **p < 0.01; or unpaired Student’s t-test, #p < 0.05; ##p < 0.01 compared to WT cells
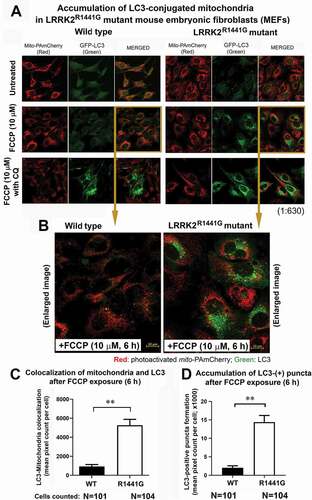
Abnormal accumulation of LC3-positive aggregates under mitochondrial stress in LRRK2 mutant MEFs
Having shown that there was impaired LC3 activation in LRRK2 mutant cells after FCCP exposure, we proceeded to determine whether there was impaired LC3-mediated clearance of mitochondria. Here, we developed clones of WT and mutant MEFs which co-expressed mitochondrial-specific PAmCherry (mito-PAmCherry) and GFP-conjugated LC3 (GFP-LC3) in order to study autophagosome formation and clearance after mitochondrial stress by FCCP. Cells were refreshed in new medium for 2 h prior to photoactivation and treatment with FCCP (10 μM) for 6 h. Recruitment to LC3 with and without CQ was visualized under confocal microscopy (). Mitochondria were visualized by red fluorescence emitted from photoactivated mito-PAmCherry. Green puncta formation after FCCP treatment indicated recruitment of LC3 (i.e., GFP-LC3) to form autophagosomes. Accumulation of green puncta (i.e., GFP-LC3) within the cells after FCCP treatment indicated recruitment of LC3 to form autophagosomes. Autophagosomes would normally undergo lysosomal fusion and degradation, and hence the green puncta would disappear. If autophagic degradation processes are impaired (or chemically blocked by CQ), the green puncta will persist and accumulation will be seen (). In WT MEFs, no obvious GFP-LC3 puncta were seen after FCCP treatment for 6 h. However, accumulation of these puncta occurred in WT cells after CQ was added (). Conversely, mutant MEFs showed persistence of puncta accumulation even without CQ as shown by significantly higher level of a) LC3-positive green puncta, and b) colocalization of red-labeled mitochondria and green-labeled LC3 (all p < 0.01; N ≥ 101 cells randomly selected from cultures) (), indicating that mitochondria which had been recruited to LC3 were not eventually degraded in mutant MEFs, unlike in WT cells.
Figure 7. Abnormal accumulation of GFP-LC3 aggregates in LRRK2R1441G mutant MEFs under mitochondrial stress indicating impaired mitophagy. (a) Mitochondrial-specific mito-PAmCherry (red) and GFP-LC3 (green) were co-expressed in WT and LRRK2 mutant MEFs. Cells were treated with FCCP (10 μM) for 6 h to induce mitochondrial stress and recruitment of mitochondria to LC3 with and without chloroquine (autophagy inhibitor; CQ). Magnification: 1 × 630. (b–d) Magnified images of WT and mutant MEFs after FCCP treatment. Mitochondria were visualized by photoactivated mito-PAmCherry (Red) after photoactivation. GFP-LC3 aggregation was demonstrated by formation of green puncta, which indicated formation of autophagosomes after LC3 activation. LRRK2 mutant MEFs showed abnormal accumulation of green puncta after mitochondrial stress by FCCP without degradation. This contrasted with what occurred in WT cells undergoing the same treatment, where significantly fewer green puncta were accumulated in the cells. Data represent mean ± standard error of mean (SEM). Statistical significance between groups was analyzed by unpaired Student’s t-test, **P < 0.01
Cellular clearance of mitochondria was slower in LRRK2 mutant than in WT MEFs under both normal and FCCP-treated conditions
Having shown the abnormalities in LC3-mediated autophagic processes in LRRK2 mutant MEFs, we proceeded to develop a novel method to confirm and quantify the extent of impairment in the mutant cells. We developed a new flow cytometry assay to estimate the rate of mitochondria clearance based on decline of a mitochondrial-specific photoactivatable mito-PAmCherry fluorescence in a cell over time. Firstly, we confirmed the stability of photoactivated mito-PAmCherry fluorescence signal over time. Both WT and LRRK2 mutant MEFs expressing mito-PAmCherry were photoactivated, then fixed and kept at 4°C for at least 4 days before flow cytometry measurements. Our assay showed that there was no significant difference in the cellular fluorescence intensity after 4 days of storage compared to their corresponding initial levels at t = 0 (Figure S1J). As different initial fluorescence intensities may potentially confound the observed rate of decline, we measured initial mito-PAmCherry fluorescence intensities of WT and mutant MEFs immediately after photoactivation (i.e. t = 0) and found no significant difference between the two cell lines (Figure S1I). Differences in cell proliferation rate may also affect the observed fluorescence intensity per cell during the time course of the assay as the observed fluorescence intensity in a cell may be halved after it divides into two cells. We confirmed that there was no significant difference in cell proliferation rates of WT and mutant MEFs (Figure S1K).
Additional experiments were performed to confirm the specificity of autophagic degradation in our mitochondrial clearance assay using two different autophagy inhibitors which specifically block macroautophagy [i.e. chloroquine (CQ)] and mitophagy [i.e. cyclosporine A (CsA)] [Citation27–29]. Treatment with CQ (100 µM) significantly reduced the rate of mito-PAmCherry clearance at 24 h after photoactivation in WT MEFs compared to untreated control cells (Figure S1A-D). Similarly, treatment with CsA (10 µM), a specific mitophagy inhibitor, also significantly reduced the rate of mito-PAmCherry clearance compared to their untreated control cells (Figure S1E-H). These findings indicate that autophagic degradation of mitochondria contributed to the decline of mito-PAmCherry fluorescence in this assay.
To compare the relative rate of mitochondria clearance between WT and LRRK2 mutant MEFs, cells stably expressing mito-PAmCherry after photoactivation were fixed and collected at different time points (0, 6, 24 h). The mean intensities of mito-PAmCherry fluorescence in each of the WT and mutant cells at different time points were measured in order to establish the decay curves with and without FCCP (2 or 10 μM) treatment. The relative rate of mitochondrial clearance was expressed as percentage change of mito-PAmCherry fluorescence intensity in the cells over time compared to their respective basal levels at t = 0 (). WT and mutant MEFs possessed similar amounts of total mitochondria as indicated by similar levels of COX4/COXIV (cytochrome c oxidase subunit 4) level normalized to ACTB at t = 0 (). Therefore, the relative rates of mitochondrial clearance were truly representative of the absolute rates of mitochondrial degradation in these MEFs.
Figure 8. The relative rate of mitochondrial clearance was slower in LRRK2R1441G mutant than in WT MEFs. (a) To address the effects of LRRK2R1441G mutation on rate of mitochondrial clearance, WT and mutant MEFs were transduced by lentivirus to stably express mitochondria-specific photoactivatable PAmCherry (mito-PAmCherry), which emitted red fluorescence after photoactivation. The initial (level) and the subsequent decline in the levels of red fluorescence from mito-PAmCherry in each treatment group at 6 and 24 h after FCCP exposure were measured by flow cytometry; (b) Western blotting of mitochondrial COX4 showed that levels of basal amount of mitochondria in WT and mutant MEFs were similar before mitochondria clearance assay (t = 0); (c) The rate of photoactivated mito-PAmCherry clearance indicating mitochondria clearance in mutant MEFs was significantly slower than in WT MEFs under both normal (p < 0.01; N ≥ 7) and 2 μM FCCP-treated conditions (p < 0.05; N ≥ 7). Statistical significance between groups was analyzed by three-way ANOVA and Tukey’s multiple comparison (); Data represents mean ± standard error of mean (SEM) from seven independent experiments (N = 7). Statistical significance between groups was analyzed by unpaired Student’s t-test. *P < 0.05, **P < 0.01. (d) No significant difference in the cell proliferation rates of WT and mutant MEFs during the time course of the assay. Thus, the observed difference in the rate of mitochondrial clearance was not due to difference in rate of cell proliferation between the two cell lines (N ≥ 4). Data represents mean ± standard error of mean (SEM) from seven independent experiments (N ≥ 4). Statistical significance between groups was analyzed by unpaired Student’s t-test, **P < 0.01
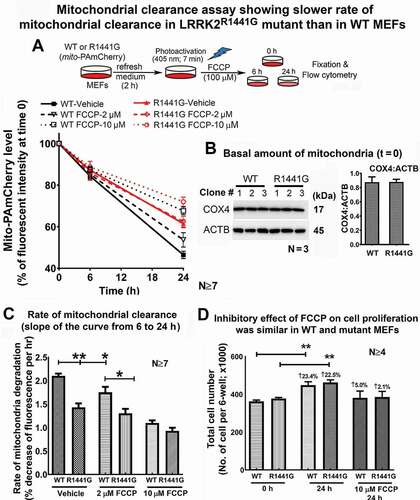
Both WT and mutant cells cultured under normal conditions showed a progressive decline in mito-PAmCherry intensity over 24 h as compared to their corresponding levels at t = 0, with the mutant cells showing a lower basal rate of mitochondrial clearance than WT cells (WT: −53.56%; mutant: −39.15%; p < 0.01, N ≥ 7) (). Furthermore, FCCP treatment at 2 and 10 μM caused a dose-dependent decrease in the rate of mitochondrial clearance in both WT and mutant cells, but the rate of clearance over 24 h in mutant MEFs measured as percentage decline of fluorescence per hour in culture was significantly lower than WT [WT: −2.103 ± 0.05% per h vs. mutant: −1.485 ± 0.093% per h; unpaired t-test, p < 0.01, N ≥ 7). Three-way ANOVA on the effect of a) Time, b) FCCP toxicity and c) LRRK2 mutation has shown significant difference between WT and mutant MEFs [F(1,114) = 18.94, p < 0.01, N ≥ 7], and interaction between FCCP toxicity and mutation [F(1,114) = 5.006, p < 0.05, N ≥ 7]. All other statistical comparisons were summarized in . There was no significant difference in the cell proliferation rates of WT and mutant MEFs during the time course of the assay (). Thus, the observed difference in the rate of mitochondrial clearance was not due to difference in rate of cell proliferation between the two cell lines (N ≥ 4).
Table 1. Three-way ANOVA results of mitochondria degradation curve in Figure 8A
DNM1L knockdown resulted in greater disruption of mitochondrial network structures in LRRK2 mutant MEFs
DNM1L (dynamin 1-like protein) has been shown to regulate mitochondrial morphology via mediating fission [Citation9]. Therefore, we explored whether the level of DNM1L has played a role in the cellular architecture of the mitochondria and contributed to a lower rate of mitochondria clearance in LRRK2 mutant cells. Under fluorescence microscopy of mito-PAmCherry, we found morphological differences in mitochondria between WT and LRRK2 mutant MEFs under normal culture conditions. Knockdown of DNM1L by siRNA transfection for 72 h significantly reduced endogenous DNM1L protein levels by 74% and 77% in WT and mutant MEFs, respectively (unpaired t-test; all p < 0.01; N = 3) (). Before DNM1L knockdown, mitochondria in WT MEFs appeared as interconnected tubular network, whereas those in LRRK2 mutant cells existed as relatively shorter swollen tubes (). Knockdown of DNM1L expression in WT MEFs disrupted the interconnected tubular network structure to become segmented swollen tubes similar to those in mutant cells without DNM1L knockdown (). Similar abnormal morphology of swollen tubes was also observed in mutant MEFs after DNM1L knockdown (). Furthermore, we explored the consequence of DNM1L depletion in WT and mutant cells under FCCP toxicity. FCCP treatment for 24 h caused mitochondrial fragmentation in both WT and mutant cells (). However, incomplete mitochondrial fragmentation (swollen tubes) in DNM1L-knockdown WT MEFs was observed when these cells were treated with FCCP. An even stronger effect of DNM1L knockdown was observed in LRRK2 mutant MEFs treated with FCCP as shown by accumulation of large rounded aggregates of mitochondria ().
Figure 9. Knockdown DNM1L expression perturbed mitochondrial network resulting in mitochondrial aggregation and reduced degradation in LRRK2R1441G mutant MEFs under FCCP toxicity. (a) WT and LRRK2 mutant MEFs were transfected with either DNM1L siRNA(S) or scrambled negative siRNA for 72 h to knockdown DNM1L expression. Cells were then treated with FCCP (2 µM) for 6 h to study their corresponding changes in mitochondrial morphology. The rates of photoactivated mito-PAmCherry clearance indicating mitochondrial clearance were assayed by flow cytometry over 24 h. (b and c) Transfection of Dnm1l siRNA(s) significantly reduced endogenous DNM1L (total and p-Ser616) protein expression in both WT and mutant MEFs to similar extent; (d) DNM1L knockdown did not affect mitochondrial content in both WT and mutant MEFs (N = 3); (e) Cartoon representation of different mitochondrial morphologies under confocal microscopy of WT and LRRK2 mutant MEFs. (f) Photomicrographs in red demonstrate changes in mitochondria morphologies in WT and mutant MEFs after DNM1L knockdown with/without FCCP treatment (Magnification: 1 × 630); Photomicrographs in white are the enlarged images of the designated square boxes in the red photomicrographs. Morphological differences in mitochondria between WT and LRRK2 mutant cells were observed under normal culture conditions. Mitochondria in WT MEFs existed as an interconnected tubular network, whereas mitochondria in mutant MEFs appeared as swollen tubes. DNM1L knockdown in WT MEFs caused the interconnected tubular mitochondrial network to become individual swollen tubes. Similar morphology of swollen tubes was also observed in mutant MEFs after DNM1L knockdown. Incomplete mitochondrial fragmentation (short separate tubes & swollen tubes) in DNM1L-knockdown WT MEFs was observed when these cells were treated with FCCP. An even stronger effect of DNM1L knockdown was observed in LRRK2 mutant MEFs as shown by accumulation of large rounded aggregates of mitochondria in these cells under FCCP toxicity. (g) Diagrammatic illustration of experimental protocol of mitochondrial clearance assay with/without FCCP treatment after DNM1L knockdown. FCCP treatment resulted in decreased rate of mitochondrial clearance in both WT and mutant cells compared to their corresponding untreated control groups in 24 h (all p < 0.01; N ≥ 3). Knockdown of DNM1L expression in WT and mutant cells with FCCP treatment resulted in even lower rate of mitochondrial clearance. Data represents mean ± standard error of mean (SEM) from at least three independent experiments (N ≥ 3). Statistical significance between groups with/without DNM1L knockdown was analyzed by three-way ANOVA and Tukey’s multiple comparison test (Table 2), * and ** represent statistical significance at p < 0.05 and p < 0.01, respectively
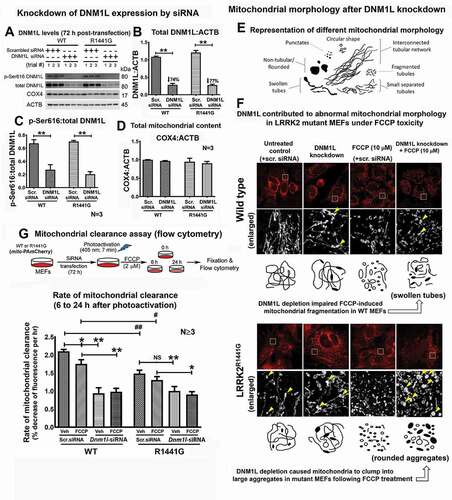
DNM1L knockdown resulted in slowing of mitochondria clearance in both WT and LRRK2 mutant MEFs to similar rates
We assayed the rate of mitochondrial clearance from 0 to 24 h in DNM1L knockdown WT and mutant MEFs (). The relative rate of mitochondria clearance in mutant MEFs transfected with scrambled negative siRNA was significantly slower than their WT counterparts having similar transfection [Three-way ANOVA; F(1,84) = 40.06, p < 0.01; N = 8] (). Knockdown of DNM1L expression significantly reduced relative rate of mitochondria clearance by 55.3% in WT (Scr. siRNA: ─2.103 ± 0.05% vs. Dnm1l-siRNA: ─0.941 ± 0.15% per h; unpaired t-test; p < 0.01, N ≥ 3) and by 32.5% in mutant MEFs (Scr. siRNA: ─1.485 ± 0.09% vs. Dnm1l-siRNA: ─1.003 ± 0.12% per h; unpaired t-test; p < 0.01, N ≥ 3), as compared to that without DNM1L knockdown (). Three-way ANOVA showed that there was significant interaction among a) Time, b) DNM1L knockdown, and c) LRRK2 mutation [F(2,84) = 3.450, p < 0.05; N = 8]. The levels of mitochondria content between WT and mutant MEFs before and after DNM1L knockdown were similar (). These findings indicate that the effect of DNM1L on mitochondrial clearance was less apparent in mutant cells.
Table 2. Three-way ANOVA results of mitochondria clearance curve in Figure 9 G
FCCP (2 µM) treatment resulted in decreased rate of mitochondrial clearance by 16.6% in WT MEFs transfected with scrambled siRNA compared to their corresponding untreated control groups (WT-vehicle: ─2.103 ± 0.05% per h vs. WT-FCCP: ─1.752 ± 0.117% per h; p < 0.05, N ≥ 7). However, the effect of FCCP on reducing rate of mitochondrial clearance was less apparent (12.1%) in mutant cells (mutant-vehicle: ─1.485 ± 0.093% per h vs. mutant-FCCP: ─1.304 ± 0.095% per h, N ≥ 7). Nevertheless, LRRK2 mutant MEFs had a significantly lower rate of clearance by 25.6% compared to WT cells under FCCP treatment (unpaired t-test; WT-FCCP: ─1.752 ± 0.117% per h vs. mutant-FCCP: ─1.304 ± 0.095% per h; p < 0.05; N = 7) (). Addition of FCCP treatment after DNM1L knockdown did not have any further effects on mitochondrial clearance in both WT and mutant cells (). These findings indicate that DNM1L plays a critical role in mitochondrial clearance, which is impaired in mutant cells.
To further investigate whether the reduced mitochondrial clearance rate could be attributed to hyperactive LRRK2 kinase activity in LRRK2R1441G mutant MEFs, we treated both WT and mutant cells with GNE-7915, a LRRK2 kinase inhibitor (10 and 100 nM) before subjecting to mitochondrial clearance assay (Figure S2A). RAB10 (RAB10, member RAS oncogene family) (Thr73) is one of the phosphorylation targets of LRRK2, and the level of phosphorylated RAB10 (Thr73) reflects cellular LRRK2 kinase activity [Citation30]. LRRK2 inhibition effect of GNE-7915 was confirmed with significant reduction in RAB10 (Thr73) phosphorylation in GNE-7915-treated cells (Figure S2B). However, LRRK2 inhibition did not have a significant effect on rate of mitochondrial clearance (N ≥ 4) (Figure S2C-E), suggesting that impaired mitochondrial clearance in LRRK2 mutant cells is unlikely to be directly related to its hyper-kinase activity alone.
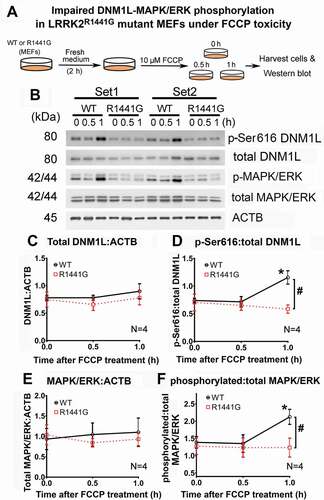
Phosphorylation of DNM1L (Ser616) and MAPK/ERK was impaired in LRRK2 mutant MEFs when stressed with FCCP
In the section above, we showed that knockdown of DNM1L expression adversely affected mitochondrial network structure and the rate and magnitude of mitochondria clearance in both mutant and WT MEFs (). Therefore, we explored whether mitochondrial fission-related DNM1L-MAPK/ERK signaling was perturbed under FCCP toxicity in LRRK2 mutant MEFs compared with WT MEFs (). DNM1L (Ser616), which promotes mitochondrial fission, was strongly phosphorylated after 1 h of FCCP exposure in WT MEFs but not in LRRK2 mutant cells (). The ratio of pSer616-to-total DNM1L increased significantly by 52.8% after FCCP exposure for 1 h in WT MEFs (one-way ANOVA; p < 0.05, N = 4) (). However, this ratio was not increased in mutant MEFs after FCCP exposure, which was significantly lower than that of WT cells by 39.4% under the same treatment (one-way ANOVA; p < 0.05, N = 4) (). MAPK/ERK, which mediates DNM1L phosphorylation, was also significantly phosphorylated in WT MEFs after FCCP exposure (). Similar to DNM1L phosphorylation, the ratio of p-MAPK/ERK-to-total MAPK/ERK has increased significantly by 30.9% after FCCP exposure for 1 h in WT MEFs, but such an increase was not observed in mutant MEFs (one-way ANOVA; p < 0.05, N = 4) (). There were no significant differences in total expression levels of DNM1L () and MAPK/ERK () in WT and mutant MEFs during the course of FCCP treatment. These findings indicate that the stress response to FCCP associated with DNM1L:MAPK/ERK phosphorylation is impaired in LRRK2 mutant cells.
Figure 10. FCCP toxicity-induced phosphorylation of DNM1L (p-Ser616) and MAPK1/ERK2-MAPK3/ERK1 in WT MEFs but not in LRRK2R1441G mutant MEFs. (a) Diagrammatic representation of experimental protocol to induce DNM1L:MAPK/ERK phosphorylation by FCCP (10 μM) toxicity; (b) Representative immunoblots of two independent sets of MEFs treatments with FCCP for 0, 0.5 and 1 h, showing changes in level of phosphorylated DNM1L (p-Ser616) and phosphorylated MAPK1/ERK2-MAPK3/ERK1 (p-ERK); (C-F) FCCP exposure for 1 h increased phosphorylation of DNM1L (Ser616) and MAPK1/ERK2-MAPK3/ERK1 (p-MAPK/ERK) in WT, but such phosphorylation in mutant MEFs was not observed. Data represent mean ± standard error of mean (SEM) from four independent experiments (N = 4). Statistical significance between groups was analyzed by one-way ANOVA, *P < 0.05 represents statistical significance between the level at designated treatment time and its corresponding level at t = 0. #p < 0.05 represents statistical significance between WT and mutant MEFs at designated time point
Discussion
In this study, we have presented data on various aspects of mitochondrial metabolism in mice carrying the LRRK2R1441G mutation and in cells derived from them. These homozygous knock-in animals express the mutant protein at the same levels as their WT littermates, which mirrors the effects of the same mutation in human PD, unlike many transgenic animal models where the mutant gene is randomly incorporated into the animal genome [Citation31]. We reported previously that LRRK2R1441G mutation increases vulnerability to mitochondrial dysfunction in mice [Citation19,Citation20]. These mutant mice demonstrated Complex-I deficiency and were more susceptible to locomotor deficits after chronic (over half of the mice’s lifespan) exposure to sub-lethal oral doses of rotenone (organic pesticide) [Citation20]. More recently, we showed an age-dependent accumulation of oligomeric α-synuclein in our aged LRRK2 mutant mouse brains associated with impaired lysosomal degradation [Citation21]. These subtle nigrostriatal deficits observed in our aged mutant mice recapitulate some of the earliest pathogenic features of PD highlighting the underlying mechanisms that trigger the disease as the brain ages [Citation32]. It is important to note that the only difference between the WT and our mutant LRRK2R1441G (which otherwise share the same genetic background as WT littermates, having back-crossed with WT mice for over eight generations) mice is a single base substitution at the same gene location as the human carrier of the LRRK2 mutation [Citation19]. Hence, it is not surprising that our mice carrying the LRRK2R1441G mutation have subtle neuropathology and lack overt motor abnormalities, not unlike those non-symptomatic human carriers of the LRRK2 mutation [Citation33]. Thus, our LRRK2 mutant mouse represents a useful model to explore age-dependent pathogenic mechanisms and potential therapies.
Selective ubiquitination of defective mitochondria is one of the key initial events of mitophagy prior to lysosomal fusion and degradation [Citation34]. Levels of mitochondrial ubiquitination reflect the number of damaged mitochondria which are targeted for mitophagic degradation. Some outer mitochondrial membrane proteins, including BAX, DNM1L, MFN1/2, and VDAC, have been shown to be ubiquitinated in defective mitochondria [Citation35–38]. A recent study showed that ubiquitination also occurred in proteins located in the matrix and inner mitochondrial membrane [Citation39]. Using a new flow cytometry approach, we can differentiate and quantify ubiquitinated mitochondria from its total pool and other cellular organelles. We found that the proportion of ubiquitinated mitochondria relative to its total pool in the striata of aged mutant mice was 1.7 times higher than that in age-matched WT mice. Interestingly, no difference was seen between the young WT and mutant mice. We also did not find a significant difference in the levels of ubiquitinated mitochondria between young and aged WT mice, indicating that neither aging nor LRRK2 mutation alone, but rather a combination of the two caused such an accumulation of ubiquitinated mitochondria. Similar finding was confirmed by western blot which showed higher level of ubiquitin in mitochondrial lysates of aged LRRK2 mutant mice.
We found significant differences in the mitochondrial morphology and their sizes in the striatum of aged mutant mice compared with age-matched WT mice. There were increased numbers of large, dumbbell-shaped mitochondria with mid-organelle membrane constriction in the mutant mice, which could be due to either a state of incomplete mitochondrial fission, the process being arrested or drastically slowed in the final stages of fission, or an overall increase in total number of mitochondria undergoing fission. Furthermore, the aberrant mitochondrial morphology in the mutant mice was associated with disrupted cristae. A similar observation was reported in an earlier study of aged LRRK2G2019S knockin mice, in which the shape of mitochondria resembled beads-on-the-string, indicative of perturbed fission and fusion [Citation40]. In addition, we found a higher proportion of small-sized (≤0.1 μm2) mitochondria in the mutant brains compared with WT brains. Although typical mitochondria are commonly between 0.75 and 3 μm2 in area [Citation41], the majority of the mitochondria we observed in the synaptic nerve termini of mutant mice were smaller. Some studies have shown that synaptic mitochondria are specialized to their physiological context by their smaller volume and higher ratio of cristae to outer membrane surface [Citation42,Citation43]. Various other factors can modulate mitochondrial shape, e.g. autophagic activation, acute oxidative stress, oxygen tension, etc [Citation44,Citation45]. One possible explanation for our finding is that LRRK2 mutant neurons have adapted to generate smaller mitochondria in response to changes in the energy status of the cell. Conversely, the smaller mitochondria in mutant brain may be due to either excessive mitochondrial fragmentation or ineffective degradation of damaged mitochondria after fission. A study on mitochondrial quality control has shown that dysfunctional mitochondria were selectively inhibited from fusion to the healthy mitochondrial network [Citation46]. This may explain why a higher proportion of ubiquitinated mitochondria were found in our aged mutant mice, and suggests that these mitochondria were not healthy.
Aberrant mitochondrial morphology with disrupted cristae may suggest perturbation of oxidative phosphorylation. ATP levels of mutant and WT mitochondria freshly isolated from aged mouse brains were similar, indicating that at least under basal conditions (i.e. State-4 respiration), the mitochondrial dysfunction in mutant brains were subtle. However, mutant mitochondria produced much less ATP (40% less) than WT mitochondria under maximum respiration stimulated by ADP (state-3 respiration), implying that mutant mitochondria are unable to produce sufficient ATP to support cellular activities under energy crisis. This is supported by our finding that mutant fibroblasts were more susceptible to FCCP-induced ATP depletion than WT cells. Similar phenotypes of impaired mitochondrial function and aberrant morphology have been described in fibroblasts of PD patients with a PRKN/parkin mutation [Citation47] and in mutant mouse fibroblasts with the LRRK2G2019S mutation exhibiting mitochondrial depolarization [Citation48].
Accumulation of ubiquitinated mitochondria with abnormal morphology in aged LRRK2 mutant brains may be due to impaired mitochondrial clearance in mutant cells. Damaged mitochondria are recycled mainly via LC3-mediated lysosomal degradation although other non-autophagic pathways may be involved [Citation49]. Recruitment of SQSTM1 to ubiquitinated mitochondria is one of the key early events to initiate mitophagic degradation [Citation24]. Therefore, we examined a series of mitophagic events in LRRK2 mutant MEFs after they were stressed by FCCP at a time point (i.e. 6 h) before cell death occurred. FCCP is an artificial specific mitochondrial uncoupler widely used to experimentally induce mitochondrial depolarization and initiate mitophagy in cells [Citation25,Citation26]. Here, we first confirmed that FCCP treatment significantly depolarized mitochondria in both WT and mutant MEFs. After mitochondrial depolarization by FCCP, we observed that SQSTM1 recruitment to mitochondria was increased in both mutant and WT cells, indicating initial stages of mitophagy had been triggered. Interestingly, before FCCP treatment, we had already observed significantly higher levels of SQSTM1 recruitment to mitochondria in LRRK2 mutant than in WT cells, suggesting that more mitochondria were labeled for degradation in mutant compared to WT cells even under normal culture condition. This is consistent with our observation of more ubiquitinated mitochondria in the brain of aged (but not young) LRRK2 mutant than WT mice.
The degradation of mitochondria shares the machinery of macroautophagy via the LC3-mediated pathway. LC3 is a central protein in substrate selection and autophagosome formation during macroautophagy and is widely used as a quantitative index of autophagy activation [Citation50]. We found that LRRK2 mutant MEFs had a significantly lower capacity to undergo macroautophagy indicated by a significantly lower level of total LC3 in the mutant compared with WT cells. These mutant MEFs also failed to activate macroautophagy after FCCP exposure, as shown by lower ratios of activated LC3 represented by LC3-II:I and LC3-II:(I+ II) compared with WT cells. These findings showed that LC3-mediated autophagic activation seen in WT cells under FCCP toxicity was significantly reduced in mutant cells. Moreover, total cellular level of SQSTM1 was found to be significantly lower in mutant cells than in WT cells, indicating an inherent impairment in substrate delivery to autophagosome in mutant cells. Our findings are in accordance with previous studies which showed impaired lysosomal degradation of cytosolic debris through defects in trafficking of endosome to lysosome in LRRK2G2019S mutant MEFs which exhibited an increased number of fragmented mitochondria [Citation51]. Such impaired autophagy has also been found in fibroblasts of a PD patient carrying LRRK2G2019S mutation [Citation52].
In order to visualize recruitment of mitochondria to LC3, we developed specific clones of WT and mutant MEFs which were engineered to co-express mitochondrial-specific PAmCherry (mito-PAmCherry) and GFP-conjugated LC3 (GFP-LC3). Mito-PAmCherry was specifically expressed in mitochondria which appeared red after photoactivation. Green puncta formation indicates recruitment of LC3 (i.e., GFP-LC3) to form autophagosomes during macroautophagy. Colocalization of the red-labeled mitochondria with green-labeled LC3 indicated recruitment of mitochondria in autophagosomes via LC3. Under conditions when autophagic degradation was impaired or chemically blocked by CQ, cytosolic green puncta persisted. In WT MEFs, no obvious green LC3-positive puncta were observed after FCCP exposure for 6 h. This suggested that either LC3-positive autophagosomes were not formed or they were rapidly degraded once they were formed, rendering them undetectable. When these FCCP-treated WT MEFs were cultured with CQ, green puncta were observed, indicating accumulation of substrates in autophagosomes as a result of blockage of downstream degradation by CQ. However, when mutant MEFs were stressed by FCCP but without CQ, green puncta accumulation was observed. Puncta analysis showed significant increases in both LC3-positive puncta and LC3-mitochondria co-localization in mutant compared to WT MEFs. These findings suggest that mitochondria which had been recruited to LC3 were not eventually degraded in mutant MEFs, unlike in WT cells. Hence, it is reasonable to speculate that the abnormal accumulation of LC3-positive autophagosomes was indicative of impaired mitophagy in the mutant MEFs.
There are mitophagy assays which use pH-sensitive molecular reporters to demonstrate recruitment of mitochondria into lysosomes based on a shift in the excitation peak of these fluorescent reporters under different pH environment [i.e. from neutral (cytosolic) to acidic (lysosomal)] [Citation53,Citation54]. While these ratiometric fluorescent reporters are useful to monitor mitophagic flux, they are unable to monitor the rate of clearance of a specific sub-population of mitochondria. In order to verify the above findings and quantify the rate of mitochondrial clearance in live cells, we developed a new flow cytometry assay to monitor cellular mitochondria clearance based on a mitochondrial-specific photoactivatable fluorescence-based cell model. We generated stable MEF cultures from WT and LRRK2 mutant mouse embryos. These MEFs were engineered to stably express a photoactivatable mCherry protein specifically in mitochondria. The photoactivatable mito-PAmCherry protein does not emit fluorescence until photoactivated by UV-A. Thus, the decline in fluorescence levels after photoactivation can be monitored and quantified using flow cytometry. Since mito-PAmCherry was only expressed in mitochondria, the decline in fluorescence reflected how much mitochondria were degraded at different time points. Any newly synthesized mitochondria after photoactivation did not fluoresce because they only carried non-photoactivated mito-PAmCherry. In order to show the specificity of this assay, control experiments were performed to demonstrate that the decline of mito-PAmCherry signal over time correlated with the overall cellular mitochondria clearance and to exclude other factors which could possibly confound the results. Firstly, we confirmed that initial mito-PAmCherry fluorescence intensities of WT and mutant MEFs immediately after photoactivation were similar and that different rates of mitochondrial clearance between WT and mutant MEFs were not due to any difference in their initial fluorescence intensities. We confirmed that there were no differences in the fluorescence intensity in fixed cells after 4 days of storage compared to their corresponding initial levels at t = 0, indicating that the signal intensity decline was not due to spontaneous decay of mito-PAmCherry. We found no differences in cell proliferation rate between WT and mutant MEFs which may differentially “dilute” the observed fluorescence intensity per cell during the time course of the assay. Hence, we were able to determine the basal turnover of mitochondria and the rate of clearance after mitochondrial stress by FCCP toxicity using this assay. We found that LRRK2 mutant MEFs had a lower basal rate of mitochondrial degradation than WT controls under normal culture condition.
In an earlier part of this study we showed that FCCP treatment initiated a series of early mitophagic events including depolarization of mitochondria, SQSTM1 recruitment to mitochondria, and LC3-positive autophagosome formation. One might expect that cells treated with FCCP might degrade defective mitochondria much faster than in cells without FCCP. However, when MEFs were stressed with FCCP for 6 h before cell death occurred, the observed rate of mitochondrial clearance slowed down in both WT and mutant cells compared to their corresponding group cultured under unstressed conditions. This finding can be explained by the fact that although FCCP initiates mitophagy, it does not necessarily accelerate the entire chain of autophagic processes leading to eventual mitochondrial clearance, which are dependent on other factors such as ATP supply essential for ATP-dependent autophagic processes [Citation55,Citation56]. Our finding that the same FCCP treatment resulted in a significantly lower cellular ATP level in mutant compared with WT MEFs provides some hints to explain for the overall lower rate mitochondrial clearance in mutant cells despite having initiated mitophagy. Under a milder FCCP (2 μM) toxicity level, mutant MEFs had much lower rates of mitochondrial clearance than WT cells indicating that mutant cells are less capable of scavenging defective mitochondria after stress. At a higher dose of FCCP (10 μM), the difference between WT and mutant MEFs was rendered insignificant because of the overwhelming effect of increased FCCP toxicity on the mitophagy processes. Hence, we infer from these results that neurons carrying the LRRK2 mutation are more susceptible to stress due to impaired mitophagy, which explains the accumulation of aberrant mitochondria in aged LRRK2 mouse brains.
To explore the causes of impaired mitophagy in LRRK2 mutant cells, we examined potential upstream mechanisms which are known to process defective mitochondria for degradation. Under normal physiological conditions, defective mitochondria undergo fission followed by ubiquitination and are eliminated by lysosomal degradation [Citation34]. Segregation of defective mitochondria involves phosphorylation of DNM1L on the outer mitochondrial membrane where it mediates fission [Citation9]. These segregated mitochondria are selectively ubiquitinated via PINK1-mediated recruitment of PRKN/PARKIN on the mitochondrial surface, which are subsequently sequestered via SQSTM1 recruitment to lysosome for LC3-mediated autophagic degradation [Citation57]. DNM1L mediates mitochondrial fragmentation [Citation58] and was shown to be a component of the LRRK2 interactome [Citation59,Citation60]. A significant portion (~10%) of total cellular LRRK2 protein is localized on mitochondrial outer membrane [Citation61,Citation62] where it interacts with proteins involved in mitochondria fission [Citation63,Citation64]. LRRK2 was found to co-localize with DNM1L in cortical neurons suggesting that LRRK2 may be involved in DNM1L-induced mitochondrial fission [Citation65]. Overexpression of LRRK2 stimulates mitochondrial recruitment of DNM1L by direct interaction and induces fission [Citation59]. In this study, the increased numbers of dumb-bell shaped mitochondria in our aged mutant LRRK2 mouse brains suggested a state of perturbed fission. We first explored the role of DNM1L by observing the effects of DNM1L knockdown on the morphology of the mitochondrial networks on WT and mutant MEFs and on the rate of mitochondrial clearance. Mitochondria in WT MEFs under normal conditions exhibited an interconnected tubular network structure, whereas those in LRRK2 mutant cells appeared swollen and segmented suggesting dysregulated fission-fusion processes. Our findings were consistent with previous studies which showed fragmented mitochondria and impaired mitophagy in LRRK2 PD patient-derived fibroblast lines [Citation66]. An interconnected mitochondrial network structure is essential to protect mitochondria from autophagosomal degradation during starvation via regulating DNM1L phosphorylation [Citation45]. Here, we found that after knockdown of DNM1L expression, the interconnected tubular mitochondrial network structure in WT cells became swollen and circular in shape but remained partly connected, not too dissimilar from the appearance of mitochondria in mutant cells before DNM1L knockdown. This observation may suggest a pathological imbalance of mitochondrial fission-fusion machinery in LRRK2 mutant cells even before DNM1L knockdown. This may also explain why more abnormal mitochondria were found in aged LRRK2 mutant mouse brains, including those with abnormal morphology, higher level of ubiquitination and impaired ATP synthesis. Furthermore, when DNM1L-knockdown WT cells were stressed with FCCP, incomplete mitochondrial fragmentation (swollen tubes) was observed, indicating that DNM1L plays a crucial role to mediate fission in response to mitochondrial damage. A greater adverse impact in DNM1L-knockdown mutant cells after FCCP treatment was observed with substantial accumulation of large rounded aggregates of mitochondria. This is consistent with a previous study which showed that DNM1L-deficient mitochondria were morphologically bigger and functionally abnormal [Citation67]. Our current findings indicate the critical role that DNM1L plays in maintaining normal mitochondrial network structure which is disrupted by LRRK2R1441G mutation.
Knockdown of DNM1L expression not only affected mitochondrial morphology but also retarded mitochondrial clearance in both WT and mutant MEFs. However, the effect of DNM1L depletion in terms of the reduction in rate of mitochondrial clearance was much less apparent in mutant than in WT cells (i.e. 55%↓ in WT but 33%↓ in mutant). Such difference on the effects of DNM1L depletion indicates that DNM1L signaling had much less effect on the overall mitochondrial clearance in mutant than WT cells. After DNM1L knockdown, the rate of mitochondrial clearance slowed in both WT and mutant cells to similar rates. Additional stress by FCCP after DNM1L knockdown did not further retard the rate of mitochondrial clearance in both cell types. This suggests that DNM1L is a rate-limiting factor to mediate mitochondrial clearance, and the difference observed between the WT and mutant cells before DNM1L knockdown was mostly mediated by DNM1L. Although mitochondria fission typically occurs in coordination with sequestration of mitophagosomes, there are other pathways of mitophagy which do not require fission, namely Type 2 mitophagy [Citation68]. In this specific sub-type of mitophagy, LC3 membranes are found to directly fuse with the mitochondrial outer membrane before incorporated into autophagosomes for degradation [Citation69,Citation70]. Our observed effect of DNM1L knockdown in WT and mutant MEFs represents an overall effect on mitochondrial clearance associated with DNM1L, and our findings cannot exclude any potential compensation from various types of DNM1L-independent mitophagy. Nevertheless, these DNM1L-independent pathways appear to be unaffected in LRRK2 mutant cells because knockdown of DNM1L completely negated the difference in the rate of mitochondrial clearance between WT and mutant cells.
Since DNM1L appeared to be a rate-limiting factor of mitochondrial clearance in LRRK2 mutant cells, we examined for changes in DNM1L expression and activation in these cells under mitochondrial stress. We found that WT and mutant cells contained similar levels of total DNM1L throughout the course of FCCP treatment. We also examined DNM1L phosphorylation specifically at serine-616 which is known to promote mitochondrial fission [Citation63]. In addition, we assessed levels of ERK1/2 phosphorylation, which was shown to promote DNM1L-dependent mitochondrial fission [Citation71]. In normal cells, the MAPK/ERK signal cascade is activated in response to cellular stress to regulate basic cellular processes including cell survival, differentiation and stress responses [Citation72]. In WT MEFs, FCCP exposure induced DNM1L (Ser616) phosphorylation. However, such phosphorylation was not seen in LRRK2 mutant cells after the same treatment. Similarly, increased phosphorylation of MAPK1/ERK2-MAPK3/ERK1 was clearly seen following FCCP exposure in WT but not in mutant cells, demonstrating impaired DNM1L-MAPK/ERK signaling in the latter. Interestingly, such lack of DNM1L-MAPK/ERK phosphorylation in LRRK2R1441G MEFs appear to be different to another study which reported that LRRK2G2019S mutation enhanced autophagy and increased apoptosis in human fibroblasts through the MAP2K/MEK-MAPK/ERK pathway [Citation73]. The reasons for such a disparity are unclear even though both mutations result in hyperactive LRRK2 kinase activity and aberrant mitochondrial morphology. This led us to speculate that LRRK2R1441G mutation can inhibit DNM1L phosphorylation. LRRK2R1441G mutation not only increases kinase activity but its intrinsic GTPase activity was found to be reduced [Citation74]. The mechanisms linking LRRK2 to DNM1L-MAPK/ERK and mitophagy are unknown and are far more complex than it appears. Nevertheless, treatment using specific LRRK2 kinase inhibitor, GNE-7915, did not alleviate impaired mitochondrial clearance in LRRK2 mutant MEFs, indicating that such impairment is not directly related to increased kinase activity alone in mutant LRRK2. An earlier study has shown that R1441G mutation may affect 14-3-3 binding and RAF (proto-oncogene, serine/threonine kinase) phosphorylation in the MAPK/ERK pathway [Citation75]. Because DNM1L can be phosphorylated by MAPK/ERK [Citation76], failure in MAPK/ERK phosphorylation in mutant cells may perturb downstream DNM1L phosphorylation, thus affect mitochondrial fragmentation. Another possibility for impaired DNM1L-MAPK/ERK phosphorylation in our mutant MEFs is that this process requires adequate supply of ATP. We have shown that our mutant LRRK2 cells produces less ATP than WT cells, thus leading to impaired phosphorylation. To further confound the link, DNM1L is known to be phosphorylated at multiple sites by different upstream kinases, and its activity is regulated by phosphorylation or dephosphorylation of specific residues leading to different physiological consequences [Citation77]. For example, phosphorylation of DNM1L at Ser616 by CDK1/cyclin B or CDK5 increases mitochondrial fission, whereas phosphorylation at Ser637 by calcineurin reduces mitochondrial fission [Citation77]. Aberrant mitochondrial morphology can be due to increased fission, reduced fusion or impaired mitophagy. Defective mitophagy in our LRRK2 mutant mice is unlikely to be directly related to LRRK2 kinase activity alone. The kinase domain in LRRK2 is only one, albeit important, domain in this large, multi-domain protein which interacts with many other proteins. Many questions remain on a multitude of factors that can affect this link between LRRK2 and DNM1L-MAPK/ERK signaling to control the mitophagic process, including what other signaling pathways lie downstream of LRRK2, how other domains in LRRK2 interact with each other to control these downstream pathways, the interactions between LRRK2 and other intermediary pathways to phosphorylate DNM1L-MAPK/ERK, and how LRRK2 mutation affect priming/labeling of defective mitochondria.
There is increasing evidence to demonstrate possible involvement of DNM1L in causing abnormal mitochondrial dynamics in various neurodegenerative diseases, including PD [Citation78]. Pharmacological inhibition of DNM1L had been proposed to be one of the viable strategies to prevent excessive mitochondrial fission and apoptotic cell death in various neurotoxicity models [Citation79]. Conversely, DNM1L-mediated fission of mitochondria has also been shown to protect against calcium-mediated apoptosis [Citation80]. Although we have identified impairment in DNM1L phosphorylation as a possible cause of reduced mitochondrial clearance in LRRK2 mutant mice, any pharmacological manipulation of DNM1L activity as a therapeutic strategy in PD should be viewed with caution because excessive mitochondrial fission has also been observed in human PD brains [Citation81]. It is more plausible that correcting the pathological imbalance of mitochondrial fission and fusion from impaired DNM1L signaling may be a sounder approach to restore mitochondrial homeostasis. This is especially important in post-mitotic cells like neurons which cannot dilute the damaged mitochondria but can only rely on fission and fusion to maintain a healthy mitochondrial pool. Slowly accumulating deleterious effects from mitochondrial mutations, with damage and aberrant protein catabolism are likely to be even more evident in humans than in any short-lived animal or cellular model.
In conclusion, we have shown hitherto unreported, age-dependent accumulation of ubiquitinated mitochondria in aged brains of LRRK2R1441G mutant mice. In a cellular model, we have demonstrated the reduced rate of mitochondrial clearance in LRRK2R1441G mutant cells which is associated with defects in DNM1L-dependent pathways. This impaired mitophagy contributes to an accumulation of defective mitochondria with abnormal morphology, causing mitochondrial dysfunction and a deficiency in cellular energy supply. Our results also showed that phosphorylation of DNM1L-MAPK/ERK was impaired in LRRK2 mutant cells under mitochondrial stress. Mitophagy has been shown to be crucial for cellular homeostasis and its impairment is linked to LRRK2-associated PD [Citation82] and other neurodegenerative diseases [Citation83,Citation84]. The progressive decline in neuronal energy supply during natural aging and the predisposing effects of LRRK2R1441G mutation on quality control of mitochondria may lower the threshold against intrinsic and extrinsic cellular stresses to accelerate neuronal cell death.
Materials and Methods
Animals
Our LRRK2R1441G knockin mutant mice carrying homozygous mutation (c. 4321 C > G) of LRRK2 have been described previously [Citation19–21]. Our LRRK2 mutant mice were back-crossed with wild-type C57BL/6 N mice for over eight generations, and maintained under such genetic background thereafter. All mice were maintained with unrestricted access to food and water on a 12 h light-dark cycle, with lights on at 7 AM in the Laboratory Animal Unit, University of Hong Kong, which is accredited by the Association for Assessment and Accreditation of Laboratory Animal Care International (AAALAC). All experimental protocols were approved by the Committee on the Use of Live Animals in Teaching and Research (CULATR) of the University of Hong Kong (CULATR#4506-17). Genotype of animals was determined by DNA sequencing [Citation19].
Mouse embryonic fibroblasts (MEFs) cell culture and treatments
Homozygous LRRK2R1441G knockin mutant mice carrying mutation (cDNA 4321 C > G) of LRRK2 and their wild-type littermates were used for preparation of mouse embryonic fibroblasts (MEFs). Individual mouse embryos at day E12.5 were isolated from crosses between two heterozygous LRRK2WT/R1441G mice [Citation21]. All embryos were collected. Individual clone of MEFs was obtained from each embryo. All clones of MEFs were genotyped at passage 1 when developed into proliferating culture. All MEFs were cultured in Dulbecco’s Modified Eagle Medium (DMEM; ThermoFisher™ Scientific, 10,569–010) containing 15% Fetal Bovine Serum (FBS; GE Healthcare HyClone™, SH30071.03), 100 units/ml penicillin, 100 μg/mL streptomycin (ThermoFisher™ Scientific, 15,140–122), non-essential amino acids (ThermoFisher™ Scientific, 11,140–050). The genotype of individual MEF clones was confirmed by genotyping [Citation19].
Isolation of mitochondria
Mitochondria were isolated by using a differential centrifugation method that retains mitochondrial function and integrity [Citation85]. Briefly, freshly dissected brain tissues were chopped into small pieces, and homogenized in fresh ice-cooled oxygenated mitochondrial suspension buffer (100 mM potassium phosphate buffer, 0.25 M sucrose [Affymetrix, 21,938], 1 mM EDTA, 1 × protease inhibitor cocktail [Roche, 11,873,580,001], pH 7.4) using glass-Teflon Potter Elvehjem homogenizer (Wheaton USA, Micro Tissue Grinder kit, 358,204) to disrupt the cell membrane by the mechanical force of 15 strokes. The tissue homogenates were centrifuged at 650 × g for 10 min at 4°C to remove insoluble cell debris. Mitochondria-containing supernatant was collected and centrifuged at 7,000 × g for 15 min at 4°C to collect the mitochondrial pellet. The purified mitochondria were obtained by an additional wash in isolation buffer and centrifugation at 4°C. The mitochondrial pellet was resuspended in ice-cooled 10 mM Tris-Cl, pH 7.6 and used within two hours after isolation. A total of ~65 µg of freshly isolated mitochondria were obtained from each 6 and 24 month-old WT and LRRK2 mutant mouse whole striatum, and were resuspended in 125 µl ice-cooled mitochondrial suspension buffer. Protein concentration was determined by the Bradford assay, and mitochondrial lysates for western blot were stored at −80°C. Western blotting on mitochondrial lysates was performed to demonstrate the purity of the isolates.
Measurements of ubiquitinated mitochondria levels in mouse striatum in flow cytometry
Equal amount (65 µg) of freshly isolated mitochondria from 6- and 24-month-old WT and homozygous LRRK2 mutant mouse whole striatum were resuspended in 125 µl mitochondrial suspension buffer, and immuno-stained with rabbit anti-ubiquitin antibody (1:125; Cell Signaling Technology™, 3933 at room temperature for 1.5 h, followed by incubation with F(ab’)2 goat anti-rabbit IgG (H + L) cross-adsorbed Alexa-Fluor® 488 secondary antibody (1:300; ThermoFisher Scientific™, A-11,017) and 50 nM MitoTracker™ Red CMXRos (ThermoFisher Scientific™, M7512) at room temperature for 0.5 h. Both the antibodies were diluted in PBS (137 mM NaCl, 2.7 mM KCl, 8 mM Na2HPO4, 2 mM KH2PO4, pH 7.4 (ThermoFisher Scientific™, AM9624). containing 5% normal serum (ThermoFisher Scientific™, 16,210,072) and 5% BSA (Sigma Aldrich™, A9647). The amount of total (i.e. MitoTracker Red-positive) and ubiquitinated mitochondria (i.e. MitoTracker Red-positive/FITC-positive) in each sample were counted by LSR Fortessa cell analyzer [Becton Dickinson (BD) Biosciences].
Transmission electron microscopy (TEM) of brain mitochondria
Mice were deeply anesthetized before being cardiac perfused with cold PBS followed by 4% paraformaldehyde with 0.2% glutaraldehyde fixation at 4°C overnight. For TEM, fixed brain tissues were cut into blocks of ~1 mm3 thickness and fixed in 2.5% glutaraldehyde in cacodylate buffer (0.1 M sodium cacodylate-HCl buffer pH 7.4; Electron Microscopy Sciences, 11,653) for 4 h at 8°C, then transferred to cacodylate buffer with 0.1 M sucrose to stop fixation. The tissue blocks were washed in cacodylate buffer before osmication using 1% osmium tetroxide (Fisher Scientific, 50–332-14) in cacodylate buffer for 1 h at room temperature. Blocks were washed in cacodylate buffer, then dehydrated on a rotary shaker in the following sequence: 50% ethanol – 5 min, 70% ethanol – 5 min, 90% ethanol – 5 min, 100% ethanol – 10 min each for 3 times, propylene oxide – 5 min each for 2 times. Blocks were infiltrated with epoxy resin (Electron Microscopy Sciences, RT14040)/propylene oxide 1:1 mixture for 1.5 h at 37°C. The tissue blocks were embedded in epoxy resin in form of labeled plastic capsules (Electron Microscopy Sciences, 70,000-B) or flat embedding molds. The mounts were allowed to polymerize at 60°C overnight before sectioning.
Counting of mitochondria and determination of their shape in TEM images
Analyses of mitochondria number and size in aged WT and LRRK2 mutant mouse brains were performed using Photoshop™ (Adobe™, San Jose, CA, USA) based on two-dimensional TEM photomicrographs (Philips CM100 Transmission Electron Microscope; 1:2200 magnification) taken from cross-section of dorsal striatum of the mouse brains. Briefly, mitochondria within a defined area of the field were identified and numbered by two independent experienced researchers blinded from the details of each sample group. Cross-section area of each mitochondrion was measured by Photoshop™. For measurement of mitochondria size, five random micrographs were taken from dorsal striatum of each of the 3 pairs of WT (i.e. 15 micrographs) and mutant (i.e. 15 micrographs) mice. For quantification of “dumb-bell” shaped mitochondria, twenty random micrographs were taken from each of the 3 pairs of WT (i.e. 60 micrographs) and mutant (i.e. 60 micrographs) mice. Total number of mitochondria per unit area and percentage of dumb-bell shaped to total mitochondria between WT and mutant mice were compared. Statistical differences were based on an average of 3 animals from WT and mutant mice (N = 3).
Oxygen consumption and ATP concentration in isolated mitochondria
Isolated mitochondria (100 μg) from WT or LRRK2 mutant mice were injected into a water-jacketed microcell with Clark-type oxygen electrode (model MT200; 782 2-Channel Oxygen System; Strathkelvin Instruments Ltd. Scotland) using a Hamilton syringe at a final concentration of 1 mg/ml in medium (100 μl) consisting of 125 mM KCl, 1 mM EGTA, 1 mM KH2PO4, 10 mM Tris–MOPS, pH 7.4, magnetically stirred at 37°C for 2 min [Citation85]. State-3 respiration, defined as the maximum rate of oxygen consumption in the presence of substrates and ADP, was determined from the resultant oxygraph after injection of complex I substrates (i.e., 5 mM glutamate and malate) and 0.3 mM ADP. Oxygen consumption in the microcell was measured using a Clark-type oxygen electrode as nmol O2 consumed/min/mg mitochondrial protein. After addition of substrates for 2 min, ATP extraction buffer was added into the mitochondrial homogenate to stop ATP synthesis. The resultant mitochondrial homogenates were collected from the microcell and centrifuged at 12,500 × g for 15 min to collect mitochondrial pellet. The basal ATP concentration of isolated mitochondria was measured by ATPlite Luminescence Assay System (Perkin Elmer™, 6,016,941). The resultant luminescent intensity was determined by CLARIOstar microplate reader (BMG LABTECH). ATP concentration was determined using a calibration curve of serial standard ATP dilutions. Artificial uncoupler, CCCP, was used to depolarize isolated mitochondria in the oxygen chamber after measurements to verify the functional specificity of intact mitochondria.
Cloning of lentiviral constructs to express mitochondrial-specific photoactive PAmCherry
In order to compare the rate of mitochondria degradation in WT and LRRK2R1441G mutant cells, a photoactivatable mitochondrial-specific PAmCherry (mito-PAmCherry) protein was stably expressed in both WT and mutant MEFs using lentivirus. PAmCherry does not fluoresce until photoactivated by a short exposure to light at a wavelength at 405 nm. The excitation/emission wavelengths of photoactivated PAmCherry are 564 nm and 595 nm. A nucleotide fragment encoding mito-PAmCherry was amplified from pPAmCherry-Mito plasmid (Clonetech™, 632,591) as template. This commercially available plasmid is a mammalian expression vector encoding the photoactivatable fluorescent protein, PAmCherry, fused to the mitochondrial targeting sequence from human COX8A (cytochrome c oxidase subunit 8A). Briefly, mito-PAmCherry DNA insert was amplified by PCR to generate a cDNA fragment conjugated with a protein tag “NE” which contained an EcoRI site at the 5ʹ and NheI-PmeI site at the 3ʹ-end. This mito-PAmCherry-NE cDNA was ligated into a lentiviral backbone plasmid pSIN4-EF2-IRES-Pur derived from a gift from James Thomson (Addgene, 16,580) to construct pSIN4-PAmCherry-Mito plasmid. “NE” is a novel 18-amino-acid epitope tag we developed to facilitate specific protein detection by a monoclonal NE antibody (http://www.versitech.hku.hk/reagents/ne/). Forward primer: 5ʹ- GGAATTCGCCACCATGTCCGTCCTGAC −3ʹ and Reverse primer: 5ʹ-CTAGCTAGCTTAGCTTTCGTTATCATCATAGCTTTCTTCCTGGTTGCTACGCGGGTTTTCTTTGGTCTTGTACAGCTCGTCC −3ʹ.
To generate a lentivirus expressing mito-PAmCherry, pSIN-PAmCherry-Mito-NE plasmid was co-transfected with helper plasmids in 293 T cells using Lipofectamine3000™ (ThermoFisher™ Scientific, L3000008). Three days after transfection, virus-containing medium was collected and filtered before it was used to infect WT and LRRK2R1441G mutant MEFs. After viral transduction, MEFs were cultured in medium containing puromycin (2 μg/ml) to obtain stable clones which expressed mito-PAmCherry protein. These resistant clones were then photoactivated and subjected to FACS-sorting to collect cells which were expressing mito-PAmCherry protein. Successfully transduced cells showed red fluorescent (i.e. mCherry) mitochondria after photoactivation under fluorescent microscopy.
A novel cell-based assay to measure the rate of mitochondrial clearance
To assess cellular mitochondrial clearance, WT and LRRK2 mutant MEFs were transduced by lentivirus to express mito-PAmCherry protein which was specifically expressed in mitochondria. Transduced MEFs were incubated with fresh medium for 2 h and photoactivated for 10 min under 405 nm (UV-A). Levels of red fluorescence (photoactivated PAmCherry) expressed in mitochondria were examined under microscope after the photoactivation. To determine the effects of damage to the mitochondrion, MEFs were treated with FCCP (2, 10 M; Sigma Aldrich™, C2920) to induce mitochondrial damage (or depolarization). The initial and the subsequent decline in the levels of red fluorescence from mito-PAmCherry in each treatment group at different time points (6, 24 h) after FCCP exposure were measured by LSR Fortessa cell analyzer (PE-Texas Red channel; BD Biosciences). The rate of mitochondrial degradation in both WT and mutant MEFs were determined as the timely decline of total fluorescent signal as compared with their corresponding initial levels of mito-PAmCherry (t = 0). Parallel cultures of MEFs with same treatment were fixed with 4% PFA for imaging under fluorescent microscope.
Generation of MEFs co-expressing mitochondrial-specific photoactivatable PAmCherry and GFP-LC3
To visualize autophagosome formation during autophagy activation, WT and LRRK2R1441G mutant MEFs stably expressing mito-PAmCherry (described above) were transfected with pSELECT-GFP-mLC3 (InvivoGen™, psetz-gfpmlc3) plasmid using Lipofectamine3000™ (ThermoFisher™ Scientific, L3000008). Two days after transfection, cells were selected in culture with Zeocin™ (400 μg/ml; ThermoFisher™ Scientific, R25001) and puromycin (2g/ml; ThermoFisher™ Scientific, A1113803) to ensure stable co-expression of both mito-PAmCherry and GFP-LC3 protein. Total mitochondria in the cells were visualized by red fluorescence emitted from photoactivated mito-PAmCherry. During autophagosome formation, cytosolic GFP-LC3 was recruited to the phagophore membrane, which appeared as green cytoplasmic puncta under fluorescence microscopy.
Knockdown of DNM1L expression in MEFs
To determine the role of DNM1L expression level on mitochondria degradation, WT and mutant MEFs stably expressing mitochondrial-specific mito-PAmCherry were transfected with either siRNA(s) against Dnm1l (Santa Cruz Biotechnology™, sc-45,953) or scrambled negative control siRNA by Lipofectamine® RNAiMAX (ThermoFisher™ Scientific, 13,778,030) for 72 h. Knockdown expression of DNM1L was confirmed by western blot after 72 h transfection. Transfected MEFs were then photoactivated for 10 min. and subsequently treated with FCCP (2 µM) for an additional 24 h to study their corresponding changes in mitochondrial morphology. In addition, their corresponding rates of mitochondrial clearance (as indicated by decline of photoactivated mito-PAmCherry) were assayed by flow cytometry according to the protocol described above.
Cytotoxicity measurement and ATP assay
To determine the treatment duration of FCCP in MEFs, cells were seeded in 24-well plates and treated with 10 μM FCCP for 0.5, 2, 6, 24 h. The cytotoxic level of FCCP was determined using a ToxiLight™ Nondestructive Cytotoxicity BioAssay Kit (Lonza, LT07-217). Total intracellular ATP level was measured by ATPlite Luminescence Assay System (PerkinElmer, 6,016,941) according to manufacturer’s protocol. The luminescence intensity was measured using a CLARIOstar microplate reader (BMG LABTECH). ATP concentrations were determined using a calibration curve of serial standard ATP dilutions in nmol ATP per mg total mitochondrial protein.
Mitochondrial membrane potential (MMP) by TMRM staining in flow cytometry
FCCP induces mitochondrial depolarization to initiate mitophagy [Citation25,Citation26]. To confirm that FCCP depolarized mitochondria in MEF cultures, relative mitochondrial membrane potential (MMP) in WT and LRRK2 mutant MEFs after FCCP (10 µM) treatment at 0, 15 and 30 min were compared after staining of an MMP-sensitive fluorescent dye, TMRM (ThermoFisher™ Scientific, T668). Briefly, MEFs seeded in six-well plates were stained in culture medium containing 100 nM TMRM at 37°C in the dark for 20 min. After staining, the medium was replaced by fresh medium. The red fluorescence of the TMRM-stained cells was measured by flow cytometry with the RFP/TRITC filter set (excitation: 548 nm; emission: 573 nm). Relative MMP was expressed as the average TMRM fluorescence intensity per cell.
Flow cytometry measurements of mitochondrial SQSTM1/p62 recruitment in MEFs
Mitochondrial SQSTM1 recruitment is a key early event to initiate mitophagy [Citation27]. To compare the levels of mitochondrial SQSTM1 recruitment in WT and mutant MEFs, total mitochondria from cells after 10 µM FCCP treatment for 0, 2, and 4 h were isolated using a commercially available mitochondrial isolation kit for cultured cells (ThermoFisher™ Scientific, 89,874) and resuspended in mitochondrial suspension buffer (100 mM potassium phosphate buffer, 0.25 M sucrose, 1 mM EDTA, 1 × protease inhibitor cocktail, pH 7.4). Equal amount of freshly isolated mitochondria was immuno-stained with rabbit monoclonal antibody against SQSTM1 (Cell signaling technology™, 23214S) for 1.5 h, followed by incubation with F(ab’)2 goat anti-rabbit IgG (H + L) cross-adsorbed Alexa-Fluor® 488 secondary antibody (1:300, ThermoFisher™ Scientific, A-11,017) and 50 nM MitoTracker™ Red CMXRos (ThermoFisher™ Scientific, M7512) at room temperature for 0.5 h. Both the antibodies were diluted in PBS containing 5% normal serum and 5% BSA for staining. The amount of total (i.e., MitoTracker Red-positive) and SQSTM1-conjugated mitochondria (i.e. MitoTracker Red-positive/FITC-positive) in each sample were counted by LSR Fortessa cell analyzer [Becton Dickinson (BD) Biosciences].
Estimation of cell proliferation
Cell proliferation of WT and LRRK2 mutant MEFs was assessed by direct cell counting. Cells were seeded in six-well plates, trypsinized at different time points and stained by 0.1% Trypan blue in PBS, pH 7.4. The number of viable cells (i.e. blue staining) was counted using a hemocytometer under light microscope. The total number of cells in each well was calculated.
Confocal imaging and colocalization analysis
Fluorescent confocal images were obtained using a Carl Zeiss LSM880 (Germany) laser scanning confocal microscope with a Plan Apochromat 63 × 1.4NA oil immersion objective. Images were collected as Z stacks with a Z step size at 0.31 μm and three Z-stacks images were projected at maximum intensity with ZEN software (Carl Zeiss, Germany). Quantification of GFP-LC3 signals in confocal images of MEFs, and in which co-localized with mito-PAmCherry were performed by co-localization function of Zen 3.1 software (blue edition) (Carl Zeiss Microscopy GmbH). The overall threshold of GFP-LC3 and mito-PAmCherry level in full size (2048 × 2048 pixels; 18,211 µm2) confocal micrographs were determined. Subsequently, individual cells were randomly selected for co-localization analysis. A total of at least 100 cells from WT and mutant MEF cultures treated with FCCP were selected for analysis. Total pixel number of LC3-positive puncta and LC3-mitochondria colocalization per individual cells from WT and mutant MEFs were determined by Zen 3.1 software. The difference in average pixel counts between WT and mutant MEFs were analyzed using unpaired Student’s t-test.
Immunoblotting
Tissue or cell pellets were homogenized by sonication in cold lysis buffer with Halt™ Protease and Phosphatase Inhibitor (ThermoFisher™ Scientific, 1,861,281). Protein lysates were incubated on ice for 20 min and clarified by centrifugation at 4°C for 15 min at 12,500 × g. Protein concentration was determined by the Bradford assay (ThermoFisher™ Scientific, 23,200). Homogenate was stored at −80°C. Equal amounts of protein were diluted in sample buffer (62.5 mM Tris, pH 6.8, 100 mM DTT, 2% SDS, 10% glycerol, 0.002% bromophenol blue) and electrophoresed in 10%, 12% or 15% SDS-polyacrylamide gels at 100 volts for 1.5 to 2 h and electro-transferred to PVDF membranes. Membranes were blocked with 5% nonfat skimmed milk (Bio-Rad, 170–6404) and probed with primary antibody, followed by HRP-conjugated secondary antibodies (DAKO, P0448 and P0260). Finally, membranes were probed with ECL solution for substrate detection. Intensity of the various protein bands was quantified using ImageJ software (http://rsbweb.nih.gov/ij/plugins/track/track.html). COX4 (1:2000, Abcam™, ab16056), ubiquitin (1:2000; Cell Signaling Technology™, 3933), VDAC (1:2000; Cell Signaling Technology™; 4866), SQSTM1 (1:1000; Cell Signaling Technology™, 8052), LC3 (1:1000; Cell Signaling Technology™, 2775), MAPK1/ERK2-MAPK3/ERK1 (1:1000; Cell Signaling Technology™, 4695), phospho-MAPK1/ERK2-MAPK3/ERK1 (1:1000; Cell Signaling Technology™, 4376), DNM1L (1:1000; Cell Signaling Technology™, 8570), phospho-DNM1L (S616; 1:1000; Cell Signaling Technology™, 3455) and ACTB (1:5000; Cell Signaling Technology™, 5125S) were the primary antibodies used.
Statistical analysis
All experiments were performed based on at least four independent trials. All results are expressed as mean ± standard error of the mean (S.E.M.). Conclusions were drawn based on statistical analyses using GraphPad™ PRISM software. Either Student’s unpaired t-test of one-way ANOVA followed by post-hoc analyses were used to compare two independent groups; interactions among time, dosage, and genotype were assessed by either two-way or three-way ANOVA. Group comparisons were considered significant when p-value was less than 0.05 (p < 0.05).
Supplemental Material
Download Zip (8.8 MB)Acknowledgments
The authors acknowledge the funding support by the Tai Hung Fai Charitable Foundation - Edwin S H Leong Research Programme for Parkinson's Disease, and Henry G. Leong Endowed Professorship in Neurology (SLH). Research consumables and research assistant were partly supported by Health and Medical Research Fund (HMRF) (Project no. 06172726), Food and Health Bureau, Hong Kong S.A.R. DBR acknowledges the financial support of the JABBS charity. The authors also acknowledge the technical assistance from the University Faculty Core Facilities on confocal microscopy and flow cytometry, and administrative supports from Department of Medicine, HKU.
Disclosure statement
No potential conflict of interest was reported by the authors.
Supplementary material
Supplemental data for this article can be accessed here.
Additional information
Funding
Related Research Data
References
- Schapira AH. Mitochondria in the aetiology and pathogenesis of Parkinson’s disease. Lancet Neurol. 2008;7(1):97–109.
- Abou-Sleiman PM, Muqit MM, Wood NW. Expanding insights of mitochondrial dysfunction in Parkinson’s disease. Nat Rev Neurosci. 2006;7(3):207–219.
- Bolam JP, Pissadaki EK. Living on the edge with too many mouths to feed: why dopamine neurons die. Mov Disord. 2012;27(12):1478–1483.
- Sprenger HG, The LT. Good and the bad of mitochondrial breakups. Trends Cell Biol. 2019;29(11):888–900.
- Harper JW, Ordureau A, Heo JM. Building and decoding ubiquitin chains for mitophagy. Nat Rev Mol Cell Biol. 2018;19(2):93–108.
- Ryan BJ, Hoek S, Fon EA, et al. Mitochondrial dysfunction and mitophagy in Parkinson’s: from familial to sporadic disease. Trends Biochem Sci. 2015;40(4):200–210.
- Youle RJ, van der Bliek AM. Mitochondrial fission, fusion, and stress. Science. 2012;337(6098):1062–1065.
- Twig G, Hyde B, Shirihai OS. Mitochondrial fusion, fission and autophagy as a quality control axis: the bioenergetic view. Biochim Biophys Acta. 2008;1777(9):1092–1097.
- Breitzig MT, Alleyn MD, Lockey RF, et al. A mitochondrial delicacy: dynamin-related protein 1 and mitochondrial dynamics. Am J Physiol Cell Physiol. 2018;315(1):C80–C90.
- Lou G, Palikaras K, Lautrup S, et al. Mitophagy and neuroprotection. Trends Mol Med. 2020;26(1):8–20.
- Nalls MA, Pankratz N, Lill CM, et al. Large-scale meta-analysis of genome-wide association data identifies six new risk loci for Parkinson’s disease. Nat Genet. 2014;46(9):989–993.
- Dächsel JC, Farrer MJ. LRRK2 and Parkinson disease. Arch Neurol. 2010;67(5):542–547.
- Mata IF, Wedemeyer WJ, Farrer MJ, et al. LRRK2 in Parkinson’s disease: protein domains and functional insights. Trends Neurosci. 2006;29(5):286–293.
- Taylor JP, Mata IF, Farrer MJ. LRRK2: a common pathway for parkinsonism, pathogenesis and prevention? Trends Mol Med. 2006;12(2):76–82.
- Haugarvoll K, Rademakers R, Kachergus JM, et al. Lrrk2 R1441C parkinsonism is clinically similar to sporadic Parkinson disease. Neurology. 2008;70(16 Pt 2):1456–1460.
- Volta M, Melrose H. LRRK2 mouse models: dissecting the behavior, striatal neurochemistry and neurophysiology of PD pathogenesis. Biochem Soc Trans. 2017;45(1):113–122.
- Xiong Y, Dawson TM, Dawson VL. Models of LRRK2-associated Parkinson’s disease. Adv Neurobiol. 2017;14:163–191.
- Yue Z, Lachenmayer ML. Genetic LRRK2 models of Parkinson’s disease: dissecting the pathogenic pathway and exploring clinical applications. Mov Disord. 2011;26(8):1386–1397.
- Liu HF, Lu S, Ho PWL, et al. LRRK2 R1441G mice are more liable to dopamine depletion and locomotor inactivity. Ann Clin Transl Neurol. 2014;1(3):199–208.
- Liu HF, Ho PWL, Leung GC, et al. Combined LRRK2 mutation, aging and chronic low dose oral rotenone as a model of Parkinson’s disease. Sci Rep. 2017;7:40887.
- Ho PWL, Leung GC, Liu HF, et al. Age-dependent accumulation of oligomeric a-synuclein from impaired degradation in mutant LRRK2 knockin mouse model of Parkinson disease: role for therapeutic activation of chaperone-mediated autophagy (CMA). Autophagy. 2020;16(2):347–370.
- Hsieh CH, Shaltouki A, Gonzalez AE, et al. Functional impairment in miro degradation and mitophagy is a shared feature in familial and sporadic Parkinson’s disease. Cell Stem Cell. 2016;19(6):709–724.
- Cookson MR. Cellular functions of LRRK2 implicate vesicular trafficking pathways in Parkinson’s disease. Biochem Soc Trans. 2016;44(6):1603–1610.
- Geisler S, Holmström KM, Skujat D, et al. PINK1/Parkin-mediated mitophagy is dependent on VDAC1 and p62/SQSTM1. Nat Cell Biol. 2010;12(2):119–131.
- Chan NC, Salazar AM, Pham AH, et al. Broad activation of the ubiquitin proteasome system by Parkin is critical for mitophagy. Hum Mol Genet. 2011;20:1726–1737.
- Twig G, Shirihai OS. The interplay between mitochondrial dynamics and mitophagy. Antioxid Redox Signal. 2011;14(10):1939–1951.
- Kim I, Rodriguez‐Enriquez S, Lemasters JJ. Selective degradation of mitochondria by mitophagy. Arch Biochem Biophys. 2007;462:245–253.
- Carreira RS, Lee Y, Ghochani M, et al. Cyclophilin D is required for mitochondrial removal by autophagy in cardiac cells. Autophagy. 2010;6:462–472.
- Mauro‐Lizcano M, Esteban‐Martinez L, Seco E, et al. New method to assess mitophagy flux by flow cytometry. Autophagy. 2015;11:833–843.
- Ito G, Katsemonova K, Tonelli F, et al. Phos-tag analysis of Rab10 phosphorylation by LRRK2: a powerful assay for assessing kinase function and inhibitors. Biochem J. 2016;473(17):2671–2685.
- Doyle A, McGarry MP, Lee NA, et al. The construction of transgenic and gene knockout/knockin mouse models of human disease. Transgenic Res. 2012;21(2):327–349.
- Pang SY, Ho PWL, Liu HF, et al. The interplay of aging, genetics and environmental factors in the pathogenesis of Parkinson’s disease. Transl Neurodegener. 2019;8:23.
- Tolosa E, Vila M, Klein C, et al. LRRK2 in Parkinson disease: challenges of clinical trials. Nat Rev Neurol. 2020;16(2):97–107.
- Chu CT. Mechanisms of selective autophagy and mitophagy: implications for neurodegenerative diseases. Neurobiol Dis. 2019;122:23–34.
- Sarraf SA, Raman M, Guarani-Pereira V, et al. Landscape of the PARKIN-dependent ubiquitylome in response to mitochondrial depolarization. Nature. 2013;496:372–376.
- Benard G, Neutzner A, Peng G, et al. IBRDC2, an IBR-type E3 ubiquitin ligase, is a regulatory factor for Bax and apoptosis activation. Embo J. 2010;29:1458–1471.
- Burchell VS, Nelson DE, Sanchez-Martinez A, et al. The Parkinson’s disease-linked proteins Fbxo7 and Parkin interact to mediate mitophagy. Nat Neurosci. 2013;16:1257–1265.
- Guan K, Zheng Z, Song T, et al. MAVS regulates apoptotic cell death by decreasing K48-linked ubiquitination of voltage-dependent anion channel 1. Mol Cell Biol. 2013;33:3137–3149.
- Lavie J, De Belvalet H, Sonon S, et al. Ubiquitin-dependent degradation of mitochondrial proteins regulates energy metabolism. Cell Rep. 2018;23(10):2852–2863.
- Yue M, Hinkle KM, Davies P, et al. Progressive dopaminergic alterations and mitochondrial abnormalities in LRRK2 G2019S knock-in mice. Neurobiol Dis. 2015;78:172–195.
- Wiemerslage L, Lee D. Quantification of mitochondrial morphology in neurites of dopaminergic neurons using multiple parameters. J Neurosci Methods. 2016;262:56–65.
- Perkins GA, Tjong J, Brown JM, et al. The micro-architecture of mitochondria at active zones: electron tomography reveals novel anchoring scaffolds and cristae structured for high-rate metabolism. J Neurosci. 2010;30:1015–1026.
- Perkins GA, Renken CW, Frey TG, et al. Membrane architecture of mitochondria in neurons of the central nervous system. J Neurosci Res. 2001;66:857–865.
- Gomes LC, Benedetto GD, Scorrano L. During autophagy mitochondria elongate, are spared from degradation and sustain cell viability. Nat Cell Biol. 2011;13:589–598.
- Rambold AS, Kostelecky B, Elia N, et al. Tubular network formation protects mitochondria from autophagosomal degradation during nutrient starvation. Proc Natl Acad Sci USA. 2011;108:10190–10195.
- Twig G, Elorza A, Molina AJ, et al. Fission and selective fusion govern mitochondrial segregation and elimination by autophagy. Embo J. 2008;27(2):433–446.
- Mortiboys H, Thomas KJ, Koopman WJ, et al. Mitochondrial function and morphology are impaired in parkin-mutant fibroblasts. Ann Neurol. 2008;64(5):555–565.
- Papkovskaia TD, Chau KY, Inesta-Vaquera F, et al. G2019S leucine-rich repeat kinase 2 causes uncoupling protein-mediated mitochondrial depolarization. Hum Mol Genet. 2012;21(19):4201–4213.
- Mijaljica D, Prescott M, Devenish RJ. Different fates of mitochondria: alternative ways for degradation? Autophagy. 2007;3(1):4–9.
- Kadowaki M, Karim MR. Cytosolic LC3 ratio as a quantitative index of macroautophagy. Methods Enzymol. 2009;452:199–213.
- Toyofuku T, Okamoto Y, Ishikawa T, et al. LRRK2 regulates endoplasmic reticulum-mitochondrial tethering through the PERK-mediated ubiquitination pathway. Embo J. 2020;39(2):e100875.
- Juárez-Flores DL, González-Casacuberta I, Ezquerra M, et al. Exhaustion of mitochondrial and autophagic reserve may contribute to the development of LRRK2 G2019S -Parkinson’s disease. J Transl Med. 2018;16(1):160.
- Dolman NJ, Chambers KM, Mandavilli B, et al. Tools and techniques to measure mitophagy using fluorescence microscopy. Autophagy. 2013;9(11):1653–1662.
- Sun N, Malide D, Liu J, et al. A fluorescence-based imaging method to measure in vitro and in vivo mitophagy using mt-Keima. Nat Protoc. 2017;12(8):1576–1587.
- Singh R, Cuervo AM. Autophagy in the cellular energetic balance. Cell Metab. 2011;13(5):495–504.
- Palikaras K, Lionaki E, Tavernarakis N. Mechanisms of mitophagy in cellular homeostasis, physiology and pathology. Nat Cell Biol. 2018;20(9):1013–1022.
- Narendra D, Tanaka A, Suen DF, et al. Parkin is recruited selectively to impaired mitochondria and promotes their autophagy. J Cell Biol. 2008;183(5):795–803.
- Jagasia R, Grote P, Westermann B, et al. DRP-1-mediated mitochondrial fragmentation during EGL-1-induced cell death in C. elegans. Nature. 2005;433:754–760.
- Wang X, Yan MH, Fujioka H, et al. LRRK2 regulates mitochondrial dynamics and function through direct interaction with DLP1. Hum Mol Genet. 2012;21(9):1931–1944.
- Ho DH, Je AR, Lee H, et al. LRRK2 kinase activity induces mitochondrial fission in microglia via Drp1 and modulates neuroinflammation. Exp Neurobiol. 2018;27(3):171–180.
- Biskup S, Moore DJ, Celsi F, et al. Localization of LRRK2 to membranous and vesicular structures in mammalian brain. Ann Neurol. 2006;60(5):557–569.
- West AB, Moore DJ, Biskup S, et al. Parkinson’s disease-associated mutations in leucine-rich repeat kinase 2 augment kinase activity. Proc Natl Acad Sci USA. 2005;102(46):16842–16847.
- Otera H, Ishihara N, Mihara K. New insights into the function and regulation of mitochondrial fission. Biochim Biophys Acta. 2013;1833(5):1256–1268.
- Bonello F, Hassoun SM, Mouton-Liger F, et al. LRRK2 impairs PINK1/Parkin-dependent mitophagy via its kinase activity: pathologic insights into Parkinson’s disease. Hum Mol Genet. 2019;28(10):1645–1660.
- Niu J, Yu M, Wang C, et al. Leucine-rich repeat kinase 2 disturbs mitochondrial dynamics via Dynamin-like protein. J Neurochem. 2012;122(3):650–658.
- Smith GA, Jansson J, Rocha EM, et al. Fibroblast biomarkers of sporadic Parkinson’s disease and LRRK2 kinase inhibition. Mol Neurobiol. 2016;53(8):5161–5177.
- Favaro G, Romanello V, Varanita T, et al. DRP1-mediated mitochondrial shape controls calcium homeostasis and muscle mass. Nat Commun. 2019;10(1):2576.
- Lemasters JJ. Variants of mitochondrial autophagy: types 1 and 2 mitophagy and micromitophagy (Type 3). Redox Biol. 2014;2:749–754.
- Hailey DW, Rambold AS, Satpute-Krishnan P, et al. Mitochondria supply membranes for autophagosome biogenesis during starvation. Cell. 2010;141:656–667.
- Hamasaki M, Furuta N, Matsuda A, et al. Autophagosomes form at ER-mitochondria contact sites. Nature. 2013;495:389–393.
- Prieto J, León M, Ponsoda X, et al. Early ERK1/2 activation promotes DRP1-dependent mitochondrial fission necessary for cell reprogramming. Nat Commun. 2016;7:11124.
- Martinez-Lopez N, Singh R. ATGs: scaffolds for MAPK/ERK signaling. Autophagy. 2014;10(3):535–537.
- Bravo-San Pedro JM, Niso-Santano M, Gómez-Sánchez R, et al. The LRRK2 G2019S mutant exacerbates basal autophagy through activation of the MEK/ERK pathway. Cell Mol Life Sci. 2013;70(1):121–136.
- Li X, Tan YC, Poulose S, et al. Leucine-rich repeat kinase 2 (LRRK2)/PARK8 possesses GTPase activity that is altered in familial Parkinson’s disease R1441C/G mutants. J Neurochem. 2007;103(1):238–247.
- Nichols RJ, Dzamko N, Morrice NA, et al. 14-3-3 binding to LRRK2 is disrupted by multiple Parkinson’s disease-associated mutations and regulates cytoplasmic localization. Biochem J. 2010;430(3):393–404.
- Kashatus JA, Nascimento A, Myers LJ, et al. Erk2 phosphorylation of Drp1 promotes mitochondrial fission and MAPK-driven tumor growth. Mol Cell. 2015;57(3):537–551.
- Jahani-Asl A, Slack RS. The phosphorylation state of Drp1 determines cell fate. EMBO Rep. 2007;8(10):912–913.
- Reddy PH, Reddy TP, Manczak M, et al. Dynamin-related protein 1 and mitochondrial fragmentation in neurodegenerative diseases. Brain Res Rev. 2011;67(1–2):103–118.
- Yang X, Wang H, Ni HM, et al. Inhibition of Drp1 protects against senecionine-induced mitochondria-mediated apoptosis in primary hepatocytes and in mice. Redox Biol. 2017;12:264–273.
- Szabadkai G, Simoni AM, Chami M, et al. Drp-1-dependent division of the mitochondrial network blocks intraorganellar Ca2+ waves and protects against Ca2+-mediated apoptosis. Mol Cell. 2004;16:59–68.
- Knott AB, Perkins G, Schwarzenbacher R, et al. Mitochondrial fragmentation in neurodegeneration. Nat Rev Neurosci. 2008;9(7):505–518.
- Wauters F, Cornelissen T, Imberechts D, et al. LRRK2 mutations impair depolarization-induced mitophagy through inhibition of mitochondrial accumulation of RAB10. Autophagy. 2020;16(2):203–222.
- Karbowski M, Neutzner A. Neurodegeneration as a consequence of failed mitochondrial maintenance. Acta Neuropathol. 2012;123:157–171.
- de Castro IP, Martins LM, Tufi R. Mitochondrial quality control and neurological disease: an emerging connection. Expert Rev Mol Med. 2010;12:e12.
- Ho PWL, Ho JWM, Tse HM, et al. Uncoupling protein-4 (UCP4) increases ATP supply by interacting with mitochondrial Complex II in neuroblastoma cells. PLoS ONE. 2012;7(2):e32810.