
ABSTRACT
The function of mitophagy in cancer is controversial. ULK1 is critical for induction of macroautophagy/autophagy and has a more specific role in mitophagy in response to hypoxia. Here, we show that ULK1 deficiency induces an invasive phenotype of breast cancer cells under hypoxia and increases osteolytic bone metastasis. Mechanistically, ULK1 depletion attenuates mitophagy ability during hypoxia. As a result, the accumulation of damaged, ROS-generating mitochondria leads to activation of the NLRP3 inflammasome, which induces abnormal soluble cytokines secretion, then promotes the differentiation and maturation of osteoclasts, and ultimately results in bone metastasis. Notably, phosphorylation of ULK1 by MAPK1/ERK2-MAPK3/ERK1 kinase triggers its interaction with BTRC and subsequent K48-linked ubiquitination and proteasome degradation. Also, a clearly negative correlation between the expression levels of ULK1 and p-MAPK1/3 was observed in human breast cancer tissues. The MAP2K/MEK inhibitor trametinib is sufficient to restore mitophagy function via upregulation of ULK1, leading to inhibition of NLRP3 inflammasome activation, thereby reduces bone metastasis. These results indicate that ULK1 knockout-mediated mitophagy defect promotes breast cancer bone metastasis and provide evidence to explore MAP2K/MEK- MAPK1/3 pathway inhibitors for therapy, especially in cancers displaying low levels of ULK1.
Abbreviations: ATG: autophagy-related; Baf A1: bafilomycin A1; BTRC/β-TrCP: beta-transducin repeat containing E3 ubiquitin protein ligase; CHX: cycloheximide; CM: conditioned media; FBXW7/FBW7: F-box and WD repeat domain containing 7; MAPK1: mitogen-activated protein kinase 1; MTDR: MitoTracker Deep Red; mtROS: mitochondrial reactive oxygen species; microCT: micro-computed tomography; mtROS: mitochondrial reactive oxygen species; OCR: oxygen consumption rate; SQSTM1: sequestosome 1; ACP5/TRAP: acid phosphatase, tartrate resistant; ULK1: unc-51 like autophagy activating kinase 1
Introduction
Mitophagy, a selective form of macroautophagy, is the only known pathway that removes complete, damaged, and dysfunctional mitochondria in response to various metabolic stresses such as hypoxia, growth factor depletion, virus infection and nutrient deprivation [Citation1,Citation2]. As mitophagy is essential for maintaining cellular energy homeostasis and functions, mitophagy deficiency is indeed associated with a wide array of human disorders including neurodegenerative diseases, myopathies, aging, cardiac diseases, Alzheimer disease, and autoimmune diseases [Citation3–6]. Accumulating evidence show that mitophagy is often defective in various cancer cells [Citation7]. However, the role of mitophagy in cancer cells is complicate [Citation8]. It is clear that mitophagy can be induced to protect tumor cells from apoptosis or necrosis and enable tumor cells survival under some adverse conditions [Citation9]. On the contrary, mitophagy can serve to remove dysfunctional mitochondria to alleviate oxidative stress and prevent carcinogenesis. Therefore, a better understanding of the biological functions of mitophagy during cancer development and the intrinsic molecular mechanisms of this process will be crucial for the development of novel anticancer therapeutics [Citation9].
ULK1 (unc-51 like autophagy activating kinase 1), one of the core human autophagy-related genes, located on chromosome 12q24.3, encodes a serine-threonine kinase and the mammalian ortholog of the yeast ATG1 gene [Citation10]. In mammals, ULK1 forms a stable complex with ATG13, RB1CC1/FIP200, and ATG101, which is the core of autophagy induction machinery [Citation11]. It can receive upstream signaling information regarding the cellular nutrient status from MTOR (mechanistic target of rapamycin kinase) and AMPK (AMP activated protein kinase) to initiate autophagy, recruit downstream ATG proteins to the autophagosome formation site, and govern autophagosome formation [Citation12]. Recent studies suggest that ULK1 plays a more specific role in mitophagy, especially under hypoxic condition. Hypoxia induced ULK1 translocation to mitochondria where ULK1 has been shown to phosphorylate the mitophagy receptor FUNDC1 to induce mitophagy in MEF cells [Citation13]. ULK1 deficiency in primary hepatocytes results in defective mitophagy with aberrant morphology of the mitochondria and defects in mitochondrial membrane potential [Citation14]. Also ULK1−/− BMDCs have more mitochondrial damage and greater mitochondrial mass than wild-type BMDCs [Citation15]. However, the regulation and precise role of of ULK1 in cancer are not completely understood.
Metastasis is responsible for the majority of breast cancer deaths. Especially, metastasis of breast cancer cells to the bone occurs in 65–80% of late-stage patients [Citation16,Citation17]. Despite years of studies, the molecular underpinnings of breast cancer metastasis remain incompletely understood. Breast cancer is one of the diseases genetically linked to a deficiency in autophagy [Citation18,Citation19]. Our previous study demonstrates that ULK1 protein is downregulated in breast cancer patients with invasive ductal carcinomas [Citation20]. Here, we examine the key role of ULK1 in breast cancer bone metastasis. Our results show that ULK1 knockout-associated mitophagy deficiency promotes the metastasis of breast cancer cells, especially to bone via ROS-induced NLRP3 inflammasome activation. Importantly, MAPK1/3 kinase is found to be involved in the BTRC-mediated proteasome degradation of ULK1, and pharmacological inhibition of MAPK1/3 kinase activation restricts bone metastasis and extends mouse survival. Our findings provide new insights into the role of ULK1 in breast cancer and identify new strategies to induce mitophagy as a possible therapeutic target for breast cancer bone metastasis.
Results
ULK1 deficiency mediates breast cancer bone metastasis
Our previous study has shown that the expression of ULK1 protein is significantly decreased in invasive breast primary cancer tissues compared with that in adjacent noncancerous tissues [Citation20]. Additionally, low expression of ULK1 is associated with breast cancer progression and is an adverse prognostic marker of survival for patients [Citation20]. To investigate the functional role of ULK1 in the progression of breast cancer, we depleted ULK1 using specific single-guide RNAs (sgRNAs) in MDA-MB-231 and mouse mammary carcinoma 4T1 cells, and then added backs through overexpression of ULK1 to rescue (). Hypoxia is a hallmark of most solid tumors, and metastatic potential of tumor cells is strongly influenced by hypoxia. Thus we compared the migration and invasion abilities of these breast cancer cells in response to hypoxia. We found the migration and invasion abilities were clearly greater in ULK1-knockout cells than in wild-type cells under hypoxic conditions. And these abilities decreased when ULK1 expression was reconstituted ( Figure S1A-1B). However, the loss of ULK1 had no effect on cell proliferation and tumor formation in nude mice, confirmed by a growth curve as well as the xenograft tumor volume and tumor weight (Figure S1C-1D). These observations indicate that ULK1 deficiency promotes the migration and invasion phenotype of breast cancer cells, which is consistent with the results from previous reports [Citation21].
Figure 1. Loss of ULK1 in breast cancer cells increases breast cancer bone metastasis. (A) Immunoblot in MDA-MB-231 cells or 4T1 cells expressing sgRNAs targeting ULK1, then rescued with ULK1 cDNA. (B and C) Quantitative analysis of the migratory and invasive ability of the indicated MDA-MB-231 cells (B) and 4T1 cells (C) exposed to hypoxic conditions. Quantification of migratory and invasive cells in each group. The migration or invasion of control cells (WT) was set as 100%. (D) The luciferase-tagged WT or ULK1-knockout MDA-MB-231 cells were injected intracardially. BLI images showed representative mice in each group (left). Normalized bone metastasis BLI signals from mice (n = 5, right). (E) Representative histological images of bones from each experimental group mice in (D). Arrows indicate areas of overt bone destruction in ACP5/TRAP images. (F) Quantification of ACP5/TRAP+ osteoclasts and IHC analysis of MKI67/KI-67 from decalcified histological hind limb sections in (D). (G) Micro CT imagines from a representative mouse in each group in (D). (H) Quantification of trabecular bone volume relative to total volume, trabecular numbers and trabecular thickness from representative micro CT scans in (D). Regions of interest for trabecular bone scan and analysis are marked by green. (I) MDA-MB-231 cells were stably transfected with ULK1 shRNA, then rescued with ULK1 cDNA. (J) the indicated luciferase-tagged MDA-MB-231 cells were injected intracardially. BLI images showed representative mice in each group (left). Normalized bone metastasis BLI signals from mice (n = 7, right). (K) Kaplan-Meier survival curve of mice were calculated (n = 7). Error bars represent mean ± SEM. The P value in (B), (C) was determined by one-way ANOVA with Tukey’s multiple comparisons test, the P value in (D), (F), (J) was determined by one-way ANOVA with Dunnett’s multiple comparisons test, no adjustments were made for multiple comparisons. The P value in (H) was determined by a two-tailed unpaired Student’s t test. The P value in (K) was assessed using the log-rank test. * P < 0.05, ** P < 0.01. Data are representative of two independent experiments
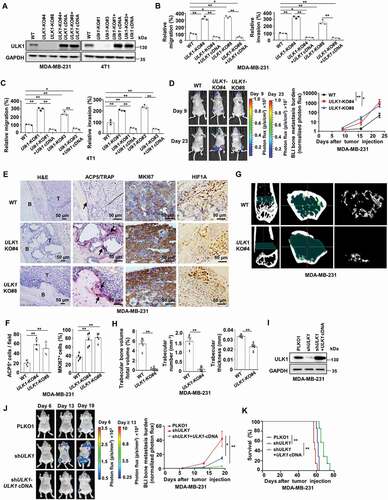
Bone is the most common organ affected by distant relapse of breast cancer. When those 298 tissues of breast cancer patients we have reported previously were reexamined [Citation20], we found 30 patients still developed into bone metastasis in the next few years after the same treatment guideline in our center. Among these 30 cases, 25 primary breast cancer samples were defined a low expression of ULK1 (83.3%), and the remaining tissues were scored as high expression of ULK1 (16.7%). This means lower level of ULK1 is associated with a significantly increased risk of bone metastasis in breast cancer patients. Next, we established experimental bone metastasis animal model by intracardiac injection MDA-MB-231 cells with a firefly luciferase reporter stably expressed. A higher incidence and greater tumor burden were found in mice harboring ULK1-knockout cells than in mice harboring wild-type cells, shown by increased bioluminescence imaging (BLI) in the hind limbs (). We then confirmed the BLI measurement of bone metastasis corresponded to the results from necropsy, immunohistochemical (IHC) analysis and micro-computed tomography (microCT) analysis. The positive IHC staining of HIF1A/Hif-1α showed hypoxia exsited in the bone metastasis microenvironment (). Histological Tartrate resistant acid phosphatase (ACP5/TRAP) staining of decalcified bone sections revealed a significant increase in the number of osteoclasts relative to bone surface area in the ULK1-knockout group compared to that in controls (). Accordingly, MKI67/KI-67 staining of bone metastases revealed a 2-fold increase in proliferating tumor cells in the ULK1-knockout group compared with proliferating tumor cells in the control group (). Examination by microCT revealed that a significant reduction in relative trabecular bone volume, trabecular number and trabecular thickness in mice injected with ULK1-knockout cells compared with those in controls, confirming the significant increase in osteoclasts that was seen in the ACP5/TRAP staining analysis (). Recent work suggests that the use of autophagy deficient clones derived via CRISPR-Cas9 results in significant adaptations [Citation22]. To further confirm the key function of ULK1 in bone metastasis and avoid the heterogeneity of monoclonal cell strains, we stably silenced ULK1 expression by small hairpin RNA (shRNA) in MDA-MB-231 cells, and then added backs through overexpression of ULK1 to rescue (). BLI analysis revealed a significant increase in bone metastasis burden after ULK1 knockdown. When ULK1 expression was reconstituted, the bone metastasis burden obviously decreased (). More important, the survival of ULK1-reconstituted mice improved (). These findings indicate that ULK1 deficiency promotes the onset of breast cancer bone metastasis and drives the development of osteoclastic lesions.
ULK1 deficiency enhances osteoclastogenesis
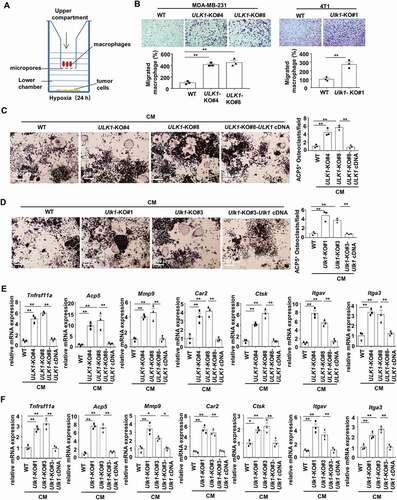
As aberrant osteoclast activity can lead to lytic bone metastasis, we further examined whether ULK1 affected the osteoclastic features in our models. The murine preosteoclast macrophage cell line RAW264.7 is reported to be able to be induced to differentiate into mature, multinucleated osteoclasts [Citation23]. An in vitro co-culture model was used to study whether ULK1 deficiency may contribute to macrophage chemotaxis. RAW264.7 cells were placed in the upper compartment of the transwell, and the tumor cells were placed in the corresponding bottom chamber and exposed to hypoxia (). After 24 h, ULK1-knockout cells were found to significantly promote macrophage migration compared with the wild-type cells (). To examine the potential of tumor conditioned media (CM) to induce osteoclast differentiation, RAW264.7 cells were treated with CM from MDA-MB-231 and 4T1 cells under hypoxic conditions. ACP5/TRAP staining revealed more mature, multinucleated osteoclasts when RAW264.7 cells treated with conditional medium (CM) from the ULK1-knockout cells than from the wild-type cells. When ULK1 expression was reconstituted, ACP5/TRAP+ osteoclasts significantly decreased (). At the same time, we examined the mRNA expression of select markers of osteoclast phenotypic and functional genes in RAW264.7 cells. As expected, the expression of osteoclast phenotypic genes Tnfrsf11a/Rank, Acp5/Trap, and Mmp9 and bone resorption function-related genes Ctsk, Car2, Itgav and Itga3 was upregulated in osteoclasts nourished with ULK1-knockout coculture media compared with those nourished with control media (). However, these increased expression levels were blocked when ULK1 expression was rescued (). These findings indicate that ULK1-deficient breast cancer cells promote osteoclast differentiation and function, leading to lytic bone metastasis.
Figure 2. ULK1-deficient breast cancer cells stimulate osteoclastogenesis. (A) Schematic overview of tumor cells co-cultured with macrophages under hypoxic (1% O2) conditions for 24 h. (B) Representative images of RAW264.7 cell chemotaxis to co-cultured with indicated breast cancer cells (upper). Quantification of migratory RAW264.7 cells in each group (bottom). The migration of control cells (WT) was set as 100% (bottom). (C and D) Quantification of ACP5/TRAP+ osteoclasts when RAW264.7 cells treated with CM from the indicated MDA-MB-231 cells (C) or 4T1 cells (D) for 7 days in the presence of 20 ng/ml TNFSF11/RANKL. (E and F) Osteoclast phenotypic and functional genes were detected with qRT-PCR when RAW264.7 cells treated with CM from the indicated MDA-MB-231(E) cells or the indicated 4T1 cells (F) for 7 days in the presence of 20 ng/ml TNFSF11/RANKL. Error bars represent mean ± SEM. The P value in (B) (MDA-MB-231) was determined by one-way ANOVA with Dunnett’s multiple comparisons test, the P value in (C-F) was determined by one-way ANOVA with Tukey’s multiple comparisons test, no adjustments were made for multiple comparisons. The P value in (B) (4T1) was determined by a two-tailed unpaired Student’s t test. * P < 0.05, ** P < 0.01. Data are representative of three independent experiments
ULK1 depletion attenuates mitophagy ability in breast cancer cells
Subsequently, we explored the mechanism involved in ULK1-deficiency mediated breast cancer lytic bone metastasis. ULK1 is critical for the induction of autophagy, especially playing a more specific role in mitophagy under hypoxia. We first compared primary mammary tumors versus bone metastases of breast cancer patients (GSE39494) by Gene set enrichment analysis (GSEA) pathway analysis [Citation24]. Indeed, the result showed a significant and increasingly positive enrichment for mitophagy related-genes in primary mammary tumors, and a decreased ULK1 expression but a increased TOMM20 expression in bone metastases samples compared to that in primary mammary tumors (Figure S2A). We then examined the mitophagy activity after ULK1 knockout in response to hypoxia. We found mitochondrial outer membrane protein TOMM20 and mitochondrial matrix protein HSPD1/Hsp60 were much less abundant in wild-type cells and ULK1 reconstituted cells than that in ULK1-knockout MDA-MB-231 and 4T1 cells under hypoxic condition (). The result was similar when ULK1 was stably silenced by small hairpin RNA (shRNA) in MDA-MB-231 cells (Figure S2B). Therefore, we further detected mitochondrial DNA (mtDNA) to observe how ULK1 modulated mitophagy [Citation25]. The decrease in mtDNA was blocked in the group of ULK1-knockout under hypoxic condition, but not in the groups of WT and ULK1 reconstituted ().
Figure 3. Loss of ULK1 in breast cancer cells results in mitophagy deficiency. (A and B) The indicated MDA-MB-231 and 4T1 cells were cultured under hypoxic (1% O2) for the indicated time. The cell lysates were prepared for immunoblots (A). The mtDNA levels were quantified using qRT-PCR (B). (C) The indicated MDA-MB-231 and 4T1 cells were cultured under hypoxic (1% O2) for the indicated time in the presence of 100 nM Baf A1. MTDR was used to determine mitochondrial staining by flow cytometry. (D) Relative ratio of mCherry fluorescence to EGFP fluorescence for the indicated MDA-MB-231 cells stably expressing pBabe-mCherry‐EGFP‐ FIS1101‐152 plasmids (MDA-MB-231-mtQC) were cultured under hypoxic (1% O2) for 24 h. (E and F) Fluorescence microscopy of the co-localization of GFP-LC3 with mitochondria in the indicated MDA-MB-231 cells subjected to hypoxia for 24 h in the presence of 100 nM Baf A1 (E). Quantification of LC3 puncta co-localized with mitochondria per cell (F). (G-H) The indicated MDA-MB-231cells were cultured under hypoxia for 12 h. Flow cytometry analysis of the cells stained with MTG (G). Flow cytometry analysis of the cells stained with MitoSOX(H). (I) Quantification of oxygen consumption rate measurements from the indicated MDA-MB-231 cell lines with the following pharmacological inhibitors of metabolism(left). Calculations from the mitochondrial stress test (right). Error bars represent mean ±SEM. The P value in (B) was determined by one-way ANOVA with Dunnett’s multiple comparisons test, the P value in (C), (D), (F-I) was determined by one-way ANOVA with Tukey’s multiple comparisons test, no adjustments were made for multiple comparisons. NS, not significance, * P < 0.05, ** P < 0.01. Data are representative of three independent experiments
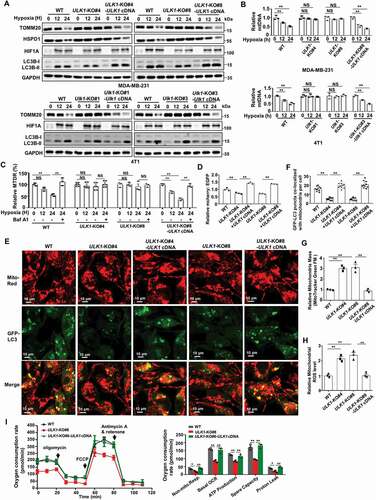
Then we used MitoTracker Deep Red (MTDR) dye to assess mitophagy flux [Citation26]. We got the similar result as the mtDNA. Hypoxia induces an obvious decrease of MTDR fluorescence levels relative to control cells in the groups of WT and ULK1 reconstituted, but not in the groups of ULK1 knockout. And this decrease was prevented when the cells were treated with the lysosomal-acidification inhibitor bafilomycin A1 (Baf A1) (). In addition, we generated mitochondrially- targeted tandem pBabe-EGFP‐mCherry‐FIS1101‐152 (mito-mCherry-EGFP reporter, mitoQC) for analysis of relative mitophagic flux [Citation27,Citation28]. The ratio of mCherry to EGFP mitoQC fluorescence as determined by flow cytometry can reveal differences in mitophagic flux [Citation29,Citation30]. The result showed that ULK1-depleted MDA-MB-231-mitoQC cells showed a reduction in their mCherry:EGFP ratios compared with WT cells (). These findings were corroborated by fluorescence microscopy imaging. We found that the number of punctation with GFP-LC3 that localized with mitochondria was also significantly lower in ULK1-knockout cells than in wild-type cells (). More important, when Flag-ULK1 was effectively reconstituted, mitophagy activity was recovered, demonstrated by an increased mCherry:EGFP ratio, and an increased localization between GFP-LC3 with mitochondria (). However, we also noted that the formation of the lipidated form of LC3-II induced by hypoxia was only weakly decreased by loss of ULK1 (, Figure S2B), and the effects of ULK genetic loss on autophagic flux was only weakly altered with no significant statistical significance (Figure S2C). These support the idea that ULK1 plays a more specific role in mitophagy under hypoxia, and ULK1 depletion in breast cancer cells attenuates the general mitophagy activity with the increased mitochondria.
We further measured the effect of ULK1 on mitochondrial homeostasis. We observed that the total mitochondrial mass and mitochondrial reactive oxygen species (mtROS) were substantially elevated when ULK1 was knocked out in MDA-MB-231 cells (). When Flag-ULK1 was effectively reconstituted, both the increased total mitochondrial mass and mtROS were blocked (). However, the oxygen consumption rates (OCR) profile and the relative quantification of OCR corresponding to the single stages were clearly lower in the ULK1-knockout cells compared to wild-type, and exogenous ULK1 expression increased both basal levels of oxygen consumption and spare respiratory capacity (), supporting the idea that the increased mitochondria in the ULK1-knockout cells were mainly dysfunctional mitochondria. Together, these data suggest that loss of ULK1 in breast cancer cells induces mitophagy deficiency, leading to accumulation of abnormality mitochondria and a greater basal amount of mitochondrial ROS production.
NLRP3 inflammasome activation by mitochondrial ROS contributes to ULK1 deficiency-mediated breast cancer bone metastasis
In general, tumor metastasis to bone can alter normal bone physiology, resulting in uncoupled bone remodeling. Tumors can secrete osteolytic factors, such as LOX, PTHLH/PTHRP, IL1, IL6, IL8, VEGF, and TNF, to drive the development of osteoclastic lesions [Citation31]. Meanwhile, enhanced osteoclast activity aggravates the growth and progression of tumor cell bone metastases [Citation16]. NLRP3 inflammasome activity is reported to be negatively regulated by autophagy and positively regulated by ROS, and NLRP3 inflammasome promotes the maturation and release of pro- inflammatory cytokines upon activation [Citation32]. We next examined whether NLRP3 inflammasome activity was regulated in our cell models. As expected, the mRNA level and the protein level of NLRP3 were substantially elevated in the ULK1-knockout cells but blunted by restoration of ULK1, as well as cleaved CASP1 (caspase 1) (). And the formation of the inflammasome in the ULK1-knockout cells was significantly greater than that in wild-type cells, as the interaction between ASC and NLRP3 was enhanced, but ULK1 restoration blocked this interaction (). We then identified the soluble factors secreted from tumor cells which could promote osteolytic metastasis using RayBio Human Cytokine Antibody Array. The levels of seven cytokines were significantly increased in the cytokine profiles of the conditional medium of ULK1-knockdown MDA-MB-231 cells compared with the levels in the CM of control cells, but this increase was reversed when Flag-ULK1 was reconstituted (Table S1 and ). Among these cytokines, IL1B/IL-1β and IL6/IL-6 are important factors which are able to substitute for TNFSF11/RANKL to support osteoclastogenesis [Citation31,Citation33]. We then evaluated which cytokines were responsible for enhancing osteoclastogenesis. Actually, treatment of RAW264.7 cells with cytokines IL6/IL-6 and IL1B/IL-1β prompted osteoclast differentiation with increasing ACP5/TRAP+ staining in RAW264.7 cells (). ELISA assay further confirmed the increase in cytokines IL6 and IL1B in the CM from ULK1-knockout cells compared with that from wild-type cells, as well as the reversal in the levels when ULK1 expression was restored ().
Figure 4. Mitophagy deficiency-mediated NLRP3 inflammasome activation contributes to ULK1 depletion-induced breast cancer bone metastasis. (A and B) The indicated MDA-MB-231 cells were cultured under hypoxic conditions for 24 h. The mRNA levels of NLRP3 were analyzed by qRT-PCR (A). The cell lysates were prepared for immunoblots (B). (C) The indicated MDA-MB-231 cells were cultured under hypoxic conditions for 24 hours. The lysates were immunoprecipitated with anti-ASC, then immunoblotted as indicated. (D) Human Inflammation Antibody ArrayAAH-INF-3 Cytokine array of the CM of indicated MDA-MB-231 cells treated with hypoxic (1% O2) conditions for 24 h. A table summarizing the relative signal intensity of indicated cytokines was presented. (E) Quantification and representative images of ACP5/TRAP+ osteoclasts in RAW264.7 cells treated with indicated concentration of IL1B, or IL6 for 7 days in the presence of 20 ng/ml TNFSF11/RANKL. (F) The indicated MDA-MB-231 cells were cultured under hypoxic (1% O2) conditions for 24 h. Then the CM was collected. IL1B and IL6 levels in the indicated CM were measured by ELISA. (G) The ULK1-knockout MDA-MB-231 cells were treated with various concentrations of NAC for 24 h or 4 mM NAC for the indicated times. (H) The luciferase-tagged ULK1-knockout MDA-MB-231 cells (mixing MDA-MB-231 ULK1-KO#4 cells and MDA-MB-231 ULK1-KO#8 cells) were injected intracardially. The treatments began on day 0 after inoculation. BLI images show representative mice from each experimental group. (I) Normalized bone metastasis BLI signals from mice in (H) (n = 5). (J) Serum IL1B and IL6 levels from mice in (H) were measured by ELISA (n = 5). (K) Kaplan-Meier survival curve of mice were calculated (n = 8). Error bars represent mean ±SEM. The P value in (E), (H), (J) was determined by one-way ANOVA with Dunnett’s multiple comparisons test, the P value in (A), (F) was determined by one-way ANOVA with Tukey’s multiple comparisons test, no adjustments were made for multiple comparisons. The P value in (K) was assessed using the log-rank test. * P < 0.05, ** P < 0.01. Data are representative of two independent experiments
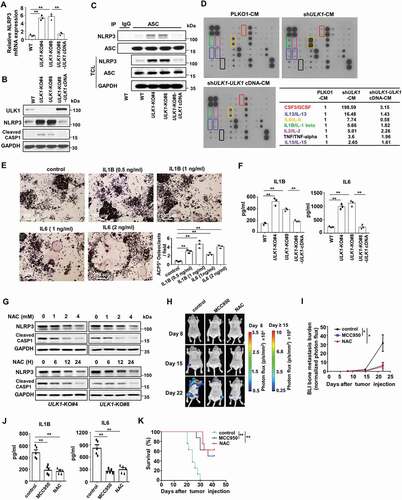
To confirm the key role of NLRP3 inflammasome activation by ROS, the ULK1-knockout cells were treated with ROS scavenger NAC. The result showed that NAC reduced the expression of NLRP3 and cleaved CASP1 in mitophagy-deficient cells (). And in ULK1 deficiency-mediated bone metastasis animal models, the mice were treated with NLRP3 inhibitor MCC950 and ROS scavenger NAC. BLI analysis revealed a significant decrease in bone metastasis burden after MCC950 or NAC treatment (). ELISA assay showed the serum IL1B and IL6 of MCC950 or NAC-treated mice were also significantly decreased (). More important, the survival of MCC950 or NAC-treated mice improved (). These observations indicate that mitophagy deficiency-induced NLRP3 inflammasome activation promots osteolytic bone metastasis. To further confirm this notion, the process of mitophagy was inhibited by the mitophagy inhibitor mdivi-1 or by knockdown of FUNDC1, a mitochondrial outer membrane protein that mediates hypoxia-induced mitophagy in mammalian cells [Citation34]. The result showed the protein level and mRNA level of NLRP3 were substantially increased after FUNDC1 knockdown or mdivi-1 treatment, as well as cleaved CASP1 (Figure S3A-3C). And total mitochondrial mass and mtROS were substantially elevated after FUNDC1 knockdown or mdivi-1 treatment (Figure S3D-3E). ACP5/TRAP+ mature osteoclasts also significantly increased when the process of mitophagy was blocked (Figure S3F-S3G). Similarly, the migration and invasion abilities of tumor cells were enhanced when mitophagy was blocked by FUNDC1 knockdown or mdivi-1 treatment (Figure S3H-S3I). Marsh et al report that the cargo receptor NBR1 promotes metastasis upon autophagy deletion in mouse breast cancer cells [Citation35]. To determine whether this mechanism contributes to the migration, osteoclast and bone metastatic phenotypes observed upon ULK loss, we detected the expression of NBR1. The result showed that the expression of NBR1 protein in ULK1-knockout MDA-MB-231 cell lines was similar to the level in the MDA-MB-231 WT cell line (Figure S3J), which indicated NBR1 protein might not contribute to the bone metastatic phenotypes observed upon ULK loss. Taken together, these data suggest that ULK1 depletion-mediated mitophagy deficiency leads to the accumulation of damaged, ROS-generating mitochondria, which results in NLRP3 inflammasome activation to secret soluble cytokines, then renders breast cancer cells more susceptible to osteolytic metastasis.
BTRC mediates proteasome degradation of ULK1
As ULK1 depletion-mediated mitophagy deficiency contributes to breast cancer bone metastasis, we hypothesized that upregulation of ULK1 might be a potential and feasible strategy to block metastasis. Therefore, we further identified the mechanism for the deregulation of ULK1 in breast cancer. We first analyzed the relationship between the protein level of ULK1 and its copy number or transcription level in the publicly available The Cancer Genome Atlas (TCGA) database. The protein level of ULK1 had no significant correlation with its gene copy number or mRNA level (Figure S4A-S4B). Therefore, we reasoned that ULK1 might be tightly regulated by the ubiquitin proteasome pathway. Indeed, there was an obvious decrease in the ULK1 protein level in the presence of the protein synthesis inhibitor cycloheximide (CHX) (). Upon treatment with the proteasome inhibitor MG132, ULK1 expression significantly accumulated (). These observations suggest that the ULK1 protein is highly unstable and is prone to proteasome degradation. Next, we attempted to identify potential E3 ligase candidates for ULK1. RNA interference was employed to screen a panel of E3 ubiquitin ligases. We found that only depletion of BTRC led to a significant accumulation of ULK1 in MDA-MB-231 and HS578T cells (). Additionally, overexpression of BTRC induced more ULK1 degradation than the negative control, and treatment with MG132 restored ULK1 expression (). An interaction was also detected between endogenous ULK1 and endogenous BTRC in MDA-MB-231 cells (). We further determined the functional role of BTRC in ULK1 ubiquitination. We found that ULK1 ubiquitination was considerably upregulated when BTRC was overexpressed, whereas the inactive BTRC ΔF (a BTRC variant that lacks the F-box domain) abolished this enhancement (, Figure S4C). In addition, downregulation of BTRC by RNAi decreased ULK1 ubiquitination (, Figure S4D). Our results also revealed that ULK1 was mainly ubiquitinated with K48 linkage. Expression of a K48R ubiquitin mutant (unable to form K48-linked chains) impaired ULK1 polyubiquitination, whereas a K63R mutant (unable to form K63-linked chains) did not (, Figure S4E). Additionally, K48-linked ubiquitination of ULK1 increased after BTRC overexpression (, Figure S4F). Collectively, these results demonstrate that BTRC may be the major E3 ligase for ubiquitination of ULK1, and the Lys48-linked poly-ubiquitin chains target ULK1 for proteasome degradation.
Figure 5. ULK1 stability in breast cancer cells is controlled by BTRC-mediated ubiquitination-proteasome pathway. (A) Lysates from MDA-MB-231 cells treated with 20 μM CHX or 10 μM MG132 at indicated intervals were subjected to immunoblotting. (B) Immunoblot analysis of MDA-MB-231 and HS578T cells transfected with the indicated siRNA oligonucleotides. (C) Myc-tagged BTRC was expressed in HEK293T cells that were treated with or without 10 μM MG132 for 5 h. (D) Endogenous ULK1 was immunoprecipitated from MDA-MB-231 cells, followed by immunoblot using BTRC antibody. (E) HEK293T cells were transiently transfected with various combinations of plasmids for 48 h, followed by treatment with 10 μM MG132 for 5 h. Immunoprecipitation analysis of endogenous ULK1 ubiquitination with the indicated antibodies. (F) HEK293T cells were transiently transfected with control siRNA or BTRC siRNA for 48 h followed by treatment with 10 μM MG132 for 5 h. Immunoprecipitation analysis of endogenous ULK1 ubiquitination with the indicated antibodies. (G and H) HEK293T cells were transiently transfected with various combinations of plasmids for 48 h, followed by treatment with 10 μM MG132 for 5 h. Immunoprecipitation analysis of exogenous ULK1 ubiquitination with the indicated antibodies. Data are representative of three independent experiments
MAPK1/3 kinase is involved in the BTRC-mediated proteasome degradation of ULK1
Before their recognition and destruction by the SCF BTRC complex, most BTRC downstream targets have been suggested to require proper modification by a combination of kinases within their degron sequences [Citation36]. We therefore sought to identify the kinase that phosphorylates ULK1 and triggers its interaction with BTRC. Inactivation of MAPK1/3 kinase by the MAP2K/MEK inhibitor U0126 was found to result in an accumulation of endogenous ULK1 in a time- and concentration- dependent manner, but have no effect on the ULK1 mRNA level (, Figure S5A). Consistent with this finding, knockdown of MAPK1/3 using siRNAs also increased the ULK1 protein level (). More importantly, we found that increased levels of ULK1 protein were concomitantly accompanied by decreased phospho-MAPK1/3 expression and decreased mitochondrial matrix HSPD1/HSP60 expression in fresh human breast primary cancer tissues (). We then performed IHC analysis to evaluate the potential association between ULK1 and phospho-MAPK1/3 in human breast primary cancer tissues. The result also showed that those with low expression of ULK1 tumors had significantly higher phospho-MAPK1/3 expression than those with high expression of ULK1 tumors (, Figure S5B). Also, we detected an interaction among endogenous MAPK1/3, ULK1 and BTRC (), whereas knockdown of MAPK1/3 significantly reduced the interaction between ULK1 and BTRC ().
Figure 6. MAPK1/3 kinase promotes ULK1 degradation through BTRC-mediated ubiquitination-proteasome pathway. (A) MDA-MB-231 cells were treated with various concentrations of U0126 for 2 h. The indicated proteins were analyzed by immunoblot (left). The ULK1 mRNA expression level was detected by qRT-PCR (right). (B) MDA-MB-231 and HS578T cells were transiently transfected with negative control or MAPK1/3 siRNA for 72 h. (C) Expression of ULK1, p-MAPK1/3 and HSPD1 protein in 27 representative human breast cancer fresh samples by immunoblot. (D) The correlation of p-MAPK1/3 with ULK1, and HSPD1 with ULK1 of 27 representative human breast cancer tissues which were plotted in (C). (E) The correlation of p-MAPK1/3 with ULK1 expression status in human breast primary cancer tissues using IHC assay. (F) Endogenous ULK1 was immunoprecipitated from MDA-MB-231 cells, followed by immunoblot using BTRC antibody and MAPK1/3 antibody. (G) HEK293T cells were transiently transfected with MAPK1/3 siRNA for 12 h, then co-transfected with indicated plasmids for another 48 h. BTRC proteins were immunoprecipitated and the bound ULK1 proteins examined by immunoblot. (H) Purified recombinant ULK1 fusion proteins were incubated with recombinant active MAPK1 and MAPK3 kinases for 0.5 h in the kinase buffer with ATP in vitro. (I) Structure of ULK1 showing the positions of two BTRC destruction box. The corresponding constructs Flag-ULK1 and BTRC binding motif mutants were also shown. (J) HEK293T cells were transfected with wild-type Flag-ULK1 plasmid, or mutant plasmids including Flag-ULK1-motif1-3A, Flag-ULK1-motif2-3A, and Flag-ULK1-6A. Then the wild-type and mutant ULK1 proteins were isolated using an anti-Flag antibody from the HEK293T cells. The isolated ULK1 proteins were incubated with recombinant active MAPK1 and MAPK3 kinases for 0.5 h in the kinase buffer with ATP in vitro. (K) HEK293T cells were co-transfected with various combinations of indicated plasmids. Immunoprecipitation analysis of phosphor-ser level of ULK1 was performed. (L) HEK293T cells were transfected with various combinations of plasmids. Exogenous ULK1 proteins were immunoprecipitated and the bound BTRC proteins examined by immunoblot. (M) HEK293T cells were co-transfected with various combinations of indicated plasmids. Immunoprecipitation analysis of exogenous ULK1 ubiquitination was performed. (N and O) The HEK293T cells transfected with the indicated Flag-ULK1 plasmids were treated with 20 μM CHX at indicated intervals and analyzed by immunoblot. Erra bars represent mean ± SEM. The P value in (A) was determined by one-way ANOVA with Dunnett’s multiple comparisons test, no adjustments were made for multiple comparisons. The P value in (E) was determined by an unpaired non-parametric Mann-Whitney test (two-sided). NS, not significance, * P < 0.05. Data were representative of three independent experiments
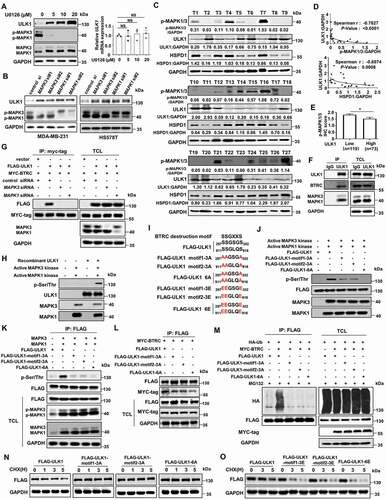
We next determined whether ULK1 was a substrate for MAPK1/3 kinase in vitro. As expected, human recombinant ULK1 was readily phosphorylated with an increased serine phosphorylation level in the presence of recombinant active MAPK1/3 kinase (). The serine (Ser, S) on the motif, which is recognized by BTRC, is usually phosphorylated by a kinase [Citation36]. We noticed that ULK1 contained two degron sequences for BTRC recognition SSGXXS at ULK1 residues 297–302 (motif 1, SSGSGS) and 911–916 (motif 2, SSGLQS). To determine whether MAPK1/3 phosphorylates ULK1 at these sites, we mutated the residues from serine (S) to alanine (A) and constructed non-phosphorylatable mutations including Flag-ULK1-motif1-3A (297AAGSGA302), Flag-ULK1-motif2-3A (911AAGLQA916), and Flag-ULK1-6A (297AAGSGA302, 911AAGLQA916). At the same time, we mutated the residues from serine (S) to glutamic acid (E) and constructed phospho-mimetic mutants including Flag-ULK1-motif1-3E (297EEGSGE302), Flag-ULK1-motif2-3E (911EEGLQE916), and Flag-ULK1-6E (297EEGSGE302, 911EEGLQE916) (). To further confirm whether MAPK1/3 directly phosphorylates ULK1 at these sites, in vitro kinase assay was performed in immunoprecipitates isolated ULK1 protein using an anti-Flag antibody from HEK293T cells that expressed wild-type Flag-ULK1 plasmid and mutant plasmids including Flag-ULK1-motif1-3A, Flag-ULK1-motif2-3A, and Flag-ULK1-6A. The result showed that the serine phosphorylation level of wild-type ULK1 protein increased significantly in the presence of recombinant active MAPK1/3 kinase, but this phosphorylation was blocked in mutant ULK1 protein in which serine was replaced by alanine (). We obtained the similar result in vivo. The serine phosphorylation level of ULK1 increased obviously when activated MAPK1/3 plasmids were transfected into HEK293T cells, but the non-phosphorylatable mutations inhibited the MAPK1/3-mediated serine phosphorylation level of ULK1 ().
Next, we detected whether MAPK1/3 phosphorylates ULK1 at these sites to trigger its BTRC interaction and degradation. We found that the BTRC interaction with ULK1 was at a significantly lower level in non-phosphorylatable ULK1 mutations transfectants than in those transfected with wild-type ULK1 (). The inability of BTRC to interact with ULK1 phosphorylation site mutants was consistent with previous findings that the phosphorylation of the motif is required for the binding of BTRC with its substrates [Citation37]. We further examined whether MAPK1/3 triggered the ubiquitination-dependent proteasomal degradation of ULK1. The result showed that the ubiquitination of wild-type ULK1 was upregulated in the presence of BTRC, whereas Ser-to-Ala mutations in ULK1 blocked this enhancement (). After CHX treatment, the degradation rate of non-phosphorylatable ULK1 mutations slowed down significantly compared to the degradation rate of wild-type ULK1 (, Figure S5C). However, the degradation rate of phospho-mimetic ULK1 mutants was more faster than that in wild-type ULK1 (, Figure S5D). Then we used a tetracycline-inducible K-rasG12V expression cell system to directly test if induction of KrasG12V expression might alter ULK1 espression. The result showed that addition of tetracycline to the culture medium induced an increased K-RAS protein and MAPK1/3 activation, as well as a decreased ULK1 expression at a concentration-dependent manner (Figure S5E). Taken together, these results suggest that MAPK1/3 activation can promote the binding of ULK1 to BTRC by phosphorylating ULK1 at multiple sites, thereby leading to the ubiquitination and degradation of ULK1.
MAP2K/MEK inhibitor trametinib reduces breast cancer bone metastasis by upregulation of ULK1
The results shown above indicate that MAPK1/3 is the upstream kinase triggering BTRC-mediated ULK1 destruction in breast cancer cells. We reasoned that upregulation of ULK1 by inhibiting MAPK1/3 activity to rescue mitophagy might be a possible therapeutic strategy for metastatic disease. To this end, we used MAP2K/MEK inhibitor trametinib to treat MDA-MB-231 cells with different mitophagy abilities. In the wild-type MDA-MB-231 cells, trametinib treatment resulted in an obvious decrease in phospho-MAPK1/3 and an accumulation of ULK1. Also, trametinib treatment significantly reduced the expression of TOMM20, HSPD1, NLRP3 and cleaved CASP1 in a concentration- and time-dependent manner (). However, there was no obvious change in the expression of TOMM20, HSPD1, NLRP3 and cleaved CASP1 after trametinib treatment in the ULK1-knockout cells, although phosphorylation of MAPK1/3 was also inhibited after trametinib treatment (). As expected, the levels of cytokines IL6 and IL1B, and the number of mature osteoclasts were coherently decreased in the wild-type MDA-MB-231 cells after trametinib treatment (). We also noted that trametinib treatment weakly increased the formation of the lipidated form of LC3-II and weakly decreased SQSTM1 in the wild-type MDA-MB-231 cells (Figure S6A-S6B).
Figure 7. Trametinib reduces bone metastasis and prolongs survival in mice by upregulation of ULK1. (A and B) The indicated MDA-MB-231 cells were treated with various concentrations of trametinib for 24 h (A) or 10 μM trametinib for the indicated periods (B) under hypoxia condition. (C and D) MDA-MB-231 WT cells were treated with various concentrations of trametinib for 24 h under hypoxic conditions. Then the CM was collected. IL1B and IL6 levels in the indicated CM were measured by ELISA(C). RAW264.7 were treated with the CM plus 20 ng/ml TNFSF11/RANKL for 7 days. Quantification of ACP5/TRAP+ osteoclasts in RAW264.7 cells (D). (E) The luciferase-tagged ULK1-knockout MDA-MB-231 cells (mixing MDA-MB-231 ULK1-KO#4 cells and MDA-MB-231 ULK1-KO#8 cells) were injected intracardially. The treatments began on day 0 after inoculation, including solvent control and trametinib. BLI images show representative mice from each experimental group (left). Normalized bone metastasis BLI signals from mice (n = 7, right). (F) Kaplan-Meier survival curve of ULK1-knockout MDA-MB-231 xenografts were calculated (n = 7). (G) The luciferase-tagged wild-type MDA-MB-231 cells were injected intracardially. The treatments began on day 0 after inoculation. BLI images showed representative mice from each experimental group (left). Normalized bone metastasis BLI signals from mice (n = 6, right). (H) Kaplan-Meier survival curve of wild-type MDA-MB-231 xenografts were calculated (n = 7). (I) MicroCT imagines from a representative mouse in each group in (G). Regions of interest for trabecular bone scan and analysis are marked by green. (J) Quantification of trabecular bone volume relative to total volume, trabecular numbers and trabecular thickness from representative micro CT scans in (G). (K) Quantification of ACP5/TRAP+ osteoclasts from decalcified histological hind limb sections in (G). (L and O) Quantitative IHC analysis of MKI67/KI-67, p-MAPK1/3, ULK1 and TOMM20 in (G). Erra bars represent mean ± SEM. The P value in (C-D) was determined by one-way analysis ANOVA with Dunnett’s multiple comparisons test, no adjustments were made for multiple comparisons. The P value in (E), (G), (J -O) was determined by a two-tailed unpaired Student’s t test. The P value in (F), (H) was assessed using the log-rank test. NS, not significant, * P< 0.05, ** P< 0.01. Data were representative of two independent experiments
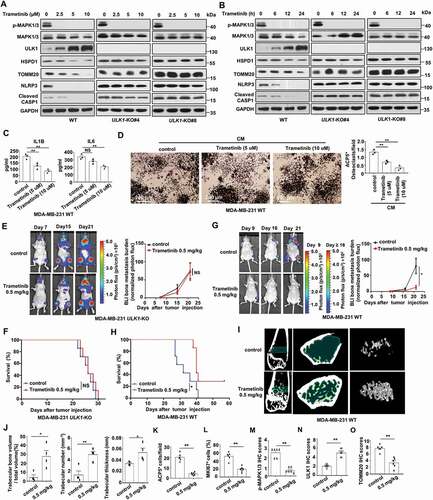
To test whether the induction of ULK1 could reduce bone metastasis, mice were intracardially inoculated with MDA-MB-231 cells and treated with trametinib. In mice with ULK1 knockout xenografts, we found there was no obvious differences in bone metastasis burden or survival after trametinib treatment (). However, in the wild-type MDA-MB-231 xenografts, trametinib treatment led to an obvious reduction in bone metastasis burden (). Importantly, the survival of trametinib-treated mice with wild-type MDA-MB-231 xenografts significantly improved (). In addition, examination by microCT revealed increased trabecular bone, including trabecular bone volume, trabecular thickness and trabecular number after trametinib treatment in the wild-type MDA-MB-231 xenografts (). Histological analysis revealed ACP5/TRAP+ osteoclasts and MKI67/KI-67+ tumor cells significantly decreased in bone metastases in the trametinib-treated wild-type MDA-MB-231 xenografts (, Figure S6C). Also, decreased phospho-MAPK1/3 staining was concomitantly accompanied by much more abundant of ULK1 staining and decreased TOMM20 staining in the wild-type MDA-MB-231 xenografts, indicating that mitophagy was induced through the upregulation of ULK1 (, Figure S6C). In additon, we demonstrated that trametinib inhibited the growth of MDA-MB-231 WT and MDA-MB-231 ULK1-knockout cells with similar potency in vitro (Figure S6D). Taken together, these results suggest that trametinib has the potential to block breast cancer bone metastasis via restoring mitophagy function by ULK1 upregulation.
Discussion
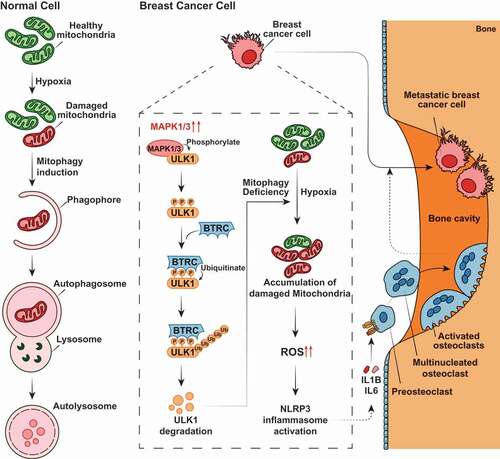
The present study provides experimental and clinical evidence to support the key role of ULK1 in breast cancer development and progression. We demonstrate that ULK1 downregulation induces an aggressive and invasive phenotype of breast cancer cells which, in this way, can metastasize at the level of the bones. This phenomenon depends on the incapability of ULK1-downregulating breast cancer cells to remove damaged, and dysfunctional mitochondria by mitophagy. As a result, this leads to a mitochondrial ROS-mediated induction of NLRP3 inflammosome causing release of pro-inflammatory cytokines that cause recruitment of osteoclasts and increase bone metastases. Additionally, we show that MAPK1/3 kinase is involved in the E3 ligase BTRC-mediated proteasome degradation of Lys48-linked ubiquitination of ULK1, which account for the deregulation of ULK1 in breast cancer. More importantly, we find that MAP2K/MEK inhibitor trametinib is sufficient to upregulate the expression of ULK1 and inhibit the activation of the NLRP3 inflammasome and reduce the release of cytokines via triggering mitophagy, thereby effectively inhibiting the incidence of bone metastasis (). These observation suggests mitophagy induction as a potential therapeutic strategy for bone metastasis.
Figure 8. Proposed model of ULK1 depletion-induced mitophagy deficiency in breast cancer bone metastasis. MAPK1/3 kinase is involved in the BTRC-mediated proteasome degradation of ULK1 in breast cancer cells. ULK1 depletion-induced mitophagy deficiency generates accumulation of abnormality mitochondria and a greater basal amount of mitochondrial ROS production at hypoxia, leads to activate the NLRP3 inflammasome, then promotes the release of soluble cytokines, such as IL1B and IL6, and renders breast cancer cells are susceptible to osteolytic bone metastasis
Autophagy play a double-faceted role in metastasis development and progression. Modulation of autophagy has been reported to induce metastases. In epithelial cells transformed with oncogenic RAS, depletion of autophagy-related genes suppresses invasion in three-dimensional culture, decreases cell motility, and reduces pulmonary metastases in vivo [Citation38]. Autophagy promotes focal adhesion disassembly and cell motility of metastatic tumor cells through the direct interaction of paxillin with LC3 [Citation39]. Autophagy inhibition delays 4T1 cells spontaneous metastatic development if administered in the early stages [Citation40]. In contrast, autophagy has also been reported to limit metastasis. Autophagy deficiency elicits a pro-metastatic basal tumor cell subpopulation by NBR1 accumulation, and enforced autophagy induction prevents the outgrowth of disseminated tumor cells [Citation35]. Mitophagy, as well as autophagy, has a complex and highly context-dependent role in tumor cells invasion and metastasis. Whether mitophagy is executing to promote or to limit tumorigenesis leads to a novel challenge when targeting mitophagy for cancer therapies [Citation41]. However, there is increasing evidence that ablation of mitophagy accelerates tumorigenesis. For instance, mitophagy regulator Parkin is a tumor suppressor gene that is deleted in many human cancers [Citation42]. BRCA1 deficiency impairs stress-induced mitophagy through blocking AMPK-DNM1L/DRP1-mediated mitochondrial fission and triggers NLRP3 inflammasome activation, which creates a tumor-associated microenvironment, thereby facilitating tumor proliferation and metastasis [Citation43]. Mitophagy defects arising from the mitophagy mediator BNip3 loss promotes MMTV-PyMT mammary tumor progression to metastasis via accelerating accumulation of dysfunctional mitochondria and resultant excess ROS production [Citation44]. Loss of Bnip3 in the KC (LSL-KRASG12D; PDX1-Cre) mouse model of PDAC results in reduced tumor latency and increase progression to metastasis [Citation45]. In this study, we found loss of ULK1 in breast cancer cells induced mitophagy deficiency under hypoxia, which promoted the migration and invasion phenotype of breast cancer cells, and promoted the onset of breast cancer bone metastasis and drived the development of osteoclastic lesions. Our result showed that ULK1 depletion-mediated mitophagy deficiency at hypoxia led to the dysfunctional mitochondria accumulation and caused a greater basal amount of mitochondrial ROS production, which resulted in NLRP3 inflammasome activation to secret soluble cytokines. We also demonstrated that mitophagy deficiency-induced NLRP3 inflammasome activation promoted breast cancer osteolytic bone metastasis, as NLRP3 inhibitor MCC950 or ROS scavenger NAC clearly decreased ULK1 deficiency-induced bone metastasis and prolonged mouse survival. Although oncogenic Kras has been reported to induce Nix-mediated mitophagy to promote pancreatic cancer, Kras-Nix initiates mitophagy program to reduce pools of functional mitochondria to promote development of PDAC from PanIN lesions in Kras-mutant pancreatic mouse model [Citation27]. All of these studies support the notion that dysfunctional mitochondria accumulation or normal functional mitochondria clearance is the determinant of whether mitophagy promotes or inhibits tumorigenesis.
An increasing number of approaches are currently being developed to induce tumor regression via mitophagy. For instance, the lis/lin/GO (glucose oxidase) killer-suicide system has been recognized as a powerful mitophagy-inducing system in vitro and in vivo to eradicate human malignant tumors [Citation46]. Ultrasound treatment in the presence of curcumin has been reported to significantly initiate mitophagy in CNE2 cells, which leads to cell death in nasopharyngeal carcinoma cells [Citation47]. In this study, we propose that inducing mitophagy by upregulation of ULK1 might be a possible therapeutic strategy for breast cancer bone metastasis. The mechanism of ULK1 regulation in cancer is very complicated. Our data presented here provide evidence for a novel molecular mechanism for ULK1 regulation. We discover that MAPK1/3 kinase is involved in the BTRC-mediated proteasome degradation of ULK1 in breast cancer. We demonstrated that the ULK1 protein contains two suboptimal BTRC degron sequences that were phosphorylated by MAPK1/3. More interestingly, sequential inactivation of the potentially critical Ser/Thr sites for suboptimal degrons in ULK1 through mutation of residues from serine to alanine resulted in a progressive reduction in MAPK1/3-mediated phosphorylation, which correlated well with the reduced interaction of ULK1 with BTRC and reduced K48-linked ubiquitination of ULK1. Therefore, the change in ULK1 level may be achieved by inactivation of its modifying enzyme, MAPK1/3 kinase. As expected, trametinib, a specific inhibitor of the MAP2K/MEK-MAPK1/3 pathway that is FDA-approved to treat metastatic melanoma carrying the BRAF V600E mutation, effectively restricted breast cancer bone metastasis and prolonged mouse survival in mice bearing a wild-type ULK1 breast cancer xenograft, not in mice bearing ULK1 knockout breast cancer xenografts. More importantly, we also observed a negative correlation between MAPK1/3 activation with ULK1 expression in breast primary cancer tissues. As RAF-MAP2K/MEK- MAPK1/3 signaling is activated in breast cancer patients, especially in TNBC [Citation48], the prevalent downregulation of ULK1 in breast cancer provides a rationale for using MAP2K/MEK-MAPK1/3 pathway inhibitors to treat breast cancer bone metastasis.
In conclusion, we propose a model in which MAPK1/3 kinase-dependent ULK1 degradation promotes inflammasome-mediated osteoclastic activation and breast cancer bone metastases due to mitophagy defects. We also provide strong pre-clinical evidence for the use of MAP2K/MEK-MAPK1/3 pathway inhibitors to disrupt the MAPK1/3 kinase-involved ULK1 degradation and induce mitophagy as an effective strategy for bone metastasis therapy, especially in cancers displaying low levels of ULK1.
Materials and methods
Cell culture and compounds
Human MDA-MB-231, HS578T, HEK293, mouse mammary carcinoma 4T1 and mouse pre-osteoclast RAW264.7 cell lines were maintained in Dulbecco’s modified Eagle’s medium (DMEM) supplemented with 10% fetal bovine serum (FBS; Gibco, 10270–106) at 37°C under 5% CO2. The HEK293 cell line with stable tetracycline-inducible KRASG12V expression was kindly provided by Professor Peng Huang from Sun Yat-sen University Cancer Center [Citation49]. The cells were authenticated using DNA fingerprinting short-tandem repeat (STR) assays and confirmed to be free of bacterial and viral contaminations. Hypoxic conditions were achieved with a hypoxic chamber (Advanced Instruments, AJ9025) flushed with a pre-analyzed gas mixture of 1% O2, 5% CO2, and 94% N2. Compounds U0126 (S1102), Trametinib (S2673), and MCC950 (S7809) were obtained from Selleck Chemical. NAC (A7250) was obtained from Sigma-Aldrich. Human recombinant IL1B/IL-1β protein (10139-HNAE-5) and human recombinant IL6 protein (10395-HNAE-5) were from Sino Biological.
Plasmids
Human and mouse full-length ULK1 cDNA (with fused C-terminal FLAG tag) were subcloned into PCDH-CMV-MCS-EF1 vector (System Biosciences, CD510B-1) and pcDAN3.1 (Invitrogen, V79020). The pBABE-EGFP-mCherry-LC3B (deposited by Jayanta Debnath, 22418) plasmid was obtained from Addgene [Citation50]. Using the pBABE-EGFP-mCherry-LC3B plasmid as a template, we generated mitochondrially-targeted tandem pBabe-EGFP‐mCherry‐FIS1101‐152 plasmid. HA-Ub plasmid (Addgene, 18712) was deposited by Edward Yeh [Citation51]. Using the human pcDAN3-Flag-ULK1 expression vector as a template, several mutant plasmids including Flag-ULK1-motif1-3A (297AAGSGA302), Flag-ULK1-motif2-3A (911AAGL QA916), Flag-ULK1-6A (297AAGSGA302, 911AAGLQA916), Flag-ULK1-motif1-3E (297EEGS GE302), Flag-ULK1-motif2-3E (911EEGLQE916), and Flag-ULK1-6E (297EEGSGE302, 911EEGLQE916) were developed by performing a site-directed mutagenesis. All plasmids were generated by using the ClonExpress II One Step Cloning Kit (C112-01) and ClonExpress Multis One Step Cloning Kit (C113-01) from Vazyme, and all plasmids were verified by DNA sequencing.
CRISPR–Cas9-mediated gene disruption
For CRISPR-Cas9-mediated ULK1 knockout, human ULK1 CRISPR-Cas9 KO (Santa Cruz Biotechnology, sc-400516) and mouse Ulk1 CRISPR-Cas9 KO (Santa Cruz Biotechnology, sc-423606) plasmids were transfected into cells using Lipofectamine 2000 (Invitrogen, 11668019) according to the manufacturer’s instruction [Citation19]. After 48 h, GFP-positive cells were dissociated by flow cytometry and seeded at subcloning density. ULK1-knockout clones (MDA-MB-231 ULK1-KO#4, MDA-MB-231 ULK1-KO#8, 4T1 Ulk1-KO#1 and 4T1 Ulk1-KO#3) were isolated by single-cell dilution cloning from polyclonal sgRNA-transduced populations. Knockout clones were identified by immunoblot for ULK1 and sequencing. Control CRISPR-Cas9 plasmid (Santa Cruz Biotechnology, sc-418922) was used as a negative control.
Generation of stable cells using lentiviral infection
For restoration of ULK1 expression, packaging plasmids were co-transfected with PCDH-Flag-ULK1 into HEK293T cells, and viral particles were harvested at 48 h post-transfection. ULK1-knockout clones were infected with viruses for 24 h in the presence of polybrene (8 μg/ml; Sigma-Aldrich, H9268), and stable cells were subsequently selected using G418 (Merck Millipore, 345,810) for 7 days. Overexpression of ULK1 in stable cells were validated by immunoblot.
For stable shRNA-mediated ULK1 knockdown, lentiviral PLKO1-ULK1 shRNA plasmid (TRCN0000000835) was obtained from Sigma-Aldrich. An empty vector PLKO1 (Sigma-Aldrich, SHC001) expressed a scrambled control shRNA was used as a negative control. For lentiviral infection, packaging plasmids were co-transfected with PLKO1-ULK1 shRNA into HEK293T cells, and viral particles were harvested at 48 h post-transfection. Tumor cells were infected with viruses for 24 h in the presence of polybrene (8 μg/ml), and stable cells were subsequently selected by puromycin for 3 days. Knockdown of ULK1 in stable cells were validated by immunoblot.
Cell migration and invasion assay
Assays were performed in 24-well Boyden chambers (FALCON, 353,097) Transwell inserts (8 μm pore size) coated with growth factor reduced matrigel (BD BioCoat, 354,234) for invasion assays. Tumor cells were seeded inside transwell inserts containing 200 ul culture media without FBS . As a chemoattractant, 600 ul culture media containing 10% FBS was placed in the lower chamber. After 18–24 h, cells that translocated to the lower surface of filters were fixed in 4% formaldehyde, stained with 0.1% crystal violet solution, and counted using a light microscope.
Immunoblot and immunoprecipitation
For immunoblot, cells were harvested and lysed in 1× cell lysis buffer (Cell Signaling Technology, 9803) adding 1 mM phenylmethanesulfonyl fluoride immediately before use as previously described [Citation52]. A volume of 25–50 ug of total proteins was separated by SDS-PAGE transferred to PVDF membrane. After incubated with primary antibodies, membranes were incubated with horseradish peroxidase (HRP)-conjugated secondary antibody for 1 h and chemiluminescence signals were detected by ECL substrate (Bio-Rad, 1,705,061).
For immunoprecipitation, cells were collected and lysed in Pierce IP Lysis Buffer (Thermo Fisher Scientific, 87,787) supplemented with Complete Protease Inhibitor Cocktail (Sigma-Aldrich, 11,697,498,001). After preclearing with Pierce™ protein A/G agarose (Thermo Fisher Scientific, 20,421) beads for 1 h at 4°C, whole-cell lysates were used for immunoprecipitation with the indicated antibodies. Generally, 1–4 μg of commercial antibody was added to 1 mg of cell lysate, and the mixture was incubated at 4°C for overnight. After adding protein A/G agarose beads, the incubation was continued for 1 h. Immunocomplexes were extensively washed four times with IP Lysis Buffer, heated to 95°C for 3 min and separated by SDS-PAGE [Citation53]. Quantification of western blots was performed using ImageJ software. All of the antibodies in the study were bought commercially. The antibodies including HSPD1/HSP60 (4870), HA-tag (2367), ULK1 (8054), MAPK/ERK1-ERK2/p42-p44 (4695), NLRP3 (15,101), HIF1A/HIF-1α (14,179), CASP1 (2225), cleaved CASP1 (4199), GAPDH (5174), SKP2 (4358), MYC-tag (2276), NBR1(9891), anti-mouse IgG, HRP-linked (7076), and anti-rabbit IgG, HRP-linked (7074) were purchased from Cell Signaling Technology. The antibodies including TOMM20 (sc-17,764), p-MAPK/ERK (sc- 7383), BTRC/β-TrCP (sc-33,213), and SQSTM1 (sc-28,359) were purchased from Santa Cruz Biotechnology. The antibodies including p-Ser/Thr (ab17464), FBXW7 (ab74054) were purchased from Abcam. Anti-MAP1LC3B (NB100-2220) antibody was obtained from Novus. Anti-CDH1 (CC43) was obtained from EMD Millipore. Anti-FLAG (F1804) was obtained from Sigma Aldrich.
Quantitative real-time PCR
Total RNA was isolated by using a HiPure Universal RNA Mini Kit (Magen R4130-03), and reverse transcription was performed using a PrimeScript™ RT Reagent Kit with gDNA Eraser (RR047D, Takara) as previously described [Citation54]. qRT-PCR was conducted using ChamQ SYBR qPCR Green Master Mix (Vazyme Biotech Co., Q311-03), and run with a Light Cycler 480 instrument (Roche Diagnostics). The relative amount of target gene mRNA was normalized to GAPDH. For mtDNA measurement, total DNA was extracted from cells using TIANamp Genomic DNA kit (TIANGEN, DP304-03). The relative mtDNA was determined using qRT-PCR and normalized to Rn18s RNA. All qRT-PCR reactions were done in triplicate. The primers used were as described in Table S2.
SiRNA transfection
For siRNA transfection, the cells were seeded into six-well paltes the day before transfection. Transfection of siRNA was performed with lipofectamine RNAimax (Invitrogen, 13,778,150) according to the manufacturer’s instruction. 48–72 hours after the transfection, the cells were collected for further experiment. Oligonucleotide sequence of siRNAs were as described in Table S3.
Detection of tumor-derived cytokines using antibody arrays
To exclude the effect of cytokines in serum, the indicated MDA-MB-231 cells were serum-starved overnight. Then the tumor cells were cultured in serum-free medium under hypoxia condition (1% O2) for 24 h. The CM was collected and passed through a 0.22 μm filter (Merck Millipore, SLGPR33RB). Human Inflammation Antibody Array kit (RayBiotech, AAH-INF-3) was used according to the manufacturer’s instructions as previously described. Briefly, the arrays were blocked, incubated with 100 μL of CM overnight, then incubated with biotin-conjugated antibodies overnight and with HRP-linked secondary antibody for 2 h. The membranes were incubated with chemiluminescent substrate and exposed to x-ray film for 10–15 min. Quantitative array analysis was performed using RAYBIO® Analysis Tool (RayBiotech).
ELISA
Quantitative levels of human IL1B and IL6 in the conditioned media of cultured cells and mouse serum IL1B and IL6 were determined in triplicate by ELISA according to the manufacturer’s protocol. Human IL1B/IL-1β ELISA kits (R&D Systems, VAL101) and Human IL6/IL-6 ELISA kits (Sino Biological, KIT10395A) were bought commercially.
Chemotaxis assay of RAW264.7 cells
Chemotaxis assay was performed as described with the following modifications: 105 RAW264.7 cells in 200 μl DMEM were seeded into the upper chamber of 8 μm pore transwell inserts (FALCON, 353097) in a 24-well plate [Citation55]. As a chemoattractant, 600 μl of tumor cells in culture media containing 10% FBS was placed in the lower chamber. After 24 h in culture, 4% formaldehyde was added to the bottom chamber to fix RAW264.7 cells. Cells in the upper chamber were removed with a cotton swab, stained for 30 mins in 0.1% crystal violet and counted using a light microscope.
Osteoclast differentiation assays
For detecting the effect of tumor-derived cytokines on osteoclast differentiation, the tumor cells were serum-starved overnight. Then the tumor cells with various treatments were cultured in serum-free medium under hypoxia condition (1% O2) for 24 h. The CM was collected and passed through a 0.2 μm filter. RAW 264.7 cells were seeded at a density of 2 × 10⁴ cells/well in 24-well plates in triplicate and treated with CM plus 3% FBS in the presence of 20 ng/ml TNFSF11/RANKL (PeproTech, 315–11 C). The media was replaced with fresh CM daily. Cells were ACP5/TRAP stained on day 8 using a leukocyte acid phosphatase kit (Sigma-Aldrich, 387A) and ACP5/TRAP+-multineucliated cells were quantified as mature osteoclasts.
In Vitro kinase assay
Human recombinant ULK1 (TP315643, OriGene) was incubated with or without (negative controls) human recombinant activated MAPK3/ERK1 (Merck Millipore, 14–439) and MAPK1/ERK2 kinase (Merck Millipore, 14–550) in the 1× kinase buffer (Cell Signaling Technology, 9802) supplemented with 200 µM cold ATP (Cell Signaling Technology, 9804) for 30 min at 30°C. The reaction of recombinant active MAPK3/ERK1 and MAPK1/ERK2 kinase without substrate was carried out under the same condition as another negative control. Kinase Assay was stopped by 20 μL 3 × SDS sample buffer. The serine phosphorylation level of ULK1 was measured by the indicated antibody.
Fluorescence microscopy
The cells were transiently transfected with pcDNA3-GFP-LC3 plasmid for 48 h, then incubated for 30 min at 37°C with MitoTracker Deep Red (100 nM; Invitrogen, M22426) and then were fixed with 4% PFA for 10 min, and then permeabilized in 0.25% Triton X-100 (Sigma-Aldrich, T8787) for 10 min. After washing with PBS for 3 times, the cells were developed with DAPI. Confocal images were examined using a microscope (Zeiss). Colocalization study was performed using ImageJ software (National Institutes of Health).
Flow cytometry
For assess mitophagy flux by flow cytometry, cells were trypsinized for 5 min at 37°C and resuspended in complete medium with 10 nM MitoTracker Deep Red, and then incubated for 15 min at 37°C. For measurement of mitochondrial mass, cells were stained for 15 min at 37°C with 25 nM MitoTracker Green FM (Invitrogen, M7514), a probe that stains mitochondrial membrane lipids independently of membrane potential. For measurement of mitochondrial ROS, cells were stained for 15 min at 37°C with 5 μM MitoSOX (Invitrogen, M36008), a fluorogenic dye targeted to mitochondria that produces red fluorescence after oxidation by superoxide. Cells were washed with PBS, treated with trypsin and resuspended in PBS containing 1% (vol:vol) heat-inactivated FBS. All flow cytometry analysis was conducted on Gallios (Beckman) and the data was analyzed using FlowJo software according to manufacturers’ instructions.
Seahorse XFe96 metabolic flux analysis
Oxygen consumption rates (OCR) for cells were determined using the Seahorse Extracellular Flux (XFe96) analyzer (Seahorse Bioscience). The indicated MDA-MB-231 cells were seeded into XFe 96-well cell culture plates. For OCR, cells were washed in XF assay media (Seahorse Bioscience, 102,353–100) supplemented with pre-warmed 10 mM glucose, 1 mM pyruvate (Sigma, S8636), 2 mM L-glutamine (Sigma, G8540) adjusted to pH 7.4. Cells were then kept in 175 µL/well of XF assay media at 37°C, in a non-CO2 incubator for 1 h. During the cell incubation time, oligomycin (ATP synthetase inhibitor; Seahorse Bioscience, 103,015–100), FCCP (uncoupling agent; Seahorse Bioscience, 103,015–100), and rotenone &antimycin A (electron transport chain inhibitors; Seahorse Bioscience, 103,015–100) in XF assay media were loaded into the injection ports in the XFe96 sensor cartridge. Data sets were analyzed by XFe96 software and GraphPad Prism software. The experiment was performed 3 replicates in each experiment. Calculations from the mitochondrial stress test as follows: non-mitochondrial respiration = oxygen consumed after treatment with electron transport chain inhibitors (rotenone and antimycin A). Basal OCR = baseline OCR minus non-mitochondrial respiration. ATP production = baseline OCR minus OCR after ATP synthetase inhibitor (oligomycin). Spare capacity = max OCR minus baseline OCR. Proton leak = OCR after oligomycin treatment minus OCR with electron transport chain inhibitors (rotenone and antimycin A) [Citation28,Citation56].
Tumor xenografts and bioluminescence analysis
Female BALB/c nude mice were obtained from Sun Yat-sen University, Guangzhou and were 6- to 8-wk-old. All procedures involving mice and experimental protocols were approved by Institutional Animal Care and Use Committee (IACUC) of Sun Yat-sen University Cancer Center. For bone metastasis studies, 1 ~ 3x10⁵ luciferase-tagged tumor cells were injected into the left cardiac ventricle of anesthetized female nude mice. Development of bone metastases was monitored by measuring photon flux of BLI signals in the hindlimbs of mice after intraperitoneal injection of 75 mg/kg D-Luciferin (PerkinElmer, 122,799). Bioluminescence images were acquired with the IVIS Imaging System (Xenogen) at 2–5 min after injection. BLI signal data were acquired after background subtraction. Data were normalized to the signal obtained immediately after xenografting (day 0) [Citation55]. To determine the therapeutic effect of MCC950 or NAC on metastasis, mice were randomly assigned to three groups based on BLI signals obtained immediately after xenografting. The treatments began on day 0 after inoculation. MCC950 was administered i.p. (20 mg/kg) every day for the first 3 days and every second day for the next days, and 60 mM of NAC diluted in drinking water was administered everyday. Normal saline (NS) was intraperitoneally injected into mice as the negative control. To determine the therapeutic effect of trametinib on metastasis, mice were randomly assigned to two groups based on BLI signals obtained immediately after xenografting. The treatments began on day 0 after inoculation. Daily intragastric administration of trametinib (0.5 mg/kg) was given, with intragastric administration of solvent for the control group.
Histomorphometric analysis and immunohistochemical (IHC) staining
Hind limb bones were excised from mice at the endpoint of each experiment, and tumor-bearing hind limb bones were fixed in 10% neutral-buffered formalin, decalcified in 10% EDTA for 2 weeks, and embedded in paraffin for hematoxylin and eosin (H&E), ACP5/TRAP staining or IHC staining. Histomorphometric analysis was performed on H&E stained bone metastasis sections. Immunohistochemical analysis was performed with antibody aganist TOMM20 (Santa Cruz Biotechnology, sc-17,764), MKI67/KI-67 (2642–1, Epitomics), HIF1A (Santa Cruz Biotechnology, sc-13,515), ULK1(GTX80551, Genetex), and phospho-MAPK/ERK1-ERK2/p42-p44 (Thr202/Tyr204, 20G11; Cell Signaling Technology, 4376). Briefly, sections were submerged into EDTA antigenic retrieval buffer (pH 8.0) or citrate buffer (pH 6.0), and microwaved for antigenic retrieval. Then the slides were incubated with the primary antibody for 2 h, then treated with HRP polymer-conjugated secondary antibody ZSGB-Bio, PV-6001) for 30 min and developed with diamino-benzidine solution (ZSGB-Bio, ZLI-9017). Nuclei were counterstained with hematoxylin. Image acquisition was performed using a Nikon camera and software. For evaluation of TOMM20 and ULK1 staining, we adopted a staining index by multiplying the score for the percentage of positive cells by the intensity score (values 0–12) described previously, which obtained as the intensity of positive staining (0, no staining; 1, weak; 2, moderate; 3, strong and the percentage of positive cells (0, 0%; 1, 1–10%; 2, 11–50%; 3, 51–70%; 4, 71–100%). ACP5/TRAP staining was performed by using a leukocyte acid phosphatase kit (Sigma-Aldrich, 387A). Osteoclast number was assessed as multinucleated ACP5/TRAP+ cells and reported as number/field [Citation55].
Micro-CT imaging of tibia
Legs were removed from euthanized mice, bones were dissected free of tissue and fixed in 4% paraformaldehyde solution. Fixed bones were scanned on a micro-CT system (Siemens Inveon) at 80 kV using a detection voxel size of 9 μm. The scanned images were reconstructed using COBRA OSD3D and analyzed using Multimodal 3D Visualization software. A standard trabecular volume of interest was chosen starting 0.5 mm from the growth plate and included all trabeculae in a 1.2 mm3 region of bone. Trabecular volume and number were assessed in this region.
Human breast tumor tissue samples and immunohistochemical assay
To elucidate in vivo connections to MAPK1/3 activation-mediated regulation of ULK1 levels and mitophagy, 27 fresh human breast cancer tumors were lysed for immunoblotting. To elucidate the correlation of p-MAPK1/3 with ULK1 expression status, the IHC detection of the ULK1 and phospho-MAPK/ERK1-ERK2/p42-p44 (Thr202/Tyr204, 20G11; Cell Signaling Technology, 4376) were performed in 192 paraffin-embedded human breast primary cancer samples as described [Citation20]. Measurements of ULK1 and phospho-MAPK/ERK immunoreactivity levels were performed as previously described [Citation20,Citation57]. All of these specimens were obtained following the guidelines approved by the Sun Yat-sen University Cancer.
Autophagic flux and mitophagic flux assay
For autophagic flux assay, MDA-MB-231 cells were retrovirally infected with pBABE-EGFP-mCherry-LC3B reporter. For mitophagic flux assay, MDA-MB-231 cells were retrovirally infected with pBabe-mCherry-EGFP-FIS1101‐152 reporter. After treatment, the indicated cells were analyzed by flow cytometry on a Beckman Cytoflex. The reporters allowed us to monitor the autophagic flux or mitophagic flux by analyzing 2 fluorenscent proteins. The median derived mCherry:EGFP ratio parameter was compared between samples [Citation27,Citation30].
Statistical analysis
Statistical analysis were conducted using GraphPad Prism software (8.0 version) and SPSS software (version 20). The results are presented as the mean±SEM was analyzed by a unpaired Student’s t test, or one-way ANOVA with Dunnett’s multiple comparisons test or one-way ANOVA with Tukey’s multiple comparisons test by GraphPad Prism software. Correlations were determined by Spearman correlation analysis. Survival curves were assessed using the log-rank test. For Gene Set Enrichment Analysis (GSEA), the JavaGSEA Desktop Application was downloaded from . All the statistical tests were two-sided, P < 0.05 was considered statistically significant.
Supplemental Material
Download MS Word (48.3 MB)Acknowledgments
We thank Prof. Peng Huang (Sun Yat-sen University Cancer Center) for providing helpful and intensive discussions. Prof. Tiebang Kang (Sun Yat-sen University Cancer Center) for providing MYC-tagged BTRC and MYC-tagged BTRC-ΔF plasmids.
Disclosure statement
No potential conflicts of interest are disclosed.
Supplementary material
Supplemental data for this article can be accessed here.
Additional information
Funding
References
- Xu Y, Shen J, Ran Z. Emerging views of mitophagy in immunity and autoimmune diseases. Autophagy. 2020 Jan;16(1):3–17.
- Vo MT, Smith BJ, Nicholas J, et al. Activation of NIX-mediated mitophagy by an interferon regulatory factor homologue of human herpesvirus. Nat Commun. 2019 Jul 19;10(1):3203.
- Thangaraj A, Periyasamy P, Guo ML, et al. Mitigation of cocaine-mediated mitochondrial damage, defective mitophagy and microglial activation by superoxide dismutase mimetics. Autophagy. 2020 Feb;16(2):289–312.
- Han S, Jeong YY, Sheshadri P, et al. Mitophagy coordination with retrograde transport ensures the integrity of synaptic mitochondria. Autophagy. 2020 Oct;16(10):1925–1927.
- Elswood J, Pearson SJ, Payne HR, et al. Autophagy regulates functional differentiation of mammary epithelial cells. Autophagy. 2020 Feb;5:1–19.
- Lou G, Palikaras K, Lautrup S, et al. Mitophagy and Neuroprotection. Trends Mol Med. 2020 Jan;26(1):8–20.
- Bernardini JP, Lazarou M, Dewson G. Parkin and mitophagy in cancer. Oncogene. 2017 Mar;36(10):1315–1327.
- Chiu HY, Tay EXY, Ong DST, et al. Mitochondrial dysfunction at the center of cancer therapy. Antioxid Redox Signal. 2020 Feb 10;32(5):309–330.
- Lu H, Li G, Liu L, et al. Regulation and function of mitophagy in development and cancer. Autophagy. 2013 Nov 01;9(11):1720–1736.
- Kuroyanagi H, Yan J, Seki N, et al. Human ULK1, a novel serine/threonine kinase related to UNC-51 kinase of Caenorhabditis elegans: cDNA cloning, expression, and chromosomal assignment. Genomics. 1998 Jul 1;51(1):76–85.
- Mizushima N. The role of the Atg1/ULK1 complex in autophagy regulation. Curr Opin Cell Biol. 2010 Apr;22(2):132–139.
- Shang L, Wang X. AMPK and mTOR coordinate the regulation of Ulk1 and mammalian autophagy initiation. Autophagy. 2011 Aug;7(8):924–926.
- Wu W, Tian W, Hu Z, et al. ULK1 translocates to mitochondria and phosphorylates FUNDC1 to regulate mitophagy. EMBO Rep. 2014 May;15(5):566–575.
- Egan DF, Shackelford DB, Mihaylova MM, et al. Phosphorylation of ULK1 (hATG1) by AMP-activated protein kinase connects energy sensing to mitophagy. Science. 2011 Jan 28;331(6016):456–461.
- Lupfer C, Thomas PG, Anand PK, et al. Receptor interacting protein kinase 2-mediated mitophagy regulates inflammasome activation during virus infection. Nat Immunol. 2013 May;14(5):480–488.
- Zhang W, Bado I, Wang H, et al. Bone metastasis: find your niche and fit in. Trends Cancer. 2019 Feb;5(2):95–110.
- Deng R, Huang J-H, Wang Y, et al. Disruption of super-enhancer-driven tumor suppressor gene RCAN1.4 expression promotes the malignancy of breast carcinoma. Mol Cancer. 2020;19(1). DOI:https://doi.org/10.1186/s12943-020-01236-z
- Liang XH, Jackson S, Seaman M, et al. Induction of autophagy and inhibition of tumorigenesis by beclin 1. Nature. 1999 Dec 09;402(6762):672–676.
- Li ZL, Zhang HL, Huang Y, et al. Autophagy deficiency promotes triple-negative breast cancer resistance to T cell-mediated cytotoxicity by blocking tenascin-C degradation. Nat Commun. 2020 Jul 30;11(1):3806.
- Tang J, Deng R, Luo RZ, et al. Low expression of ULK1 is associated with operable breast cancer progression and is an adverse prognostic marker of survival for patients. Breast Cancer Res Treat. 2012 Jul;134(2):549–560.
- Mao L, Zhan YY, Wu B, et al. ULK1 phosphorylates Exo70 to suppress breast cancer metastasis. Nat Commun. 2020 Jan 8;11(1):117.
- Towers CG, Fitzwalter BE, Regan D, et al. Cancer cells upregulate NRF2 signaling to adapt to autophagy inhibition. Dev Cell. 2019 Sep 23;50(6):690–703 e6.
- Sethi N, Dai X, Winter CG, et al. Tumor-derived JAGGED1 promotes osteolytic bone metastasis of breast cancer by engaging notch signaling in bone cells. Cancer Cell. 2011 Feb 15;19(2):192–205.
- Mourskaia AA, Amir E, Dong Z, et al. ABCC5 supports osteoclast formation and promotes breast cancer metastasis to bone. BCR. 2012 Nov 22;14(6):R149.
- Diot A, Hinks-Roberts A, Lodge T, et al. A novel quantitative assay of mitophagy: combining high content fluorescence microscopy and mitochondrial DNA load to quantify mitophagy and identify novel pharmacological tools against pathogenic heteroplasmic mtDNA. Pharmacol Res. 2015 Oct;100:24–35.
- Mauro-Lizcano M, Esteban-Martinez L, Seco E, et al. New method to assess mitophagy flux by flow cytometry. Autophagy. 2015;11(5):833–843.
- Humpton TJ, Alagesan B, DeNicola GM, et al. Oncogenic KRAS induces NIX-mediated mitophagy to promote pancreatic cancer. Cancer Discov. 2019 Sep;9(9):1268–1287.
- Jiao L, Zhang HL, Li DD, et al. Regulation of glycolytic metabolism by autophagy in liver cancer involves selective autophagic degradation of HK2 (hexokinase 2). Autophagy. 2018;14(4):671–684.
- Um JH, Kim YY, Finkel T, et al. Sensitive Measurement of Mitophagy by Flow Cytometry Using the pH-dependent Fluorescent Reporter mt-Keima. Journal of visualized experiments: JoVE. 2018 Aug;12(138):58099.
- Gump JM, Thorburn A. Sorting cells for basal and induced autophagic flux by quantitative ratiometric flow cytometry. Autophagy. 2014 Jul;10(7):1327–1334.
- Weilbaecher KN, Guise TA, McCauley LK. Cancer to bone: a fatal attraction. Nat Rev Cancer. 2011 Jun;11(6):411–425.
- Zhou R, Yazdi AS, Menu P, et al. A role for mitochondria in NLRP3 inflammasome activation. Nature. 2011 Jan 13;469(7329):221–225.
- Keller ET, Brown J. Prostate cancer bone metastases promote both osteolytic and osteoblastic activity. J Cell Biochem. 2004 Mar 01;91(4):718–729.
- Wu H, Wang Y, Li W, et al. Deficiency of mitophagy receptor FUNDC1 impairs mitochondrial quality and aggravates dietary-induced obesity and metabolic syndrome. Autophagy. 2019 Nov;15(11):1882–1898.
- Marsh T, Kenific CM, Suresh D, et al. Autophagic degradation of NBR1 restricts metastatic outgrowth during mammary tumor progression. Dev Cell. 2020 Mar 9;52(5):591–604 e6.
- Inuzuka H, Tseng A, Gao D, et al. Phosphorylation by casein kinase I promotes the turnover of the Mdm2 oncoprotein via the SCF(beta-TRCP) ubiquitin ligase. Cancer Cell. 2010 Aug 9;18(2):147–159.
- Zhou BP, Deng J, Xia W, et al. Dual regulation of Snail by GSK-3beta-mediated phosphorylation in control of epithelial-mesenchymal transition. Nat Cell Biol. 2004 Oct;6(10):931–940.
- Lock R, Kenific CM, Leidal AM, et al. Autophagy-dependent production of secreted factors facilitates oncogenic RAS-driven invasion. Cancer Discov. 2014 Apr;4(4):466–479.
- Sharifi MN, Mowers EE, Drake LE, et al. Autophagy promotes focal adhesion disassembly and cell motility of metastatic tumor cells through the direct interaction of paxillin with LC3. Cell Rep. 2016 May 24;15(8):1660–1672.
- Barnard RA, Regan DP, Hansen RJ, et al. Autophagy inhibition delays early but not late-stage metastatic disease. J Pharmacol Exp Ther. 2016 Aug;358(2):282–293.
- Chourasia AH, Boland ML, Macleod KF. Mitophagy and cancer. Cancer Metab. 2015;3:4.
- Xu L, Lin DC, Yin D, et al. An emerging role of PARK2 in cancer. J Mol Med. 2014 Jan;92(1):31–42.
- Chen Q, Lei JH, Bao J, et al. BRCA1 deficiency impairs mitophagy and promotes inflammasome activation and mammary tumor metastasis. Adv Sci (Weinh). 2020 Mar;7(6):1903616.
- Chourasia AH, Tracy K, Frankenberger C, et al. Mitophagy defects arising from BNip3 loss promote mammary tumor progression to metastasis. EMBO Rep. 2015 Sep;16(9):1145–1163.
- Macleod KF. Mitophagy and mitochondrial dysfunction in cancer. Ann Rev Cancer Biol. 2020;4(1):41–60.
- Gargini R, Garcia-Escudero V, Izquierdo M. Therapy mediated by mitophagy abrogates tumor progression. Autophagy. 2011 May;7(5):466–476.
- Wang X, Leung AW, Luo J, et al. TEM observation of ultrasound-induced mitophagy in nasopharyngeal carcinoma cells in the presence of curcumin. Exp Ther Med. 2012 Jan;3(1):146–148.
- Duncan JS, Whittle MC, Nakamura K, et al. Dynamic reprogramming of the kinome in response to targeted MEK inhibition in triple-negative breast cancer. Cell. 2012 Apr 13;149(2):307–321.
- Hu Y, Lu W, Chen G, et al. K-ras(G12V) transformation leads to mitochondrial dysfunction and a metabolic switch from oxidative phosphorylation to glycolysis. Cell Res. 2012 Feb;22(2):399–412.
- N’Diaye EN, Kajihara KK, Hsieh I, et al. PLIC proteins or ubiquilins regulate autophagy-dependent cell survival during nutrient starvation. EMBO Rep. 2009 Feb;10(2):173–179.
- Kamitani T, Kito K, Nguyen HP, et al. Characterization of NEDD8, a developmentally down-regulated ubiquitin-like protein. J Biol Chem. 1997 Nov 7;272(45):28557–28562.
- Wu RY, Kong PF, Xia LP, et al. Regorafenib promotes antitumor immunity via inhibiting PD-L1 and IDO1 expression in melanoma. Clin Cancer Res off J Am Assoc Cancer Res. 2019 Jul 15;25(14):4530–4541.
- Li X, Wu XQ, Deng R, et al. CaMKII-mediated Beclin 1 phosphorylation regulates autophagy that promotes degradation of Id and neuroblastoma cell differentiation. Nat Commun. 2017 Oct 27;8(1):1159.
- Mai J, Zhong ZY, Guo GF, et al. Polo-Like Kinase 1 phosphorylates and stabilizes KLF4 to promote tumorigenesis in nasopharyngeal carcinoma. Theranostics. 2019;9(12):3541–3554.
- Ell B, Mercatali L, Ibrahim T, et al. Tumor-induced osteoclast miRNA changes as regulators and biomarkers of osteolytic bone metastasis. Cancer Cell. 2013 Oct 14;24(4):542–556.
- Matrka MC, Watanabe M, Muraleedharan R, et al. Overexpression of the human DEK oncogene reprograms cellular metabolism and promotes glycolysis. PloS One. 2017;12(5):e0177952.
- Handra-Luca A, Bilal H, Bertrand JC, et al. Extra-cellular signal-regulated ERK-1/ERK-2 pathway activation in human salivary gland mucoepidermoid carcinoma: association to aggressive tumor behavior and tumor cell proliferation. Am J Pathol. 2003 Sep;163(3):957–967.