
ABSTRACT
Mutations in the coding sequence of human TECPR2 were recently linked to spastic paraplegia type 49 (SPG49), a hereditary neurodegenerative disorder involving intellectual disability, autonomic-sensory neuropathy, chronic respiratory disease and decreased pain sensitivity. Here, we report the generation of a novel CRISPR-Cas9 tecpr2 knockout (tecpr2−/−) mouse that exhibits behavioral pathologies observed in SPG49 patients. tecpr2−/− mice develop neurodegenerative patterns in an age-dependent manner, manifested predominantly as neuroaxonal dystrophy in the gracile (GrN) and cuneate nuclei (CuN) of the medulla oblongata in the brainstem and dorsal white matter column of the spinal cord. Age-dependent correlation with accumulation of autophagosomes suggests compromised targeting to lysosome. Taken together, our findings establish the tecpr2 knockout mouse as a potential model for SPG49 and ascribe a new role to TECPR2 in macroautophagy/autophagy-related neurodegenerative disorders.
Introduction
TECPR2 (tectonin beta-propeller repeat containing 2) is a large multi-domain protein comprised of 1411 amino acids in humans. Its N terminus contains three WD repeats (short repeat of 40 amino acids, often terminating in a tryptophan-aspartic acid dipeptide) mostly unstructured middle region and six TECPR repeats (the tectonin beta-propeller repeats) [Citation1,Citation2] terminating with an LC3 interacting region (LIR) motif at its C terminus [Citation3].
Mutations in TECPR2 have been identified as the basis of a unique neuronal disorder, classified as spastic paraplegia 49 (SPG49; OMIM 615031), with various mutations carried by patients of diverse Jewish origins [Citation4]. Two different (c.1319delT, c.3416delT) nonsense mutation in both exon 8 and exon 16, leads to a premature STOP codon while a missense variant (c.C566T) likely leads to substitution of a highly-conserved amino-acid (p.Thr189Ile) within the third WD domain. Patients with SPG49 may present either autosomal-recessive inheritance or compound heterozygotic inheritance, with a different mutation in each allele [Citation5]. Moreover, initial indication for TECPR2 role in autophagy came from studies in HeLa cells knockdown of TECPR2 or skin fibroblasts obtained from the SPG49 patient; both showed a defect in autophagy by as yet uncharacterized mechanism [Citation3,Citation4,Citation6].
All SPG49 patients share unique dysmorphic features, including short chubby appearance, microcephaly, dental crowding and a short, broad neck [Citation4], and suffer from moderate to severe intellectual disability, evolving spasticity, and infantile-onset of chronic respiratory disease [Citation4]. A recent clinical report also described prominent features of sensory-autonomic neuropathy, such as instability of blood pressure, temperature and osmolarity, elevated pCO2 and decreased pain sensitivity [Citation5]. Further evidence for the participation of TECPR2 in neurodegenerative disorders comes from the recent linkage between a missense mutation (p.Arg1337Trp) in a highly conserved position in the TECPR2 C terminal region [Citation7] and a group of four Spanish water dogs that suffered from juvenile-onset neuroaxonal dystrophy (NAD), manifested as gait abnormalities and behavioral defects [Citation7]. Collectively, these genetic reports point to a crucial role for TECPR2 in the neuronal system, and specifically in neural sensory tracts.
To better characterize the link between TECPR2, autophagy and neurodegeneration, we generated tecpr2 knockout mice using CRISPR-Cas9 [Citation8,Citation9]. These mice exhibit neuroaxonal dystrophy in the brainstem and spinal cord that progresses in an age-dependent manner, consistent with a neurodegenerative process, accompanied by behavioral aberrations. Moreover, accumulation of large autophagosomal structures in the brainstem and spinal cord suggests a defect in targeting autophagosome to lysosome. The newly created tecpr2−/− mouse may therefore serve as a model for human SPG49 in particular and autophagy-related, age-dependent neurodegeneration in general.
Results
Generation of a TECPR2 knockout mouse as model for SPG49
SPG49 is caused by single-base deletion mutations in TECPR2 at exon 8 and/or exon 16, which lead to frameshift and premature stop codon [Citation4,Citation5]. To verify the absence of protein expression in patients, we extracted proteins from primary fibroblasts of three patients harboring a homozygous mutation at exon 8 (Ex.8), exon 16 (Ex.16) or heterozygous for both (Ex. 8 + 16), and immunoblot them with an anti-TECPR2 antibody. As expected, TECPR2 was detected in control fibroblasts obtained from a healthy individual, but not in patient-derived cells (). We also found that TECPR2 mRNA levels in cells of SPG49 patients were at least 2.5-fold lower than in control, suggesting that mutations in TECPR2 lead to mRNA instability (). Finally, the protein was observed by immunofluorescence in healthy control cells but not in patient-derived fibroblasts (). Together, these results support the notion that SPG49 patients do not express discernible amounts of the protein, and therefore tecpr2 knockout of the mouse homolog could serve to establish an animal model for the disease.
Figure 1. Generation of tecpr2 knockout mice as a model for SPG49. (A) Primary fibroblasts obtained from a healthy individual and SPG49 patients were lysed, and the extracted proteins immunoblotted for detection of TECPR2 by western blot analysis using anti-TECPR2 antibody. (B) TECPR2 mRNA levels in fibroblast cells from healthy individual and SPG49 patients. Total RNA from primary fibroblast cultures was extracted and subjected to quantitative RT-PCR using human TECPR2 primers. mRNA levels were normalized to the levels of HPRT1 (hypoxanthine phosphoribosyltransferase 1). Results are presented with the SEM of three independent experiments, p < 0.05, determined by one-way ANOVA with post-hoc Dunnett’s Multiple Comparison Test. The line at 1 refers to normalized mRNA levels in healthy control. (C) Primary fibroblasts derived from healthy individual and SPG49 patients were immunostained for TECPR2 and analyzed by confocal microscopy. Scale bar: 20 μm. (D) Schematic presentation of TECPR2 protein and its domains (top), and the expected DNA deletion and premature stop codon created by CRISPR-Cas9 using two short guiding RNA sequences (sgRNA). (E) Amino-acid sequence of wild-type TECPR2 and the truncated protein (p. Asp46Ilefs*4). (F) Representative genotyping PCR products of heterozygotic Tecpr2+/−, wild-type Tecpr2+/+ and tecpr2−/− knockout mice. (G) Mouse embryonic fibroblasts (MEFs) derived from wild-type and knockout mice were lysed, and the extracted proteins immunoblotted for detection of TECPR2 by western blot using anti-TECPR2 antibody. (H) Brain extracts from Tecpr2+/+ and tecpr2−/− mice were subjected to two-dimensional liquid chromatography followed by tandem mass spectrometry (2D-LC-MS/MS). The acquired tandem spectra (fragmentation spectra) were subjected to database searching for peptide and protein identification. Annotated MS2 spectrum identification of peptide VLLVSTLQR of TECPR2 by MaxQuant. Red: annotated peptide fragment, y-ion series. Blue: annotated peptide fragment, b-ion series (right panel). Extracted ion chromatogram for peptide VLLVSTLQR from fraction 3 of all samples were quantified by Skyline (left panel). Shown is the relative abundance of the peptide (“Peak Area Normalized”, y-axis) in each sample (“Replicate”, x-axis). Different colors represent different species of the isotopic packet of the precursor (Blue, M; Purple, [M + 1].; Brown, [M + 2].). (I) Immunostaining of TECPR2 in MEF cells derived from wild type Tecpr2+/+ and knockout tecpr2−/− mice. Scale bar: 20 μm. (J) Cervical segments of dorsal root ganglia (DRG) from wild-type Tecpr2+/+ and knockout tecpr2−/− adult mice were fixed with 4% PFA and embedded in paraffin. Slices (4-µm thick) were immunostained with anti-TECPR2 and anti-TUBB3 antibodies and DAPI. Scale bar: 50 μm
![Figure 1. Generation of tecpr2 knockout mice as a model for SPG49. (A) Primary fibroblasts obtained from a healthy individual and SPG49 patients were lysed, and the extracted proteins immunoblotted for detection of TECPR2 by western blot analysis using anti-TECPR2 antibody. (B) TECPR2 mRNA levels in fibroblast cells from healthy individual and SPG49 patients. Total RNA from primary fibroblast cultures was extracted and subjected to quantitative RT-PCR using human TECPR2 primers. mRNA levels were normalized to the levels of HPRT1 (hypoxanthine phosphoribosyltransferase 1). Results are presented with the SEM of three independent experiments, p < 0.05, determined by one-way ANOVA with post-hoc Dunnett’s Multiple Comparison Test. The line at 1 refers to normalized mRNA levels in healthy control. (C) Primary fibroblasts derived from healthy individual and SPG49 patients were immunostained for TECPR2 and analyzed by confocal microscopy. Scale bar: 20 μm. (D) Schematic presentation of TECPR2 protein and its domains (top), and the expected DNA deletion and premature stop codon created by CRISPR-Cas9 using two short guiding RNA sequences (sgRNA). (E) Amino-acid sequence of wild-type TECPR2 and the truncated protein (p. Asp46Ilefs*4). (F) Representative genotyping PCR products of heterozygotic Tecpr2+/−, wild-type Tecpr2+/+ and tecpr2−/− knockout mice. (G) Mouse embryonic fibroblasts (MEFs) derived from wild-type and knockout mice were lysed, and the extracted proteins immunoblotted for detection of TECPR2 by western blot using anti-TECPR2 antibody. (H) Brain extracts from Tecpr2+/+ and tecpr2−/− mice were subjected to two-dimensional liquid chromatography followed by tandem mass spectrometry (2D-LC-MS/MS). The acquired tandem spectra (fragmentation spectra) were subjected to database searching for peptide and protein identification. Annotated MS2 spectrum identification of peptide VLLVSTLQR of TECPR2 by MaxQuant. Red: annotated peptide fragment, y-ion series. Blue: annotated peptide fragment, b-ion series (right panel). Extracted ion chromatogram for peptide VLLVSTLQR from fraction 3 of all samples were quantified by Skyline (left panel). Shown is the relative abundance of the peptide (“Peak Area Normalized”, y-axis) in each sample (“Replicate”, x-axis). Different colors represent different species of the isotopic packet of the precursor (Blue, M; Purple, [M + 1].; Brown, [M + 2].). (I) Immunostaining of TECPR2 in MEF cells derived from wild type Tecpr2+/+ and knockout tecpr2−/− mice. Scale bar: 20 μm. (J) Cervical segments of dorsal root ganglia (DRG) from wild-type Tecpr2+/+ and knockout tecpr2−/− adult mice were fixed with 4% PFA and embedded in paraffin. Slices (4-µm thick) were immunostained with anti-TECPR2 and anti-TUBB3 antibodies and DAPI. Scale bar: 50 μm](/cms/asset/3af4d892-f3da-4bc3-9a03-2d5625e7a214/kaup_a_1852724_f0001_oc.jpg)
tecpr2 knockout mice were generated by employing the CRISPR/Cas9 gene targeting technology [Citation8,Citation9]. To obtain tecpr2−/− mice, we utilized two short guided RNA (sgRNA) sequences, creating a 19,000-bp deletion in Tecpr2 that produces a truncated protein of 45 amino acids identical to the wild type, followed by four missense amino acids and a premature STOP codon (). Mice genotypes were validated for littermates using tail-tip DNA PCR amplification of the deletion region (), with a larger product (707 bp) indicative of a wild-type allele and a smaller product (550 bp) indicative of a truncated one.
Absence of TECPR2 in mouse embryonic fibroblasts (MEFs) was verified by western blot analysis () and further confirmed by mass spectrometry of brain extracts, with several peptides within the protein identified in only Tecpr2+/+ but not tecpr2−/− mice ( and S1). When further assayed by immunofluorescence, TECPR2 was observed in wild-type, but not in knockout MEFs (). Similarly, immunostained paraffin sections of sensory neurons in cervical dorsal root ganglia (DRG) of adults showed punctate structures in Tecpr2+/+ mice, but no signal in tecpr2−/− littermates (). We thus conclude that our tecpr2 knockout mice do not express discernible levels of the protein.
Tecpr2−/− mice exhibit gait and sensory defects
We next performed a series of behavioral tests to assess sensory and motor functions in the tecpr2−/− mice (). Gait and stride parameters were assessed and analyzed in tecpr2−/− and Tecpr2+/+ mice using the CatWalk XT automated gait analysis system [Citation10,Citation11]. These analyses indicated several abnormalities in the paws’ contact with the surface and motor coordination while walking (, Table S1 and S2). tecpr2−/− mice walked more in the “Alternate AB” pattern, characterized by front – hind contralateral shift ( left panel), and to a lesser extent walked in the “Cruciate CB” pattern characterized by girdle, front and hind, contralateral shifts ( left panel). Increases in “AB” accompanied by decreases in “CB” were reported in mice with an ischemic damage to motor area in the frontal cortex [Citation12,Citation13]. In addition, tecpr2−/− mice gait exhibit significantly smaller base of support (BOS, the distance between a pair of girdle paws, the two front or the two hind) for both forelimb and hindlimbs paws (). A similar reduction in BOS was also noted in mice with ischemic damage to the motor area in the frontal cortex [Citation11]. Akin to mice that suffer from ischemic frontal cortex damage [Citation10,Citation11], the tecpr2−/− mice had smaller front paws contact and larger hind paws print width (Table S1). Additional similarities between tecpr2−/− mice and mice induced with ischemic frontal cortex damage [Citation10,Citation11] were noted in limb coupling parameters, specifically pronounced in diagonal paws coordination (left-front->right-hind) (Table S2).
Figure 2. Tecpr2 knockout mice exhibit gait and sensory defects. Differences in walking patterns between Tecpr2+/+ and tecpr2−/− mice were analyzed using Noldus CatWalkXT software (WT, n= 21; KO, n= 28). (A) Left panel shows the step sequence distribution between Cruciate (CA, CB) and Alternate (AA, AB) sequences, as illustrated on the right panel. Limbs: LF, left front; LH, left hind; RF, right front; RH, right hind. (B) Base of support (BOS) analysis by CatWalk XT as in (A). Front paws (FP) and hind paws (HP) are shown in left and right panel, respectively. (C) Mouse proprioceptive abilities were evaluated on a pole task. Numbers of mice that successfully turned and climbed down (Climber) or failed to complete a turn on a vertical pole (Fall or Slide) are shown (WT, n= 10; KO, n= 18). Results were statistically analyzed by a t-test for A− D, and by a chi squared-likelihood ratio test for E * P< 0.05, ** P< 0.01, *** P< 0.001, **** P< 0.0001. (D) Response to mechanical-sensory stimuli was tested by the response of hindlimb paws to Von Frey hair filaments; the mechanical threshold for each mouse was calculated (WT, n= 17; KO, n= 29). (E) Response to noxious thermal stimuli was tested by paw withdrawal latency (PWL) in response to a heated probe (58°C) applied to hindlimb paws (WT, n= 16; KO, n= 26)
Additional assessment of coordinated actions of the tecpr2−/− mice was performed using the Pole task (). This task challenges the mice to turn and climb down a vertical pole and is commonly used to assess neurodegenerative diseases and stroke mouse models [Citation14]. The proportion of mice that slid down side-ways or fell was significantly higher in tecpr2−/− (7/18) mice as compared with Tecpr2+/+ (0/10) mice [Χ2 likelihood ratio (1) = 7.434; P = 0.006]. Similar deficiencies in their ability to climb down from the pole were previously observed in mouse models of Parkinson Disease [Citation15,Citation16].
Further behavioral assessments have focused on sensory functions and included mechano-sensory assessment using the Von-Frey test [Citation17] and responding to noxious thermal stimuli using a heat probe [Citation18]. The response threshold for mechano-sensory stimuli was significantly higher in tecpr2−/− compared to Tecpr2+/+mice when tested with Von Frey hair filaments, showing a slower reaction to medium hair filament stimulation (). In contrast, a significantly shorter paw withdrawal latency (PWL) in response to a heated probe at 58°C () indicated that tecpr2−/− mice are hypersensitive to thermal stimuli. Notably, Tecpr2+/+ and tecpr2−/− mice did not differ with respect to body weight (Figure S2A), home cage locomotor activity (Figure S2B), or coordination and balance performance in a rotarod test (Figure S2C) [Citation19].
Collectively, the behavioral assessments indicate that knockout of the Tecpr2 gene leads to motor abnormalities that resemble those seen in experimental models of CNS damage and to altered responses to mechano-sensory stimuli that were observed in human SPG49 patients [Citation4].
Tecpr2−/− mice exhibit central brain system neurodegeneration
To determine whether the Tecpr2 deletion affects the central nerve system, MRI brain scans of Tecpr2+/+ and tecpr2−/− mice were obtained. In tecpr2−/− mice aged 4 to 5 months, MRI scans revealed abnormalities in six brain regions (indicated in Figure S3A) where T2 values were significantly higher than wild type (), indicating inflammation and degeneration [Citation20,Citation21]. Gray and white matter of both motor and sensory tracts were affected; specifically, the pyramidal tract (py), the genu of the facial nerve (g7), the superficial gray layer of the superior colliculus (SuG), the magnocellular part of the medial vestibular nucleus (MVeMC), the supraoptic decussation (sox), and the basal part of the cerebral peduncle (cp) (). These results are in line with MRI scans of SPG49 patients that revealed brain defects such as thin corpus callosum, cerebellar atrophy, enlarged lateral ventricles and deep cerebral sulci starting at the age of 3 years [Citation4].
Figure 3. Neurodegeneration in tecpr2 knockout mice. (A) 4 to 5 months old tecpr2−/− and Tecpr2+/+ mice were anesthetized by isoflurane and subjected to brain MRI. The six regions of interest (ROIs) including pyramidal tract (py), genu of the facial nerve (g7), superficial gray layer of the superior colliculus (SuG), MVeMC medial vestibular nucleus, magnocellular part (MVeMC), supraoptic decussation (sox), and basal part of the cerebral peduncle (cp) were indicated with abnormalities characterized by significant elevation of T2 values in tecpr2−/− relative to Tecpr2+/+ mouse brains, summarized in a plot, *p < 0.05, t-test. (B) Nine-month-old mice were perfused with 4% PFA, and lumbar spine sections were taken, decalcified and embedded in paraffin. Then sections were cut and immunostained for neurofilament (red) and for myelin basic protein (MBP) (green). Scale bar: 100 µm, and scale bar of zoomed images 50 µm. Intensities are presented with the SEM of three different sections, ***p < 0.001, t-test. (C) Representative coronal section stained with H&E illustrating the affected sensory tract within the medulla oblongata of the brainstem: gracile nucleus (GrN), cuneate nucleus (CuN) and the caudal part of the spinal trigeminal nucleus (Sp5c). Scale bar: 500 µm. (D) tecpr2−/− and Tecpr2+/+ mice were perfused with 4% PFA and their brains were removed and embedded in paraffin. Sagittal brain sections of 9-month-old mice (4 µm thick) were stained with H&E, and their images were analyzed by widefield microscopy. Scale bar: 1000 µm, and scale bar of zoomed images, 50 µm. (E) TEM image indicates patterns of neurodegeneration in the tecpr2−/− mouse brain. Coronal brainstem section of tecpr2−/− mouse brain stem demonstrates swellings and abnormal axons. Scale bar: 5 µm. These structures were not identified in Tecpr2+/+ mice
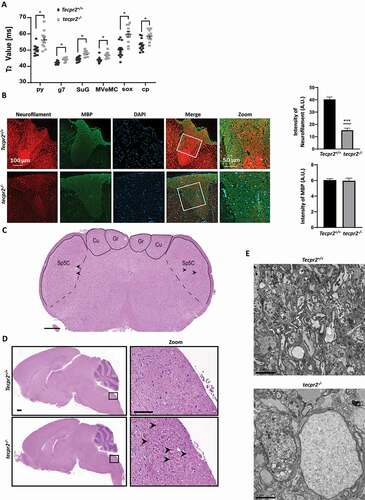
We also examined the neuronal tissue alterations by immunostaining neurofilaments and myelin on sections of spinal cords of Tecpr2+/+ and tecpr2−/− mice. An overall decrease in neurofilament levels was clearly observed in tecpr2−/− mice, whereas myelin levels were unaffected ().
Consistent with a recently reported study on Spanish water dogs tecpr2 mutants [Citation7], tecpr2−/− mice developed neuroaxonal dystrophy marked by an appearance of bilateral and symmetrical axonal swelling (spheroids) in the medulla oblongata ( and S3C), specifically in the gracile nucleus (GrN), the cuneate nucleus (CuN), and the caudal part of the spinal trigeminal nucleus (Sp5C) (). In the spinal cord, the spheroids were also common in the thoracic segment. (Figure S3B). The spheroids in the brainstem and the spinal cord were morphologically similar (, S3B, and S3C). Most were round to oval or irregular eosinophilic structures varying in size from <5 µm to >60 µm in diameter. Occasionally they contained clefts of various shapes and sizes or internal zones. Spheroids in sensory regions of the brain and spinal cord are a hallmark of NAD, and typical in neurodegeneration [Citation22].
Abnormal structures were further confirmed as axonal spheroids by TEM analysis in brains of 9-month-old mice. Indeed, large swollen spheroidal structures with misshapen edges and disorganized content were clearly visible in all knockout mice but none of the wild types, and varied in diameter from 10 to 50 µm with an average size of 25 µm ( and S3D).
Accumulation of autophagosomes in tecpr2−/−mice
Lack of TECPR2 was originally linked to defects in autophagy [Citation4,Citation6], however, exactly how it functions in this process remains rather unclear. To determine whether autophagy was affected by the lack of TECPR2, brain sections obtained from the affected areas were analyzed by TEM. In the coronal brainstem sections of 9-month-old tecpr2−/−, but not wild type mice, accumulation of autophagosomes was clearly observed (). These double-membrane autophagosomes with intact (or partially degraded) cytoplasmic contents varied in size between 0.17 and 1.57 µm with an average size of 0.53 µm, consistent with the expected size of autophagosomes in mammals [Citation23]. The accumulation of autophagosomes (275 to 550 vesicles per spheroid) in tecpr2−/− mice suggests a slowdown in their targeting to the lysosome.
Figure 4. Accumulation of autophagosomes in tecpr2−/−mice. (A) TEM images indicate accumulation of double-membrane autophagic structures in a tecpr2−/− mice brain. Scale bar: 5 µm and scale bar of zoomed images, 1 µm (left) and 500 nm (right). (B) Total proteins extracted from the brains of Tecpr2+/+ and tecpr2−/− mice were analyzed by western blot for TECPR2, LC3B and SQSTM1 using corresponding antibodies. The levels of LC3B-II and SQSTM1 were calculated (right panel), results are presented with the SEM of three independent experiments, p < 0.05, determined by t-test. (C) Coronal brain sections from brainstem region, corresponding to spheroid areas in 9 months-aged mice, were immunostained for LC3 and SQSTM1 and analyzed by confocal microscopy. Scale bar: 20 μm. (D) Tecpr2+/+ and tecpr2−/− MEF cells were transfected with mRFP-GFP-LC3B construct using JetPrime transfection reagent for 24 h. Then cells were fixed with methanol and analyzed by confocal microscopy (left panel). Scale bar: 20 μm. The number of yellow and red dots per field represent autophagosomes or autolysosomes, respectively, was calculated and presented with the SEM ***p < 0.001, determined by t-test (right panel)
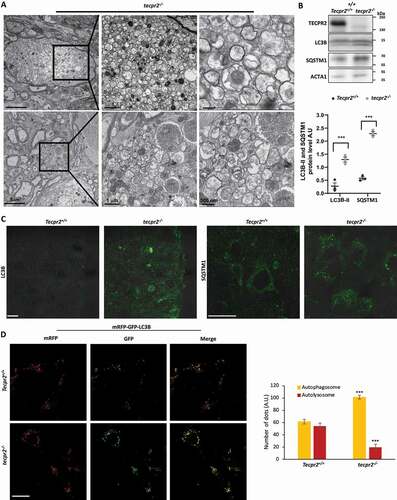
Further indication for an accumulation of autophagosomes in tecpr2−/− mice was obtained by western blot analysis of brain lysates extracted from 9-month-old Tecpr2+/+ and tecpr2−/− mice using antibodies directed against SQSTM1/p62 and LC3B, two autophagosomal markers (). We also noted that accumulation of LC3 and SQSTM1 in brainstem regions was significantly higher in knockout mice than in wild types (). Importantly, the lysosomal marker LAMP2 was not localized to spheroids in tecpr2−/− mice, excluding the possibility of accumulation of autolysosomes (Figure S4A). To further examine this possibility, we transfected Tecpr2+/+ and tecpr2−/− MEFs with mRFP-GFP-LC3B construct [Citation24]. Our results revealed significant accumulation of autophagosomes (marked by yellow) and reduced number of autolysosomes (marked by red) in tecpr2−/− MEF cells, while in Tecpr2+/+ MEF cells, the amount of autophagosomes was similar to autolysosomes (). This result suggests compromised lysosomal consumption of autophagosomes due to loss of TECPR2.
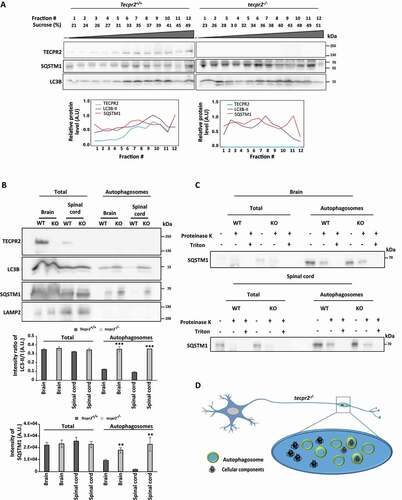
The effect of tecpr2 knockout on autophagosome accumulation was further analyzed by subcellular fractionation. First, membranes from brain homogenates obtained from 6-month-old mice were floated on sucrose gradients. As depicted ( and S5), the loss of TECPR2 led to a profound change in LC3 and SQSTM1 fractionation patterns. Notably, in wild type brains, a small but significant portion of TECPR2 cofractionated with LC3B and SQSTM1. (). We further purified autophagosomes from brainstem and spinal cord, following the well-established procedure by Seglen and coworkers [Citation25]. Consistent with the notion that knockout of tecpr2 leads to accumulation of autophagosomes, immunoblot analysis of purified autophagosome fraction indicated enrichment of LC3B and SQSTM1 in knockout mice, but not of lysosomes indicated by LAMP2 (). The presence of sealed autophagosomes in the purified fractions was confirmed through proteinase K protection assay. As shown in , in the absence of detergent, SQSTM1 in the autophagosomal fraction remained protected from proteinase K, indicating the enrichment of sealed autophagosomes by the purification process. Together, these findings indicate that TECPR2 affects autophagy in vivo, and strongly support a role in autophagosome consumption.
Figure 5. Isolation of autophagosomes from mouse brain and spinal cord. (A) Homogenates obtained from brains of 6 months-old Tecpr2+/+ and tecpr2−/− mice, floated over a sucrose gradient as described in Materials and Methods, fractions were subjected to western blot analysis with the indicated antibodies and bands were quantified by ImageJ software (lower panel). (B) Total homogenate and autophagosomes fractions isolated from brain and spinal cord of 6 months-old Tecpr2+/+ and tecpr2−/− mice were analyzed by western blot for TECPR2, LC3B, SQSTM1 and LAMP2 using corresponding antibodies. The intensity ratio of LC3B-II/LC3-I was calculated (upper panel), and results are presented with the SEM of three independent experiments for brain and spinal cord, ***p < 0.001, determined by t-test. SQSTM1 intensity was determined by densitometry (lower panel). Results are presented with the SEM of three independent experiments for brain and spinal cord, **p < 0.01, determined by t-test. (C) Total homogenate and autophagosomes fractions from brain and spinal cord of 6 months-old Tecpr2+/+ and tecpr2−/− mice were subjected to Proteinase K and Triton X-100 treatments as described in Materials and Methods. (D) Model of autophagosome accumulation in neurons of tecpr2−/− mice
Age-dependent neurodegeneration and autophagosome accumulation in tecpr2−/− mice
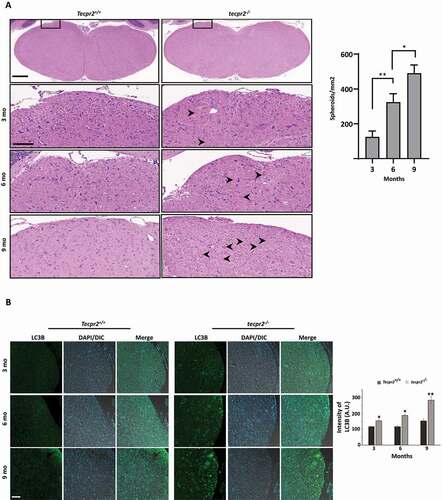
To determine whether the tecpr2−/− mouse may serve as a model for progressive neurodegeneration, we examined the formation of spheroids during aging. As shown in , only a small number of spheroids were detected in 3-month-old tecpr2−/− mice (125 spheroids/mm2), whereas the numbers were significantly higher at 6 months (324 spheroids/mm2) and 9 months (490 spheroids/mm2). In contrast, no spheroids were observed in Tecpr2+/+ mice. A similar pattern of age-dependent accumulation of autophagosome in the affected brain sections was detected in LC3B immunostaining (). These results suggest a progressive course of the disease in tecpr2−/− mice and a potential link to defects in autophagosome consumption.
Figure 6. Age-dependent neurodegeneration in TECPR2−/− mice. (A) Age-dependent progressive formation of spheroids in the tecpr2−/− mouse brainstem. Tecpr2+/+ and tecpr2−/− mice (n = 3 for each experiment) aged 3, 6 and 9 months were perfused with 4% PFA and their brains were then removed and embedded in paraffin. Coronal brain sections obtained from similar areas of the brainstem were stained with H&E and analyzed by widefield microscopy. Number of spheroids was normalized to the size of the measured area (right panel). Scale bar of upper panel: 500 µm, scale bar of zoomed images: 50 µm. *p < 0.05, **p < 0.01 determined by one-way ANOVA with Dunnett’s Multiple Comparison Test as posttest. (B) Age-dependent progressive accumulation of LC3 in large autophagosomal structures in the brain affected regions of tecpr2−/− mice. Coronal brain sections from brainstem regions, corresponding to spheroid areas in mice aged 3, 6, and 9 months, were immunostained for LC3 (green) and analyzed by confocal microscopy. Scale bar: 20 µm. The intensity of LC3B was calculated by ImageJ and presented with the SEM * p < 0.05, **p < 0.01 determined by t-test (right panel)
Discussion
Autophagy plays a vital role in neuronal regulation, and its impairment has been shown to lead to neuronal pathologies such as Alzheimer, Parkinson and Huntington diseases, amyotrophic lateral sclerosis, Vici syndrome, HSP, and others [Citation26–28]. However, existing model systems to characterize the link between autophagy and neurodegeneration are limited. Here, we report on a newly created mouse model lacking Tecpr2 gene, the primary cause for neurological disorder with an early onset termed SPG49. This tecpr2 knockout mouse exhibits some pathologies of SPG49 patients in correlation with accumulation of autophagosome in affected central nerve system neurons (). We thus propose that this mouse potentially serves as model for studying SPG49 and other autophagy-related neurodegenerations.
The newly generated tecpr2−/− mouse described in this study demonstrated changes in sensory behavior accompanied by motor alterations and axonal dystrophy, as well as age-dependent spheroidal accumulation that mostly incorporated autophagic structures. These phenotypes support the reliability of our proposed tecpr2 knockout mouse model. In particular, some of the sensory and motor alterations in this model are analogous to those observed in the human SPG49 disorder, which is characterized by spastic paraplegia and decreased pain sensitivity [Citation4]. Our MRI scans of tecpr2 knockout mouse pointed to significant abnormalities in T2 images of six different brain regions, consistent with neurodegeneration [Citation20]. This finding coincides with the MRI scans of SPG49 patients, which included abnormalities such as a thin corpus callosum, enlarged lateral ventricles and deep sulci, indicating progressive cerebellar atrophy [Citation4].
The neuroaxonal dystrophy observed in the brains and spinal cords of tecpr2 knockout mice, manifested as development of axonal spheroids, showed progressive age-dependent accumulation typical of NAD, and may therefore signify neurodegeneration [Citation22]. NADs comprise a group of neurodegenerative disorders that appear during childhood, show progressive neurological deterioration, and usually possess an autosomal recessive pattern of inheritance [Citation22]. A unique pathological feature of NADs is the presence of spheroids, often seen as axonal swellings localized throughout the central and peripheral nervous systems [Citation29,Citation30]. Our findings are reminiscent of histopathological findings in tecpr2-mutant dogs, in which neuronal loss and spheroid formation were accentuated in the gray matter of the cerebral hemispheres, cerebellum and brainstem, and sporadic spheroids were also found in brain white matter [Citation7]. The neuronal loss and spheroid formation seen in the spinal cord of the tecpr2 mutant dogs were restricted to the sensory pathways [Citation7]. In our tecpr2 knockout mice, the spheroids were identified in the dorsal column pathway of the brain and spinal cord, indicating that the neurodegenerative process occurs in ascending sensory pathways and could underlie the sensory defects observed in the behavioral tests.
We provide evidence for the accumulation of autophagosomes in the mouse brain and spinal cord. EM images indicated that autophagosomes accumulate along the axon, particularly in spheroids. Importantly, the observed accumulation of autophagosomes in the affected neurons of tecpr2−/− mice may indicate a defect in targeting of these vesicles to the lysosome. This accumulation is in line with our new study on TECPR2 function in primary fibroblasts obtained from SPG49 patients in which we show its role in targeting autophagosomes to lysosomes [Citation31]. The biochemical analysis of TECPR2 from the wild type mouse brain revealed its association with autophagosomal and lysosomal markers, LC3B and LAMP2, respectively. This association suggests that TECPR2 is acting to bridge between the autophagosome and the lysosome, in line with its recently-reported interaction with the BLOC1 and HOPS complexes [Citation3] that mediate autophagosomal-lysosomal membrane tethering [Citation32]. Indeed, our accompanying study implicates TECPR2 in bridging autophagosomes and lysosomes by concomitant interaction of its carboxy-terminal TECPR repeats domain with Atg8 proteins and the VAMP8-HOPS complex, respectively [Citation31]. Consistent with the idea that TECPR2 acts at a late stage in the autophagy pathway is the fact that TECPR1, its closest homolog, was also implicated in autophagosomal-lysosomal membrane tethering [Citation33].
In summary, this report establishes the tecpr2−/− mouse as a model for SPG49, clearly exhibiting age-dependent progressive neurodegeneration and impaired autophagy. This animal model may be expected to provide insights linking defects in autophagy to other neurodegenerative disorders and facilitate development of new therapeutic strategies.
Materials and methods
Study approval
All mouse work was performed according to the approved guidelines of the Institutional Animal Care and Use Committee at the Weizmann Institute of Science (WIS), IACUC approved numbers 10820514–2 and 28590716–3.
TECPR2 knockout mouse strain
To generate tecpr2 knockout mice (tecpr2−/−), we used the online CRISPR design tool [Citation8] to create two short guide RNA (sgRNA) sequences, targeting the third (ACGGGGACTACATTGCAGTG) and the fifth (CGCTGGCGTGGAGCCCCAAT) exons of the 21 coding exons of the mouse Tecpr2 gene. The sgRNAs were injected together with in-vitro-transcribed Cas9 into single-cell fertilized embryos isolated from super-ovulated C57BL/6 J mice, a background recommended for modeling neuronal diseases [Citation34,Citation35] at the WIS transgenic and knockout facility. The zygotic embryos were transferred to pseudopregnant females. Fully weaned mice were analyzed for Tecpr2 alterations using PCR amplification and sequencing of tail-tip DNA. Relevant females were further backcrossed to C57BL/6 J for the tecpr2−/− colony foundation.
Analysis of TECPR2 knockout mouse genotype
Mice from each litter were genotyped by PCR using Taq DNA Polymerase Master Mix (Ampliqon, A190303) with suitable primers. To detect wild-type alleles, we used ATTCTGCCCTTTGTACTATCTCCTC (located upstream of the deletion region) as the forward primer and CTCAAGTGCCTGAAATAGTAATGCT (within the deletion) as the reverse primer. To detect knockout alleles, we used TAAGATATCCTGAAAACTCGTCCAA, located downstream of the deletion region, as a reverse primer.
Behavioral tests
Mice from each litter were reared and maintained in a temperature- and humidity-controlled vivarium under a 12-h light-dark cycle with free access to food and water ad libitum. Males aged 6–9 months underwent behavioral assessments (detailed below), performed during the “dark/active” phase, after at least 1 hour of habituation to the test room.
Heat probe (thermal stimulation)
Adapted from Deuis et al [Citation36]. Sensitivity to thermal stimuli was assessed by latency of paw withdrawal in response to a heated probe at 58°C applied to the left and right hindlimb paws. The response time to the noxious stimuli was recorded. The test was repeated three times in 30 min intervals, and the mean of the three assessments for both the left and the right hindlimb was calculated.
Von Frey (mechanical stimulation)
Adapted from Bradman et al [Citation37]. Mechanical sensitivity was assessed utilizing Von Frey hair filaments (Hugo-Basile). Mice were habituated to the wire mesh floor setup for 1 h on each of the 2 d preceding the test. The mechanical threshold for each mouse was calculated as described in Marvaldi et al [Citation17].
Home cage locomotion
Adapted from Bradman et al [Citation38]. Home cage spontaneous locomotor activity was assessed using InfraMot (TSE Systems, Germany), which senses body-heat image (infrared radiation) and its spatial displacement over time. Mice were housed individually in separate cages for 72 h. The first 24 h were considered a habituation period and were not included in the assessment. During the following 48 h data on locomotor activity were collected, from which diurnal activity (over 24 h, i.e. one light-dark cycle) was calculated.
Rotarod
Adapted from Shiotsuki et al [Citation19]. To assess motor coordination and balance, we used the RotaRod system (83 × 91 × 61 cm; San Diego Instruments, San Diego, CA, USA), in which mice were placed on a slowly rotating cylinder accelerating from 0 to 20 rotations per minute (RPM) in 240 s, and the latencies, distances traveled and RPM at the time of falling were recorded. Prior to the initial activation, each mouse was placed on the cylinder for 5 min to habituate itself. To assess motor learning each mouse was tested on three successive days, three repeats each day, and a daily mean was calculated for each mouse.
Gait and stride analyses
Adapted from Hamers et al [Citation11]. Footfalls and gait were quantitatively assessed using the CatWalk XT automated gait analysis system (Noldus Information Technology, Wageningen, Netherlands). Mice were placed on the CatWalk walkway and footprints were captured over 60 cm. Videos of three repeats from each mouse were analyzed by the CatWalk XT 10.6 software, and parameters related to gait and balance were calculated.
Pole task
Adapted from Fleming et al [Citation39]. Proprioception was tested in terms of the transition of a pole from a horizontal to a vertical position, as evaluated by the latency of the mouse to turn around and climb down. The mice were first trained, in two daily sessions, to walk along a horizontally positioned 50-cm-long pole (1-cm thick, and wrapped in absorbent tape). On the third day each mouse was challenged by a fast transition of the pole to a vertical position. Mice were scored as “succeeding” if they turned to face downward and climbed down in a forward motion back to the home cage in under 60 s (Climber), or as “failing” if they did not turn and climb down in under 60 s or slide down sideways in a spiral (Fall or Slide). Chi squared likelihood ratios were analyzed to compare the success and failure rates in this task.
Western blot analyses
Total cellular protein extracts were prepared in RIPA buffer (0.1 M NaCl [Bio-Lab Ltd, 21955], 5 mM EDTA [J.T. Baker, 8993], 0.1 M sodium phosphate, pH 7.5 [Sigma, 342483], 1% Triton X-100 [Sigma, X100], 0.5% sodium deoxycholate [Sigma, D6750], 0.1% sodium dodecyl sulfate [Sigma, L4509]) with a protease inhibitor cocktail (PIC; Merck, 539134). The extracts were centrifuged at 16,000 x g for 15 min at 4°C and protein concentrations were determined using Bio-Rad Protein Assay Dye Reagent Concentrate (Bio-Rad, 500–0006). Total proteins (30 µg) were separated by SDS-PAGE (12% polyacrylamide) and transferred to a polyvinylidene difluoride (PVDF) membrane (Bio-Rad, 1704157). The membrane was blocked in phosphate-buffered saline (PBS; Biological Industries, 02–023-5A) with 5% skim milk for 1 h at room temperature and then incubated with the appropriate primary antibody overnight at 4°C. It was then washed three times with PBS-Tween 20 (0.1%, Sigma, P1379) and incubated with the secondary antibody (goat anti-mouse or goat anti-rabbit) for 1 h at room temperature. Finally, the membrane was washed three times and specific proteins were visualized using the Enhanced ChemiLuminescence (ECL) detection system (Biological Industries, 20–500-120). The antibodies employed for this assay are described in .
Table 1. Antibodies used in this study
Autophagosome purification
Autophagosome purification was performed as described by Strømhaug et al. [Citation25] briefly, 100 mg of spinal cord or brain tissue were homogenized with ice-cold 5 (v:w) Tris-NaCl (50 mM Tris, pH 7.4 [Bio-Lab Ltd, 20097759], 150 mM NaCl) supplemented with 2xPIC. The tissue homogenate was centrifuged at 500 x g for 5 min at 4°C, and the supernatant was collected and stored as cytosolic part. The pellet was resuspended with 1 ml ice-cold Tris-NaCl 10% (w:v) sucrose (J.T. Baker, 4072) with 1xPIC, and postnuclear supernatant (PNS) was collected at 2000 x g for 2 min at 4°C and placed on top of a discontinuous (two-step) Nycodenz (Jinlan Pharm-Drugs technology, 66108–95-0) gradient in SW50.1 ultracentrifuge tube (top layer, 2 parts of PNS; middle layer, 2.5 parts of 9.5% Nycodenz; bottom layer, 1 part 22.5% of Nycodenz). To pellet mitochondria and peroxisome, the Nycodenz gradient was centrifuged for 1 h at 141,000 x g at 4°C. The interface (containing autophagosomes and ER) formed between the 9.5% and 22.5% Nycodenz layers was collected and diluted with an equal volume of Tris-NaCl 10% (w:v) sucrose and then layered on top of a Nycodenz-Percoll (Sigma, P4937) gradient (top layer, 1.7 parts of diluted interface; middle layer, 3 parts of 33% Percoll; bottom layer, 1 part of 22.5% Nycodenz). To remove the small-vesicular and non-membraneous material, the Nycodenz-Percoll gradient was centrifuged at 72,000 × g for 30 min at 4°C. After centrifugation, the upper part of the gradient was discarded as ER fraction and lower part was collected as autophagosomal fraction and diluted with 0.7 volume of 60% OptiPrep (Sigma, D1556). To remove Percoll, 6 parts of diluted autophagosomal fraction was overlaid with 1 part of 30% OptiPrep in 1xPBS, and a top layer of 2.5 part of Tris-NaCl buffered 10% (w:v) sucrose followed by centrifugation at 72,000 × g for 30 min at 4°C. The upper layer (autophagosomes) was collected and precipitated for 2 h at 4°C by 10% trichloroacetic acid (TCA; Merck, T6399). Then samples were centrifuged at 20,000 x g for 15 min at 4°C. Pellet was washed with cold acetone, dried, resuspended in sample buffer, incubated at 65°C for 5 min and subjected to western blot analysis.
Proteinase K protection assay
Autophagosomal fraction and total homogenate (10 µg) obtained from brain and spinal cord (for details see above) of 6-months-old Tecpr2+/+ and tecpr2−/− mice were incubated in the presence or absence of proteinase K (10 µg/ml; Merck, 1245680) with or without Triton X-100 (0.4% [v:v]) for 1 h at room temperature. Treatments were terminated by the addition of phenylmethylsulfonyl fluoride (PMSF; 200 mM, Sigma, 78830). Proteins were precipitated by 10% TCA and subjected to western blot analysis.
Membrane flotation assay
Cells were homogenized with Balch homogenizer. Homogenates (2 mg protein) were adjusted to 2 M sucrose, placed at the bottom of rotor tubes, overlaid with 1.75, 1.5, 1.25, 1 and 0.75 M sucrose and centrifuged in the SW-28 rotor (Beckman) at 102,000 x g (slow acceleration and deceleration) overnight, 4°C. Fractions from the top of the gradient were collected and sucrose densities were estimated from their refractive indices. Proteins from each fraction (180 µl) were precipitated by 10% TCA, heated at 65°C in sample buffer and immunoblotted.
Magnetic resonance imaging (MRI)
Adult tecpr2 knockout and wild-type littermates were subjected to brain magnetic resonance imaging (MRI). Prior to MRI scanning the mouse was anesthetized with isoflurane (5% for induction, 1–2% for maintenance) mixed with oxygen (1 L/min) and delivered through a nasal mask. The anesthetized mouse was placed in a head-holder to ensure reproducible positioning inside the magnet. Respiration rate was monitored and maintained at around 60–80 breaths per minute. MRI was performed with a 9.4 Tesla BioSpec Magnet 94/20 USR system (Bruker, Germany) equipped with a gradient coil system capable of producing a pulse gradient of up to 40 gauss/cm in each of the three directions. All MR images were acquired with a receive quadrature mouse head surface coil and a transmitter linear coil (Bruker). T2 maps were acquired using the multi-slice spin-echo imaging sequence with the following parameters: repetition delay (TR) 3000 ms, 16 time echo (TE) increments (linearly from 10 to 160 ms), matrix dimension 256 × 128 (interpolated to 256 × 256), and two averages, corresponding to an image acquisition time of 12 min 48 s. The T2 dataset consisted of 16 images per slice. Thirteen continuous slices (1-mm thick) were acquired with a field of view of 2.0 × 2.0 cm2. For image analysis, a quantitative T2 map was produced from multi-echo T2-weighted images. The multi-echo signal was fitted to a mono-exponential decay to extract the T2 value for each image pixel. All image analysis was performed using homemade scripts written in Matlab R2013B. Inter-subject and intra-subject co-registration were applied prior to the MRI dataset analysis. For optimal suitability to a mouse brain atlas (correction of image artifacts for head movements), all images underwent atlas registration (reslicing, realignment and smoothing) using the SPM12 software (UCL, London, UK).
Mass spectrometry (MS)
Lysates from of Tecpr2+/+ and tecpr2−/− mice brains were subjected to 2-dimensional chromatographic fractionation followed by tandem mass spectrometry (2D-LC-MS/MS). Raw data were analyzed with the MaxQuant software using the Andromeda search engine to search the raw data against the mouse protein database. TECPR2 peptide identifications were manually examined and validated. The acquired tandem spectra (fragmentation spectra) were subjected to database searching for peptide and protein identification. Examples of individual annotated fragmentation spectra which resulted in TECPR2 peptides identification by the search engine are shown in the right panel of and S1, where individual measured peptide fragments matching the theoretical fragments are highlighted in red (y-ion series) or blue (b-ion series). Quantification of the MaxQuant-identified TECPR2 peptides was also manually refined, using the Skyline algorithm.
Organ sections and staining
Mice were euthanized, perfused with 4% paraformaldehyde (PFA; Bar-Naor, bn15710), and their organs harvested and kept in 4% PFA overnight at 4°C. For tissue decalcification and paraffin embedding procedures, samples were placed in increasing concentrations of ethanol (70% to 100%), then in Histo-Clear (Sigma, H2779) and, finally, in paraffin wax. To decalcify spinal cord tissues, they were placed in 12.5% EDTA, which was changed daily for 3 d. Samples were sliced into 4-μm-thick sections, placed on positively charged glass slides, and dried for 1 h at 60°C. Paraffin was removed by xylene and the samples were washed with ethanol and then rehydrated. Slides were stained with hematoxylin and eosin (H&E following standard procedures) [Citation40]. For immunofluorescence, samples underwent antigen retrieval by citrate buffer (10 mM sodium citrate [BDH, 102424 L], 0.05% Tween 20, pH 6.0) and were placed in the Decloaking Chamber. Deparaffinized and decloaked slides were placed in blocking solution (1% bovine serum albumin [Sigma, A9647], 0.2% Triton X-100 and 0.5% donkey serum [Sigma, D9663] in PBS) for 2–3 h, and then incubated with primary antibody in the same solution at 4°C overnight. The next day, samples were treated with the fluorophore-conjugated secondary antibody in blocking solution for 1 h at room temperature, incubated for 10 min with Hoechst (Cell Signaling Technology, 4082S) (2.5 μg/ml), washed, and then mounted on slides and covered with glass coverslips. The antibodies employed for this assay are described in .
Imaging
Wide-field images were obtained with an Axio Observer 7 inverted microscope system using an objective Plan-Apochromat 20×/0.8 M27 and 1.6× tube lens. Images were analyzed by ZEN Blue software (Zeiss) and ImageJ (NIH). Confocal images were obtained with a Zeiss LSM 880 AxioObserver laser scanning confocal microscope using Plan-Apochromat 20×/0.8 M27 or alpha Plan-Apochromat 100×/1.46 Oil DIC M27 Elyra objectives. Images were analyzed by Zen Blue software (Zeiss) and ImageJ. Histological images were obtained with a pco.edge 4.2 4MP camera using a Plan-Apochromat 20× objective and PanoramA SCAN 150 software. Images were analyzed using CaseViewer 2.2 software (3DHISTECH) and ImageJ.
Transmission electron microscopy
Samples were fixed with 4% PFA, 2% glutaraldehyde, in 0.1 M cacodylate buffer containing 5 mM CaCl2 (pH 7.4), post-fixed in 1% osmium tetroxide supplemented with 0.5% potassium hexacyanoferrate trihydrate and potasssium dichromate in 0.1 M cacodylate for 1 h, stained with 2% uranyl acetate in double-distilled water for 1 h, dehydrated in graded ethanol solutions, and embedded in epoxy resin (Agar Scientific, AGR1030). Ultrathin sections (70–90 nm), obtained with a LeicaUltracut UCT microtome, were stained with lead citrate and then examined using either a Phillips CM-12 transmission electron microscope (TEM) equipped with a Gatan One View camera or an FEI Tecnai SPIRIT TEM equipped with a bottom-mounted 2 k × 2 k FEI Eagle CCD camera.
Statistical analysis
Where appropriate, statistical significance between data sets was analyzed by t-tests or one-way analysis of variance (ANOVA) using GraphPad Prism. N.S., non-significant; *p < 0.05, **p < 0.01, ***p < 0.001, ****p < 0.0001.
Supplemental Material
Download Zip (65.4 MB)Acknowledgments
Z.E. is the incumbent of the Harold Korda Chair of Biology. We are grateful for funding from the Israel Science Foundation (Grant #215/19), the Sagol Longevity Foundation, Joint NRF - ISF Research Fund (Grant #3221/19), and the Yeda-Sela Center for Basic Research. Z. E. and N.S. are supported by a Marie Skłodowska-Curie ETN grant under the European Union’s Horizon 2020 Research and Innovation Programme (Grant Agreement No 765912 DRIVE). M.T. is the incumbent of the Carolito Stiftung Research Fellow Chair in Neurodegenerative Diseases C.B. was supported by the Deutsche Forschungsgemeinschaft (DFG, German Research Foundation) within the frameworks of the Munich Cluster for Systems Neurology (EXC 2145 SyNergy – ID 390857198), the Collaborative Research Center 1177 (ID 259130777) as well as the research grant BE 4685/7-1.
The authors declare no conflict of interest.
Disclosure statement
No potential conflict of interest was reported by the authors.
Supplementary material
Supplemental data for this article can be accessed here.
Additional information
Funding
Related Research Data
References
- Huh CG, Aldrich J, Mottahedeh J, et al. Cloning and characterization of physarum polycephalum tectonins. J Biol Chem. 1998 Mar 13;273(11):6565–6574.
- Li D, Roberts R. WD-repeat proteins: structure characteristics, biological function, and their involvement in human diseases. Cell Mol Life Sci. 2001 Dec;58(14):2085–2097.
- Stadel D, Millarte V, Tillmann K, et al. TECPR2 cooperates with LC3C to regulate COPII-dependent ER export. Mol Cell. 2015 Oct 1;60(1):89–104.
- Oz-Levi D, Ben-Zeev B, Ruzzo E, et al. Mutation in TECPR2 reveals a role for autophagy in hereditary spastic paraparesis. Am J Hum Genet. 2012 Dec 7;91(6):1065–1072.
- Heimer G, Oz-Levi D, Eyal E, et al. TECPR2 mutations cause a new subtype of familial dysautonomia like hereditary sensory autonomic neuropathy with intellectual disability. Eur J Paediatr Neurol. 2016 Jan;20(1):69–79.
- Behrends C, Sowa ME, Gygi SP, et al. Network organization of the human autophagy system. Nature. 2010 Jul 1;466(7302):68–76.
- Hahn K, Rohdin C, Jagannathan V, et al. TECPR2 associated neuroaxonal dystrophy in spanish water dogs. PLoS One. 2015;10(11):e0141824.
- Ran FA, Hsu PD, Wright J, et al. Genome engineering using the CRISPR-Cas9 system. Nat Protoc. 2013 Nov;8(11):2281–2308.
- Yang H, Wang H, Jaenisch R. Generating genetically modified mice using CRISPR/Cas-mediated genome engineering. Nat Protoc. 2014 Aug;9(8):1956–1968.
- Crowley ST, Kataoka K, Itaka K. Combined CatWalk Index: an improved method to measure mouse motor function using the automated gait analysis system. BMC Res Notes. 2018 Apr 27;11(1):263.
- Hamers FP, Lankhorst AJ, van Laar TJ, et al. Automated quantitative gait analysis during overground locomotion in the rat: its application to spinal cord contusion and transection injuries. J Neurotrauma. 2001 Feb;18(2):187–201.
- Hetze S, Römer C, Teufelhart C, et al. Gait analysis as a method for assessing neurological outcome in a mouse model of stroke. J Neurosci Methods. 2012 Apr 30;206(1):7–14.
- Caballero-Garrido E, Pena-Philippides JC, Galochkina Z, et al. Characterization of long-term gait deficits in mouse dMCAO, using the CatWalk system. Behav Brain Res. 2017 Jul 28;331:282–296.
- Balkaya MG, Trueman RC, Boltze J, et al. Behavioral outcome measures to improve experimental stroke research. Behav Brain Res. 2018 Oct 15;352:161–171.
- Rommelfanger KS, Edwards GL, Freeman KG, et al. Norepinephrine loss produces more profound motor deficits than MPTP treatment in mice. Proc Natl Acad Sci USA. 2007 Aug 21;104(34):13804–13809.
- Kim D, Jeon H, Ryu S, et al. Proteomic analysis of the effect of Korean Red Ginseng in the striatum of a Parkinson’s disease mouse model. PLoS One. 2016;11(10):e0164906.
- Marvaldi L, Thongrong S, Kozłowska A, et al. Enhanced axon outgrowth and improved long-distance axon regeneration in sprouty2 deficient mice. Dev Neurobiol. 2015 Mar;75(3):217–231.
- Marvaldi L, Panayotis N, Alber S, et al. Importin α3 regulates chronic pain pathways in peripheral sensory neurons. Science. 2020;369:842–846. In press.
- Shiotsuki H, Yoshimi K, Shimo Y, et al. A rotarod test for evaluation of motor skill learning. J Neurosci Methods. 2010 Jun 15;189(2):180–185.
- Dror V, Eliash S, Rehavi M, et al. Neurodegeneration in thiamine deficient rats-A longitudinal MRI study. Brain Res. 2010 Jan 13;1308:176–184.
- Dror V, Rehavi M, Biton IE, et al. Rasagiline prevents neurodegeneration in thiamine deficient rats-a longitudinal MRI study. Brain Res. 2014 Apr 4;1557:43–54.
- Nardocci N, Zorzi G. Axonal dystrophies. Handb Clin Neurol. 2013;113:1919–1924.
- Mercer TJ, Gubas A, Tooze SA. A molecular perspective of mammalian autophagosome biogenesis. J Biol Chem. 2018 Apr 13;293(15):5386–5395.
- Kimura S, Noda T, Yoshimori T. Dissection of the autophagosome maturation process by a novel reporter protein, tandem fluorescent-tagged LC3. Autophagy. 2007 Sep-Oct;3(5):452–460.
- Stromhaug PE, Berg TO, Fengsrud M, et al. Purification and characterization of autophagosomes from rat hepatocytes. Biochem J. 1998 Oct 15;335(Pt 2):217–224.
- Menzies FM, Fleming A, Caricasole A, et al. Autophagy and neurodegeneration: pathogenic mechanisms and therapeutic opportunities. Neuron. 2017 Mar 8;93(5):1015–1034.
- Cullup T, Kho AL, Dionisi-Vici C, et al. Recessive mutations in EPG5 cause Vici syndrome, a multisystem disorder with defective autophagy. Nat Genet. 2013 Jan;45(1):83–87.
- Vantaggiato C, Crimella C, Airoldi G, et al. Defective autophagy in spastizin mutated patients with hereditary spastic paraparesis type 15. Brain. 2013 Oct;136(Pt 10):3119–3139.
- Seitelberger F. Neuropathological conditions related to neuroaxonal dystrophy. Acta Neuropathol. 1971;5(Suppl 5):17–29.
- Seitelberger F. Neuropathology of polyneuropathies. Wien Klin Wochenschr Suppl. 1984;147:3–5.
- Fraiberg M, Tamim-Yecheskel B-C, Kokabi K, et al. Lysosomal targeting of autophagosomes by the TECPR domain of TECPR2. Autophagy. 2020. DOI:https://doi.org/10.1080/15548627.2020.1852727. Submitted.
- McEwan DG, Popovic D, Gubas A, et al. PLEKHM1 regulates autophagosome-lysosome fusion through HOPS complex and LC3/GABARAP proteins. Mol Cell. 2015 Jan 8;57(1):39–54.
- Chen D, Fan W, Lu Y, et al. A mammalian autophagosome maturation mechanism mediated by TECPR1 and the Atg12-Atg5 conjugate. Mol Cell. 2012 Mar 9;45(5):629–641.
- Brooks SP, Pask T, Jones L, et al. Behavioural profiles of inbred mouse strains used as transgenic backgrounds. II: cognitive tests. Genes Brain Behav. 2005 Jul;4(5):307–317.
- Balogh SA, McDowell CS, Stavnezer AJ, et al. A behavioral and neuroanatomical assessment of an inbred substrain of 129 mice with behavioral comparisons to C57BL/6J mice. Brain Res. 1999 Jul 31;836(1–2):38–48.
- Deuis JR, Vetter I. The thermal probe test: A novel behavioral assay to quantify thermal paw withdrawal thresholds in mice. Temperature (Austin). 2016 Apr-Jun;3(2):199–207.
- Bradman MJ, Ferrini F, Salio C, et al. Practical mechanical threshold estimation in rodents using von Frey hairs/Semmes-Weinstein monofilaments: towards a rational method. J Neurosci Methods. 2015 Nov 30;255:92–103.
- Tang X, Orchard SM, Sanford LD. Home cage activity and behavioral performance in inbred and hybrid mice. Behav Brain Res. 2002 Nov 15;136(2):555–569.
- Fleming SM, Salcedo J, Fernagut PO, et al. Early and progressive sensorimotor anomalies in mice overexpressing wild-type human alpha-synuclein. J Neurosci. 2004 Oct 20;24(42):9434–9440.
- Fischer AH, Jacobson KA, Rose J, et al. Hematoxylin and eosin staining of tissue and cell sections. CSH Protoc. 2008 May 1;2008:pdbprot4986.