
ABSTRACT
Defects of autophagy-lysosomal protein degradation are thought to contribute to the pathogenesis of several neurodegenerative diseases, and the accumulation of aggregation prone proteins such as MAPT/Tau in Alzheimer disease (AD). We previously showed the localization of the immunophilin FKBP4/FKBP52 in the lysosomal system of healthy human neurons suggesting its possible role in lysosome function. We also showed that decreased FKBP4 levels in AD brain neurons correlate with abnormal MAPT accumulation and aggregation. In this study, we demonstrate that FKBP4 decrease in a human neuronal cell line (SH-SY5Y) and in dorsal root ganglion (DRG) neurons from human MAPTP301S transgenic mice affected the function of the autophagy-lysosomal system under MAPT induced proteotoxic stress conditions. We show that acute MAPT accumulation in SH-SY5Y cells induced perinuclear clustering of lysosomes, triggered FKBP4 localization around the clusters and its colocalization with MAPT and MAP1LC3/LC3-positive autophagic vesicles; a similar FKBP4 localization was detected in some AD brain neurons. We demonstrate that FKBP4 decrease altered lysosomal clustering along with MAPT and MAP1LC3 secretion increase. Although ectopic FKBP4 expression could not induce autophagy under our experimental conditions, it prevented MAPT secretion after MAPT accumulation in SH-SY5Y cells implying a regulatory role of FKBP4 on MAPT secretion. Finally, we observe that FKBP4 deficiency decreased MAP1LC3-II expression and provoked MAPT accumulation during long-term stress in mouse DRG neurons. We hypothesize that the abnormal FKBP4 decrease observed in AD brain neurons might hinder autophagy efficiency and contribute to the progression of the tauopathy by modulating MAPT secretion and accumulation during MAPT pathogenesis.
Abbreviations: AD: Alzheimer disease; AKT/protein kinase B: AKT serine/threonine kinase; ALP: Autophagy-lysosomal pathway; ATG: autophagy-related; BafA1: bafilomycin A1; CQ: chloroquine; CTSD: cathepsin D; DIV: days in vitro; DRG: dorsal root ganglion neurons; Dox: doxycycline; DNAJC5: DnaJ heat shock protein family (Hsp40) member C5; EL: empty lentiviral vectors; ENO2/NSE: enolase 2, gamma neuronal; FKBP4/FKBP52: FKBP prolyl isomerase 4; FTLD-Tau: frontotemporal lobar degeneration with Tau pathology; GFP: green fluorescent protein; LAMP1: lysosomal associated membrane protein 1; LDH: lactate dehydrogenase; MAP1LC3/LC3: microtubule associated protein 1 light chain 3; MAPT/Tau: microtubule associated protein tau; MTT: tetrazolium salt; NFTs: neurofibrillary tangles; RPE-1: retinal pigment epithelial cells; shRNA: small-hairpin ribonucleic acid; SQSTM1/p62: sequestosome 1; SD: standard deviation; SEM: standard error of the mean; SH-SY5Y: human neuroblastoma cells; Sh1 or Sh2: Lentiviral shRNA vectors inducing FKBP4 decrease; SH-52GFP: MAPT/Tau-inducible SH-SY5Y cell line constitutively expressing FKBP4-GFP; TUBB3/βIII tubulin: tubulin beta 3 class III; UPS: ubiquitin-proteasome system
Introduction
Maintenance of cellular homeostasis is necessary for neuronal survival, and disruption of cellular quality control is sufficient to cause neurodegeneration [Citation1–3]. The ubiquitin-proteasome system (UPS) and autophagy-lysosomal pathway (ALP) are two catabolic processes contributing to maintain cellular quality control [Citation4,Citation5]. Macroautophagy (hereafter called autophagy) is the prevalent ALP form and the major intracellular clearance system delivering autophagosomes to lysosomes for degradation and recycling of breakdown products [Citation6]. Autophagosomes consist of cytoplasmic material engulfed by a double membrane. Their formation is regulated by a set of highly conserved autophagy-related (ATG) genes, including initiators like BECN1 (beclin 1) and elongating factors such as MAP1LC3/LC3 [Citation7]. Autophagy is a selective process that regulates the degradation of damaged organelles, protein aggregates and pathogens with the contribution of several autophagy-specific receptor proteins such as SQSTM1/p62 [Citation8,Citation9]. Basal autophagy can be stimulated in adaptation to cellular stress, to degrade accumulated misfolded proteins and invading pathogens [Citation10]. Fusion of autophagosomes with lysosomes, i.e. the formation of autolysosomes, requires the regulated trafficking of these vesicles which depends of the microtubule network [Citation11]. In basal conditions, lysosomes are broadly and homogeneously distributed in cells whereas their distribution and motility change under some stress conditions inducing a perinuclear lysosome clustering [Citation12,Citation13]. Autophagosomes formed at the cell periphery under these conditions move centripetally, promoting efficient fusion with juxtanuclear lysosomes to degrade their contents [Citation13,Citation14]. In addition to its role in degradation, ALP has recently been demonstrated to participate to the unconventional secretion pathway of proteins such as DBI/Acb1 (diazepam binding inhibitor) or IL1B/IL-1β (interleukin 1 beta) by a process called exophagy [Citation15–17]; this phenomenon might imply the fusion of autophagic vesicles (AVs) with the plasma membrane [Citation18,Citation19].
Growing evidence has linked lysosomal dysfunction and accumulation of aggregation-prone proteins to the pathogenesis of several neurodegenerative diseases such as MAPT/Tau proteins accumulation in Alzheimer disease (AD) [Citation20,Citation21]. MAPT proteins are widely expressed in the central nervous system, predominantly in neurons where they play a key role in regulating microtubule dynamics, axonal transport and neurite outgrowth [Citation22,Citation23]. Pathological MAPT is abnormally hyperphosphorylated and aggregated into paired helical filaments forming neurofibrillary tangles (NFTs). These intraneuronal deposits are a well-known feature of several neurodegenerative disorders called tauopathies, which include AD [Citation24,Citation25]. In AD, the formation of NFTs starts in the entorhinal cortex to successively spread to the hippocampus and later on to the cortical areas [Citation26], correlating with the observable cognitive defects of the disease [Citation27]. Recent studies have demonstrated that aggregated MAPT can propagate wild-type MAPT aggregation, thus showing prion-like properties [Citation28,Citation29]. It is thought that MAPT pathology is induced by the release of MAPT and its spread across the brain from neuron to neuron [Citation30,Citation31]. MAPT is known to be degraded by the UPS and by ALP depending on its post-translational modifications, level of aggregation, mutation variants and its interaction with chaperone proteins [Citation20,Citation32]. Indeed the accumulation and subsequent aggregation of MAPT, is believed to be a consequence of ALP dysfunction [Citation33,Citation34].
The data obtained so far by our team show a physical and functional interaction between a neuronal protein named FKBP4/FKBP52 (FKBP prolyl isomerase 4) and MAPT. FKBP4 is a peptidyl-prolyl cis trans isomerase implicated in the folding and function of its target proteins [Citation35]. Besides its enzyme activity, FKBP4 also displays a chaperone activity [Citation36]. Biochemical characterization of FKBP4 has demonstrated an antagonistic effect on tubulin assembly induced by MAPT [Citation37]. Our recent studies show that FKBP4 protein expression is strongly reduced in the frontal cortex of AD and FTLD-Tau (frontotemporal lobar degeneration with Tau pathology) brains and that this decrease is highly correlated with the accumulation and aggregation of pathological MAPT [Citation38]. We have successively reported that the residual FKBP4 in AD neurons colocalizes with ALP markers in association with early pathological truncated MAPT forms, suggesting that FKBP4 could be involved in autophagic MAPT clearance [Citation39].
Here, we demonstrate in different cellular models that FKBP4 decrease affected the function of the autophagy-lysosomal system under MAPT-induced proteotoxic stress conditions. We observed that an acute MAPT accumulation in neuroblastoma cells stimulated lysosomal coalescence and recruitment of FKBP4 in proximity of the perinuclear lysosomal cluster. Under these conditions, we showed that FKBP4 decrease altered the lysosomal positioning, induced a diminution of intracellular MAP1LC3-II expression and stimulated MAPT and MAP1LC3 secretion. Even if FKBP4 was unable to stimulate autophagy under our conditions, its ectopic expression inhibited extracellular MAPT release thus suggesting a regulatory role of FKBP4 on MAPT secretion. Finally, we observed an impact of FKBP4 decrease on MAP1LC3-II expression and insoluble MAPT accumulation during long-term stress in DRG neurons from human MAPTP301S transgenic mice. These observations suggest an implication of FKBP4 in MAPT behavior during MAPT-induced proteotoxic stress.
Results
FKBP4 deficiency altered the expression of the SQSTM1 substrate in human epithelial (RPE1) and neuronal (SH-SY5Y) cell lines
To investigate the impact of FKBP4 on autophagy function, we modulated FKBP4 expression levels using lentiviral vectors transduction in two different cell types (RPE1 and SH-SY5Y) that display different basal autophagy levels (Figure S1A) and analyzed variations of SQSTM1, BECN1 and MAP1LC3 expression [Citation40]. ShRNA-treated cell lysates (referred to as Sh1 cells) displayed strongly decreased FKBP4 levels by 91.5 ± 1.5% in RPE1 and 91 ± 2.7% in SH-SY5Y compared to control cells treated with an empty lentiviral vector (referred to as EL cells) (± SEM, n = 6, ***P ≤ 0.001) (). There was no difference in SQSTM1 expression between EL and lentivirus untreated cells (referred to as CTL, 100%), nevertheless we detected an increase of SQSTM1 in Sh1 cells (170 ± 8% in SH-SY5Y) compared with EL cells (111 ± 3.5%) (± SEM, n = 6, **P ≤ 0.01, *P ≤ 0.05). Similar results were obtained with RPE1 cells () or with a different shRNA directed against FKBP4 (referred to as Sh2 cells) in both cell types (Figure S1B). Knowing that SQSTM1 transcriptional synthesis could be active after autophagy induction under different forms of stress (i.e., oxidative stress, proteasomal inhibition, etc.), we also checked SQSTM1 gene expression levels by real-time quantitative PCR analysis (). As shown in , no change of SQSTM1 mRNA levels was detected in both RPE1 and SH-SY5Y Sh1 cells compared with control EL cells suggesting that FKBP4 decrease does not stimulate SQSTM1 synthesis but rather prevents its degradation reflecting a possible autophagy dysfunction. No difference in BECN1 expression was detected between EL and Sh1 cells (). The measure of soluble MAP1LC3-I conversion to lipid bound MAP1LC3-II, which corresponds to the formation of autophagosomes, showed a slight increase of MAP1LC3-II in EL cells (130 ± 10.8% in SH-SY5Y; ± SEM, *P ≤ 0.05) compared to CTL (100%) suggesting an increase of autophagosome formation after lentiviral incubation (). Similar results have been obtained in RPE1 cells. In Sh1 cells, MAP1LC3-II levels tended to decrease in both RPE1 and SH-SY5Y cell types, though not quite significantly (P = 0.1 and P = 0.056 respectively), when compared to control EL cells. In contrast, lentiviral transduction of the vector encoding FKBP4 showed that its increase (7-fold) did not affect MAP1LC3-II and SQSTM1 levels, indicating that only a deficiency of FKBP4 can influence the expression of SQSTM1, thus excluding a direct FKBP4 involvement in autophagy induction (Figure S1C).
Figure 1. FKBP4 decrease modulated MAP1LC3-II and SQSTM1 expression in RPE-1 and SH-SY5Y cells. (A) Representative western-blot analysis of FKBP4, MAP1LC3 and SQSTM1 levels in shRNA-treated cell lysates (n1 and n2). ACTB/actin was used as loading control. CTL: untreated cells; EL: empty lentivirus; Sh1: shRNA directed against FKBP4. n = 6 experiments. Quantification of immunoblot signal was normalized to ACTB and expressed as the mean ± SEM of the values normalized to the CTL condition. Statistical analysis was performed using Student’s t-test **p < 0.01 and ***p < 0.001. (B) Quantitative real-time PCR analysis of SQSTM1 mRNA levels. An equal amount of mRNA level relative to controls (CTL and EL) was detected in Sh1 cells. (C) Autophagy flux measurement. Representative western-blot analysis showing FKBP4 and MAP1LC3 levels in lysates of cells treated or not with shRNA (CTL, EL, Sh1) with or without autophagy inhibitor BafA1 (25 nM, 2 h). Quantification of MAP1LC3-II signal was normalized to ACTB. Statistical analysis was performed using Student’s t-test *p < 0.05 and **p < 0.01, n = 4. Abbreviations: BafA1, bafilomycin A1; N.S., not significant; PCR, polymerase chain reaction; shRNA, small hairpin RNA; SEM, standard error of the mean
In order to estimate the autophagic flux (see explanatory sketch in Figure S2A) by western-blot, we measured the total MAP1LC3-II amount under each condition with or without autophagy inhibition with bafilomycin A1 (BafA1). As expected, cell treatment with BafA1 (CTL/BafA1) increased MAP1LC3-II amount corresponding to undegraded autophagosomes (366 ± 13% in SH-SY5Y; **P ≤ 0.01) compared to untreated control cells (CTL, 100%) (). BafA1 treatment of EL cells also increased MAP1LC3-II level to a higher extent (up to 500 ± 44% of the CTL; *P ≤ 0.05 compared to the level measured in CTL/BafA1) confirming a slight increase of autophagosome formation induced by the lentiviral vectors. In Sh1 cells, the treatment with BafA1 (Sh1/BafA1) did not significantly modulate MAP1LC3-II levels in comparison to EL/BafA1 in both cell types showing that FKBP4 decrease does not stimulate autophagy. Analogous results have been obtained in RPE1 cells (). Immunofluorescence analysis of MAP1LC3, performed with a specific validated antibody (see Figure S2B), and SQSTM1 signals in Sh1 cells did not show a clearly detectable difference with EL cells excepting a partial increase of a diffuse SQSTM1 signal in both cell lines. Sometimes we observed a peculiar pattern of the MAP1LC3 signal resembling tubulo-vesicular structures [77], particularly in RPE1 but much less in SH-SY5Y cells (Figure S2C). In summary, our findings indicate that FKBP4 deficiency induced by lentiviral infection increased the cellular level of SQSTM1 in two different cell types.
The absence of FKBP4 caused a decrease of intracellular MAP1LC3-II expression and stimulated MAPT and MAP1LC3 secretion during MAPT-induced proteotoxic stress
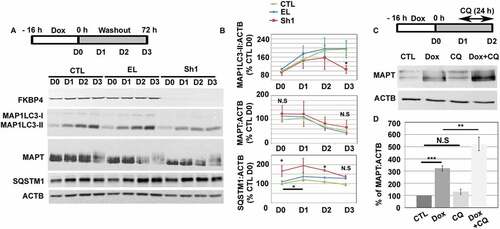
To investigate the implication of FKBP4 in stress-mediated autophagy induction, we analyzed the clearance of MAPT, an AD-relevant lysosomal target, using a MAPT-inducible neuroblastoma cell line (SH-SY5Y) [Citation41,Citation42]. MAPT expression was induced for 16 h with doxycycline (Dox) and SH-SY5Y cells were maintained for three days after withdrawal of Dox (See scheme ). During this 3-day period, cellular MAPT contents decreased by 49% and 57% in CTL and EL cells respectively (D0-D3, ). In parallel, the MAP1LC3-II content increased to reach a plateau at D3 both in CTL (100% to 194%) and EL (108% to 197%) (D0-D3, ). We also detected an increase of SQSTM1 at D1 (CTL: 120% and EL: 138%), followed by its decrease (CTL: 97% and EL: 128% at D3). Finally, we observed that MAPT decrease is in part due to its degradation by lysosomes as lysosomal inhibition at D2 with chloroquine (CQ), a weak base that concentrates in lysosomes and inhibits lysosomal proteases, induced an accumulation of MAPT proteins (). Altogether these observations suggested progressive MAPT degradation by an autophagy-lysosomal pathway after MAPT accumulation in Dox-treated cells.
Figure 2. The absence of FKBP4 generated a decrease of intracellular MAP1LC3-II during MAPT proteotoxic stress in SH-SY5Y cells. (A) Western-blot of FKBP4, MAP1LC3, SQSTM1 and MAPT levels in shRNA-treated cells for three days (D0-D3) after doxycycline (Dox) washout. ACTB was used as loading control. (B) Quantification of immunoblot signals normalized to ACTB at each day (D0-D3), n = 4 experiments, error bars represent means ± SEM. (C) Representative western-blot analysis of MAPT level in Dox-treated SH-SY5Y cells after cell treatment with CQ (20 µM, 24 h). Cells were treated at D1 and cell lysates analyzed at D2 (see schema). (D) Quantification of immunoblot signal for MAPT was normalized to ACTB. Statistical analysis was determined by Student’s t-test **p < 0.01 and ***p < 0.001; n = 5, ± SEM. Abbreviations: CQ, chloroquine; N.S, not significant; ShRNA, small hairpin RNA; SEM, standard error of the mean
In Sh1 cells, we detected at first an increase of MAP1LC3-II (94% to 157% from D0 at D2; red line ) suggesting that FKBP4 depletion did neither inhibit autophagosome formation nor stimulate MAP1LC3 expression compared to controls. In contrast, we observed a significantly lower level of MAP1LC3-II at D3 (106% ± 17%; ± SEM, *P ≤ 0.05) compared to both controls (CTL, 194%; EL, 197%), suggesting an implication of FKBP4 deficiency in MAP1LC3-II decrease over time. Although SQSTM1 expression increased at D0 (166% ± 27%; ± SEM, *P ≤ 0.05) to reach 194% at D1, it progressively decreased afterward, in parallel to MAP1LC3-II, to finally attain 135% at D3 (red line ). Unexpectedly, the MAPT signal did not accumulate over time in Sh1 cells (D0-D3, 124% to 67%, red line ) compared to controls (D0-D3; CTL, 100% to 51%; EL, 114% to 43%). This result evoked the possibility that MAPT loss might occur through another clearance pathway. We thus investigated the possible involvement of the UPS in absence of FKBP4. Sh1 cells treatment with the UPS inhibitor epoxomicin failed to induce the accumulation of overexpressed MAPT in comparison to untreated Sh1 cells suggesting that MAPT is not degraded through this clearance pathway in absence of FKBP4 (Figure S3A and B).
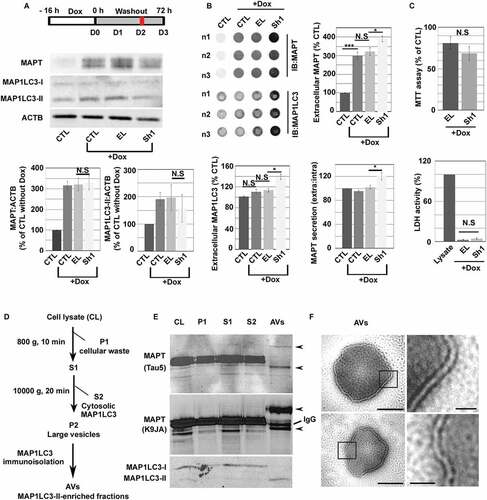
Since recent studies have implicated autophagy in MAPT secretion [Citation43], we have also measured the presence of MAPT in the extracellular medium during the same experiments (). As reported, we observed that intracellular MAPT accumulation (CTL+Dox, ) is always associated to extracellular MAPT increase (, 300%±19%; ± SEM, ***P ≤ 0.001;CTL (100%)) [Citation44]. We could not detect a significant difference in MAPT levels in the cell medium between CTL and EL cells after Dox treatment (300 ± 18% and 323%±19% respectively). Although no difference was detected in intracellular MAPT level between EL and Sh1 cells (), we observed an increase of MAPT expression in the Sh1 cell medium (390% ± 15%; ± SEM, *P ≤ 0.05, compared to EL cells (). Quantification of extracellular MAPT normalized to intracellular MAPT in Sh1 cells showed an increase of MAPT secretion in absence of FKBP4 (120% ± 6%, ) when compared to EL cells (102% ± 3%). Extracellular MAP1LC3 levels were the same in Dox-treated (110 ± 4%) and untreated CTL cells (101 ± 2%) suggesting that the secretion of overexpressed MAPT was not correlated to MAP1LC3 secretion (). On the contrary, we observed an increase of MAP1LC3 parallel to the release of MAPT in the medium of Sh1 cells (139% ± 5%; ± SEM, *P ≤ 0.05) compared to EL cells (113% ± 3.3%). Moreover, decrease or increase of FKBP4 in cells not overexpressing MAPT did not stimulate MAP1LC3 secretion (Figure S3C and D). These observations indicate that, in absence of FKBP4, MAPT secretion increased along with the secretion of the autophagosome marker MAP1LC3 during MAPT-induced proteotoxic stress. To exclude the possibility that MAPT or MAP1LC3 might be released as a consequence of cell death, cell number and membrane integrity were evaluated by MTT and LDH assays (). No significant difference was detected between EL and Sh1 cells. Finally, AVs immuno-isolation from FKBP4-deficient cells lysates confirmed that MAPT was detectable in these vesicular structures suggesting a possible MAPT secretion through AVs (–F). Interestingly, we detected an upper and lower band of MAPT from purified AVs suggesting the accumulation of post-translationally modified MAPT such as truncated, phosphorylated or ubiquitinated forms (). Transmission electron microscopy (TEM) showed that the purified vesicles exhibited double membrane structures characteristics of autophagosomes (). In summary, our observations indicate that FKBP4 depletion generated a decrease of intracellular MAP1LC3-II levels over time and stimulated MAPT and MAP1LC3 secretion under MAPT proteotoxic stress conditions.
Figure 3. The absence of FKBP4 stimulated MAPT and MAP1LC3 secretion during MAPT proteotoxic stress. (A) Representative western-blot analysis of intracellular MAPT and MAP1LC3 levels in Dox-treated SH-SY5Y cells at D2 after doxycycline (Dox) washout. Quantification of immunoblot signal was normalized to ACTB. Error bars represent means ± SEM. (B) Representative triplicate (n1-n3) dot-blot image showing MAPT and MAP1LC3 signals in extracellular medium at D2 for control (CTL), CTL+Dox, EL+Dox and Sh1+ Dox cells. Dot-blot signals for MAP1LC3 and MAPT (extracellular and extra/intra) were quantified, n = 3 experiments, statistical analysis was determined by Student’s t-test *p < 0.05 and ***p < 0.001; NS: not significant. Error bars represent means ± SEM. (C) Cell viability was measured by MTT and LDH assays. (D) AVs immunoisolation from FKBP4-deficient cells lysates (CL). CL was centrifuged 10 min at 800 g to eliminate cellular waste (P1). The supernatant (S1) was then centrifuged 20 min at 10,000 g to obtain large vesicles (P2) and remove cytosolic MAP1LC3 (S2). P2 was then incubated with anti-MAP1LC3 antibodies and immunoisolated to provide MAP1LC3-II enriched fractions (AVs). (E) Representative western-blot analysis of MAPT and MAP1LC3 signals. MAPT was detected in AVs fractions (black arrows) with a mouse monoclonal (Tau5) and a rabbit polyclonal (K9JA) antibody respectively. IgG: heavy chains. (F) Transmission electron micrographs showing immunoisolated AVs exhibiting double membrane structures. Scale bar: 500 nm (100 nm in magnifications). Abbreviations: AVs, autophagic vacuoles; Dox, doxycycline; EL, empty lentivirus; Sh1, small hairpin RNA inducing FKBP4 decrease; SEM, standard error of the mean
MAPT overexpression in SH-SY5Y cells stimulated perinuclear lysosomal positioning and induced delocalization of FKBP4 in proximity of a lysosomal cluster
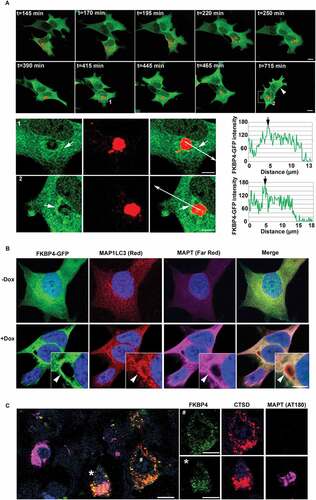
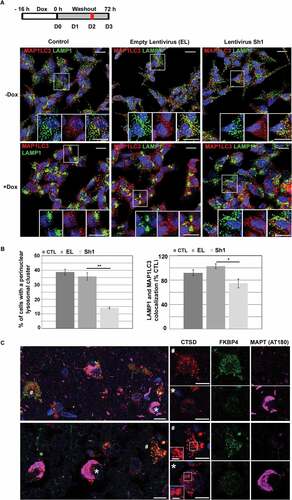
To investigate the localization of FKBP4 under MAPT proteotoxic stress conditions, we generated from MAPT-inducible SH-SY5Y cells a new cell line (called SH-52GFP) that constitutively expressed FKBP4-GFP. These cells were transiently transfected to express the lysosomal associated membrane protein (LAMP1) fused with an RFP in order to monitor the movement of lysosomes in live cells by time-lapse fluorescence microscopy. At early time points after MAPT induction, time-lapse imaging showed the coalescence of individual lysosomes into small intracytoplasmic clusters which later merged into a larger perinuclear cluster (). It has been reported that lysosomal repositioning reflects an increase of their intraluminal pH [Citation45] and is often observed during different disruptive events such as starvation [Citation13], aggresome formation [Citation46] or during unfolded protein response after endoplasmic reticulum stress [Citation47]. Our observations suggested that in this context, MAPT degradation was initiated by perinuclear lysosomal positioning following intracellular MAPT accumulation (Video S1). Under our experimental conditions, lysosomal clustering took approximately two hours. During the stress-activated lysosomal positioning, FKBP4-GFP showed a diffuse cellular localization, however after the maximal lysosome compaction, we could observe an accumulation of FKBP4 in the proximity of the perinuclear lysosomal cluster (, Video S2), these observations were also confirmed by the analysis of FKBP4-GFP fluorescence intensity at different time points (t = 415 min and t = 715 min). As shown by the arrowhead, this FKBP4 concentration was also observed in a neighboring cell devoid of exogenous LAMP1 expression demonstrating a general effect of MAPT accumulation on FKBP4 delocalization and excluding a possible effect of LAMP1 expression. This particular pattern of FKBP4 accumulation near the lysosomal cluster observed by time lapse imaging persisted for at least 24 h (Video S2). Immunofluorescence analysis after Dox treatment clearly showed an increase of MAPT expression and its global distribution throughout the cell with a noticeable colocalization with the accumulated FKBP4 in a juxtanuclear position (, arrowheads). The colocalization of MAPT and FKBP4 in this region was also associated with an accumulation of AVs as shown by MAP1LC3 labeling. Immunohistofluorescence analysis of AD brains revealed a great heterogeneity of neuronal MAPT, FKBP4 and lysosomal expression (). Colocalization between FKBP4 and a lysosomal cluster could be observed in some neurons with pathological MAPT accumulation (AT180) (see the asterisk *) whereas other neurons, devoid of pathological MAPT deposits, showed a normal lysosomal distribution (see the cross #). We also could observe in AD brains the presence of some highly altered neurons on exhibiting very low levels of FKBP4 and CTSD (shown on the left of the image). In accordance with these observations in AD brains, our data suggested a functional role of FKBP4 in the perinuclear lysosomal environment after MAPT-induced proteotoxic stress and thus a possible implication of FKBP4 in MAPT degradation through lysosomal pathways.
Figure 4. FKBP4 concentration close to a perinuclear lysosomal cluster after MAPT overexpression in SH-SY5Y cells. (A) Time-lapse imaging of MAPT-inducible SH-SY5Y cells constitutively expressing FKBP4-GFP and transiently expressing LAMP1-RFP. Confocal images (Z = 0.4 µm thick single plane) starting from t = 145 min to t = 715 min after MAPT induction by Dox (t = 0) showing lysosomal clustering in a perinuclear area and FKBP4 concentration around the lysosomal cluster. LAMP1-RFP negative cells exhibiting a similar FKBP4 concentration are indicated by a white arrowhead. The FKBP4-GFP fluorescence intensity was analyzed at two different time points (see magnification at t = 415 min (1) and t = 715 min (2)). FKBP4-GFP accumulation is shown by white arrows. The fluorescence profile confirms the increase of FKBP4-GFP intensity in a perinuclear lysosomal cluster (see white and black arrows). Scale bar: 5 µm. (B) Images after double immunofluorescent labeling for MAP1LC3 (Red) and MAPT (Far Red) in cells expressing FKBP4-GFP after 24 h of MAPT induction by Dox. FKBP4 colocalization with MAP1LC3 and MAPT is indicated by white arrowhead. Scale bar: 5 µm. Blue indicates DAPI-stained nuclei. (C) Confocal analysis of FKBP4 (EPR6618, green), CTSD (C-20, red) and pathological MAPT (AT180, magenta) immunolabeling of frontal cortex tissue sections from AD brains. Some neurons show pathological MAPT accumulation (*) and exhibit FKBP4 concentration in close proximity to a lysosomal cluster, whereas some neurons, without MAPT accumulation (#), show normal distribution of lysosomes and FKBP4. We observe on the left the presence of a neuron with a strong MAPT accumulation showing low levels of FKBP4 and CTSD. Scale bar: 10 µm. Abbreviations: Dox, doxycycline
The absence of FKBP4 altered perinuclear lysosomal positioning during MAPT-induced proteotoxic stress
We then evaluated by immunofluorescence analysis whether the FKBP4 decrease during MAPT proteotoxic stress might generate modifications in lysosome (LAMP1) and autophagic (MAP1LC3) vesicles morphology and repartition (). Two days after MAPT induction with Dox (D2), we clearly detected the presence of lysosomal clustering in the perinuclear region, often at high density (38.8% ± 2.1% of cells, ± SD; , see magnification) whereas lysosomes and AVs were normally distributed throughout the control cells. We defined as a lysosomal cluster the coalescence of several lysosomes into a compact structure adjacent to the nuclear envelope (See asterisks in Figure S4). This observation confirmed the impact of MAPT overexpression on lysosomal positioning already detected by time lapse imaging (). While no significant difference in the proportion of cells that displayed compact lysosomal clusters was observed between control and EL cells (35.8% ± 2.6%, ± SD), the occurrence of lysosomal perinuclear clusters decreased in Sh1 cells (14% ± 0.65%; ± SD, **P ≤ 0.01; ), suggesting an implication of FKBP4 in perinuclear lysosomal positioning in response to MAPT proteotoxic stress. In control cells, the LAMP1-positive lysosomal clusters often colocalized with MAP1LC3 positive autophagic vesicles close to the nuclei (, see magnification). In Sh1 cells the decrease of lysosomal clustering was associated with a reduced colocalization between lysosomes (LAMP1) and AVs (MAP1LC3) in the whole cytoplasm (74% ± 12%; ± SD, *P ≤ 0.05; ) compared to control EL cells (102% ± 6%; ± SD) suggesting a decrease of autolysosomes. In normal conditions, FKBP4 overexpression in SH-SY5Y cells using lentiviral transduction did not promote lysosomal clustering thus excluding a role of FKBP4 on its own in determining lysosome position (Figure S5). The latter finding suggested that FKBP4 influence on lysosome positioning only occurred during MAPT-induced proteotoxic stress. Finally, as previously described [Citation39], we still observed in AD brain neurons that low FKBP4 levels are often correlated with lysosomal abnormalities (strong decrease of CTSD signals, lysosomal dispersion and enlarged lysosomes accumulation; ) suggesting a possible involvement of FKBP4 decrease in these alterations. Altogether, our observations indicated that the absence of FKBP4 interfered with perinuclear lysosomal positioning thus impacting on the number of autolysosomes during MAPT-induced proteotoxic stress.
Figure 5. Absence of FKBP4 generated an alteration of lysosomal positioning during MAPT-induced proteotoxic stress in SH-SY5Y cells. (A) Immunofluorescence analysis of MAP1LC3 (red) and LAMP1 (green) of SH-SY5Y cells treated or not by Dox treatment two days after MAPT induction (D2) in control and lentivirus-treated cells (EL and Sh1). Autophagosomes (red vesicles) and lysosomes (green vesicles) are numerous and homogeneously distributed in control neurons while MAPT induction by Dox treatment induces lysosomal clustering (see magnifications). Scale bar: 10 µm. (B) Quantification of Dox-treated cells with a perinuclear lysosomal cluster (histogram in the left) in control (n = 5, 2984 cells), in EL (n = 5, 3041 cells) and Sh1 (n = 5, 2761 cells) cells. Statistical analysis was performed using Student’s t-test (**p < 0.01 ± SD). Quantification of LAMP1 and MAP1LC3 colocalization (autolysosomes) in the whole cytoplasm of Dox-treated cells. Statistical analysis was determined by Student’s t-test (*p < 0.05 ± SD). Blue indicates DAPI-stained nuclei. (C) Confocal analysis of CTSD (C-20, red), FKBP4 (EPR6618, green) and pathological MAPT (AT180, magenta) immunolabeling of frontal cortex tissue sections from AD brains. Some neurons show pathological MAPT accumulation (*) and lysosomal abnormalities (decrease of CTSD signals, upper; accumulation of enlarged lysosomes, bottom) whereas some neurons, without MAPT accumulation (#), show normal labeling and normally sized lysosomes. Scale bar: 10 µm (2.5 µm in magnification). Abbreviations: Dox, doxycycline; SD, standard deviation
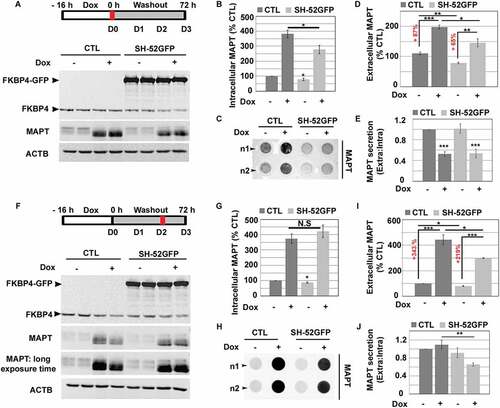
FKBP4 increase inhibited MAPT secretion after MAPT accumulation in SH-SY5Y cells
To test the impact of ectopic FKBP4 expression on MAPT clearance during MAPT proteotoxic stress, we induced MAPT expression in SH-SY5Y cells overexpressing FKBP4-GFP (SH-52GFP cells; 13-fold higher FKBP4 expression) and analyzed the intra and extracellular MAPT levels. At the beginning of MAPT induction (D0), we detected a slight decrease of intracellular MAPT in SH-52GFP cells (SH-52GFP/Dox, 78% ± 8%; *P ≤ 0.05, n = 6, ) compared to SH-SY5Y cells (CTL/Dox, 100%). The same MAPT diminution was observed in untreated SH-52GFP cells (81% ± 7%; ± SEM, *P ≤ 0.05, n = 6) compared to control SH-SY5Y cells (CTL, 100%) suggesting an implication of FKBP4 in MAPT clearance. Although MAPT was clearly detected in the extracellular space after MAPT induction by Dox (CTL/Dox, 197% ± 6.6%; ***P ≤ 0.001, n = 5, ) with a difference of about 87% compared to CTL cells (110% ± 5%), we observed that the ectopic expression of FKBP4 limits extracellular MAPT levels in SH-52GFP/Dox cells (145% ± 13%; **P ≤ 0.01) with a difference of about 65% in comparison to SH-52GFP cells (80% ± 2%). Quantification of extracellular MAPT normalized to intracellular MAPT in SH-SY5Y cells showed that intracellular MAPT was more abundant after MAPT induction by Dox at D0 compared to CTL (CTL/Dox, MAPT (extra/intra) < 1; ***P ≤ 0.001, ). Similar results were obtained in SH-52GFP suggesting that increased levels of FKBP4 did not modulate MAPT secretion induced by MAPT overexpression at D0 in SH-SY5Y cells. Interestingly, after two days of MAPT induction (D2), we detected a modest, albeit non-significant, intracellular MAPT accumulation in SH-52GFP/Dox cells (106% ± 2%, n = 6) when compared to CTL/Dox cells (100%) whereas we could still detect a decrease of MAPT in untreated SH-52GFP cells compared to CTL (). Moreover, we observed that MAPT secretion in Dox-treated SH-52GFP cells (219% difference between SH-52GFP/Dox and SH-52GFP cells) was strongly decreased compared to similarly treated CTL cells (343% difference between CTL/Dox and CTL cells) (). Quantification of extracellular MAPT normalized to its intracellular levels in CTL showed that MAPT repartition between intra and extracellular compartments was equivalent after MAPT induction by Dox at D2 (CTL/Dox, MAPT (extra/intra) = 1 in comparison to CTL; N.S, ) suggesting an equilibrium of MAPT levels between extra and intracellular spaces over time. On the contrary, in SH-52GFP at D2, intracellular MAPT was more abundant compared to CTL/Dox (MAPT (extra/intra) < 1; **P ≤ 0.01, ) showing the inhibitory effect of FKBP4 overexpression on MAPT secretion and its ability to maintain MAPT inside the cells after inducing MAPT overexpression. Altogether, our data implied a regulatory role of FKBP4 on MAPT secretion.
Figure 6. FKBP4 overexpression inhibited MAPT secretion after MAPT accumulation in SH-SY5Y cells. (A) Representative western-blot analysis of FKBP4 and MAPT levels at D0 in SH-SY5Y and SH-52GFP cells treated or not by Dox. (B) Quantification of the western-blot signal of intracellular MAPT and FKBP4 was normalized to ACTB. Statistical analysis was performed using Student’s t-test *p < 0.05; ± SEM. (C) Representative duplicate (n1-n2) dot-blot image showing MAPT signal in extracellular medium at D0 for CTL, CTL+Dox, SH-52GFP and SH-52GFP +Dox cells. (D) Dot-blot quantification. Statistical analysis was determined by Student’s t-test *p < 0.05, **p < 0.01 and ***p < 0.001; ± SEM. (E) Quantification of extracellular MAPT normalized to intracellular MAPT (***p < 0.001; ± SEM). (F) Representative western-blot analysis of FKBP4 and MAPT levels at D2 in SH-SY5Y and SH-52GFP cells treated or not by Dox. (G) Quantification of the western-blot signal of intracellular MAPT and FKBP4 was normalized to ACTB. Statistical analysis was performed using Student’s t-test *p < 0.05; N.S, ± SEM. (H) Representative duplicate (n1-n2) dot-blot image showing MAPT signal in the extracellular medium at D2. (I) Dot-blot quantification for MAPT in extracellular medium at D2. Statistical analysis was determined by Student’s t-test *p < 0.05, ***p < 0.001; ± SEM. (J) Quantification of extracellular MAPT normalized to intracellular MAPT (**p < 0.01; ± SEM). Abbreviations: CTL, control; Dox, doxycycline; N.S: not significant; SEM, standard error of the mean
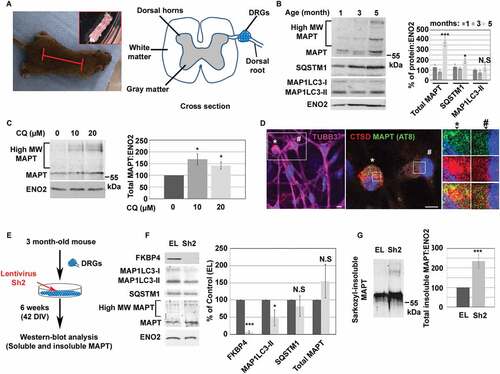
FKBP4 decrease induced insoluble MAPT accumulation during long-term MAPT-induced proteotoxic stress in DRG neurons from human MAPTP301S transgenic mice
As FKBP4 depletion did not trigger detectable intracellular MAPT accumulation during a short-lived and acute MAPT proteotoxic stress, we decided to investigate the impact of FKBP4 on autophagy and MAPT accumulation under a longer progression of MAPT pathology using cultured Dorsal Root Ganglion (DRG) neurons from the MAPTP301S transgenic mouse model [Citation48,Citation49]. DRGs are clusters of sensory neuron cell bodies dissected from the dorsal roots of the spinal cord of adult MAPTP301S mice () which develop MAPT aggregates over time similarly to those found in human tauopathies [Citation49]. Western-blot analysis of DRG (5 DIV) lysates obtained from 1 to 5 month-old mice showed an accumulation of MAPT bands at ~55 kDa and also at higher molecular weight in lysates from 5 month-old-mice (). This increase of MAPT expression was also accompanied by an increase of SQSTM1 whereas no variations of MAP1LC3-II were detected over time. Lysosomal inhibition of 5 month-old DRGs (5 DIV) with CQ induced an accumulation of MAPT proteins () and we detected by immunofluorescence a colocalization of pathological MAPT (AT8, green) with lysosomes (CTSD, red) in DRG neurons with the greater AT8 MAPT accumulation (, neurons detected by TUBB3/βIII tubulin stained in magenta). We noted the presence of several lysosomal clusters distributed in the cytoplasm in some AT8 positive-neurons suggesting a partial lysosomal compaction different from the more compact lysosomal clusters observed in SH-SY5Y cells during an acute MAPT proteotoxic stress. Altogether these observations suggested that MAPT was in part degraded through the ALP in MAPTP301S DRG neurons. In order to analyze the impact of FKBP4 decrease in this cellular model of tauopathy, DRG neurons were dissected from 3 month-old mouse and cell culture were maintained for 42 DIV (). During these 6 weeks period, Sh2-treated cell lysates displayed a strong decrease of FKBP4 levels by 93.2 ± 3.7% compared to control EL cells (100%; ± SEM, n = 5, ***P ≤ 0.001) (). In parallel, the MAP1LC3-II content decreased of about 53% ± 23% (± SEM, *P ≤ 0.05) whereas no difference was detected in SQSTM1 expression between EL and Sh2 cells. We did not detect a significant soluble MAPT accumulation in Sh2 cells compared to EL cells, however we clearly detected an increase of Sarkozyl-insoluble MAPT expression of about 235% ± 33% in Sh2 cells compared to EL cells (± SEM, n = 5, ***P ≤ 0.001) (). In summary, our observations indicate that FKBP4 depletion modulated MAP1LC3-II expression levels and generated insoluble MAPT accumulation during MAPT-induced long-term stress in DRG neurons.
Figure 7. FKBP4 decrease triggered insoluble MAPT accumulation in a neuronal model of tauopathy using mice transgenic for the human MAPTP301S. (A) Images showing the region where the spinal cord was collected from the mouse (red lines) and the spinal cord sample (top right). The drawing illustrates a cross section of the spinal cord; the cluster of sensory neuron cell bodies (DRGs) situated on the dorsal root of the spinal cord is drawn in blue. (B) Representative western-blot analysis of MAPT, SQSTM1 and MAP1LC3 levels in mouse DRGs (5 DIV) at different ages (month). MAPT electrophoretic profile shows MAPT bands at ~55 kDa and also at higher molecular weight (High MW MAPT). Neuron specific enolase (ENO2/NSE) is used as loading control. Quantification of the western-blot signal of total MAPT (MAPT at ~55 kDa + High MW MAPT), SQSTM1 and MAP1LC3-II was normalized to ENO2. Statistical analysis was performed using Student’s t-test; n = 4, *p < 0.05 and ***p < 0.001; ± SEM. (C) Representative western-blot analysis of MAPT in 5 month-old DRG neurons after treatment with CQ at 10 or 20 µM (24 h). Quantification of the western-blot signal of total MAPT (MAPT at ~55 kDa + High MW MAPT) was normalized to ENO2. Statistical analysis was performed using Student’s t-test, n = 4; *p < 0.05; ± SEM. (D) Images after triple immunofluorescent labeling for CTSD (C-20, red), pathological MAPT (AT8, green) and TUBB3 (Neuronal marker, magenta) in 5 month-old DRG neurons (5 DIV). Two DRG neurons, identified by TUBB3 labeling (image on the left, * and #), were magnified and analyzed for their CTSD and MAPT AT8 signals. The neuron with pathological MAPT accumulation (AT8, green) showed a partial colocalization of MAPT at the periphery of a lysosomal cluster (red) (see the asterisk *) whereas the neuron with lower levels of pathological MAPT showed a normal lysosomal distribution (see the cross #). Scale bar: 5 µm. Blue indicates DAPI-stained nuclei. (E) DRGs dissection from 3 month-old mice. DRG neurons were collected from MAPTP301S mice spinal cords, dissociated and cultured. After 5 days of culture, DRGs were transduced at MOI 20 for five days and maintained during 42 DIV (6 weeks). Soluble and sarkozyl-insoluble fractions of cell lysates were analyzed by western-blot. (F) Representative western-blot analysis showing FKBP4, MAP1LC3, SQSTM1 and total MAPT (MAPT at ~55 kDa + High MW MAPT) levels in lysates of cells treated or not with shRNA (EL, Sh2). ENO2 was used as loading control. Quantification of the western-blot protein signal was normalized to ENO2. Statistical analysis was performed using Student’s t-test; n = 4, *p < 0.05 and ***p < 0.001; ± SEM. (G) Representative western-blot analysis of sarkozyl-insoluble fractions of MAPT (MAPT at ~55 kDa + High MW MAPT) in lysates of cells treated or not with shRNA (EL, Sh2). Quantification of total MAPT was normalized to ENO2. Statistical analysis was performed using Student’s t-test; n = 4, ***p < 0.001; ± SEM. Abbreviations: CQ, chloroquine; DIV: days in vitro; MW: molecular weight; N.S: not significant; SEM, standard error of the mean
Discussion
Our previous studies showed a localization of FKBP4 in the lysosomal system of healthy human neurons suggesting its possible role in lysosome function. Moreover, we reported that FKBP4 levels are abnormally low in AD brains in correlation with abnormal MAPT accumulation and aggregation. In this study, we showed in a human neuronal cell line and in DRG neurons from mice transgenic for the human MAPTP301S mutation that FKBP4 deficiency impacted on the function of the ALP under MAPT-induced proteotoxic stress conditions. We observed in SH-SY5Y cells that FKBP4 concentrated around a juxtanuclear lysosomal cluster after MAPT accumulation while its decrease altered lysosomal positioning and stimulated MAPT and MAP1LC3 secretion. Increased FKBP4 expression in SH-SY5Y cells could not by itself induce autophagy; however, our experimental results indicated that it could reduce intracellular MAPT levels and prevent MAPT secretion. We also found that FKBP4 decrease triggered MAP1LC3-II diminution and insoluble MAPT accumulation during long-term stress in DRG neurons obtained from human MAPTP301S transgenic mice. These observations suggested that the diminution of FKBP4 we detected in AD neurons might be relevant to the progression of the tauopathy, both by hindering correct lysosomal positioning and by facilitating MAPT release in the extracellular space during short-lived and acute MAPT proteotoxic stress but also by triggering insoluble MAPT accumulation under a longer progression of MAPT pathology.
FKBP4 implication in the autophagy process
FKBPs are known to be localized in different cellular compartments and to be involved in several cellular processes including protein folding, protein trafficking and transcription [Citation50,Citation51]. In this study we showed that FKBP4, a member of the large FKBPs family, was involved in efficient ALP function in neurons. Notably, we observed a post-transcriptional increase of SQSTM1 in absence of FKBP4 suggesting a lack of degradation of this protein and an autophagy dysfunction. Nevertheless, under MAPT induced proteotoxic stress, we could not detect the same effect on intracellular MAPT accumulation suggesting a specific impact of FKBP4 decrease on SQSTM1 accumulation under our conditions. The latter hypothesis might be explained by a possible involvement of FKBP4 in SQSTM1 translation or a possible FKBP4 interaction with SQSTM1 modulating its capacity to load proteins into autophagosomes and then its self-degradation by autophagy. In contrast to this finding, we could not detect variation of SQSTM1 expression in MAPTP301S DRG neurons lacking FKBP4; the impact of FKBP4 on SQSTM1 expression might depend on the cell type studied or on the intensity and timescale of the cellular stress. Aside from these observations, our results showed that FKBP4 deficiency impacted on autophagy: 1) during acute MAPT-induced proteotoxic stress by modulating lysosomal clustering and stimulating abnormal secretion of MAP1LC3 and 2) during progressive MAPT proteotoxic stress by decreasing MAP1LC3-II expression and triggering an abnormal MAPT accumulation.
Recent studies have reported an involvement of other FKBPs in autophagy. Indeed, it has been reported that FKBP5/FKBP51, a close homolog of FKBP4, is able to increase BECN1 and MAP1LC3-II levels, to promote the AKT-BECN1 association leading to BECN1 dephosphorylation and to enhance autophagy activation [Citation52]. Under our experimental conditions, FKBP4 decrease impacted on MAP1LC3-II and SQSTM1 levels but did not modulate BECN1 expression (see ) and we failed to activate autophagy after ectopic FKBP4 expression (Figure S1) showing different mechanisms of action for these FKBPs. Furthermore, FKBP8/FKBP38, a smaller FKBP, interacts with MAP1LC3 and recruits it to damaged mitochondria in order to trigger their elimination by autophagy [Citation53]. Besides their implications in protein folding and trafficking, some members of the FKBP family including FKBP4 are involved in cellular homeostasis at least by participating in the ALP clearance of altered proteins and/or damaged organelles. Whether FKBP4 is involved in autophagy triggered by other kinds of stress requires further investigation.
FKBP4 localization to a perinuclear lysosomal cluster during MAPT-induced proteotoxic stress
Lysosomes are highly dynamic organelles that can move rapidly and coalesce at the perinuclear region to carry out cargo degradation by autophagy [Citation12,Citation13]. Here we show that MAPT-induced proteotoxic stress promoted the accumulation of FKBP4 in close proximity to a perinuclear lysosomal cluster and that, under these stress conditions, FKBP4 deficiency altered lysosomal positioning. Lysosome movement toward the peripheral membrane and the nucleus is mediated by kinesin and dynein motors respectively [Citation54,Citation55]. It has been reported that FKBP4 is implicated in the retrograde transport of numerous proteins such as steroid hormone receptors [Citation56], the tumor suppressor p53 [Citation57] and the human telomerase reverse transcriptase [Citation58] through an interaction with the dynein complex. We hypothesized that this role of FKBP4 might be also extended to the retrograde lysosomal transport also known to be orchestrated by dynein. This hypothesis is supported by the observation that FKBP4 overexpression did not activate autophagy; the basal expression of endogenous FKBP4 might thus be sufficient for efficient lysosomal transport and autophagy function during MAPT proteotoxic stress. Besides this hypothesis, we cannot exclude the possibility that FKBP4 might be involved in lysosomal perinuclear sequestration known to be controlled by endosomal reticulum-lysosomal contacts [Citation59] even taking into account that FKBP4 was not able by itself to determine lysosome positions (Figure S5). A similar FKBP4 lysosomal localization was observed in AD brain neurons with the difference that FKBP4 labeling showed a strong colocalization pattern with lysosomes rather than an accumulation around lysosomal clusters as observed in Dox-treated SH-SY5Y cells (). This discrepancy might depend on the different cell types studied; one fast growing cell type is cultured in vitro while the other is a long-lived component of a multicellular tissue. Several studies already suggest that astrocyte-neuron signaling regulates neuronal homeostasis and autophagy [Citation60]. The impact of neuronal interactions with the complex brain cellular environment might modulate the propensity of FKBP4 to localize with lysosomes. Also, we cannot exclude the possibility that FKBP4-GFP over-expression in the SH-SY5Y cells we used in our study might have strongly accentuated the aggregated pattern of FKBP4 around lysosomal cluster which was less detectable in neurons from brain with physiological FKBP4 expression. Nevertheless, our results demonstrated that FKBP4 was still localized within a lysosomal cluster environment during a MAPT proteotoxic stress in both types of neuronal cells suggesting its potential implication in this process.
Our study demonstrated that (1) MAPT overexpression in MAPT-inducible SH-SY5Y cells induced lysosomal clustering correlated with progressive MAPT decrease, (2) MAPT was in part contained in AVs and colocalized with these MAP1LC3II-positive vesicles in proximity of a lysosomal cluster, and (3) MAPT increased after lysosomal inhibition altogether suggesting a degradation of MAPT by autophagy. In accordance with our observations, others have reported degradation of accumulated MAPT through autophagy in different MAPT-inducible cell lines as blocking autophagy resulted in elevated intracellular MAPT levels [Citation42,Citation61]. On the other hand, recent studies also show that stable MAPT overexpression in HEK293 cells induces an autophagy deficit by blocking autophagosome-lysosome fusion [Citation62]. These discrepancies might be due to differences between MAPT constructs expression, the timescale of MAPT induction and accumulation, the cell lines used or the different techniques used to induce MAPT overexpression, which would cause differences in MAPT accumulation, MAPT aggregation and in autophagy efficiency.
FKBP4 could not by itself stimulate autophagy in SH-SY5Y cells, however FKBP4 increase reduced overexpressed MAPT (D0, ) and retained intracellular MAPT for two days (D2, ) suggesting a role of FKBP4 in MAPT retention and metabolism which is independent of an increase of autophagy. In our previous studies, we have shown that FKBP4 can modulate MAPT oligomerization in vitro, depending on the state of MAPT, and especially involving truncated MAPT forms [Citation63,Citation64]. On the other hand, we detected a colocalization of FKBP4 with a truncated MAPT form (MAPT∆D421) in ALP of AD brain neurons with a signal often situated at the perinuclear region [Citation39]. Knowing that ALP is a major protein degradation pathway involved in the clearance of protein aggregates, we hypothesize that FKBP4 might be implicated in the oligomerization process of MAPT in a lysosomal cluster environment. This might probably happen through cooperation with other proteins including chaperones such as Hsp90 in order to allow stressed cells to degrade efficiently an abnormal accumulation of MAPT proteins through the ALP. Besides its involvement in lysosomal positioning, FKBP4 might also act at different stages to synergistically promote MAPT degradation through lysosomal pathways, and its action might possibly be not limited to MAPT degradation. Considering that FKBP4 is known to be a co-chaperone of Hsp90 [Citation65], we cannot exclude the possibility that this protein, in this lysosomal environment, might be also implicated in chaperone-mediated autophagy which consists in the degradation of soluble cytosolic proteins targeted to lysosomes and directly translocated across the lysosomal membrane for degradation [Citation66] but this possible implication in MAPT degradation remains to be elucidated.
Role of FKBP4 in MAPT protein secretion and accumulation
In order to be secreted proteins take alternative routes to reach the cell surface and be released in regulated fashion [Citation67]. Recent studies have shown that MAPT could be secreted by exocytosis in correlation with ALP impairment [Citation43,Citation68]. Some studies have shown that alpha-synuclein, an aggregation-prone protein implicated in the pathogenesis of Parkinson disease, could be abnormally secreted through exophagy after impairment of autophagy [Citation69]. Here we showed that FKBP4 deficiency disrupted lysosomal positioning, lysosomal colocalization with MAP1LC3-positive vesicles and stimulated MAPT and MAP1LC3 secretion in MAPT-induced SH-SY5Y cells. Also, we detected the presence of MAPT in AVs isolated from FKBP4-deficient cells. These observations suggested a possible implication of FKBP4 in MAPT secretion by exophagy after abnormal MAPT accumulation. Vesicles coupled to kinesin and dyneins including lysosomes are regulated to allow alternative functions in anterograde and retrograde transport respectively; we hypothesize that a possible unbalance in this traffic partially caused by FKBP4 decrease might favor the anterograde transport of vesicles thus increasing the secretion of MAP1LC3-positive vesicles such as autolysosomes which would be consistent with our observations. Whether FKBP4 is implicated in the positioning of vesicles other than lysosomes under these stress conditions still remains to be analyzed.
In our experiences, we failed to detect MAPT secretion from MAPTP301S DRG neurons. On the other side, we observed that the absence of FKBP4 in MAPTP301S DRG neurons induced an accumulation of insoluble MAPT over time. The different metabolism of SH-SY5Y and DRG neuronal cell-types might explain the dissimilarity observed concerning MAPT metabolism. Moreover, the low expression of MAPT proteins and their slow and progressive accumulation over time in DRG neurons compared to SH-SY5Y cells might also explain why we failed to detect MAPT in the extracellular medium of DRG neurons. Also, under experimental conditions, SH-SY5Y neurons formed thin sheets of cells in culture whereas DRG neurons formed big cellular clusters mimicking the original ganglia (Figure S6). Given this tendency of cultured DRG neurons to form thick clusters, we cannot exclude the possibility that MAPT secretion from cells buried under several layers might be undetectable when compared to SH-SY5Y cells secretion. In light of the emerging concept of prion-like propagation of MAPT aggregation from cell to cell [Citation70,Citation71], we propose that pathological MAPT in DRG neurons might propagate MAPT accumulation in neighboring cells, especially in absence of FKBP4, through a similar mechanism depending on cell proximity and connectivity. This hypothesis would explain the apparent discrepancy between MAPT release and MAPT aggregation observed in different types of FKBP4-deficient neurons.
It has been recently reported that another cochaperone such as DNAJC5, complexed with the chaperone HSPA8/Hsc70, promotes extracellular MAPT release [Citation72]. Here we found that FKBP4 expression in MAPT-induced SH-SY5Y cells was inversely correlated with MAPT secretion levels suggesting the implication of cochaperone-dependent mechanisms in MAPT release where FKBP4 shows an effect opposite to DNAJC5; further studies are needed to clarify whether these effects might occur through a common signaling pathway. Finally, stable knock down of FKBP9, a gene coding for another FKBP protein (FKBP63), in a neuroblastoma-derived cell line induced a significant increase of prion propagation [Citation73]. In accordance with our findings, these observations suggest a possible implication of FKBPs in aggregation-prone protein secretion and spreading.
FKBP4 decrease in Alzheimer disease
In the current study, we showed in different cellular models that FKBP4 decrease under MAPT proteotoxic stress impacted on both ALP function and MAPT secretion or accumulation. We hypothesize that lysosomal clustering alterations and the stimulation of MAPT secretion observed in absence of FKBP4 after induction of an acute MAPT proteotoxic stress in SH-SY5Y cells might also happen during a prolonged MAPT proteotoxic stress as in AD neurons and gradually promote abnormal MAPT accumulation and MAPT spreading into the brain. Indeed, we observed that in MAPTP301S DRG neurons, a model characterized by a slowly progressing MAPT pathology, the decrease of FKBP4 led to the intracellular accumulation of insoluble MAPT over time. The pathological MAPT present in some FKBP4-deficient DRG neurons might propagate MAPT aggregation and accumulation in neighboring cells through a possible MAPT prion-like mechanism depending on cell proximity and connectivity as it is believed to happen in AD brains. We also observed by multiple labeling confocal microscopy on AD brain sections that FKBP4-deficient neurons exhibited MAPT aggregates and often showed marked lysosomal abnormalities such as a strong decrease of CTSD signals and the presence of enlarged lysosomes dispersed in the cytoplasm. The anomalies of the lysosomal network detected in FKBP4 deficient AD neurons in situ were more severe than those observed in our cellular models devoid of FKBP4, and very likely occurred in synergy with other factors. Indeed, FKBP4 decrease is only one of the many factors implicated in AD MAPT pathogenesis. All in all, our findings both in cellular models and in AD neurons supported the hypothesis that the abnormal decrease of FKBP4 might contribute, over time, to the MAPT pathogenesis in AD brains.
In conclusion, we showed that acute MAPT accumulation in SH-SY5Y cells stimulated lysosomal positioning and induced FKBP4 delocalization in proximity of a perinuclear lysosomal cluster. Under these stress conditions, FKBP4 deficiency had an impact on autophagy through an alteration of normal lysosomal positioning and stimulated MAPT and MAP1LC3 release into the extracellular space, implying a regulatory role of FKBP4 on MAPT secretion. We demonstrated that the diminution of FKBP4 triggered insoluble MAPT accumulation in a neuronal model of tauopathy from MAPTP301S transgenic mice. Knowing the involvement of MAPT accumulation and secretion in MAPT pathogenesis and propagation in AD brains, our data support the idea that preventing FKBP4 decrease or restoring its normal expression in AD neurons might be a new potential therapeutic approach to slow down progression of MAPT pathology.
Materials and methods
Antibodies, chemicals, and plasmids
Monoclonal mouse anti-FKBP4/FKBP52 (EC1) and anti-MAPT/Tau (Tau5) were from Enzo Life Sciences and Calbiochem, respectively. Rabbit monoclonal anti-FKBP4 (EPR6618) was from Epitomics. Monoclonal mouse anti-SQSTM1 (ab56416) and rabbit polyclonal anti-TUBB3/βIII tubulin (ab18207) were from Abcam. Monoclonal mouse anti-ACTB/actin (A1978) and polyclonal rabbit anti-SQSTM1 (P0067) and Xylene substitute (A5597) were from Sigma-Aldrich. Polyclonal rabbit anti-MAPT/(K9JA), anti-MAP1LC3 (2775) and anti-MAP1LC3 (NB100-2220) were from Dako, Cell signaling Technology and Novus Biologicals, respectively. Monoclonal mouse anti-LAMP1 (H4A3) and polyclonal goat anti CTSD/cathepsin D (C20) were from Santa Cruz Biotechnology. Monoclonal mouse anti-human PHF-MAPT clone AT180 (MN1040), clone AT8 (MN1020) and Sea Block Blocking Buffer (37527) were from ThermoScientific. Millipore Autofluorescence Eliminator Reagent was from Millipore Temecula (2160). Cells were transfected using the FuGENE 6 transfection reagent (Promega, E2693). Donkey anti-mouse (A21202, A31570, A31571), rabbit (A21206, A31572, A31573) and goat IgG (H + L) (A32814, A32816, A32849) secondary antibodies labeled with Alexa Fluor 488, 555 and 647 by Life Technologies were purchased from Molecular Probes. Doxycycline (NC0424034) was purchased from Clontech. Chloroquine (C6628), bafilomycin A1 (B1793) and epoxomicin (E3652) were purchased from Sigma-Aldrich.
Animal model
Transgenic mice homozygous for the human MAPTP301S mutation [Citation48] were used to collect DRG neurons at different ages. This mouse line, expressing the 383 amino acid isoform of human MAPT, displays a severe tauopathy phenotype characterized by severe paraparesis and a significant reduction in the number of motor neurons in the spinal cord at 5 months of age. Cultured DRG neurons can be maintained for a long term (2 months) and can recapitulate the development of pathological forms of MAPT similar to those found in human tauopathies. Approval of the Inserm regional committee for animal experimentation, as established by the Scientific Research Ministry on January 1992, was previously obtained. Obligations required by the n° 86/609 European directive for use of laboratory animals were also observed.
Human brain tissues
Brain samples from Alzheimer patients of comparable age and post mortem delay were obtained from the Brain Bank GIE NeuroCEB (). The samples were collected under a Brain Donation Program funded by a consortium of Patients Associations: ARSEP (association for research on multiple sclerosis), CSC (cerebellar ataxias), France Alzheimer and France Parkinson. The informed consents were signed by the patients themselves or their next of kin in their name, in accordance with the French Bioethical Laws. The Brain Bank GIE NeuroCEB has been authorized to provide samples for research by the Ministry of Higher Education and Research (agreement AC-2013-1887). A randomly left or right brain hemisphere was fixed in buffered 4% formaldehyde. Samples taken from several regions were embedded in paraffin and cut at 5-µm thickness for staging: AD cases were diagnosed according to the National Institute of Aging and Reagan Institute Criteria [Citation74].
Table 1. List of cases studied in immunohistofluorescence
DRGs culture and extraction
DRG neurons were collected from MAPTP301S mice spinal cords (as described in [Citation75]) and dissociated with collagenase (ThermoFisher Scientific,17100–017) 2900 U/mL during 90 min followed by 0.1% trypsin (Life Technologies, 15090–046) 3 mM EDTA containing DNaseI (50 µg/mL; Sigma-Aldrich, 04536282001) for 5 min. Cell treatment was stopped using 1X PBS (VWR, X0515-500) supplemented with 2% horse serum (ThermoFisher Scientific, 16050–122), and DRG neurons were dissociated with a Pasteur pipette. Cells were then centrifuged for 5 min at 1,300 g and the pellet was resuspended in DMEM (Fisher Scientific, 12077549) with 9% fetal bovine serum. After filtration on a 0.40 µm filter followed by centrifugation 5 min at 1,300 g, the pellet was resuspended in neurobasal medium complemented with B27 (50X), L-glutamine (100X) (Life Technologies, 11530536 and 25030024 respectively), NGF 2.5 S (27 ng/mL; ThermoFisher, 13257–019) and distributed in 2 wells of a 6-well culture plate. Cell cultures were maintained for 5 or 42 days in vitro (DIV) and the cell medium complemented with mitomycine C (Sigma-Aldrich, M4287) and 5-Fluoro-deoxy-uridine (Sigma-Aldrich, F0503) was changed twice a week. Cells were harvested by scraping, centrifuged for 10 min at 200 g and the pellet was homogenized using Potter-Elvehjem 18 in cold extraction buffer (50 mM Tris-HCl, pH 7.5, 100 mM NaCl, 0.5% SDS, 2 mM CaCl2, 2 mM MgCl2) supplemented with a cocktail of protease and phosphatase inhibitors (Roche, 11836145001). Cell lysates were then centrifuged 10 min at 17,000 g, the supernatant (soluble fraction) was kept and the pellet was homogenized using Potter-Elvehjem 18 in cold extraction buffer supplemented with 1% sarkosyl (Sigma-Aldrich, L9150). Lysates were then centrifuged in a polycarbonate tube (Beckman, 343775) at 100,000 g during 40 min at 4°C. The pellet (sarkozyl insoluble fraction) was boiled in Laemmli sample buffer for 10 min. The samples were analyzed by western-blot.
Small hairpin RNA, DNA constructs and cell transduction
Protein depletion through small hairpin RNA (shRNA) was mediated using the target sequences for FKBP4 5′ GCATGGAGAAAGGAGAACATT 3′ (Sh1, TRCN0000152554/PLKO.1, targeting human FKBP4 expression only, Sigma, France) and 5′ CGCAAGGACAAATTCTCCTTT 3′ (Sh2, TRCN0000280603/PLKO.1, targeting human and mouse FKBP4 expression, Sigma) (Gene ID no.2288). The cDNA encoding human FKBP4 was inserted into the restriction site of the 197 plasmid (pRRLsin-MND-MCS-Ires2-ZsGreen-WPRE, Vectorology platform Vect’UB, U1035 Inserm, Bordeaux) to obtain the concomitant expression of FKBP4 and GFP proteins. Lentiviruses containing shRNAs or the cDNA coding for FKBP4 were generated at the vectorology platform Vect’UB (U1035 Inserm, Bordeaux). SH-SY5Y and RPE-1 cells were transduced with lentiviruses at a multiplicity of infection (MOI) 3 during five days. DRG neurons were transduced at MOI 20 during five days. Knockdown or overexpression was assessed by western blotting.
Cell line and DNA transfection
Cell Culture. RPE1 cells were cultivated in DMEM Glutamax (Fisher Scientific, 12077549) containing an antibiotic-antifungal mixture and supplemented with FBS 10% (vol:vol; Invitrogen, 11550356) at 37°C in 95% O2:5% CO2. MAPT -inducible neuroblastoma SH-SY5Y cells were cultivated as described previously [Citation41]. Cells were treated with doxycycline to induce MAPT hT34 overexpression. The isoform MAPT hT34 contains 4 repeats in the microtubule domain, and lacks the second insertion in the N terminus. Cell transfection. SH-SY5Y cells were transiently transfected with 1 µg of plasmid expressing a GFP-MAP1LC3 using 3 µl Fugen6 (Promega, E2693) according to the manufacturer’s protocol and utilized 24 h after transfection. For LAMP1-RFP expression, SH-52GFP cells were incubated with 5 µl of CellLight® Lysosomes-RFP (BacMam 2.0; ThermoFisher Scientific, C10504) and utilized 24 h after transduction.
Generation of the SH-52GFP cell line
The cDNA encoding FKBP4 was inserted into the XhoI and SalI sites of pEGF-C3 (Clontech, 632426); transfection of pEGF-FKBP4 was carried out in MAPT-inducible neuroblastoma SH-SY5Y cells using Lipofectamine 2000 (Invitrogen, 11668027). Stably transfected cells were selected using G418 (Sigma-Aldrich, A1720) and screened individually.
Immunohistofluorescence (IHF)
Formalin fixed paraffin-embedded human brain samples were sectioned at 8 µm in thickness. Sections were mounted on superfrost + slides (Fisher Scientific, 12134682). After paraffin removal with successive baths in xylene substitute (Sigma-Aldrich, A5597) for 5 min and three baths in absolute alcohol (Dutscher, 4146082), the sections were rehydrated in 70% alcohol, rinsed in demineralized water and subjected to conventional microwave antigen retrieval in Ph6 citrate buffer. After PBS (VWR, X0515-500) washing, and block with Seablock buffer (ThermoFisher Scientific, 37527) the sections were then incubated overnight with the primary antibody in a humid chamber at 4°C, and successively with appropriate donkey anti-mouse, goat, or rabbit secondary antibodies labeled with Alexa Fluor 488, Alexa Fluor 555 or 546, or Alexa Fluor 647 (Invitrogen, A32723; A32816; A32733) at a concentration of 1,6 µg/ml for 60 min at room temperature. Pre-immune mouse (Jackson ImmunoResearch, 711005152), rabbit (Merck, 12–370) and goat immunoglobulins were used in place of the primary antibodies as negative controls (for double and triple labeling experiments, overnight primary antibody incubations were repeated serially with successive appropriate secondary antibody incubations). After antibody incubation and washing, lipofuscin autofluorescence was quenched with Millipore Autofluorescence Eliminator Reagent (Millipore, 2160) according to the manufacturer’s instructions. The slides were then mounted with Fluoroshield mounting medium (Southern Biotech, 0100–01) with DAPI (ThermoFisher Scientific, 62247) and examined with a Leica TCS SP8 confocal microscope with Z-stack imaging.
Immunofluorescence and confocal microscopy analyses
SH-SY5Y cells were grown on 12-well tissue-culture plates and plated at 2.104 cells/well. Collected DRG neurons from one adult mouse were distributed in 6 wells of a 12 well culture plates. Cells were washed 2 times with 1X PBS (VWR, X0515-500) for 1 min and then fixed with cold methanol at −20°C for 5 min (SH-SY5Y) or with 4% PFA (Merck, 104005) for 10 min at room temperature (DRG). After blocking with Sea Block blocking buffer (SBBB; 1:10; ThermoFisher Scientific, 37527) in 1X PBS for 1 h at room temperature, cells were incubated with the following primary antibodies diluted in 1X PBS SBBB (1:10): Anti-MAP1LC3 (1:250, Cell Signaling Technology, 2775), anti-LAMP1 H4A3 (1:250; Santa Cruz Biotechnology, sc20011), anti-SQSTM1 (1:500; Sigma-Aldrich, P0067), anti-MAPT K9JA (1:1000; Dako, A0024), anti-phospho MAPT AT8 (1:100; ThermoFisher Scientific, MN1020), anti-CTSD/CathD C-20 (1:400; Santa Cruz Biotechnology, sc-6486) or anti-TUBB3/βIII tubulin (1:2000, Abcam, ab18207), overnight at 4°C, followed by staining with Alexa Fluor 488/555/633-conjugated secondary antibody (Life Technologies, A21202, A31570, A31571; 1:2000) for 45 min at 37°C. Nuclei were stained with DAPI. The coverslips were examined by epifluorescence under a Leica SP8 confocal microscope. Images were processed using ImageJ FIJI, 3D Viewer software.
Lysosomal cluster counting
Immunofluorescence analysis of MAP1LC3 and LAMP1 expression in SH-SY5Y cells was performed with a Pannoramic 250 Flash III digital scanner (3DHISTECH Ltd). Images were analyzed by CaseViewer (3DHISTECH Ltd software) and the cells with clustered lysosomes were counted and quantified. The coalescence of several lysosomes into a compact structure in close proximity with the nuclear envelope was counted as a lysosomal cluster (See asterisks in Figure S4).
Time-lapse imaging and fluorescence profile
SH-52GFP cells were grown on 8-well microscopy chambers (iBidi, Biovalley, 80826), plated at 1.104 cells/well and then treated with doxycycline 0.5 µg/ml. Time-lapse confocal microscopy of SH-52GFP cells was performed in a live cell imaging chamber at 37°C with 5% CO2. Confocal images were acquired every 50 seconds up to 24h duration of on a Leica TCS SP8 confocal microscope with a 63x immersion objective (Z = 6, physical length 2.0 µm). Videos were cropped (Z = 1, physical length 0.4 µm) and their contrast was adjusted with Leica LAS X software. The fluorescence profile was evaluated on a confocal image (Z = 0.4 µm) using the FIJI freeware image analysis program. The intensity of fluorescence in the green channel was measured along a line segment.
QPCR
For PCR analysis, RNA extraction was performed using RNeasy Plus Mini kit (Qiagen, 74134). RNAs were treated with DNAseI (Sigma-Aldrich, 04536282001) according to manufacturer’s instructions. Reverse Transcription (RT) was performed using High Capacity cDNA Reverse Transcription Kit (ThermoFisher Scientific, 4374966), according to manufacturer’s instructions. Quantitative real-time PCR (qPCR) was performed using Power SYBR-Green Master Mix (ThermoFisher Scientific, 4367659) on an Applied 7300 Real-Time PCR system.
Primers used were: ACTB fwd: 5ʹAGCTACGAGCTGCCTGACG3ʹ, ACTB Rev: 5ʹTAGTTTCGTGGATGCCACAGG3ʹ; SQSTM1 fwd: 5ʹCATCGGAGGATCCGAGTGTG3ʹ, SQSTM1 Rev: 5ʹTTGGCTGTGAGCTGCTCTTCT3ʹ.
MAPT decay in lentivirus treated SH-SY5Y cells
Cells were grown on a 6-well tissue-culture plate and plated at 2.105 cells/well, transduced or not (CTL) with lentiviruses (EL or Sh1) at MOI 3 during five days and then treated or not with 0.05 µg/ml Doxycycline for 16 h. Cells were then washed with PBS 1x, detached and centrifuged at 1,200 g during 5 min, then the pellet was resuspended in 10 ml of medium. 1 ml of cells was added to three wells (D1, D2 and D3) in three different 6-well tissue-culture plates (CTL, EL and Sh1). The last ml was centrifuged at 1,200 g during 5 min and the pellet was conserved at −20°C (D0). Cell culture supernatants were harvested, centrifuged 20 min at 1,000 g, boiled in presence of 0.5% SDS (Sigma-Aldrich, L4509) and submitted to dot-blot assay. Each day, cells at D1 to D3 of culture were harvested, centrifuged and conserved in the same way as for D0 cells.
MAPT-overexpression in SH-SY5Y and SH-52GFP cells
SH-SY5Y and SH-52GFP cells were grown on 6-well tissue-culture plates, plated at 2.105 cells/well and treated or not with doxycycline for 16 h at 0.05 µg/ml. At D0, cell culture supernatants were harvested, cells were then washed with 1X PBS and fresh medium was added. Two days after, cell culture supernatants were harvested for D2, centrifuged 20 min at 1,000 g, boiled in the presence of 0.5% SDS and submitted to dot-blot assay. Cells were washed with 1X PBS, centrifuged and pellets were submitted to western-blot analysis.
Western blotting
Cells were washed with PBS and resuspended in lysis buffer (50 mM Tris-HCl, pH 7.5, 100 mM NaCl, 0.5% SDS, 2 mM CaCl2 and 2 mM MgCl2) supplemented with a protease and phosphatase inhibitors cocktail (Roche, 11836145001). Cell lysates were centrifuged at 17,000 g for 10 min at 4°C, and the soluble fractions were collected. After assessment of protein concentration, performed using a BCA protein assay kit (ThermoFisher Scientific, 23225), each sample was boiled in Laemmli sample buffer for 5 min, analyzed on a 10% SDS Page gel and transferred onto iBlot™ Gel Transfer membranes (Invitrogen, IB23001, IB24002). Following transfer, membranes were incubated overnight with the appropriate antibodies. Species specific, peroxidase conjugated, secondary antibodies were subsequently used to perform enhanced chemiluminescence (ThermoFisher Scientific, 32106). Images were recorded with the GeneGnome5 (Syngene). Quantification was performed using Genetools analysis software (Syngene).
MTT and LDH cytotoxicity assays
Cells were plated at 2.105 cells/well in 6-well tissue-culture plates, transduced with lentiviruses at MOI3 during five days and then treated or not with Doxycycline for 16 h at 0.05 µg/ml. Thereafter, cells were detached and plated at 9.104 cells/well in 12-well tissue-culture plates. The extracellular medium was harvested after two days and analyzed by LDH cytotoxicity according to the manufacturer’s instructions (ThermoFisher Scientific, 88954). At the same time, MTT (Sigma Aldrich, M5655) was added to cells at the final concentration of 0.5 mg/ml and cells were incubated for 4 h at 37°C in the dark. After incubation, 500 µl of acidified isopropanol (40 mM HCl) per well was added for 1 h at 37°C. Cells lysates were then centrifuged at 9,000 g for 5 min and absorbance values of supernatant were measured at 570 nm (SpectraMax Reader).
Dot-blot assay
Volumes of supernatant, according to lysate protein concentration (indicating the number of cells), were applied onto the nitrocellulose membrane and washed with 1X PBS −0.1% Tween 20 (Sigma-Aldrich, P1379) (PBS-T). After blocking with 5% nonfat milk in PBS-T at room temperature, the membranes were incubated with the appropriate antibodies. Dot-blots were incubated with HRP-labeled secondary antibodies (Jackson ImmunoResearch, 115–035-146, 111–035-144). The presence of the proteins of interest was revealed by ECL. Quantitation was performed with Genetools analysis software (Syngene).
Autophagosome immunoisolation
Autophagic vesicles were purified as described [Citation76] from FKBP4-deficient cells using anti-MAP1LC3 antibodies (Novus Biologicals, NB100-2220). Briefly, cells were homogenized in 2 ml of cold sucrose buffer (0.25 M sucrose, 1 mM EDTA, 20 mM HEPES, pH 7.4) by ten passages through a 22-gauge needle. To eliminate cellular waste, cell lysates were centrifuged at 800 g for 10 min. The supernatant was further centrifuged at 10,000 g for 20 min in order to collect the fraction containing big vesicles. The pellets were washed twice in washing buffer (1X PBS, pH 7.4, 0.1% bovine serum albumin (Sigma-Aldrich, A4503), 2 mM EDTA) to remove residual cytosolic MAP1LC3, suspended in 1X PBS with 2 mM EDTA and 3% bovine serum albumin and incubated with an anti-MAP1LC3 antibody (Novus Biologicals, NB100-2220) at 1:25 dilution overnight at 4°C. The unbound antibodies were removed by centrifugation at 10,000 g for 20 min. The pellet was than washed and resuspended in PBS buffer, followed by its incubation with the prewashed G-sepharose resin (Sigma-Aldrich, P3296) for 3 h at 4°C. After 3 washes with 1X PBS at 800 g for 2 min, AVs were heated in Laemmli buffer at 100°C for 5 min and subjected to western-blot analysis or eluted by pH shift and examined by transmission electron microscopy.Citation77
Transmission electron microscopy (TEM)
The resin-bound AVs were eluted by pH shift using 100 mM glycine, NaoH pH 10 and then neutralized with 1 M MES pH 7.5 (10% v:v). 5 µl of the sample were placed on a Formvar 400 mesh hexagonal grid (Pelannes Instruments, FCF400-Ni-50) for 5 min. The sample on the grid was stained with uranyl acetate 2% for 1 min. Excess stain was removed by blotting the edge of the grid with filter paper. Grids were observed with a Jeol 1011 transmission electron microscope. Acquisitions were performed with an Erlangshen charge-coupled device camera (Gatan, Pleasanton, CA, USA) by use of Digital Micrograph software.
Statistical analysis
Statistical analysis was performed using one-way variance analysis (Student’s t test) comparing the mean of percentages (± S.E.M. for WB and ± S.D for immunofluorescence) of at least three independent experiments. Level of significance: N.S. not significant; P values <0.05 were considered statistically significant. The statistics were obtained with Statistica software.
Supplemental Material
Download Zip (260.8 MB)Acknowledgments
The authors would like to thank the vectorology platform of Bordeaux University (Vect’UB, TransBioMed) for lentiviral vectors production. We are grateful to the national Brain Bank GIE NeuroCEB for providing us with the human brains of AD patients and to Pr. C. Duyckaerts (Laboratoire de Neuropathologie Escourolle, Hôpital de La Salpêtrière, AP-HP, Paris) for assessment and staging of the brain samples and helpful discussions. We also wish to thank Dr M.Goedert and Dr. MG. Spillantini (MRC Laboratory of Molecular Biology, Cambridge, UK) for the gift of the Tau-P301S mouse model and Dr L. Buée (Institut National de la Santé et de la Recherche Médicale [INSERM] UMR-S 1172, Université de Lille, Lille) for the gift of the Tau-inducible SH-SY5Y cell line. The authors thank J. Loisel (Institut National de la Sante et de la Recherche Médicale, Unité 1195, Le Kremlin-Bicetre, France) for technical help with TEM imaging and analyses. The work has been supported by the Fondation Vaincre Alzheimer (n° FR-18055p) and by the Institut Baulieu.
Disclosure statement
The authors have no conflicts of interest to disclose.
Supplementary material
Supplemental data for this article can be accessed here.
Additional information
Funding
Related Research Data
References
- Goldberg AL. Protein degradation and protection against misfolded or damaged proteins. Nature. 2003 Dec 18;426(6968):895–899.
- Mizushima N, Levine B, Cuervo AM, et al. Autophagy fights disease through cellular self-digestion. Nature. 2008 Feb 28;451(7182):1069–1075.
- Morimoto RI. Proteotoxic stress and inducible chaperone networks in neurodegenerative disease and aging. Genes Dev. 2008 June 1;22(11):1427–1438.
- Kaushik S, Cuervo AM. Proteostasis and aging. Nat Med. 2015 Dec;21(12):1406–1415.
- Rubinsztein DC, Marino G, Kroemer G. Autophagy and aging. Cell. 2011 Sept 2;146(5):682–695.
- Mizushima N, Komatsu M. Autophagy: renovation of cells and tissues. Cell. 2011 Nov 11;147(4):728–741.
- Mehrpour M, Esclatine A, Beau I, et al. Overview of macroautophagy regulation in mammalian cells. Cell Res. 2010 July;20(7):748–762.
- Pankiv S, Clausen TH, Lamark T, et al. p62/SQSTM1 binds directly to Atg8/LC3 to facilitate degradation of ubiquitinated protein aggregates by autophagy. J Biol Chem. 2007 Aug 17;282(33):24131–24145.
- Johansen T, Lamark T. Selective autophagy mediated by autophagic adapter proteins. Autophagy. 2011 Mar;7(3):279–296.
- Sanchez-Martin P, Komatsu M. Physiological stress response by selective autophagy. J Mol Biol. 2019 June 18;432:53–62.
- Mackeh R, Perdiz D, Lorin S, et al. Autophagy and microtubules - new story, old players. J Cell Sci. 2013 Mar 1;126(Pt 5):1071–1080.
- Cabukusta B, Neefjes J. Mechanisms of lysosomal positioning and movement. Traffic. 2018 Oct;19(10):761–769.
- Korolchuk VI, Saiki S, Lichtenberg M, et al. Lysosomal positioning coordinates cellular nutrient responses. Nat Cell Biol. 2011 Apr;13(4):453–460.
- Kimura S, Noda T, Yoshimori T. Dynein-dependent movement of autophagosomes mediates efficient encounters with lysosomes. Cell Struct Funct. 2008;33(1):109–122.
- Manjithaya R, Anjard C, Loomis WF, et al. Unconventional secretion of Pichia pastoris Acb1 is dependent on GRASP protein, peroxisomal functions, and autophagosome formation. J Cell Biol. 2010 Feb 22;188(4):537–546.
- Duran JM, Anjard C, Stefan C, et al. Unconventional secretion of Acb1 is mediated by autophagosomes. J Cell Biol. 2010 Feb 22;188(4):527–536.
- Zhang M, Kenny SJ, Ge L, et al. Translocation of interleukin-1beta into a vesicle intermediate in autophagy-mediated secretion. eLife. 2015 Nov 2;4. DOI:10.7554/eLife.11205
- Zhang M, Schekman R. Cell biology. Unconventional secretion, unconventional solutions. Science. 2013 May 3;340(6132):559–561.
- New J, Thomas SM. Autophagy-dependent secretion: mechanism, factors secreted, and disease implications. Autophagy. 2019 Oct;15(10):1682–1693.
- Ihara Y, Morishima-Kawashima M, Nixon R. The ubiquitin-proteasome system and the autophagic-lysosomal system in Alzheimer disease. Cold Spring Harb Perspect Med. 2012 Aug 1;2(8):a006361–a006361.
- Bahr BA, Bendiske J. The neuropathogenic contributions of lysosomal dysfunction. J Neurochem. 2002 Nov;83(3):481–489.
- Weingarten MD, Lockwood AH, Hwo SY, et al. A protein factor essential for microtubule assembly. Proc Natl Acad Sci U S A. 1975 May;72(5):1858–1862.
- Avila J, Lucas JJ, Perez M, et al. Role of tau protein in both physiological and pathological conditions. Physiol Rev. 2004 Apr;84(2):361–384.
- Kidd M. Paired helical filaments in electron microscopy of Alzheimer’s disease. Nature. 1963 Jan;12(197):192–193.
- Berriman J, Serpell LC, Oberg KA, et al. Tau filaments from human brain and from in vitro assembly of recombinant protein show cross-beta structure. Proc Natl Acad Sci U S A. 2003 July 22;100(15):9034–9038.
- Braak H, Braak E. Neuropathological stageing of Alzheimer-related changes. Acta Neuropathol. 1991;82(4):239–259.
- Bennett DA, Schneider JA, Wilson RS, et al. Neurofibrillary tangles mediate the association of amyloid load with clinical Alzheimer disease and level of cognitive function. Arch Neurol. 2004 Mar;61(3):378–384.
- Clavaguera F, Bolmont T, Crowther RA, et al. Transmission and spreading of tauopathy in transgenic mouse brain. Nat Cell Biol. 2009 July;11(7):909–913.
- Frost B, Jacks RL, Diamond MI. Propagation of tau misfolding from the outside to the inside of a cell. J Biol Chem. 2009 May 8;284(19):12845–12852.
- de Calignon A, Polydoro M, Suarez-Calvet M, et al. Propagation of tau pathology in a model of early Alzheimer’s disease. Neuron. 2012 Feb 23;73(4):685–697.
- Dujardin S, Lecolle K, Caillierez R, et al. Neuron-to-neuron wild-type Tau protein transfer through a trans-synaptic mechanism: relevance to sporadic tauopathies. Acta Neuropathol Commun. 2014 Jan 30;2:14.
- Caballero B, Wang Y, Diaz A, et al. Interplay of pathogenic forms of human tau with different autophagic pathways. Aging Cell. 2018 Feb;17(1):e12692.
- Wang Y, Martinez-Vicente M, Kruger U, et al. Synergy and antagonism of macroautophagy and chaperone-mediated autophagy in a cell model of pathological tau aggregation. Autophagy. 2010 Jan;6(1):182–183.
- Williams A, Jahreiss L, Sarkar S, et al. Aggregate-prone proteins are cleared from the cytosol by autophagy: therapeutic implications. Curr Top Dev Biol. 2006;76:89–101.
- Fischer G, Tradler T, Zarnt T. The mode of action of peptidyl prolyl cis/trans isomerases in vivo: binding vs. catalysis. FEBS Lett. 1998 Apr 10;426(1):17–20.
- Bose S, Weikl T, Bugl H, et al. Chaperone function of Hsp90-associated proteins. Science. 1996 Dec 6;274(5293):1715–1717.
- Chambraud B, Sardin E, Giustiniani J, et al. A role for FKBP52 in Tau protein function. Proc Natl Acad Sci U S A. 2010 Feb 9;107(6):2658–2663.
- Giustiniani J, Sineus M, Sardin E, et al. Decrease of the immunophilin FKBP52 accumulation in human brains of Alzheimer’s disease and FTDP-17. J Alzheimers Dis. 2012;29(2):471–483.
- Meduri G, Guillemeau K, Dounane O, et al. Caspase-cleaved Tau-D(421) is colocalized with the immunophilin FKBP52 in the autophagy-endolysosomal system of Alzheimer’s disease neurons. Neurobiol Aging. 2016 Oct;46:124–137.
- Klionsky DJ, Abdelmohsen K, Abe A, et al. Guidelines for the use and interpretation of assays for monitoring autophagy (3rd edition). Autophagy. 2016;12(1):1–222.
- Bretteville A, Ando K, Ghestem A, et al. Two-dimensional electrophoresis of tau mutants reveals specific phosphorylation pattern likely linked to early tau conformational changes. PloS One. 2009;4(3):e4843.
- Hamano T, Gendron TF, Causevic E, et al. Autophagic-lysosomal perturbation enhances tau aggregation in transfectants with induced wild-type tau expression. Eur J Neurosci. 2008 Mar;27(5):1119–1130.
- Mohamed NV, Plouffe V, Remillard-Labrosse G, et al. Starvation and inhibition of lysosomal function increased tau secretion by primary cortical neurons. Sci Rep. 2014;4:5715.
- Simon D, Garcia-Garcia E, Gomez-Ramos A, et al. Tau overexpression results in its secretion via membrane vesicles. Neurodegener Dis. 2012;10(1–4):73–75.
- Johnson DE, Ostrowski P, Jaumouille V, et al. The position of lysosomes within the cell determines their luminal pH. J Cell Biol. 2016 Mar 14;212(6):677–692.
- Zaarur N, Meriin AB, Bejarano E, et al. Proteasome failure promotes positioning of lysosomes around the aggresome via local block of microtubule-dependent transport. Mol Cell Biol. 2014 Apr;34(7):1336–1348.
- Bae D, Moore KA, Mella JM, et al. Degradation of Blos1 mRNA by IRE1 repositions lysosomes and protects cells from stress. J Cell Biol. 2019 Apr 1;218(4):1118–1127.
- Allen B, Ingram E, Takao M, et al. Abundant tau filaments and nonapoptotic neurodegeneration in transgenic mice expressing human P301S tau protein. J Neurosci. 2002 Nov 1;22(21):9340–9351.
- Mellone M, Kestoras D, Andrews MR, et al. Tau pathology is present in vivo and develops in vitro in sensory neurons from human P301S tau transgenic mice: a system for screening drugs against tauopathies. J Neurosci. 2013 Nov 13;33(46):18175–18189.
- Schiene-Fischer C. Multidomain peptidyl prolyl cis/trans Isomerases. Biochim Biophys Acta. 2014 Nov 18;1850:2005–2016.
- Davies TH, Sanchez ER. Fkbp52. Int J Biochem Cell Biol. 2005 Jan;37(1):42–47.
- Gassen NC, Hartmann J, Schmidt MV, et al. FKBP5/FKBP51 enhances autophagy to synergize with antidepressant action. Autophagy. 2015;11(3):578–580.
- Bhujabal Z, Birgisdottir AB, Sjottem E, et al. FKBP8 recruits LC3A to mediate Parkin-independent mitophagy. EMBO Rep. 2017 June;18(6):947–961.
- Harada A, Takei Y, Kanai Y, et al. Golgi vesiculation and lysosome dispersion in cells lacking cytoplasmic dynein. J Cell Biol. 1998 Apr 6;141(1):51–59.
- Hollenbeck PJ, Swanson JA. Radial extension of macrophage tubular lysosomes supported by kinesin. Nature. 1990 Aug 30;346(6287):864–866.
- Wochnik GM, Ruegg J, Abel GA, et al. FK506-binding proteins 51 and 52 differentially regulate dynein interaction and nuclear translocation of the glucocorticoid receptor in mammalian cells. J Biol Chem. 2005 Feb 11;280(6):4609–4616.
- Galigniana MD, Harrell JM, O’Hagen HM, et al. Hsp90-binding immunophilins link p53 to dynein during p53 transport to the nucleus. J Biol Chem. 2004 May 21;279(21):22483–22489.
- Jeong YY, Her J, Oh SY, et al. Hsp90-binding immunophilin FKBP52 modulates telomerase activity by promoting the cytoplasmic retrotransport of hTERT. Biochem J. 2016 Oct 15;473(20):3517–3532.
- Jongsma ML, Berlin I, Wijdeven RH, et al. An ER-associated pathway defines endosomal architecture for controlled cargo transport. Cell. 2016 June 30;166(1):152–166.
- Kulkarni A, Chen J, Maday S. Neuronal autophagy and intercellular regulation of homeostasis in the brain. Curr Opin Neurobiol. 2018 Aug;51:29–36.
- Wang Y, Martinez-Vicente M, Kruger U, et al. Tau fragmentation, aggregation and clearance: the dual role of lysosomal processing. Hum Mol Genet. 2009 Nov 1;18(21):4153–4170.
- Feng Q, Luo Y, Zhang XN, et al. MAPT/Tau accumulation represses autophagy flux by disrupting IST1-regulated ESCRT-III complex formation: a vicious cycle in Alzheimer neurodegeneration. Autophagy. 2019;28:1–18.
- Giustiniani J, Chambraud B, Sardin E, et al. Immunophilin FKBP52 induces Tau-P301L filamentous assembly in vitro and modulates its activity in a model of tauopathy. Proc Natl Acad Sci U S A. 2014 Mar 25;111(12):4584–4589.
- Giustiniani J, Guillemeau K, Dounane O, et al. The FK506-binding protein FKBP52 in vitro induces aggregation of truncated Tau forms with prion-like behavior. Faseb J. 2015 Apr 17;29:3171–3181.
- Radanyi C, Chambraud B, Baulieu EE. The ability of the immunophilin FKBP59-HBI to interact with the 90-kDa heat shock protein is encoded by its tetratricopeptide repeat domain. Proc Natl Acad Sci U S A. 1994 Nov 8;91(23):11197–11201.
- Bandyopadhyay U, Kaushik S, Varticovski L, et al. The chaperone-mediated autophagy receptor organizes in dynamic protein complexes at the lysosomal membrane. Mol Cell Biol. 2008 Sept;28(18):5747–5763.
- Rabouille C. Pathways of unconventional protein secretion. Trends Cell Biol. 2017 Mar;27(3):230–240.
- Saman S, Lee NC, Inoyo I, et al. Proteins recruited to exosomes by tau overexpression implicate novel cellular mechanisms linking tau secretion with Alzheimer’s disease. J Alzheimers Dis. 2014;40(Suppl 1):S47–70.
- Ejlerskov P, Rasmussen I, Nielsen TT, et al. Tubulin polymerization-promoting protein (TPPP/p25alpha) promotes unconventional secretion of alpha-synuclein through exophagy by impairing autophagosome-lysosome fusion. J Biol Chem. 2013 June 14;288(24):17313–17335.
- Clavaguera F, Akatsu H, Fraser G, et al. Brain homogenates from human tauopathies induce tau inclusions in mouse brain. Proc Natl Acad Sci U S A. 2013 June 4;110(23):9535–9540.
- Sanders DW, Kaufman SK, DeVos SL, et al. Distinct tau prion strains propagate in cells and mice and define different tauopathies. Neuron. 2014 June 18;82(6):1271–1288.
- Fontaine SN, Zheng D, Sabbagh JJ, et al. DnaJ/Hsc70 chaperone complexes control the extracellular release of neurodegenerative-associated proteins. Embo J. 2016 July 15;35(14):1537–1549.
- Brown CA, Schmidt C, Poulter M, et al. In vitro screen of prion disease susceptibility genes using the scrapie cell assay. Hum Mol Genet. 2014 Oct 1;23(19):5102–5108.
- Consensus recommendations for the postmortem diagnosis of Alzheimer’s disease. The national institute on aging, and reagan institute working group on diagnostic criteria for the neuropathological assessment of Alzheimer’s disease. Neurobiol Aging. 1997 July–Aug;18(4 Suppl):S1–2.
- Sleigh JN, Weir GA, Schiavo G. A simple, step-by-step dissection protocol for the rapid isolation of mouse dorsal root ganglia. BMC Res Notes. 2016 Feb 11;9:82.
- Yao J, Qiu Y, Jia L, et al. Autophagosome immunoisolation from GFP-LC3B mouse tissue. Autophagy. 2019 Feb;15(2):341–346.
- Roberts R, Al-Jamal WT, Whelband M, et al. Autophagy and formation of tubulovesicular autophagosomes provide a barrier against nonviral gene delivery. Autophagy. 2013 May;9(5):667–682.