
ABSTRACT
Microglia, resident myeloid immune cells of the central nervous system (CNS), actively shape the circuitry of the brain, maintain CNS homeostasis during the steady state and orchestrate immune responses upon CNS injury. Both canonical and non-canonical functions of the macroautophagy/autophagy-related protein ATG5 regulate myeloid cell survival and immune responses. Here, we report that loss of ATG5 in postnatal microglia does not perturb CNS tissue integrity, microglial cell survival, or immune activation. Learning task performances were unchanged in mutant mice. Furthermore, lack of ATG5 expression in microglia had no impact on the development of experimental autoimmune encephalomyelitis. These data indicate that, basal autophagy, identified to be essential for the survival and function of neuronal cells, is not required to maintain CNS homeostasis if absent in adult microglia and ATG5 expression is dispensable for the development of autoimmune neuroinflammation.
Abbreviations Ag, antigen; APC, antigen presenting cell; ATG/Atg, autophagy-related; CD, cluster of differentiation; CNS, central nervous system; DC, dendritic cell; EAE, experimental autoimmune encephalomyelitis; fl, floxed; LAP, LC3-associated phagocytosis; LC3, microtubule-associated protein 1 light chain 3; MFI, median fluorescence intensity; MHCII, major histocompatibility complex class II; MOG, myelin oligodendrocyte glycoprotein; MS, multiple sclerosis
Introduction
Autophagy and autophagy proteins exert fundamental roles in myeloid cell immune functions, ranging from cell-autonomous defense and cell survival to coordination of complex multicellular immune responses [Citation1]. There are several types of autophagy and, in addition, autophagy-related processes that utilize parts of the autophagy machinery but do not involve the formation of a double-membrane structure known as the autophagosome. These alternative, non-canonical functions include the regulation of endocytosis and phagocytosis [Citation2]. Expression of the autophagy-related protein ATG5 is essential for both conventional macroautophagy and LC3-associated phagocytosis (LAP) during which LC3 is directly conjugated to the phagosomal membrane [Citation3].
Microglial cells are the resident immune cells of the central nervous system (CNS), comprising 10% of brain cells, and – with the exception of a few mast cells – are the only myeloid cell type within the healthy CNS parenchyma [Citation4,Citation5]. Although they are considered CNS macrophages and professional phagocytes, studies employing single-cell transcriptomic profiling revealed that microglia are transcriptionally and epigenetically distinct from other tissue macrophages or bone marrow–derived macrophages [Citation6,Citation7]. They do not arise from bone marrow precursors but are generated from a yolk sac–derived pool of progenitors that migrate to the developing CNS [Citation8,Citation9]. Microglia are vital for CNS tissue homeostatic functions, long lived in situ and able to self-renew without significant replacement by peripheral hematopoietic cells from the blood circulation during the life of a mouse [Citation10,Citation11]. Activation of microglial cells, a process characterized by morphological changes and upregulation of a spectrum of immune molecules such as ITGAX/CD11c and MHC class II (MHC-II) is a hallmark of almost all chronic immune-mediated and degenerative neurological diseases including multiple sclerosis (MS) and contributes to the development of experimental autoimmune encephalitis (EAE), an established animal model of MS [Citation12].
Whereas autophagy proteins exert fundamental roles in myeloid cell-related immune functions [Citation13], current knowledge on in vivo autophagy functions within the CNS largely stems from experiments targeting neuronal cells. Mice with systemic deletion of Atg5 lack obvious anatomical abnormalities but die at approximately 12 h after birth [Citation14]. Mice with neuron-specific deletion of Atg5 spontaneously develop early neurodegenerative disease phenotypes associated with an age-dependent accumulation of ubiquitin-positive neuronal inclusions and widespread death of neurons, in line with the classical housekeeping function of autophagy [Citation15,Citation16]. Re-expression of ATG5 in the brain was sufficient to rescue mice with systemic deletion of Atg5 indicating that neuronal dysfunction also contributes to neonatal lethality [Citation17]. Here, we investigated the impact of targeted deletion of Atg5 in postnatal, adult microglial cells in vivo during the steady state and upon CNS inflammation.
Results
Loss of ATG5 in adult microglia does not perturb CNS tissue integrity
To investigate the impact of autophagy in microglial cells during the steady state and aging, we applied tamoxifen-induced Cre-loxP recombination to conditionally ablate ATG5 in postnatal microglial cells in vivo (Atg5flox/flox × Sall1-CreER, designated atg5fl/fl-Sall1-CreER). Sall1 is a transcriptional regulator expressed by microglia but not by other members of the mononuclear phagocyte and has previously been used for targeted gene ablation in microglia in vivo [Citation18–20]. Recombination frequency and deletion of Atg5 was verified by quantitative real-time PCR (qPCR) in sorted PTPRC/CD45low Ly6G− Ly6C− ITGAM/CD11b+ CX3CR1+ SIGLECH+ microglial cells from brain and spinal cords derived from atg5fl/fl-Sall1-CreER and Cre− littermate control mice 2 months and 4 months after 5 consecutive days of tamoxifen treatment in 5 weeks old mice (). In addition, immunostainings for AIF1/Iba1 and the autophagy receptor SQSTM1/p62 followed by IMARIS reconstruction from random cortical windows from Cre− and 2 Cre+ mice 4 months after tamoxifen treatment revealed that SQSTM1+ puncta could be detected in Cre+ but not in Cre− mice indicating that genetic ablation of ATG5 impairs autophagic flux in microglia (Figure S1C).
Figure 1. Loss of ATG5 in adult microglia does not perturb CNS tissue integrity. (A) normalized mRNA expression of Atg5 in isolated microglia in atg5fl/fl-Sall1-CreER (maroon polygons) and Atg5fl/fl-CreER− (gray polygons) at age 2-month and 4-month are shown respectively. Two-month data show values from 6–7 mice from each group and 4-months data show values from 2 mice from each group (2 months: atg5fl/fl-Sall1-CreER n = 6, Atg5fl/fl-CreER− n = 7; 4 months: atg5fl/fl-Sall1-CreER n = 2, Atg5fl/fl-CreER− n = 2). (B) Body weight representation in 4-month old atg5fl/fl-Sall1-CreER mice as compared to Atg5fl/fl-CreER−. These data show values from 9 mice in each group (n = 9). (C) Histology data depict hematoxylin and eosin (HE), APP (amyloid beta (A4) precursor protein) staining and Luxol Fast Blue staining combined with p-periodic acid-Schiff (LFB-PAS) staining from CC: corpus callosum, FC: frontal cortex, BST: brainstem, CRB: cerebellum in mutant and control littermates. (D) Microglial cells (AIF1/Iba1), macrophages (LAMP2/Mac-3) and lymphocytes (CD3) were stained in all the aforementioned regions of atg5fl/fl-Sall1-CreER and Atg5fl/fl-CreER− mice. (E) Quantification of AIF1+ cells from different region of the brain – CC: corpus callosum, FC: frontal cortex, BST: brainstem, CRB: cerebellum. Statistical analysis: Mann-Whitney test was applied and Mean + SEM is depicted (n = 4). (F,G) Gating strategy for flow cytometric analysis of microglial phenotypic markers. (F) Density plots show live, PTPRClo ITGAX+ cells. Ly6G+ cells were used to exclude monocytes and neutrophils respectively. (G) Quantification of median fluorescence intensity (MFI) of activation markers MHC-II, FCGR3/CD16-FCGR2B/CD32, FCGR1/CD64, ITGAX/CD11 C, CD44, along with CYBB/NOX2 in PTPRClo ITGAX+ microglia (atg5fl/fl-Sall1-CreER n = 4, Atg5fl/fl-CreER− n = 2). Each data point represents 1 individual animal. Statistical analysis: Mann-Whitney test was applied
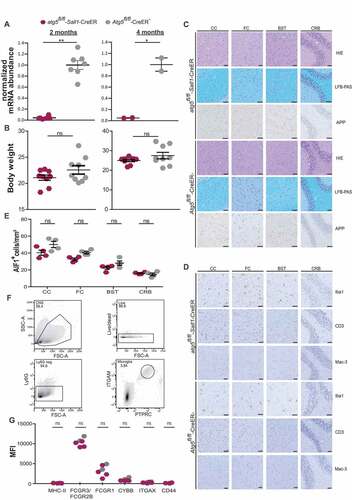
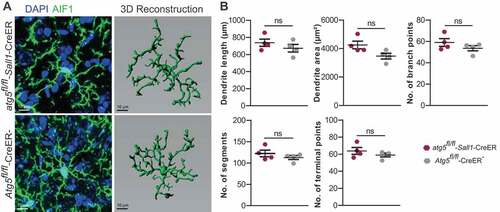
After the observation period of 2 and 4 months following tamoxifen application, Cre+ and Cre− mice did not significantly differ in body weight (). Histological analysis of frontal cortex (FC), corpus callosum (CC), brainstem (BST), and cerebellar (CRB) tissue sections examined 4 months after tamoxifen treatment did not show any signs of CNS tissue injury such as demyelination, axonal damage, or immune cell infiltration (). Microglia lacking ATG5 did not exhibit altered cell morphology such as shorter, thicker dendrites and enhanced immunoreactivity to AIF1/Iba-1 (allograft inflammatory factor 1) that is usually seen in reactive microglia (). Using IMARIS-based 3-dimensional reconstruction, we additionally profiled microglia ramification parameters (dendrite length, dendritic area, number of branch points, number of segments and number of terminal points) in Cre+ and Cre− mice 4 months after tamoxifen administration. All of the aforementioned parameters tended to be increased in microglia derived from Cre+ mice, but the differences were not statistically significant (). The density of AIF1/Iba-1+ microglial cells in any of the aforementioned areas tended to be lower in atg5fl/fl-Sall1-CreER mice, but these differences did not reach statistical significance (). Using flow cytometry, we found that the phenotype and activation status of ATG5-deficient microglia did not significantly differ from CreER-negative microglia 4 months after tamoxifen application (, ).
Figure 2. 3D reconstruction analysis of microglia. (A) Represents the 3D reconstruction of AIF1/Iba1+ microglia (green) from atg5fl/fl-Sall1-CreER and Atg5fl/fl-CreER− mice corresponding to the respective image acquired from a confocal microscope. (B) Represent the quantification of dendritic parameters from atg5fl/fl-Sall1-CreER and Atg5fl/fl-CreER− mice. The dendritic length, dendritic area number of branch points, number of segments and the number of terminal points are shown. Each dot represents one mouse and 3 cortical neurons from each mouse was used for quantification of the ramification parameters. (atg5fl/fl-Sall1-CreER n = 4, Atg5fl/fl-CreER− n = 4). Statistical analysis: Mann-Whitney test was applied
Behavioral and learning performances in atg5fl/fl-Sall1-CreER mice
To further determine whether absence of ATG5 in microglia impacts behavioral performances including learning and memory functions, we applied a programmable automated IntelliCage system designed for high-throughput analysis of transponder-tagged mice living in social groups in a large standardized homecage. The computer controlled IntelliCage system profiles both spontaneous behavioral patterns as well as
conditioning success in various forms of learning and memory paradigms [Citation21], and is therefore ideally suited to determine behavioral performance in a discovery-driven approach. Two months after tamoxifen treatment, atg5fl/fl-Sall1-CreER and littermate control mice were housed in IntelliCages over an observation period of 70 days. First, mice were allowed to adapt to the caging system during free adaptation sessions and explored all 4 corners equipped with freely accessible water bottles. The atg5fl/fl-Sall1-CreER mice did not significantly differ from control littermates in the number or frequency of visits to water bottles or in the number of total licks during the first 24 hours in IntelliCage exploration or during the following 7 days of adaption (). Cre+ mice tended to show more visits to water bottles as compared to Cre− mice with statistically significant differences for day 1, day 2–6, and in both light and dark phases (). These data suggest at least a transient decrease in locomotor activity in Cre+ mice. However, histopathological analysis did not indicate any morphological alterations within the motor system and all of the following behavioral performances were unchanged in Cre+ mice.
Figure 3. Behavioral performance in mice with ATG5-deficient microglia. (A) Daily number of corner visits during exploration (day 0) and days 1–7 of the free stage of adaptation. (B) Frequency of corner visits during the light and dark phase, averaged over days 1–7 of free adaptation. (C) Daily number of licks during exploration (day 0) and days 1–7 of the free stage of adaptation. (D) Fraction of corner visits made during (prospective) drinking sessions during the last day of nosepoke adaptation (day 0) and days 1–7 of the drinking session stage of adaptation. (E) Fraction of correct responses during days 1–8 of acquisition of the corner chaining task. (F) Fraction of premature responses during days 1–6 of the testing stage of the reaction time task in which premature responses prevented drinking. These data show values from 9 atg5fl/fl-Sall1-CreER (maroon polygons) and 8 Atg5fl/fl-CreER− (gray polygons) mice (atg5fl/fl-Sall1-CreER n = 9, Atg5fl/fl-CreER− n = 8). Statistical analysis: Mann-Whitney test was applied and Mean + SEM values is depicted
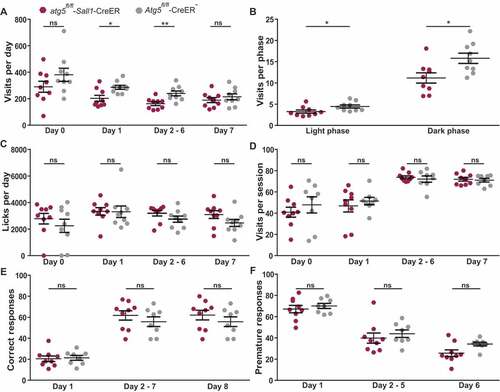
Learning tasks were performed after a further 7 days during which the mice learned to open doors with nose pokes. First, a fixed drinking schedule with access to water bottles in response to nose pokes was applied at fixed time points (04:00–05:00, 11:00–12:00, 16:00–17:00 and 23:00–00:00). Mice adapted their activity pattern to the drinking session schedule, without evidence for a mutation effect (). During the next task, water was accessible only in one of the four corners, following varying spatial rules. In the most challenging of these tasks, the chaining task, the mice had to learn to move to the next corner in either clockwise or anticlockwise direction after each response in order to obtain access to water bottles. Even in this most challenging task, the frequency of correct responses improved over time in all mice independent from their genotype (). We additionally performed reaction time tasks during which access to water was provided after a randomly varying delay of 0.5, 1, 1.5, or 2.5 seconds following the first nose poke. Any response during the delay period was quantified as a premature response and prevented access to water during the test phase of the task. Learning rates and numbers of premature responses were indistinguishable in atg5fl/fl-Sall1-CreER and littermate control mice (). Thus, ATG5 deficiency in microglial cells does not significantly alter behavioral patterns or learning performances in adult mice.
ATG5 in microglia is dispensable for the development of EAE
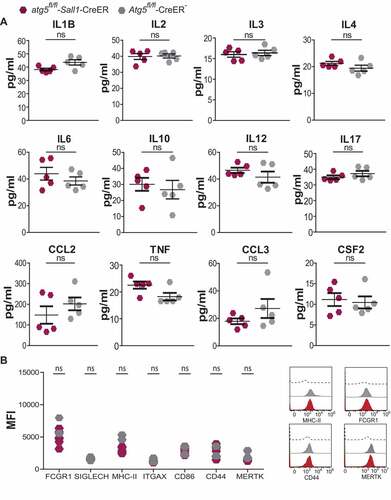
Experimental autoimmune encephalomyelitis (EAE) is the most commonly used animal model for autoimmune CNS tissue injury. During EAE, activated microglia expand and interact with CNS-infiltrating T cells via cell-to-cell contact and through soluble factors such as cytokines to promote inflammatory CNS injury [Citation6,Citation12]. We and others demonstrated that absence of ATG5 in ITGAX/CD11c+ antigen-presenting cells (APCs) and conventional dendritic cells (DCs) confers resistance to EAE development [Citation22–24]. Here, we determined whether genetic ablation of ATG5 in microglia alters the incidence to and clinical severity grades during EAE development. To this end, active EAE was induced in atg5fl/fl-Sall1-CreER mice compared to littermate controls 2 months after tamoxifen application. Mice deficient in microglia ATG5 expression were fully susceptible to EAE and the kinetics and disease severity of EAE development were similar to Cre− control mice (). In addition, protein expression of 12 individual pro- and anti-inflammatory cytokines in brain homogenates and microglial cell surface expression of molecules indicative for activation [Citation4] at day 1 after EAE onset were unchanged in Cre+ mice as compared to control littermates (). These data indicate that ATG5 expression in microglia does not contribute vitally to autoimmune neuroinflammation in mice.
Figure 4. ATG5 in microglia is dispensable for the development of EAE. (A) EAE was induced actively by MOG35-55 peptide into atg5fl/fl-Sall1-CreER (maroon polygons) and Atg5fl/fl-CreER− (gray polygons). Each data point represents mean of atg5fl/fl-Sall1-CreER (maroon polygons) and Atg5fl/fl-CreER− (gray polygons). (B) The rate of disease development was similar with 100% incidence in both atg5fl/fl-Sall1-CreER (maroon bar) and Atg5fl/fl-CreER− (gray bar). (C) Changes in the body weight during the course of EAE development and (D) represents the highest clinical score reached. Each data point represents the pooled values of 9 atg5fl/fl-Sall1-CreER and 12 Atg5fl/fl-CreER− mice from 2 independent experiments (atg5fl/fl-Sall1-CreER n = 9, Atg5fl/fl-CreER− n = 12). For Figures A and C two-way ANOVA was applied for statistical analysis of Mean + SEM values is shown. For figures B and D Mann-Whitney test was applied
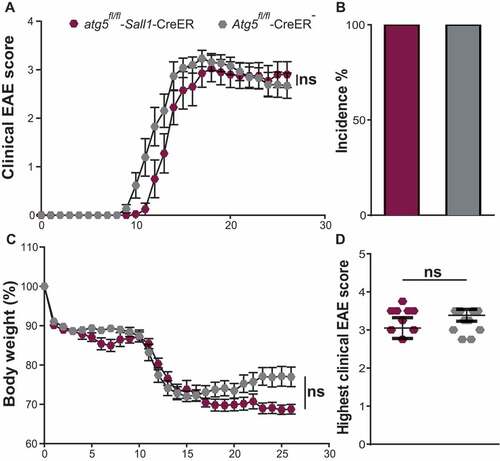
Figure 5. Quantification of cytokine production and activation phenotype of microglia after induction of EAE. (A) Representative graphs showing the amount of cytokines produced from hemisphere homogenates of atg5fl/fl-Sall1-CreER and Atg5fl/fl-CreER− mice. (A) IL1B/IL1β (interleukin 1 beta), IL2 (interleukin 2), IL3 (interleukin 3), IL4 (interleukin 4), IL6 (interleukin 6), IL10 (interleukin 10), IL12 (interleukin 12), IL17 (interleukin 17), CCL2/MCP-1 (C-C motif chemokine ligand 2), TNF/TNF-α (tumor necrosis factor), CCL3/MIP-1a (C-C motif chemokine ligand 3) and CSF2/GM-CSF (colony stimulating factor 2). (atg5fl/fl-Sall1-CreER n = 5, Atg5fl/fl-CreER− n = 5). The cytokines measured were within the range of the standard curve. (B) Represents quantification of median fluorescence intensity (MFI) of activation markers FCGR1/CD64, SIGLECH, MHC-II, ITGAX/CD11 C, CD86, CD44 and MERTK in PTPRClo ITGAM+ microglia. (atg5fl/fl-Sall1-CreER n = 5, Atg5fl/fl-CreER− n = 2). (B) Representative histograms depicting the activation intensity of MHC-II, FCGR1/CD64, CD44 and MERTK in atg5fl/fl-Sall1-CreER (red peak), Atg5fl/fl-CreER− (gray peak) florescent minus one (black dashed line). Statistical analysis: Mann-Whitney test was applied
Discussion
Our study indicates that autophagy pathways which require ATG5 expression such as macroautophagy or LAP do not substantially contribute to the survival and function of postnatal microglial cells in the adult CNS.
Physiological functions of microglia include synaptic refinement by removing axons and synaptic terminals through a process termed pruning [Citation25] and secretion of neurotrophic factors for the support of neuronal cells. Postnatal depletion of microglia decreases both neuronal spine formation and elimination and results in behavioral changes affecting learning and memory [Citation26]. In addition to their role in regulating neuronal plasticity, microglia contribute to myelinogenesis and oligodendrocyte progenitor maintenance in the early postnatal CNS and mediate myelin degradation within the aging CNS [Citation27,Citation28]. The finding that CNS tissue integrity, microglial density and phenotypes as well as behavioral performances including learning tasks are preserved 4 months after persistent genetic ablation of ATG5 does not support a vital role for microglial autophagy in maintaining CNS homeostasis during the steady state.
Cheng and colleagues [Citation29] recently reported that deletion of ATG5 in ITGAM/CD11b+ myeloid cells during development leads to spontaneous development of Parkinson disease-like symptoms by accelerating inflammasome activation. In contrast to the aforementioned study, we used inducible Cre mice to generate time- and tissue-specific adult mouse mutants since the transcriptional profile of early microglia differs substantially from postnatal and adult microglia as demonstrated by single-cell RNA sequencing analysis [Citation6,Citation7,Citation30]. Moreover, we used a Cre transgenic line, i.e. Sall1-CreER, that allowed us to target microglial cells within the hematopoietic compartment in the adult CNS [Citation18,Citation19]. The CNS accommodates a complex, phenotypically and functionally heterogeneous compartment of myeloid immune cells even under steady state conditions, only surpassed by the reactive cellular diversity during pathology [Citation4,Citation6,Citation7,Citation31]. Cheng and colleagues [Citation29] used a Cre transgenic line, i.e. ITGAM/CD11b-Cre, designed to target CNS-resident and potentially CNS-infiltrating myeloid cells in general and a contribution of non-microglial cells to the observed phenotype cannot be excluded. In line with our data, Heckmann et al. recently reported that tamoxifen-induced deletion of Rubicon or ATG5 in postnatal microglial cells results in increased pro-inflammatory gene expression in brain hippocampal slices only if mice were crossed with animals expressing transgenes of several mutations associated with human familial Alzheimer disease (AD), called 5xFAD, but not in the absence of 5xFAD mutations [Citation32]. More recently, Choi et al., establisthed microglia-specific Atg7-deficient mice by breeding Cx3cr1-Cre mice, which constitutively express Cre recombinase, with Atg7flox/flox mice. Atg7 deficiency had little effect on microglia number and on microglia state-specific gene signatures for at least up to 7 months following Atg7 deletion, indicating that loss of autophagy does not cause microglial death or activation in vivo [Citation33]. Only expression of human SNCA/α-synuclein promoted the accumulation of misfolded SNCA/α-synuclein and caused midbrain neuronal degeneration in mice lacking autophagy in microglia. The aforementioned studies indicate that disruption of autophagy in microglia has little effect on CNS homeostasis and function during the steady state while it can significantly contribute to CNS disease conditions associated with protein aggregation by enhanced inflammasome activation and dysfunctional protein-mediated endo-/phagocytosis [Citation13].
Activation of microglial cells, a process characterized by morphological changes and upregulation of a spectrum of immune molecules such as MHC-II and ITGAX/CD11c is a hallmark of almost all degenerative and chronic immune-mediated neurological diseases including experimental in vivo models such as EAE [Citation4,Citation34,Citation35]. To invade the CNS parenchyma during EAE, myelin-specific T-helper cells must encounter their cognate antigen presented by MHC-II+ CNS-associated APCs. Recent conditional gene targeting approaches combined with multiparameter cytometry identified conventional DCs and mononcyte-derived cells as the main facilitators of early T cell entry into the CNS while MHC-II expression in microglia was shown to be dispensable for EAE development [Citation6,Citation36–38]. These data are in line with our finding that genetic ablation of ATG5 in cDCs limits their capacity to present antigen to myelin-specific T cells and completely protects mice from the development of EAE [Citation23,Citation24] while the susceptibility to develop EAE remained unchanged in mice with deletion of ATG5 in microglia. Although microglia contribute to EAE by mechanisms independent from antigen presentation such as inflammasome activation and production of inflammatory cytokines [Citation12], our data suggest that these functions do not require ATG5 expression.
Limitations of our study include the limited observation period of 4 months after targeted gene ablation. Lyz2/LysM-Cre mediated ablation of autophagy gene products primarily targeting macrophages are reported to results in enhanced pro-inflammatory gene expression [Citation39]. Microglia acquire a pro-inflammatory phenotype during aging [Citation34] and our data do not exclude that absence of autophagy components accelerates microglia senescence and age-related brain inflammation in geriatric mice or could potentially exhibit other functions in transgenic mice with a genetic background other than C57BL/6. Furthermore, we do not exclude that ATG5 expression in microglia is instrumental for the development of inflammatory disease conditions other than EAE as it is involved in LC3-associated endocytosis and clearance of toxic β-amyloid in mice transgenic for AD-associated mutations [Citation32]. Our study, however, demonstrates that basal autophagy, identified to be essential for the survival and function of neuronal cells [Citation15], is not required to maintain CNS homeostasis if absent in adult microglial cells and dispensable for the development of autoimmune neuroinflammation.
Materials and methods
Mice
ATG5< tm1(flox)> mice (referred as Atg5flox/flox) were a kind gift from Dr. Noboru Mizushima (University of Tokyo, Japan). The Atg5flox/flox mice were kept homozygous in the C57BL/6 background. B6.129-Sall1< tm1(CreERT2)> mice (referred as Sall1-CreERT2) were a kindly provided by Dr. Ryuichi Nishinakamura (Kumamoto University, Japan). All mice were bred and housed at the animal facility in the University of Zurich. With exception for the behavioral experiments, all mice were housed in individual ventilated cages on a 12-h light/dark cycle and received food and water ad libitum. Atg5flox/flox mice were crossed with Sall1-CreERT2 to obtain atg5fl/fl-Sall1-CreERT2 mice (designated as Cre positive). Littermates homozygous for the floxed allele and negative for Cre were used as controls (designated as Cre negative) in all experiments. All experiments were approved and conducted under the regulations of Cantonal Veterinary Office of Canton Zurich, Switzerland.
Tamoxifen treatment
Tamoxifen (Sigma, T5648) was used to enable specific deletion of Atg5 in microglia taking the advantage of the inducible Cre-LoxP system. Tamoxifen (concentration: 5 mg/200 µl) was administered to 5–6 weeks old mice 5 times every alternate day (Figure S1).
Genotyping
The DNA extracted from tail or ear biopsies of Atg5flox/flox and Sall1-CreERT2 and the genotype was determined by PCR using the following primers. Atg5flox/flox Primer 1: GAA TAT GAA GGC ACA CCC CTG AAA TG (exon3-1), Primer 2: GTA CTG CAT AAT GGT TTA ACT CTT GC (short2), Primer 3: ACA ACG TCG AGC ACA GCT GCG CAA GG (check2) and Primer 4: CAG GGA ATG GTG TCT CCC AC. Sall1-CreERT2 Primer 1: CAA CTT GCG ATT GCC ATA AA, Primer 2: GCG TTG GCT ACC CGT GAT AT, Primer 3: AGC TAA AGC TGC CAG AGT GC.
Behavioral testing
The IntelliCage apparatus (TSE Systems, Bad Homburg, Germany) were used to perform all the behavioral testing on Cre positive and Cre negative mice. The IntelliCage provided normal mouse chow (Standard 3430, Kliba Nafag) ad libitum, contained woodchip bedding and 4 central shelters (Techniplast, Buguggiate, Italy). Each cage had 4 learning corners accessible via a tubular RFID antenna. Access to the 2 drinking bottles of each corner was controlled by monitorized doors that could be opened with a nosepoke depending on the programmed task rules. Licking activity was recorded by lickometers. RFID transponders (Planet ID GmbH, Essen, Germany) were injected subcutaneously in the dorso-cervical region under brief isoflurane inhalation anesthesia. Mixed genotypes groups of 9 female mice were housed in a single IntelliCage on a 12-h light/dark cycle. Firstly, mice were subjected to adaptation procedures including exploration and free adaptation, Nosepoke adaptation, Drinking session adaptation. Following the adaptation procedures, mice were monitored during training and testing sessions for each of the following tasks: reaction time task, corner selection task, corner preference task, social competition task, chaining task, and patrolling task.
Microglia isolation from CNS
All mice were perfused with ice cold PBS (Sigma, D837), brain and the spinal cord were removed, and dissected into <1 mm pieces and suspended in digestion buffer containing papain (20 units/ml; Sigma, 10,108,014,001) and DNAse (1 mg/ml; Sigma, 4,716,728,001) in PBS (3 ml per CNS) and incubated for 40 min at 37°C and 5% CO2. After incubation, the digested tissue was passed through a 70-µm nylon mesh. The pelleted cells were suspended in 30% percoll solution (GE Healthcare, 17–0891-01) and centrifuged at 700 x g for 10 min at 4°C. Lipid layers were discarded, and the remaining cell layer was collected in new tubes and centrifuged at 400 x g for 5 min at 4°C. Cell numbers were determined and samples were kept on ice. Subsequently, the resulting microglial cells were stained for FACS purification and flow cytometric analysis.
Quantitative PCR
Upon FACS purification RNA from microglia was extracted (Quick-RNA microprep kit, Zymo research, R1050; GoScriptTM Reverse Transcriptase, Promega, A5000) to determine the expression of Atg5 in both Cre-positive and Cre-negative mice. Atg5flox/flox primers are as follows, forward primer: GTTTGAATATGAAGGCACACC and reverse primer: AGCTAAAGCTGCCAGAGTGC.
Flow cytometry
For staining surface proteins, the single-cell suspensions were first incubated with Fc receptor block (22.4 µg/ml, for 20 min at 4°C; clone: 2.4G2; Bio X Cell, CUS-HB-197) followed by LIVE/DEAD staining with AQUA or Near-IR dead (ThermoFischer Scientific, L34957; L34975) cell stain along with the mastermix of respective fluorochrome-labeled antibodies in PBS for 20 min in the dark at 4°C. The cell suspensions were washed twice with PBS and were immediately recorded with FACSCantoΙΙ or FACSfortessa with FACSDiva software v6.1.3 (BD Bioscience) and analyzed with FlowJo software v9.3.1 (Tree Star Inc).
FACS purification
To obtain a specific microglial cell population, single cell suspensions were stained with respective antibodies similar to staining for flow cytometric analysis and the population of interest was immediately sorted using FACS Aria ΙΙΙ 4 L instrument (BD). Sorted cells were stored at −20°C until further processing for RNA isolation for qPCR or for flow cytometric analysis of activation markers.
Antibodies
Brilliant Violet 605-conjugated anti-ITGAM/CD11b (Biolegend, clone: M1/70; 1:200); PE-Cy5-conjugated anti-CD44 (eBioscience, clone: IM7; 1:200); PE-Dazzle594-conjugated anti-PTPRC/CD45 (Biolegend, clone: 30-F11; 1:400), APC-Cy7-conjugated anti-PTPRC/CD45 (BD Biosciences, clone: 30-F11; 1:300); Brilliant Violet 421-conjugated anti-FCGR3/CD16-FCGR2B/CD32 (Biolegend, clone: 93, 1:100); Brilliant Violet 711-conjugated anti-FCGR1/CD64 (Biolegend, clone: X54-5/7.1, 1:100); PE-Cy5.5 – conjugated anti-ITGAX/CD11c (Biolegend, clone: N418, 1:100); APC conjugated anti-H2-Ea/I-A/I-E (MHC-II) (Biolegend, clone: M5/114.15.2, 1:200); Alexa Fluor 700 – conjugated anti-Ly6G (Biolegend, clone: 1A8, 1:200); LIVE/DEAD Fixable Near – IR Dead Cell Stain Kit (Thermo Fischer Scientific, L34975).
Histology
Brains were dissected and fixed overnight in 4% paraformaldehyde (PFA) and stored in 0.1% PFA until further processing. The tissues were embedded in paraffin, and samples were stained with hematoxylin and eosin (HE; Abcam, ab245880), luxol fast blue (LFB-PAS; Sigma, L0294) to determine the degree of demyelination, mouse anti-mouse APP (3 μg/ml; clone: 22 C11; Millipore, MAB348) for assessment of axonal damage. Rat anti-mouse LAMP2/Mac-3 (2.5 µg/ml, clone M3/84; BD Pharmingen, 550,292) for macrophages/microglia, rat anti-human CD3 (3.5 µg/ml, mouse cross-reactivity; clone CD3-12; Serotec/BioRad, MCA1477) for T cells. Rabbit anti-mouse AIF1/Iba1 (1 µg/ml; WAKO, 019–19,741) and biotin labeled secondary antibodies (2.5 µg/ml; Southern Biotech, 3050–08; 1031–08) were added for 45 min at room temperature (RT), followed by incubation with streptavidin (Southern Biotech, 7100–05) for 45 min at RT. 3ʹ-diaminobenzidine (DAB) brown chromogen (Dako, K8000) was used for the resolution of the aforementioned antibodies.
Immunohistochemistry
Brain tissue was fixed in 4% PFA overnight, dehydrated in 30% sucrose (Sigma, S0389) solution (in 1xPBS) and embedded in TissueTek® (Sakura, 1426). Thirty-micron-thick sections were acquired and a free-floating staining protocol was followed as described previously [Citation40,Citation41]. Microglia and SQSTM1 staining was performed as previously described [Citation42] with minor modifications. In brief, following 90 min at RT blocking with 5% normal donkey serum (Sigma, D9663) containing 0.1% Triton X-100 (Sigma Aldrich, T8787), sections were incubated with the primary antibodies against AIF1/Iba1 (1:500, rabbit; WAKO, 019–19,741) and SQSTM1/p62 (1:250, guinea pig; Progen, GP62-C) for 24 h at 4°C. Secondary antibodies anti-rabbit Alexa Fluor 488 (ThermoFisher, A32766) and anti-guinea pig Alexa Fluor 647 (ThermoFisher, A21450) were incubated for 24 hrs at 4°C followed by 10 min nuclei DAPI staining (1:10,000; Carl Roth, 6335.1).
Imaris reconstruction
For AIF1/Iba1 signal reconstruction: Images were acquired using a Leica SP8 confocal microscope with x20 magnification (1024x1024). Semi-automated filament reconstruction was performed using Imaris 9.6 software (Bitplane) as previously described [Citation40]. For AIF1/Iba1-SQSTM1/p62 colocalization: Images were acquired using a Leica SP8 confocal microscope with x63 magnification (1024x1024). Automated surface reconstruction of both signals was performed using Imaris 9.6 software (Bitplane) as previously described [Citation40] with minor modifications. In brief, Iba1 signal was reconstructed using the surface plugin. The reconstructed signal was used as a filtering mask on the SQSTM1/p62 channel. The SQSTM1/p62 signal inside the AIF1/Iba1+ cells was reconstructed with the surface plugin. Images were obtained using the same acquisition parameters and fluorescent signals were reconstructed using the same threshold (absolute intensity) settings.
Induction of active EAE
On day 0, mice were anaesthetized with isoflurane and immunized with 200 µg MOG35-55 (MEVGWYRSPFSRVVHLYRNGK) in Complete Freud adjuvant (CFA) via subcutaneous injection in the flank region. Subsequently, on day 0 and day 1, 200 ng of Pertussis toxin in PBS was administered to all mice via intraperitoneal injection. After induction of EAE, mice were monitored daily for weight loss and development of symptoms. Score was documented daily as follows: 0, no detectable signs of EAE; 0.5, distal limp tail; 1, complete limp tail; 1.5, limp tail and hindlimb weakness; 2, unilateral partial hindlimb paralysis; 2.5, bilateral partial hindlimb paralysis; 3, complete bilateral hindlimb paralysis; 3.5 complete bilateral hindlimb paralysis and partial forelimb paralysis; 4, moribund (animal unable to move due to paralysis); and 5, animal found dead. In the following instances, animals were immediately euthanized with CO2: disease score of 3 for more than 7 days, disease score of 3.5 for more than 3 days, and reaching disease score of 4.
Cytokine quantification
One hemisphere of the brain was used for the quantification of cytokines produced after induction of EAE. Flash frozen hemispheres from each mouse were homogenized using ceramic beads in a homogenizer and the supernatants were used for further quantification. To measure the cytokines, Q-Plex array Mouse Cytokine inflammation (14-Plex) (Quansys biosciences, 110,449 MS) was used. The supernatants were used in 1:1 dilution. Fifty µl of the calibrator and the supernatants were added to the polypropylene 96-well plate. The plate was kept on a plate shaker at 500 rpm for 1 h at room temperature. Followed by 3 washing steps and 50 µl of detection mix was added and incubated on the plate shaker at 500 rpm for 1 h at room temperature. Subsequently, the plate was washed 3 times and 50 µl of Streptavidin-HRP 1X (Q-Plex Array Mouse Cytokine Inflammation (14-plex); Quansys Biosciences, 110,449 MS) was added in each well. The plate was incubated on the plate shaker for 15 min at 500 rpm, room temperature. Finally, the plate was washed 6 times and imaged for cytokine measurement using a Q-View Imager (Quansys Biosciences).
Statistical analysis
Mann-Whitney test and two-way ANOVA were performed. A p-value <0.05 was considered statistically significant. The asterisks depicted in the figures translate into the following grouping: *P < 0.05, ** P < 0.01, *** P < 0.001. All quantitative analyses were performed with GraphPad Prism v5.0a (GraphPad Software).
Supplemental Material
Download Zip (5.6 MB)Acknowledgments
We thank Dr. Melanie Greter (University of Zürich) for valuable discussion and Dr. Iva Lelios (University of Zürich), Kerstin Stein and Dr. Omar Chuquisana (University of Münster) for excellent technical assistance. J.D.L. was supported by the Swiss National Foundation (31003A-169664), the Novartis Foundation for medical-biological research, and the Swiss Multiple Sclerosis Society. C.M. was supported supported by Cancer Research Switzerland (KFS-4091-02-2017 and KFS-4962-02-2020), KFSP-PrecisionMS and HMZ ImmunoTargET of the University of Zurich, the Coronavirusfonds UZH, the Cancer Research Center Zurich, the Vontobel Foundation, the Baugarten Foundation, the Sobek Foundation, the Swiss Vaccine Research Institute, Roche, Novartis and the Swiss National Science Foundation (310030B_182827 and CRSII5_180323).
Disclosure statement
The authors report no conflict of interests.
Supplementary material
Supplemental data for this article can be accessed here.
Additional information
Funding
Related Research Data
References
- Morishita H, Mizushima N. Diverse cellular roles of autophagy. Annu Rev Cell Dev Biol. 2019;35(1):453–475.
- Galluzzi L, Green DR. Autophagy-independent functions of the autophagy machinery. Cell. 2019;177(7):1682–1699.
- Martinez J, Malireddi RS, Lu Q, Cunha LD, Pelletier S, Gingras S, Orchard R, Guan JL, Tan H, Peng J, Kanneganti TD. Molecular characterization of LC3-associated phagocytosis reveals distinct roles for Rubicon, NOX2 and autophagy proteins. Nature cell biology. 2015 Jul;17(7):893–906
- Mrdjen D, Pavlovic A, Hartmann FJ, Schreiner B, Utz SG, Leung BP, Lelios I, Heppner FL, Kipnis J, Merkler D, Greter M. High-dimensional single-cell mapping of central nervous system immune cells reveals distinct myeloid subsets in health, aging, and disease. Immunity. 2018 Feb 20;48(2):380–95
- Prinz M, Jung S, Priller J. Microglia biology: one century of evolving concepts. Cell. 2019;179(2):292–311.
- Jordão MJ, Sankowski R, Brendecke SM, Locatelli G, Tai YH, Tay TL, Schramm E, Armbruster S, Hagemeyer N, Groß O, Mai D. Single-cell profiling identifies myeloid cell subsets with distinct fates during neuroinflammation. Science. 2019 Jan 25;363(6425)
- Masuda T, Sankowski R, Staszewski O, Böttcher C, Amann L, Scheiwe C, Nessler S, Kunz P, van Loo G, Coenen VA, Reinacher PC. Author correction: Spatial and temporal heterogeneity of mouse and human microglia at single-cell resolution. Nature. 2019 Apr;568(7751):E4–
- Ginhoux F, Greter M, Leboeuf M, Nandi S, See P, Gokhan S, Mehler MF, Conway SJ, Ng LG, Stanley ER, Samokhvalov IM. Fate mapping analysis reveals that adult microglia derive from primitive macrophages. Science. 2010 Nov 5;330(6005):841–5
- Schulz C, Perdiguero EG, Chorro L, Szabo-Rogers H, Cagnard N, Kierdorf K, Prinz M, Wu B, Jacobsen SE, Pollard JW, Frampton J. A lineage of myeloid cells independent of Myb and hematopoietic stem cells. Science. 2012 Apr 6;336(6077):86–90
- Tay TL, Mai D, Dautzenberg J, Fernandez-Klett F, Lin G, Datta M, Drougard A, Stempfl T, Ardura-Fabregat A, Staszewski O, Margineanu A. A new fate mapping system reveals context-dependent random or clonal expansion of microglia. Nature neuroscience. 2017 Jun;20(6):793
- Ajami B, Bennett JL, Krieger C, Tetzlaff W, Rossi FM. Local self-renewal can sustain CNS microglia maintenance and function throughout adult life. Nature neuroscience. 2007 Dec;10(12):1538–43
- Dong Y, Yong VW. When encephalitogenic T cells collaborate with microglia in multiple sclerosis. Nat Rev Neurol. 2019;15(1):1–14.
- Keller CW, Münz C, Lünemann JD. Autophagy pathways in CNS myeloid cell immune functions. Trends Neurosci. 2020;43(12):1024–1033.
- Kuma A, Hatano M, Matsui M, Yamamoto A, Nakaya H, Yoshimori T, Ohsumi Y, Tokuhisa T, Mizushima N. The role of autophagy during the early neonatal starvation period. Nature. 2004 Dec;432(7020):1032–6
- Hara T, Nakamura K, Matsui M, Yamamoto A, Nakahara Y, Suzuki-Migishima R, Yokoyama M, Mishima K, Saito I, Okano H, Mizushima N. Suppression of basal autophagy in neural cells causes neurodegenerative disease in mice. Nature. 2006 Jun;441(7095):885–9
- Komatsu M, Waguri S, Chiba T, Murata S, Iwata JI, Tanida I, Ueno T, Koike M, Uchiyama Y, Kominami E, Tanaka K. Loss of autophagy in the central nervous system causes neurodegeneration in mice. Nature. 2006 Jun;441(7095):880–4
- Yoshii SR, Kuma A, Akashi T, Hara T, Yamamoto A, Kurikawa Y, Itakura E, Tsukamoto S, Shitara H, Eishi Y, Mizushima N. Systemic analysis of Atg5-null mice rescued from neonatal lethality by transgenic ATG5 expression in neurons. Developmental cell. 2016 Oct 10;39(1):116–30
- Buttgereit A, Lelios I, Yu X, Vrohlings M, Krakoski NR, Gautier EL, Nishinakamura R, Becher B, Greter M. Sall1 is a transcriptional regulator defining microglia identity and function. Nature immunology. 2016 Dec;17(12):1397–406
- Utz SG, See P, Mildenberger W, Thion MS, Silvin A, Lutz M, Ingelfinger F, Rayan NA, Lelios I, Buttgereit A, Asano K. Early fate defines microglia and non-parenchymal brain macrophage development. Cell. 2020 Apr 30;181(3):557–73
- Inoue S, Inoue M, Fujimura S, Nishinakamura R. A mouse line expressing Sall1‐driven inducible Cre recombinase in the kidney mesenchyme. genesis. 2010mar;48(3):207–12 doi:10.1002/dvg.20603
- Voikar V, et al. Automated dissection of permanent effects of hippocampal or prefrontal lesions on performance at spatial, working memory and circadian timing tasks of C57BL/6 mice in IntelliCage. Behav Brain Res. 2018;352:8–22.
- Bhattacharya A, Parillon X, Zeng S, Han S, Eissa NT. Deficiency of autophagy in dendritic cells protects against experimental autoimmune encephalomyelitis. Journal of Biological Chemistry. 2014 Sep 19;289(38):26525–32
- Keller CW, Sina C, Kotur MB, Ramelli G, Mundt S, Quast I, Ligeon LA, Weber P, Becher B, Münz C, Lünemann JD. ATG-dependent phagocytosis in dendritic cells drives myelin-specific CD4+ T cell pathogenicity during CNS inflammation. Proceedings of the National Academy of Sciences. 2017 Dec 26;114(52):E11228–37
- Keller CW, Kotur MB, Mundt S, Dokalis N, Ligeon LA, Shah AM, Prinz M, Becher B, Münz C, Lünemann JD. CYBB/NOX2 in conventional DCs controls T cell encephalitogenicity during neuroinflammation. Autophagy. 2020 May 7:1–5
- Paolicelli RC, Bolasco G, Pagani F, Maggi L, Scianni M, Panzanelli P, Giustetto M, Ferreira TA, Guiducci E, Dumas L, Ragozzino D. Synaptic pruning by microglia is necessary for normal brain development. science. 2011 Sep 9;333(6048):1456–8
- Parkhurst CN, Yang G, Ninan I, Savas JN, Yates III JR, Lafaille JJ, Hempstead BL, Littman DR, Gan WB. Microglia promote learning-dependent synapse formation through brain-derived neurotrophic factor. Cell. 2013 Dec 19;155(7):1596–609
- Safaiyan S, et al. Age-related myelin degradation burdens the clearance function of microglia during aging. Nat Neurosci. 2016;19(8):995.
- Hagemeyer N, Hanft KM, Akriditou MA, Unger N, Park ES, Stanley ER, Staszewski O, Dimou L, Prinz M. Microglia contribute to normal myelinogenesis and to oligodendrocyte progenitor maintenance during adulthood. Acta neuropathologica. 2017 Sep;134(3):441–58
- Cheng J, Liao Y, Dong Y, Hu H, Yang N, Kong X, Li S, Li X, Guo J, Qin L, Yu J. Microglial autophagy defect causes parkinson disease-like symptoms by accelerating inflammasome activation in mice. Autophagy. 2020 Dec 1;16(12):2193–205
- Hammond TR, Marsh SE, Stevens B. Immune signaling in neurodegeneration. Immun. 2019;50(4):955–974.
- Herz J, Filiano AJ, Smith A, Yogev N, Kipnis J. Myeloid cells in the central nervous system. Immunity. 2017 Jun 20;46(6):943–56
- Heckmann BL, Teubner BJ, Tummers B, Boada-Romero E, Harris L, Yang M, Guy CS, Zakharenko SS, Green DR. LC3-associated endocytosis facilitates β-amyloid clearance and mitigates neurodegeneration in murine Alzheimer’s disease. Cell. 2019 Jul 25;178(3):536–51
- Choi I, Zhang Y, Seegobin SP, Pruvost M, Wang Q, Purtell K, Zhang B, Yue Z. Microglia clear neuron-released α-synuclein via selective autophagy and prevent neurodegeneration. Nature communications. 2020mar13;11(1):1–4 doi:10.1038/s41467-020-15119-w
- Butovsky O, Weiner HL. Microglial signatures and their role in health and disease. Nat Rev Neurosci. 2018;19(10):622–635.
- Ising C, Venegas C, Zhang S, Scheiblich H, Schmidt SV, Vieira-Saecker A, Schwartz S, Albasset S, McManus RM, Tejera D, Griep A. NLRP3 inflammasome activation drives tau pathology. Nature. 2019 Nov;575(7784):669–73
- Croxford AL, Lanzinger M, Hartmann FJ, Schreiner B, Mair F, Pelczar P, Clausen BE, Jung S, Greter M, Becher B. The cytokine GM-CSF drives the inflammatory signature of CCR2+ monocytes and licenses autoimmunity. Immunity. 2015sep15;43(3):502–14 doi:10.1016/j.immuni.2015.08.010
- Mundt S, Mrdjen D, Utz SG, Greter M, Schreiner B, Becher B. Conventional DCs sample and present myelin antigens in the healthy CNS and allow parenchymal T cell entry to initiate neuroinflammation. Science immunology. 2019jan25;4(31) 31 doi:10.1126/sciimmunol.aau8380
- Wolf Y, Shemer A, Levy‐Efrati L, Gross M, Kim JS, Engel A, David E, Chappell‐Maor L, Grozovski J, Rotkopf R, Biton I. Microglial MHC class II is dispensable for experimental autoimmune encephalomyelitis and cuprizone‐induced demyelination. European journal of immunology. 2018 Aug;48(8):1308–18
- Martinez J, Cunha LD, Park S, Yang M, Lu Q, Orchard R, Li QZ, Yan M, Janke L, Guy C, Linkermann A. Noncanonical autophagy inhibits the autoinflammatory, lupus-like response to dying cells. Nature. 2016 May;533(7601):115–9
- Datta M, Staszewski O, Raschi E, Frosch M, Hagemeyer N, Tay TL, Blank T, Kreutzfeldt M, Merkler D, Ziegler-Waldkirch S, Matthias P. Histone deacetylases 1 and 2 regulate microglia function during development, homeostasis, and neurodegeneration in a context-dependent manner. Immunity. 2018 Mar 20;48(3):514–29
- Mezö C, Dokalis N, Mossad O, Staszewski O, Neuber J, Yilmaz B, Schnepf D, de Agüero MG, Ganal-Vonarburg SC, Macpherson AJ, Meyer-Luehmann M. Different effects of constitutive and induced microbiota modulation on microglia in a mouse model of Alzheimer’s disease. Acta neuropathologica communications. 2020 Dec;8(1):1–9
- Choi I, Seegobin SP, Liang D, Yue Z. Synucleinphagy: a microglial “community cleanup program” for neuroprotection. Autophagy. 2020sep1;16(9):1718–20 doi:10.1080/15548627.2020.1774149