
ABSTRACT
Scavenger receptors are pattern recognition receptors that recognize both foreign and self-ligands, and initiate different mechanisms of cellular activation, often as co-receptors. The function of scavenger receptor CD36 in the immune system has mostly been studied in macrophages but it is also highly expressed by innate type B cells where its function is less explored. Here we report that CD36 is involved in macro-autophagy/autophagy in B cells, and in its absence, the humoral immune response is impaired. We found that CD36-deficient B cells exhibit a significantly reduced plasma cell formation, proliferation, mitochondrial mobilization and oxidative phosphorylation. These changes were accompanied by impaired initiation of autophagy, and we found that CD36 regulated autophagy and colocalized with autophagosome membrane protein MAP1LC3/LC3 (microtubule-associated protein 1 light chain 3). When we investigated T-cell-dependent immune responses, we found that mice with CD36 deficiency, specifically in B cells, exhibited attenuated germinal center responses, class switching, and antibody production as well as autophagosome formation. These findings establish a critical role for CD36 in B cell responses and may also contribute to our understanding of CD36-mediated autophagy in other cells as well as in B cell lymphomas that have been shown to express the receptor.
Abbreviations: AICDA/AID: activation-induced cytidine deaminase; ATG5: autophagy related 5; ATP: adenosine triphosphate; BCR: B-cell receptor; CPG: unmethylated cytosine-guanosine; CQ: chloroquine; DC: dendritic cells; FOB: follicular B cells; GC: germinal center; Ig: immunoglobulin; LPS: lipopolysaccharide; MAP1LC3/LC3: microtubule-associated protein 1 light chain 3; MFI: mean fluorescence intensity; MZB: marginal zone B cells; NP-CGG: 4-hydroxy-3-nitrophenylacetyl-chicken gamma globulin; OCR: oxygen consumption rate; oxLDL: oxidized low-density lipoprotein; PC: plasma cells; Rapa: rapamycin; SQSTM1/p62: sequestosome 1; SRBC: sheep red blood cells; Tfh: follicular helper T cells; TLR: toll-like receptor.
Introduction
After B cells leave the bone marrow, their development continues in the periphery where they divide into distinct naïve subpopulations called follicular B cells (FOB), marginal zone B cells (MZB), and B1 B cells. In mice, FOB recirculate through secondary lymphoid organs whereas MZB are confined in the spleen [Citation1]. The B1 B cells originate from fetal liver or bone marrow are self-renewing and inhabit mainly peritoneal and pleural cavities. A small population of these cells is also found in secondary lymphoid organs [Citation2]. All these B cells can be recruited to become antibody-producing plasma cells by either selection in the germinal center (GC) or through a quick extrafollicular B cell response. The GCs are located in secondary lymphoid organs including the spleen and lymph nodes where B cells proliferate, differentiate and are selected during immune response to T cell dependent antigens [Citation3]. In the GC, B cells are selected by follicular helper T (Tfh) cells through the capability of B cells to take up and present antigens on MHC class II via the B cell receptor (BCR), before becoming plasma cells or memory cells [Citation4,Citation5]. This ability is enhanced through somatic hypermutation induced by AICDA/AID (activation-induced cytidine deaminase) generating affinity matured BCRs that can take up more antigen [Citation6]. Alternatively, plasma cells can differentiate through a fast extrafollicular response producing primarily low-affinity IgM antibodies [Citation7]. This activation can also give rise to unswitched memory cells, and MZB and B1 cells are more prone to be recruited to this response [Citation8,Citation9].
Through both GC reaction and extrafollicular response, B cells go through differentiation programs that require large changes in metabolism to allow for proliferation and in the end for the generation of antibodies. This significantly increases their endoplasmic reticulum stress and requires changes in mitochondrial mass [Citation10,Citation11]. Moreover, B cells require initiation of autophagy to recycle unneeded or misfolded proteins including antibodies. As an example, in mice where B cells are deficient for the ATG5 (autophagy-related 5), there is an impaired T cell-dependent antibody response and reduction in long-lived plasma cell formation [Citation10]. This impairment was also true for T cell-independent B cell responses and when the mice were infected with Heligmosomoides polygyrus, there was a decrease in the antibody response and delayed clearance of the parasite [Citation12]. These studies show that autophagy is crucial for B cell activation and plasma cell formation, but much remains unknown about how autophagy is initiated and what signals regulate the process. The key signaling pathway for B cell activation is through BCR ligation, which induces signals through the phosphatidylinositol-3-kinase (PI3K) pathway that also induces the formation of LC3B-containing autophagosomes [Citation13]. The additional signals that B cells receive through co-stimulation and cytokine activation during this step are crucial for the outcome of the activation, and if there is insufficient stimulation, B cells will undergo apoptosis. On the other hand, if the signals adding to BCR ligation are enough B cells will present antigen on MHC Class II to generate Tfh cells and start the GC reaction [Citation14]. During immune activation, several different pattern recognition receptors initiate autophagy pathways through the addition of their specific ligands [Citation15]. As an example, several members of the toll-like receptor (TLR) family have been shown to initiate autophagy and need this process to impose the full effect of cellular activation [Citation16]. The mechanisms for autophagy differ between cell types where for instance TLR7 does not induce autophagy in plasmacytoid dendritic cells whereas it does so in macrophages [Citation17,Citation18]. Furthermore, the initiation of autophagy does not necessarily require exogenous ligands and in response to inflammation, oxidized proteins and lipids will accumulate in plasma cells and memory B cells. These could potentially serve as intracellular signals that initiate autophagy and also as ligands for pattern recognition [Citation19–21].
One pattern recognition receptor expressed by B cells that recognize these ligands is CD36, which is a scavenger receptor of the class B type and it is highly expressed by MZB [Citation22]. As a transmembrane receptor, CD36 is a 78-kDa to 94-kDa protein that varies in size due to degrees of N-linked glycosylation. Apart from B cells, CD36 is expressed by macrophages, dendritic cells (DC), and also certain nonimmune cells like endothelial cells, adipocytes and muscle cells [Citation23,Citation24]. Scavenger receptors recognize foreign and modified self-antigens and are defined by their ability to bind oxidized low-density lipoprotein (oxLDL) [Citation25]. In addition to oxLDL, CD36 has been shown to bind other oxidized phospholipids, long-chain fatty acids and THBS (thrombospondin) [Citation23]. Just like other scavenger receptors, the function of CD36 depends on the cell type and the context of activation [Citation26]. In phagocytic cells, CD36 exerts pattern-recognition including apoptotic cell recognition and clearance [Citation27]. Moreover, in macrophages and DC, CD36 is required for intracellular transport of long-chain fatty acids and oxLDL [Citation28,Citation29]. Also, through CD36-mediated signaling, the CD5-like protein induces autophagy and prevents TNF/TNFA secretion by macrophages [Citation30]. Studying infection and the humoral response, it was shown that in cd36 knockout mice the IgM and IgG levels were slightly reduced in response to heat-killed Streptococcus pneumonia [Citation31]. Since CD36 is involved in several mechanisms during immune activation, we here investigate the role of CD36 in B cells by using mice with genetic ablation of CD36 specifically in B cells. Our finding reveals that CD36 deficiency in B cells suppress plasma cell formation, class switching, proliferation, and metabolic activation. This was accompanied by fewer autophagosomes in B cells lacking CD36 and we found that the receptor colocalizes with LC3B during autophagy induction. This shows that pattern recognition connected to modified self is part of autophagy adaption in B cells.
Results
CD36 controls differentiation, proliferation, and metabolic status of B cells
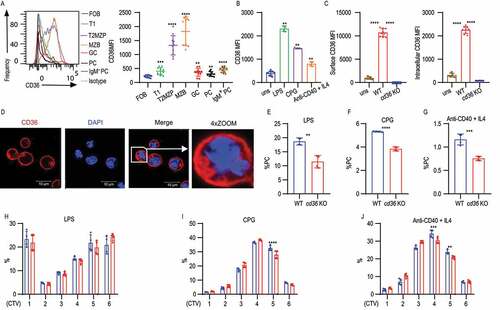
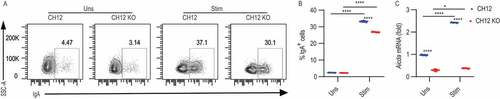
To investigate the role of CD36 in B cell activation, we first determined the expression pattern on naïve and activated B cell subsets from mice. CD36 has previously been shown to be highly expressed by MZB and we confirmed this using splenic B cells [Citation31]. We also found CD36 expression on other B cell subsets including transitional type 1 (T1) cells, transitional type 2 (T2) cells, T2 marginal zone precursors (T2MZP) cells, GC B cells, and plasma cells (PC). We also found that in the PC population the highest expression was on IgM+ cells ( and S1A-E). The basal expression of CD36 on FOB was low but it could be induced by stimulation with either TLR4 ligand (LPS), TLR9 agonist (CPG), or anti-CD40 + IL4 (). Moreover, we observed that the increased CD36 expression was not only located on the cell surface but also detected intracellularly with flow cytometry when cells were stimulated with LPS (). To confirm this, we performed immunofluorescence staining of CD36 on activated B cells and we found that CD36 was localized both on the cell membrane and intracellularly in a punctate pattern in LPS-stimulated splenic B cells (). Next, B cell activation was investigated using stimulated splenic B cells from WT and cd36 knockout (KO) mice in vitro. We found that after stimulation CD36-deficient B cells showed reduced PC formation and this was true for LPS, unmethylated CPG, and anti-CD40 + IL4 stimulation (, S1F, and S1G). The reduced PC formation was accompanied by a slight delay in proliferation at later cell divisions for CPG and anti-CD40 + IL4 stimulation whereas no difference was seen with LPS ( and S1H-J). Investigating cell death, we found that anti-CD40 + IL4 stimulation of CD36-deficient B cells gave rise to higher levels of cleaved CASP3 (caspase 3) but we found no difference for CPG and LPS (Fig. S1K-M).
Figure 1. CD36 deficiency leads to reduced B cell activation and changes in metabolic status in B cells. (A) Representative histograms (left) and quantification analysis of mean fluorescence intensity (MFI) (right) of CD36 staining in splenic B cells from C57BL/6 mice, including follicular B cells (FOB), transitional type 1 B cells (T1), T2MZP transitional type 2 marginal zone B cell progenitors (T2MZP), marginal zone B cells (MZB), germinal center B cells (GC) and plasma cells (PC). (B) MFI of CD36 staining in splenic B cells from WT and cd36 KO mice cultured with LPS, CPG, or anti-CD40 + IL4 for 3 d presented relative to unstimulated (uns). (C) MFI of surface (left) and intracellular (right) CD36 staining in splenic B cells from WT and cd36 KO mice after LPS stimulation. (D) Confocal microscopy analysis of CD36 staining in splenic B cells stimulated with LPS. Image size 35 µm × 35 µm. (E-G) The frequency of PCs derived from purified splenic B cells cultured for 3 d. (H-J) The bar charts showing the proliferation of splenic B cells from WT and cd36 KO mice stimulated with LPS, CPG, or anti-CD40 + IL4 measured by cell trace violet (CTV) dilution. Data are representative of three independent experiments. *P < 0.05, **P < 0.01 and ***P < 0.001 (Mann-Whitney test)
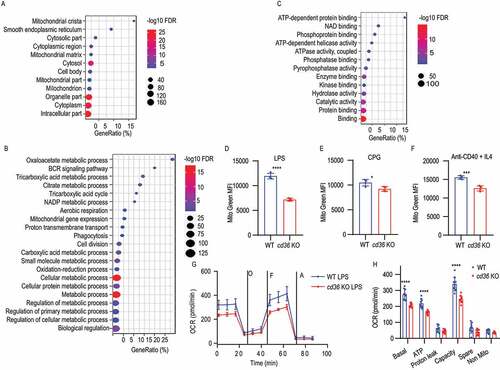
Since scavenger receptors are known to participate in many cellular functions and little is known of their function in B cells, especially intracellularly, we next used immunoprecipitation of CD36 and proteomic analysis of the binding partners to investigate this further (Fig. S2A). First, the immunoblotting analysis showed that CD36 could be specifically pulled down by a specific antibody and not by control antibodies (Fig. S2B). Next, three biological replicates from pull-down samples or Ig isotype controls were analyzed by 10-plex Tandem Mass Tags mass spectrometry (Table S1). The mass spectrometry analysis of anti-CD36 immunoprecipitation identified 1,499 proteins, out of which 174 proteins were enriched more the 1.5-fold compared to pull-down with a control antibody. When we investigated the top 50 proteins by network analysis, none of these was known to interact with CD36 suggesting that CD36 had a different role in B cells (Fig. S2C). Thus, to determine the functional relevance of these proteins, we performed cellular component, biological process, and molecular function distribution analysis using the gene ontology (GO) database. We found that 165 proteins were identified as intracellular, connected to the endoplasmic reticulum and mitochondrial function (). The biological process analysis identified that the enriched proteins were predominantly involved in metabolic processes and coupled to BCR signaling (). In line with this, we found that 143 proteins were connected to adenosine triphosphate (ATP) binding, ATPase activity, and connected processes suggesting a role for CD36 in metabolic regulation (). Since these data collectively suggest that proteins interacting with CD36 in B cells were primarily intracellular, we next investigated changes in mitochondrial mass after stimulation, as this is an important event in B cell activation [Citation32]. Using MitoTracker Green staining, we found mitochondrial mobilization to be reduced in all stimulations in the absence of CD36 (). This suggested that metabolic changes were perturbed in CD36-deficient B cells and thus we measured oxygen consumption rate after stimulation. B cells stimulated with LPS induced a rapid increase in oxygen consumption rate (OCR) and we found that WT B cells had a higher basal ATP-linked and maximal respiration compared with B cells lacking CD36 ( and 2H). In summary, these data show that B cells lacking CD36 failed to fully enter the B cell differentiation program and displayed impaired proliferation, reduced mitochondrial mass, and lower oxidative phosphorylation activation. This suggests that CD36 functions as a facilitator of differentiation in B cells apart from its function as a pattern recognition receptor of foreign ligands.
Figure 2. Identification of CD36 co-immunoprecipitated proteins by mass spectrometry analysis. (A-C) Gene ontology enrichment analysis of cellular component, biological process, and molecular function for the identified proteins. The dot plot of enriched pathways is indicated as the ratio of the expressed gene number to the total gene number multiplied 100 in a certain gene ontology annotation. The size and color of the dots represent the gene number and the range of p-values, respectively. (D-F) The histograms are presenting the mitochondrial mass of B cells from WT and cd36 KO mice under LPS, CPG, or anti-CD40 + IL4 treatments. (G) Dot plots showing oxygen consumption rate (OCR) measured by mitochondrial stress test of purified B cells from WT and cd36 KO mice cultured for 24 h in vitro after LPS stimulation, then placed in an extracellular flux analyzer and treated sequentially with oligomycin (O), FCCP (F) and antimycin (A). (H) Bar chart showing the OCR quantification analysis at basal, ATP-linked (ATP), proton leak, and maximal capacity (Capacity), spare capacity (Spare), and nonmitochondrial (Non-Mito) respiration. Data are representative of three independent experiments. *P < 0.05, **P < 0.01 and ***P < 0.001 (Mann-Whitney test)
Deletion of CD36 in B cells results in decreased autophagy
In B cells, autophagy has been shown to be involved in plasma cell formation and subsequent antibody production, and the metabolic changes connected to autophagy are essential for the humoral immune response [Citation10,Citation33]. CD36 has been implicated in autophagy regulation in macrophages [Citation30], but it remains unknown if it serves this function in B cells. We reasoned that the metabolic changes we detected in CD36-deficient B cells may be indicative of a role for CD36-mediated autophagy in B cells as well. We first measured autophagy in splenic B cell subsets using immunofluorescence Cyto-ID to detect autophagosomes by flow cytometry. We found autophagy to be higher in T2 MZP, MZB, PC, and IgM+ PC cells, compared to FOB which also correlates with their relative CD36 expression (). In addition, increased CD36 expression and plasma cell formation were accompanied by more autophagosome formation in splenic B cells after LPS stimulation in vitro (). In line with a role for CD36 in autophagy, we found that B cells from CD36-deficient mice displayed less autophagosome formation than that of WT B cells after LPS stimulation ().
Figure 3. CD36 deficiency in B cells results in impaired autophagy. (A) Distribution of fluorescence (left) and quantification of MFI (right) of Cyto-ID staining in splenic B cells from C57BL/6 mice. (B-D) MFI of CD36 staining, frequency of Cyto-ID staining, and percentage of PCs in purified splenic B cells cultured in medium containing LPS for 2 and 3 days (D) in comparison with 0 d. (E) Histogram of Cyto-ID staining in LPS stimulated B cells from WT and cd36 KO mice. (F) Western blot analysis of CD36 and LC3B protein levels in CH12 and CH12 KO cells. GAPDH serves as a loading control throughout. Right, quantification of band intensity. (G) Representative histograms (left) and quantification of Cyto-ID staining (right) in CH12 and CH12 KO. (H) Immunoblot analysis of CD36 expression in CH12 and CH12 KO cells transfected with empty vector (Mock) or plasmid with Cd36 (+Cd36). Right, quantification of band intensity. (I-J) Histograms showing CD36 and Cyto-ID staining in transfected cells. Data are representative of three independent experiments. *P < 0.05, **P < 0.01 and ***P < 0.001 (Mann-Whitney test)
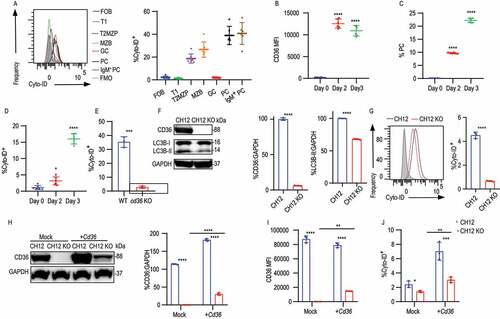
To further test the role of CD36 in autophagy in B cells, we screened a number of murine B cell lines and found that CH12 cells, an innate type B cell line expressed the receptor [Citation34]. To generate cd36 knockout CH12 cells (CH12 KO), two guide RNAs (gRNA1 and gRNA2) were used together to induce deletion via CRISPR-Cas9 (Fig. S3A). The deletion was subsequently confirmed by sequencing (Fig. S3B). Western blotting and flow cytometry were performed to verify cd36 knockout at the protein level (, S3C and S3D). To study autophagy more closely, we investigated the generation of LC3B, which is hydrolyzed by protease ATG4 to LC3B-I [Citation35,Citation36]. Next, via a variety of ubiquitin-like reactions, LC3B-I becomes conjugated the lipid phosphatidylethanolamine to generate LC3B-II which is involved in autophagosome membrane expansion and fusion [Citation37,Citation38]. We found that compared to control cells, loss of CD36 in CH12 cells results in decreased LC3B-II suggesting decreased autophagosome formation ( and 3G). In line with this, CD36-deficient CH12 cells showed impaired LC3B-I to LC3B-II conversion in comparison with control. To exclude the possibility that the difference we observed was caused by off-target effects, we generated two additional cd36 knockout clones by using gRNA1 and gRNA2 separately. These independently deleted clones showed no CD36 expression (Fig. S3E) and the loss of CD36 in both clones showed decreased autophagic flux (Fig. S3F). Finally, to further prove that the autophagy deficiency in CH12 KO cells was due to the loss of CD36, the receptor was re-introduced into CH12 KO cells by a human UBC (ubiquitin C) promoter driving the expression of a C-terminally V5-tagged Cd36. We found that reintroduction of Cd36 rescued autophagosome formation in CH12 KO cells (). The link to autophagy was also verified in CHO cells where overexpression of CD36 upregulated autophagy (Fig. S3G and S3H). Thus, these data show that in line with B cells, CD36 overexpressionin CHO cells leads to enhanced formation of autophagosomes.
CD36 interacts with LC3B during autophagy in B cells
To determine the underlying molecular mechanisms of the role of CD36 in autophagy, we next analyzed the regulation of autophagosome formation using inducers and autophagic flux inhibitors in B cells. The MTOR inhibitors rapamycin (Rapa) and Torin-1 were used to induce autophagic flux, and chloroquine (CQ) was used to inhibit autophagic flux by blocking autophagosome-lysosome fusion. We also investigated the ubiquitin-binding protein SQSTM1/p62 (sequestosome 1) which is coupled to LC3B-II, as a cargo receptor protein, which interacts with autophagic substrates and can serve as an indicator of autophagic flux [Citation39]. We found that the addition of Rapa led to an increase in autophagic flux as measured by a decrease in SQSTM1 in CH12 cells, but not in CH12 KO cells (). It was also clear that upon the addition of CQ that there were fewer autophagosomes formed in the CH12 KO compared to the CH12 cells ( and 4B). Although the addition of Rapa and CQ together induced accumulation of LC3B-II in both CH12 and CH12 KO cells, they were incapable of compensating for the autophagy deficiency in the absence of CD36 (). This was also true when using another inhibitor of MTOR (Torin-1) (). Next, we confirmed these findings using primary splenic B cells from WT and cd36 KO mice and found that also here regardless of the stimulation CD36 deficiency resulted in lower autophagy (). To validate whether autophagosome formation or autophagic flux contributed to the autophagy defect seen, we compared the amount of autophagosomes that accumulated after the addition of CQ. The data show that CH12 KO had less autophagic flux in comparison with control with or without Rapa (Fig. S4).
Figure 4. CD36 colocalized with LC3B after autophagy induction. (A) Immunoblot analysis of LC3B and SQSTM1 protein levels, (B) quantification of LC3B-II intensity, and (C) frequency of Cyto-ID staining in CH12 and CH12 KO treated with 100 nM rapamycin (Rapa), 10 uM chloroquine (CQ), the combination or control (CTRL). (D) Immunoblot analysis of LC3B, (E) quantification of LC3B-II intensity, and (F) frequency of Cyto-ID staining in CH12 and CH12 KO treated with 100 nM Torin-1, 10 uM CQ, or the combination. (G) Quantification of Cyto-ID staining in purified B cells from WT and cd36 KO mice stimulated by LPS for 24 h, and then treated with 100 nM Torin-1, 10 uM CQ, or the combination for 6 h. (H and I) Confocal microscopy analysis of CD36, MitoTracker Red (Mito-red) for mitochondria staining, and CANX (calnexin) for endoplasmic reticulum staining in CH12 cells. (J) The quantification of surface and intracellular CD36 MFI in CH12 and CH12 KO cells by flow cytometry. (K) Immunoblot analysis of VDAC2 (voltage dependent anion channel 2) as mitochondria marker, CANX, CD36, GAPDH for isolated mitochondria, and cytosol proteins from CH12 cells. (L) Confocal microscopy analysis of CD36 and LC3B staining in CH12 cells treated with 100 nM Rapa and 10 uM CQ for 6 h. (M) Endogenous CD36 immunoprecipitation followed by anti-CD36 and anti-LC3B immunoblot of CH12 cells treated with 100 nM Rapa and 10 uM CQ for 6 h. Data are representative of three independent experiments. *P < 0.05, **P < 0.01 and ***P < 0.001 (Mann-Whitney test)
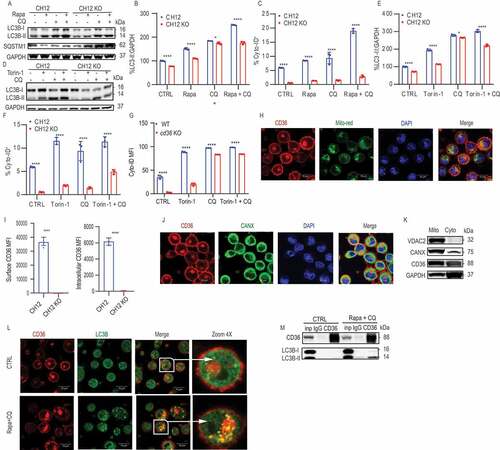
To further investigate the role of CD36, we stained CH12 cells using immunofluorescence and found the receptor expressed both at the cell membrane and intracellularly ( and 4I). We found that intracellular CD36 was located close to nuclei and partly colocalized with mitochondria () and endoplasmic reticulum (). Using western blot, we showed that both CD36 and CANX (calnexin) were found in isolated mitochondria identified by VDAC2 (voltage dependent anion channel 2) (). Induction of autophagy by Rapa and blockage of lysosomal fusion to the autophagosome after CQ changed the intracellular pattern of CD36 staining from large structures to minute spots in CH12 cells. Furthermore, the spots stained positive for LC3B, suggesting that CD36 was colocalized with autophagosomes (). To further confirm the colocalization, immunoprecipitation was performed by the pull-down of CD36. We found that LC3B-II but not LC3B-I was co-immunoprecipitated with CD36 after Rapa and CQ induction (), suggesting that CD36 participates in the autophagy machinery after LC3B-I is formed. In summary, autophagy induction could not rescue the disadvantage displayed by CD36-deficient B cells and we found colocalization of intracellular CD36 with LC3B-II, which highlights an association between CD36 and the autophagosome.
CD36 is required for plasma cell formation and Ig class switching in vitro
Our initial investigation showed that B cells from cd36 KO mice had a delayed response to TLR ligands and anti-CD40 + IL4 stimulation in vitro. T-cell-dependent activation of B cells induces class switching and it has been shown that CH12 cells are able to switch from IgM to IgA-producing cells upon stimulation with anti-CD40, IL4 and TGFB/TGF-β for 3 d [Citation34]. Thus, we next investigated whether CD36-mediated autophagy plays a role in class switching in CH12 cells. At baseline, we found few IgA+ cells for both CH12 and CH12 KO but a large number of IgA+ cells were induced by the cytokine cocktail. Interestingly, we found that the frequency of IgA+ cells in CH12 KO was fewer than that of control cells showing that loss of CD36 impairs class switching ( and 5B). When B cells are activated to switch, a genetic program starts acting on the BCR locus and other cellular processes to prepare for B cells for this transition to become GC B cells and ultimately plasma cells [Citation40]. Ig class switching as well as subsequent somatic hypermutation of the gene encoding Ig, is initiated by AICDA [Citation41,Citation42]. In B cells AICDA expression has been linked to TLR activation through canonical NFKB/NF-κB activation and it has been suggested that the mechanism is connected to the assembly of signaling complexes in the vicinity of endosomes [Citation9]. Also, data shows that there is a B cell-intrinsic role for RAB7A that is a small GTPase involved maturation of endosomes and AICDA expression [Citation43]. Consistent with the impairment in class-switching, we found less Aicda mRNA in CH12 KO cells compared with WT cells after stimulation (). Thus, the absence of CD36 impairs cytokine-induced switching as well as the upregulation of Aicda in B cells.
Figure 5. CD36 is involved in immunoglobulin class switching in vitro. (A) Representative contour plot showing IgA staining in CH12 and CH12 KO cells stimulated with 10 μg/mL anti-CD40, 8 ng/mL IL4, and 8 ng/mL TGFB for 3 d. (B) Percentage of IgA+ cells among CH12 and CH12 KO cells after the stimulation. (C) Quantitative (RT)-PCR analysis of transcripts encoding Aicda in CH12 and CH12 KO cells after stimulation. Data are representative of three independent experiments. *P < 0.05, **P < 0.01 and ***P < 0.001 (Mann-Whitney test)
CD36-deficient B cells are unable to mount efficient T-dependent immune response
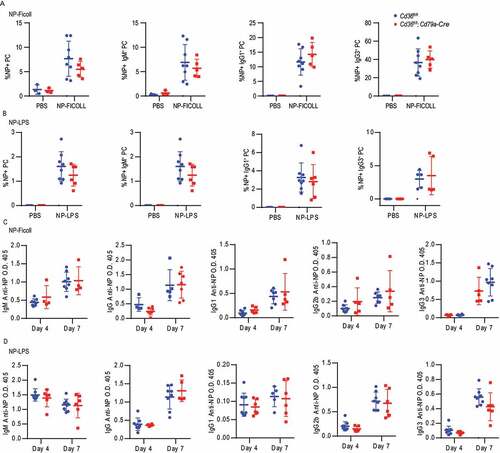
Complete loss of CD36 in mice was previously shown to give a reduced antibody response to Streptococcus pneumoniae [Citation31]. However, CD36 is expressed by not only B cells but also other immune cells like macrophages, DC and T cells, which may participate in the immune response and affect the outcomes. Thus, to evaluate the function of CD36 specifically in B cells in vivo, we crossed mice carrying floxed Cd36 alleles (Cd36fl/fl) to mice expressing Cre recombinase under the control of the Cd79a/Mb1 promotor generating mice that deletes Cd36 specifically in all B cells [Citation44,Citation45]. To investigate the role of CD36 in the humoral immune response, Cd36fl/fl; Cd79a-Cre and control mice were immunized with the T-dependent antigen, sheep red blood cells (SRBC), known to induce a potent GC response. Three or seven d after immunization, GC B cells, follicular helper T (Tfh) cells, PCs, and antibody levels were assessed. Compared with control mice, mice with CD36-deficient B cells had reduced GC compartments on day seven (, 6B and S5A-C). Consistent with a decrease in GC responses, we also found that the Tfh recruitment was reduced in mice lacking CD36 in B cells (). The GC is divided into a dark zone and a light zone separating B cell proliferation and somatic hypermutation from clonal selection governed by Tfh cells [Citation46]. We found that although fewer GCs were formed, no difference in frequency of dark zone and light zone B cells was observed between Cd36fl/fl; Cd79a-Cre and control mice (Fig. S5D and S5E). The reduction in GC responses was followed by less PCs development since we found reduced numbers of IgM+ and IgG3+ PCs on three d and fewer IgG1+ PCs on seven d (). The reduced PC numbers also influenced the SRBC-specific antibody response where we found a lower level of IgG1 on 3 d compared to WT mice, whereas total IgG and IgG3 were comparable between the groups (). Further examination showed that the decrease of GCs and PC was not because of defective proliferation since no difference in MKI67/Ki-67 staining was detected (Fig. S5F and S5G). In contrast, and in line with our in vitro data GC B cells from conditionally targeted mice lacking CD36 had lower autophagosome formation compared to control mice on 7 d (). To confirm these findings, we immunized the mice with the T cell-dependent antigen 4-hydroxy-3-nitrophenylacetyl-chicken gamma globulin (NP-CGG). Just like for SRBC, we found that Cd36fl/fl; Cd79a-Cre had lower numbers of NP-specific GC B cells as compared to control mice (Fig. S5H). Thus, the deletion of Cd36 specifically in B cells reduces autophagosome formation and also GC formation and antibody response to T cell-dependent antigens. Next, we crossed the Cd36fl/fl mice to mice expressing Cre regulated by the Aicda promoter (Aicda-Cre) generating mice that delete Cd36 after B cell activation during the GC reaction [Citation47]. When immunizing these mice with SRBC, we found less GC B cells on 7d as well as reduced numbers of IgM+ PC on 3 d (Fig. S5I-M). However, there was a less pronounced phenotype as compared to the Cd79a-driven deletion as there was no difference in Tfh numbers or the other PC subsets. Finally, we tested whether specific deletion of CD36 in B cells (Cd36fl/fl; Cd79a-Cre) had an impact on T-cell independent immune responses by immunization with NP-Ficoll or NP-LPS. We found that after both NP-LPS and NP-Ficoll immunization, NP-specific PCs, IgM+ PC, IgG1+ PC and IgG3+ PC numbers were comparable between CD36-deficient and control mice ( and 7B). Also, we did not detect any difference in the antibody response at 3 or 7 d after immunization ( and 7D). Thus, we conclude that CD36 in B cells is dispensable for the T-cell-independent immune response to these antigens in vivo. Thus, even though we found differences in B cell responses to T-cell-independent antigens in vitro the greatest influence in vivo is connected to T-cell-dependent responses and the GC reaction.
Figure 6. B cell-specific deletion of CD36 selectively impairs T-cell-dependent immune response. (A) Age-matched Cd36fl/fl and Cd36fl/fl; Cd79a-Cre mice were immunized i.v. with SRBC or PBS as a control. Visualization of GL-7+ GC B cells in the spleen section after 7 d immunization. GL-7+ GC B cells (red), SIGLEC1/CD169+ metallophilic macrophages (green), and B220+ B cells (blue). Image size is 1,500 µm × 1,500 µm. Percentage of GL-7+ GC area and the total NO. of GCs in spleen showed right (GL-7+ area ≥ 1,000 pixel units was counted and normalized to the spleen size). (B) Percentage of FAShigh GL-7high GC B cells among B220high IgDlow B cells 3 and 7 d after immunization. Blue dots present for Cd36fl/fl mice and red dots present for Cd36fl/fl; Cd79a-Cre mice. (C) Percentage of CXCR5+ PD-1high Tfh (among CD4+ TCRB+ T cells) at 3 or 7 d after immunization. (D) The frequency of B220low SDC1/CD138+ PC, 3, or 7 d after immunization. (E and F) The frequency of IgG3+ PC and IgG1+ PC, 3 or 7 d after immunization. (G-J) Serum was collected on 3 and 7 d and the level of IgM, IgG, IgG1, and IgG3 anti-SRBC were determined by ELISA. Data are representative of three independent experiments with 5–8 mice in each group. (K) Frequency of Cyto-ID staining in GC B cells. Data are representative of three independent experiments. *P < 0.05, **P < 0.01 and ***P < 0.001 (Mann-Whitney test)
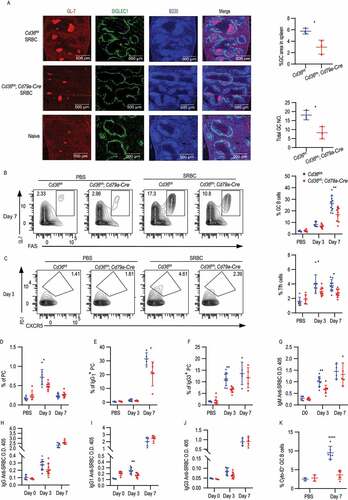
Figure 7. The loss of CD36 in B cells does not affect the T-independent immune responses. (A-B) Frequency of NP+ cells in PC, IgM+ PC, IgG1+ PC and IgG1+ PCs in Cd36fl/fl and Cd36fl/fl; Cd79a-Cre mice immunized i.v. with NP-LPS or NP-Ficoll bled after 7 d. (C-D) Serum IgM, IgG, IgG1, IgG2b, and IgG3 anti-NP levels 3 d and 7 d after immunization. Data are representative of three independent experiments with 5–8 mice in each group. Data are representative of three independent experiments. *P < 0.05, **P < 0.01 and ***P < 0.001 (Mann-Whitney test)
Intracellular CD36 in human peripheral B cells
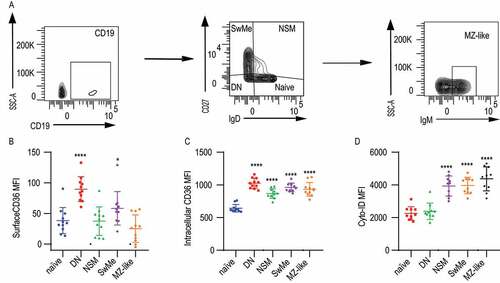
We next investigated whether intracellular CD36 could also be found in human B cell populations in peripheral blood and if this correlated with autophagy (). We gated on CD19+ B cells and investigated naïve B cells (IgD+ CD27−), double-negative (IgD− CD27−), non-switched memory cells (IgD+ CD27+), switched memory cells (IgD− CD27+) and marginal zone like cells (IgD− CD27+ IgMhigh) (). We found that on the cell surface, CD36 was expressed to a varying degree in human B cells. Double-negative, as well as switched memory B cells, had more CD36 expression compared with other populations (). Intracellular CD36 expression was detected in all human B cell populations except naïve B cells (). For all populations except double-negative cells, we also found an elevated level of autophagosomes (). Thus, both intracellular CD36 and autophagosomes were higher in human memory B cells, suggesting that CD36 expression could possibly be linked to autophagy also in human B cells.
Figure 8. Expression of intracellular CD36 and autophagy of human B cell subsets. (A) Gating strategy to identify human B cell subsets among peripheral blood CD19+ B cells. Naïve B cell (IgD+ CD27−), DN: double-negative B cells (IgD− CD27−), NSM: non-switched memory B cells (IgD+ CD27+), SwMe: switched memory B cells (IgD− CD27+), MZ-like; marginal zone like B cells (IgD− CD27+ IgM+). (B-D) MFI of surface CD36, intracellular CD36, and Cyto-ID staining for autophagy in human B cell subsets. Data are representative of three independent experiments. (E) *P < 0.05, **P < 0.01 and ***P < 0.001 (Mann-Whitney)
Discussion
In this study, we find that scavenger receptor CD36 plays a role in autophagy in B cells. In effect, CD36 deficiency in B cells resulted in decreased plasma cell formation, which was associated with reduced proliferation, mitochondrial mass, oxygen consumption and autophagosome formation. B cells lacking CD36 were impaired in autophagosome formation and we found that this was connected to an intracellular function of CD36 colocalizing with LC3B. Autophagy in B cells has been studied mainly in connection to B cell development [Citation48] and the role in naïve B cells and their activation has been debated as it has been shown that autophagy is dispensable, at least for anti-viral responses [Citation49]. On the other hand, non-canonical autophagy that occurs in the absence of some of these key autophagy components was shown to be activated in the GC suggesting that the role of autophagy is context-dependent [Citation50]. The switch to non-canonical autophagy connected changes in mitochondrial mass and reactive oxygen species production. These signals are important for the activation of B cells and the differentiation to PC as well as for Ig class switching [Citation11]. Here we found that fewer autophagosomes were formed in B cells lacking CD36 after activation. The impaired generation of autophagosomes in CD36-deficient B cells was rescued by the introduction of CD36, but it was not possible to be compensated by autophagosome inducers and there was a noticeable dearth in autophagosomes upon treatment with autophagic flux inhibitors. The autophagy disadvantage in CD36-deficient B cells could further be connected to the interaction of CD36 with LC3B that we found to colocalize under autophagy induction. If there is a direct binding between LC3 and CD36 is still unresolved but there are several LIR motifs in the sequence of CD36 suggesting that this could be the case. Also, further kinetic studies could show if different stimuli of B cells recruit CD36 at different time points and to varied degree. Further studies will be needed to evaluate if the changes in mitochondrial mass can also connect to elimination of damaged mitochondria and in this case alterations in mitophagy.
In vivo, we found that after T-dependent immunization, GC B cells, Tfh cells, PC, and antibody production were decreased in mice with CD36-deficient B cells. This reduction was also accompanied by less autophagosome formation. The results uncover a role for CD36-LC3B-regulated autophagy in B cells, which is required for the GC response and PC formation in the T-dependent immune response. Knocking out Cd36 conditionally using Cd79a-Cre or Aicda-Cre gave similar results even though Cd79a-Cre had a more pronounced phenotype. This suggests that the disadvantage of lacking CD36-driven autophagy also works before the expression of AICDA which needs to be upregulated upon B cell activation. In B cells CD36 has previously only been studied as a pattern recognition receptor on the cell surfaces where it is highly expressed by MZB. It was shown that cd36 knockout mice have a suppressed response to heat-killed S. pneumonia which is TI-II Ag suggesting a role for CD36 in pattern recognition by MZB [Citation31]. Here we generated mice with genetic ablation of Cd36 in B cells and GC B cells and immunized these mice with TI and TD antigens that do not bind the receptor to uncouple the study from its role as a pattern recognition receptor. We found that the response to the TI antigens NP-LPS as well as the TI-II antigen NP-Ficoll showed no difference between the Cd36fl/fl; Cd79a-Cre and Cd36fl/fl mice. Since the TI antigens do not require antigen presentation to T cells, the one possibility is that this response may be less dependent on autophagy. Thus, the data suggest that CD36 primarily plays a role in the TI response as a pattern recognition receptor when provided a ligand such as S. pneumonia. However, it plays a different role in the regulation of TD responses intracellularly connected to BCR uptake and autophagy. In vitro however, when B cells lacked interactions with other immune cells, we found that the loss of CD36 was enough to slow the response to TI antigens. We hypothesize that the reason for this is that the need for autophagy for B cell differentiation shows in vitro but not to the same extent in vivo where other signals are present. Furthermore, Ig class switching to IgA was impaired for CH12 lacking CD36, which connects this function of CD36 to Ig class switching. For the TD response in vivo, there was also a decrease in the switch which was most pronounced for IgG3 on 3 d and IgG1 on 7 d. This is in line with that switch to these subclasses can occur at different time points and it can also be sequential.
The involvement of CD36 in autophagy has been previously shown in macrophages, in connection to the CD5 molecule-like glycoprotein-mediated anti-inflammatory response to bacterial infection by inhibiting TNF secretion as well as inflammasome activation and IL1B production [Citation30]. In the study, small interfering RNA (siRNA) was used to knock down Cd36 in THP1 macrophages and this decreased autophagy induced by CD5 molecule-like glycoprotein that is mediated through phosphoinositide 3-kinase pathways. This suggests that CD36 can influence autophagy through several signaling pathways in macrophages [Citation30]. In this context, CD36 is a scavenger receptor recognizing modified self-antigens that arise not only during cell death but also through cellular activation including autophagy. Thus, it is tempting to hypothesize that an intracellular ligand might arise as a result of B cell activation and inflammatory responses and that this might influence the autophagy driven by CD36. Also, in DCs it has been shown that autophagy machinery is needed for presentation of both self and non-self-antigens on MHC class II for activation of naïve T cells [Citation51]. In this context, deletion of LC3B also impaired presentation of antigens on MHC class II by DCs taken up via phagocytosis [Citation52]. Also, LC3-associated phagocytosis is a non-canonical autophagy mechanism that links to TLR9 activation when macrophages engulf apoptotic debris [Citation53]. It was shown that LC3B associates with endosomes thus linking autophagy to macrophage activation in this context. Since it is known that TLR9 is also linked to BCR-mediated uptake of antigen [Citation54] and CD36 can bind to apoptotic cells, it is possible that this connects to activation of B cells and possibly also to immunological tolerance.
Another implication for this study connects to B cell malignancies as changes in autophagy are connected to the survival of cancer cells and resistance to drugs [Citation55]. In this context, activation of autophagy to induce cell death has been discussed as a way forward to target these cancers. So far, studies have shown that in B cell chronic lymphocytic leukemia, CD36 expression activated via STAT3 facilitates fatty acid uptake to meet the requirements of the rapid proliferation of tumor [Citation56,Citation57]. Thus, activation through CD36 could potentially be used as a more specific way to target autophagy for the treatment of lymphoma and further studies are warranted in this area. In summary, we found a novel function of CD36 in B cells in regulating metabolic status, autophagy formation, and the GC response to T cell-dependent antigens. This provides a novel insight into how scavenger receptors are used by B cells not only as pattern recognition receptors but also as regulators of cellular functions.
Materials and methods
Mice
cd36 KO mice on the C57Bl/6 background were kindly provided by Maria Febbraio (Lerner Research Institute, USA). WT control littermates were bred from the same backcross, therefore had an identical genetic background. Cd36fl/fl mice were kindly provided by Nada Abumrad (Washington University, USA) and Cd79a-Cre mice (B6.C(Cg)-Cd79atm1(cre)Reth/EhobJ) were purchased from the Jackson Laboratory. Aicda-Cre mice were provided by Meinrad Busslinger (IMP, Switzerland). Animals were kept and bred under specific pathogen-free conditions at the animal facility of the Center for Molecular Medicine L8. All experiments were approved by the local ethical committee (North Stockholm district court). Mice were used between 8–12 weeks of age- and gender-matched for each experiment.
Cell lines and in vitro cultures
CH12 cells (Sigma-Aldrich, SCC252) were cultured at a density of 1 × 10⁶ cells/ml in RPMI medium (GibcoTM, 11,875,093) supplemented with 10% FBS (HyClone, SV30160.03 HI), 1X penicillin-streptomycin (HyClone, SV30010), 1 mM sodium pyruvate (Sigma-Aldrich, S8636) and 50 μM 2-mercaptoethanol (Gibco, 21,985–023) in humidified environment at 37°C with 5% CO2. CHO cells were cultured in DMEM (HyClone, SH30243.01) modified with supplements. To generate cd36 knockout cells (CH12 KO) in CH12 cells, PiggyBac CRISPR-Cas9 (PB-CRISPR) was constructed by cloning the sgRNA and Cas9 sequence [Citation58] from pLentiCRISPR into a PiggyBac vector from PB-OSKML [Citation59]. We designed two gRNAs targeting Cd36, Cd36-g1: CGAGGAGAATGGGCTGTGAT and Cd36-g2: GGAGGCATTCTCATGCCAGT. The two gRNAs were separately cloned into PB-CRISPR, named PB-CRISPR-g1 and PB-CRISPR-g1. Two cloned gRNAswere mixed with CH12 cells in nucleofection solution and transfected with Z-001 in NucleofectorTM2b device according to a protocol for the mouse B cell nucleofectorTM Kit (Lonza, VVPA-1010). One week after transfection, clonal clusters of cells were picked, and the Cd36 gene was sequenced to confirm the deletion. To rescue Cd36 in CH12 KO cells, V5-tagged Cd36 cDNA was synthesized using IDT’s Gene Block, and the fragment’s cloned into modified PB-UbC vector. The whole cascades were integrated into the genome using PiggyBac System [Citation59], named pPB-UbC-cd36. plasmid pPB-UbC-cd36 was used to reintroduce Cd36 in CH12 KO cells via nucleofection. To induce class-switching in vitro, CH12 cells at a density of 1 × 10⁴ cells/mL were incubated in medium with 10 ug/mL anti-CD40 (Mabtech, 3621-1-250), 8 ng/mL IL4 (Pepro Tech, 10,780–146) and 10 ng/ml TGFB1 (Biolegend, 763,104) for 72 h. The frequency of IgA+, IgM+, and IgD+ cells was detected by flow cytometry (BD, LSRFortessaTMX-20). And the mRNAs of Aicda were tested by the quantitative PCR.
Primary B cell purification and ex vivo activation
To isolate B cells, spleens were harvested, filtered, red blood cells (RBC) lysed, and negatively selected by magnetic cell isolation using CD43 beads (Ly-48) according to EasySep™ Mouse B Cell Isolation Kit (Stemcell Technologies, 19,854). Purified B cells were activated with 10 μg/ml LPS (Sigma-Aldrich, L2880), 1 μM CPG (InvivoGen, tlrl-1826-5), or 10 μg/mL anti-CD40 with 8 ng/mL IL4.
Immunoprecipitation and immunoblotting
Cells were lysed on ice for 30 min in lysis buffer (0.5% NP-40 [Sigma-Aldrich, 98,379], 10 mM Tris-HCl, pH 7.4, 150 mM NaCl) supplemented with protease inhibitor cocktail (Sigma-Aldrich, P8340) and phosphatase inhibitor cocktail 2 (Sigma-Aldrich, P5726). After lysis, debris was pelleted by centrifugation at 16,000 g for 10 min at 4°C, and soluble protein concentration was quantified by DC™ Protein Assay Kit (Bio-Rad, 5,000,111). For immunoprecipitation, 2 µg goat anti-mouse CD36 antibody (R&D Systems, AF2519) or normal goat IgG (Sigma-Aldrich, NI02-100UG) in PBS (0.05% TWEEN® 20 [Sigma-Aldrich, P2287] in PBS [Sigma-Aldrich, P3813]) was incubated with Pierce™ Protein A/G Magnetic Beads (Thermo Fisher Scientific, 88,802) overnight with rotation at 4°C. Dynabeads were washed with PBST and then crosslinked with antibodies via 250 µL 5 mM BS3 (bis [sulfosuccinimidyl] suberate) (Thermo Fisher Scientific, 21,580). Immunoprecipitated proteins were either separated in 4–12% Bis-Tris gradient gels (Life Technologies, NP0335PK2) by the NuPAGE electrophoresis system and transferred onto a nitrocellulose membrane (Bio-Rad, 1,620,112) using Trans-Blot® Turbo™ Transfer System (Bio-Rad, 1704155EDU) used for analysis by mass spectrometry (MS) (see below). The transferred blots were blocked with 5% Nonfat milk (PanReac AppliChem, A0830) in PBST and followed by incubation with primary and secondary antibodies. Blots were developed with enhanced ECLTM Prime (GE Healthcare, RPN2232) and scanned with ImageQuant LAS4000 (GE Healthcare, 28–9558-10). ImageJ software (National Institutes of Health) was used for band densitometry. Primary and secondary antibodies for immunoblot were as follows: CD36 (R&D Systems, AF2519), LC3B (Sigma-Aldrich, L7543), GAPDH (Abcam, ab161802), SQSTM1/p62 (CiteAb, AP2183b), horseradish peroxidase-conjugated (HRP) antibodies sheep anti-rabbit IgG (Sigma-Aldrich, AP510P), mouse anti-goat IgG-HRP (Santa Cruz Biotechnology, sc-2354). Antibodies were diluted in 5% bovine serum albumin (Sigma-Aldrich, 05470) in PBST.
Mass spectrometry analysis
For the co-immunoprecipitation analysis, samples were eluted from the magnetic beads using 40 µL Lysis buffer (4% SDS [Sigma-Aldrich, L6026], 25 mM HEPES [Sigma-Aldrich, 83,264], pH 7.6, 1 mM DTT [Sigma-Aldrich, GE17-1318-01]), heated to 95°C and sonicated. The protein concentration was determined using the BioRad DC Protein Assay kit (Bio-Rad, 5,000,111). Samples were then prepared for mass spectrometry analysis using a modified version of the Filter Aided Sample Preparation protocol digestion [Citation60]. In brief, 200 µg of protein per sample was mixed with 1 mM DTT, 8 M urea (Sigma-Aldrich, U5378), 25 mM HEPES, pH 7.6 in a centrifugation filtering unit with a 10-kDa cutoff by Nanosep® Centrifugal Devices with Omega™ Membran10 K (Pall, OD010C34). The samples were then centrifuged at 14,000 g for 15 min with the flow-through discarded. This was followed by another addition of the 8 M urea buffer and centrifugation. Proteins were alkylated by the addition of 25 mM IAA (Sigma-Aldrich, I6125), in 8 M urea, 25 mM HEPES, pH 7.6 for 10 min, centrifuged at 14,000 g for 15 min followed by 2 more additions and centrifugations with 8 M urea, 25 mM HEPES pH 7.6 with the flow-through discarded. Protein samples were digested on the filter, using Pierce™ Trypsin Protease (Thermo Fisher Scientific, 90,057) at a final protease to protein ratio of 1:50 in 50 mM HEPES, pH 7.6 and incubated overnight at 37°C. After digestion, the filter units were centrifuged for 15 min, 14,000 g with the flow-through saved and followed by another centrifugation with 50 µL Milli-Q water with the flow-through retained. Peptides were collected and the concentration was determined using the DC Protein Assay kit. 1 µL of each sample was taken out for digestion check by LC-MS/MS analysis to determine the percentage of missed cleavages. Before labeling, samples were pH adjusted using 1 M triethylammonium bicarbonate buffer to approximately pH 8.5 (100 mM final conc.), and 80 μg of peptides were labeled with TMT10plex™ Isobaric Label Reagent Set (Thermo Fisher Scientific, 90,110) according to the manufacturer’s protocol. Labeling efficiency was determined by LC-MS/MS before the pooling of samples. The peptides underwent a further desalting step using Strata-X Solid Phase Extraction (Phenomenex) for a reverse-phase extraction. The purified samples were dried using SpeedVac with the samples stored at −20°C until use. The sample was dissolved in 20 µL solvent A with 10 μL injected. Samples were trapped on an acclaim™ PepMap™ 100 C18 HPLC desalting Columns (Thermo Fisher Scientific, 164,567), and separated on an Easy sprayTM C18 Reversed Phase HPLC Column (Thermo Fisher Scientific, ES800A). The nano capillary solvent A was 99.9% water and 0.1% formic acid (Sigma-Aldrich, 695,076) and solvent B was 5% water, 95% acetonitrile (Sigma-Aldrich, 34,851), and 0.1% formic acid. At a constant flow of 0.25 μL/min, the curved gradient went from 3% B to 6% at 12 min followed by an increase to 37% to 185 min with a steep increase up to 99% over 8 min. FTMS full scans at 120 000 resolution (and mass range 350–1550 m/z) were followed by data-dependent MS/MS (30 000 resolution) on the top 5 ions using higher-energy collision dissociation and collision-induced dissociation at 35% normalized collision energy. Precursors were isolated within a 1.4 m/z window. Automatic gain control targets were 1e6 for MS1 and 1e5 for MS2. The maximum injection times were 100 ms for MS1 and MS2. The entire duty cycle lasted ~2.5 s. Dynamic exclusion was used with a 30 s duration to prevent multiple reads of abundant ions. Precursors with unassigned charge state or charge state 1 were excluded. An underfill ratio of 1% was used. The MS raw files were searched using Sequest HT-Target Decoy PSM Validator under the software platform Proteome Discoverer 1.4 (Thermo Fisher Scientific) against the human Swiss-Prot database (released March 2019) and filtered to a 1% FDR cut off. We used a precursor ion mass tolerance of 10 ppm, and production mass tolerances of 0.02 Da for HCD-FTMS and 0.8 Da for CID-ITMS. The algorithm considered tryptic peptides with maximum 2 missed cleavages; cysteine carbamidomethylation and TMTsixplexas fixed modifications; oxidation of methionine as variable modifications.
Autophagy assay
To induce autophagy, cells were incubated with 100 nM rapamycin (Sigma-Aldrich, R8781-200uL), 100 nM Torin-1 (InvivoGen, inh-tor1), 10 μM chloroquine (Sigma-Aldrich, C6628) or the combinations at 37°C for 6 h. Autophagosomes were stained by Cyto-ID® autophagy detection kit 2.0 (Enzo Life Sciences, ENZ-KIT175) and detected via flow cytometry.
Confocal microscopy
For immunofluorescence microscopy, B cells were seeded onto poly-L-lysine-coated glass coverslips and fixed with cold methanol for 20 min. They were then incubated with antibodies rabbit anti-mouse LC3B (Sigma-Aldrich, L8918-200UL) and AF488 anti-CD36 (Bio-Rad Laboratories, MCA2748A488) in 1% FBS in PBS overnight at 4°C. Secondary antibody for LC3B, AF647 goat anti-rabbit IgG (Life Technologies, A-21,245) was incubated at room temperature (RT) for 1 h. For spleen staining, GCs were visualized by staining with Pacific Blue anti-B220 (BD, 103,227), FITC anti-SIGLEC1/CD169 (Bio-Rad antibodies, MCA947F), and PE anti-GL-7 antigen (Biolegend, 144,608) overnight at 4°C. Washed slides were mounted with proLong™ diamond antifade mountant (Invitrogen, P36961). Visual data were acquired with a confocal microscope (Zeiss, LSM880) and recorded with the LSM Image software. Images were analyzed with Photoshop.
Quantitative PCR analysis of RNA
For RT-PCR, RNA was extracted from 1 × 10⁶ cells with RNeasy® Mini Kit (QuaGen, 74,106) and retrotranscribed with iTaq Universal One-Step RT-qPCR Kits (Bio-Rad, 1,725,151). cDNA corresponding to 2 ng of the original RNA was used as a template. Quantitative PCR analysis was done in a mixture with a volume of 10 μL with 5 μL iTaq Universal SYBR Green Supermix (Bio-Rad, 1,725,121) on CFX96 Touch Real-Time PCR Detection System (Bio-Rad, 1,855,195) and 1 μL of 5 μM primers for Aicda transcripts: forward, TCC TGC TCA CTG GAC TTC G; reverse, GCG TAG GAA CAA CAA TTC CAC. Data were analyzed with Bio-Rad software.
Mitochondria and cytosol isolation
Collected cells were rinsed in ice-cold PBS, resuspended in HEPES-mannitol-sucrose buffer (10 mM HEPES [pH 7.5], 210 mM mannitol [Sigma-Aldrich, M4125], 70 mM sucrose [Sigma-Aldrich, S0389], 1 mM EDTA [Thermo Fisher Scientific, AM9260G]), and homogenized by six passages through a 25 G needle (Praxisdienst, 138,569). The homogenate was centrifuged at 2,000 g for 5 min at 4°C to pellet nuclei and unlysed cells, and the supernatant was centrifuged at 13,000 g for 10 min at 4°C. This supernatant was cytosol and the crude mitochondrial pellet was resuspended in 10 mM HEPES (pH 7.5), 210 mM mannitol, 70 mM sucrose, and 100 mM EGTA. The pellet was washed twice and lysed on ice for 30 min in lysis buffer.
Human samples
Human blood from healthy donors was sourced ethically and procured from the Stockholm Blood Bank. All researches were performed according to terms under the Institutional Review Board of Karolinska Institute approved protocol. Cryopreserved peripheral blood mononuclear cells from healthy donor blood were obtained following Ficoll-Hypaque (VWR, 17–1440-03) density gradient purification.
Immunization
For T-dependent immune response, mice were immunized intravenously with 200 uL SRBC (sheep red blood cells) (Håtunalab AB, 13,042) or intraperitoneally with 100 μg NP-CGG (Biosearch Technologies, N-5055D-5) mixed with 100 μL inject alum (Thermo Fisher Scientific, 77,161). For T-independent immunization, mice were injected intravenously with 50 μg NP-LPS (Biosearch Technologies, F1420) or 50 μg NP-Ficoll (Biosearch Technologies, F-1420-100). Blood was collected from the ventral tail artery.
Flow cytometry
Cells were Fc-blocked with purified anti-mouse CD16 and CD32 (BD, 553,141) to reduce unspecific binding and stained with live/dead fixable stain kit (Invitrogen, L34955) to exclude dead cells. They were then stained for surface antibodies for 30 min at 4°C. Surface antibodies for flow cytometry: BV421 anti-B220/CD45R (BD, 561,226), PE-Cy7 anti-SDC1/CD138 (Biolegend, 142,514), APC anti-IgD (Biolegend, 405,714), APC anti- IgM (Biolegend, 406,509), PE-Cy7 anti-FAS (BD, 557,653), V500 anti-B220 (Biolegend, 103,247), V500 anti-CD11b (BD, 562,127), PB anti-CD4 (Biolegend, 100,544), BV711 anti-TCRB/TCRβ (BD, 563,135), APC anti-PD-1(Biolegend, 109,112), PE-Cy7 anti-CXCR5 (BD, 560,617), NP-PE (Biosearch Technologies, N-5070-1), AF700 anti-CD36 (Bio-Rad, MCA2748A700). For intracellular staining, cells were fixed and permeabilized using a fixation/permeabilization solution kit (BD, 554,714). The following antibodies were used for intracellular staining: biotin anti-IgG1 (Biolegend, 406,604), BV421 streptavidin (Biolegend, 405,225), BV605 anti-IgG3 (BD, 144,135), BV605 anti-active CASP3 (BD, 564,094), AF700 anti-MKI67 (BD, 561,277). To detect the mitochondrial mass, cells were stained with MitoTracker™ Green FM (Thermo Fisher Scientific, M7514) at 37°C for 25 min. Then the cells were washed and continued with the other staining. Samples were detected by flow cytometry analyzed by FlowJo software (BD).
ELISA
To detect SRBC-specific IgM and IgG, ELISA plates were coated with 100 μL 0.25% SRBC and blocked with 5% nonfat milk in PBS. For NP-specific ELISA, plates were incubated with 10 μg/mL NP30-BSA (Biosearch Technologies, NP-BSA) at 4°C overnight. Washed Plates were blocked with block buffer (3 mM EDTA, 0.1% gelatin [Sigma-Aldrich, G2500], 1.5% BSA [Sigma-Aldrich, 05470] in PBS) for 2 h at RT. Then they are incubated with diluted serum 4°C overnight, incubated with alkaline phosphatase (AP)-conjugated secondary antibodies for 1 h at RT, and developed with phosphatase substrate (Sigma-Aldrich, S0942), and results were measured at 405 nm and 620 nm with an Eon Microplate Spectrophotometer (BioTek). Secondary antibodies for Elisa: AP-conjugated goat antibody to mouse IgM (SouthernBiochem, 1021–04), IgG (SouthernBiotech, 1030–04), IgG1 (SouthernBiotech, 1071–04), IgG2b (SouthernBiotech, 1091–04), and IgG3 (SouthernBiochem, 1100–04).
Statistical analysis
Prism software 8.0 was used for the analysis of graphs and data. Statistical significance was tested with Mann-Whitney test (*P < 0.05, **P < 0.01 and ***P < 0.001).
Supplemental Material
Download Zip (1 MB)Acknowledgments
We thank Maria Febbraio and Meinrad Busslinger for the kind gift of the mice, and Yuqing Hao for useful discussion. This study was supported by the Gustav V 80-years foundation and the Swedish Research Council.
Disclosure statement
The authors declare no conflict of interest.
Supplementary material
Supplemental data for this article can be accessed here.
Related Research Data
References
- Gray D, MacLennan IC, Bazin H, et al. Migrant μ+ δ+ and static μ+ δ− B lymphocyte subsets. European Journal of Immunology. 1982;12(7):564–569.
- Wells SM, Kantor AB, Stall AM. CD43 (S7) expression identifies peripheral B cell subsets. J Immunol. 1994;153(12):5503.
- McHeyzer-Williams LJ, Driver DJ. McHeyzer-Williams MGJCoih. Germinal center reaction. Curr Opin Hematol. 2001;8(1):52–59.
- Litman GW, Rast JP, Fugmann SDJNRI. The origins of vertebrate adaptive immunity. Nature Reviews. Immunology. 2010;10(8):543–553.
- Parra D, Takizawa F, Sunyer JOJARAB. Evolution of B cell immunity. Annual Review of Animal Biosciences. 2013;1(1):65–97.
- Bhattacharya D, Cheah MT, Franco CB, et al. Transcriptional profiling of antigen-dependent murine B cell differentiation and memory formation. Journal of Immunology (Baltimore, Md. : 1950). 2007;179(10):6808–6819.
- Cerutti A, Cols M, Puga IJNRI. Marginal zone B cells: virtues of innate-like antibody-producing lymphocytes. Nature Reviews. Immunology. 2013;13(2):118–132.
- Martin F, Oliver AM, Kearney JFJI. Marginal zone and B1 B cells unite in the early response against T-independent blood-borne particulate antigens. Immunity. 2001;14(5):617–629.
- Pone EJ, Zhang J, Mai T, et al. BCR-signalling synergizes with TLR-signalling for induction of AID and immunoglobulin class-switching through the non-canonical NF-κB pathway. Nat Commun. 2012;3(1):1–12.
- Pengo N, Scolari M, Oliva L, et al. Plasma cells require autophagy for sustainable immunoglobulin production. Nature Immunology. 2013;14(3):298.
- Jang K-J, Mano H, Aoki K, et al. Mitochondrial function provides instructive signals for activation-induced B-cell fates. Nature Communications. 2015;6:6750.
- Conway KL, Kuballa P, Khor B, et al. ATG5 regulates plasma cell differentiation. Autophagy. 2013;9(4):528–537. .
- Watanabe K, Ichinose S, Hayashizaki K, et al. Induction of autophagy by B cell antigen receptor stimulation and its inhibition by costimulation. Biochemical and Biophysical Research Communications. 2008;374(2):274–281.
- Sacquin A, Gador M, Fazilleau N. The strength of BCR signaling shapes terminal development of follicular helper T cells in mice.Eur J Immunol. 2017 [Aug];47(8):1295–1304. .
- Delgado M, Singh S, De Haro S, et al. Autophagy and pattern recognition receptors in innate immunity. UK: Oxford; 2009. p. 189–202.
- Xu Y, Jagannath C, Liu X-D, et al. Toll-like Receptor 4 Is a Sensor for Autophagy Associated with Innate Immunity. Immunity. 2007;27(1):135–144.
- Lee HK, Lund JM, Ramanathan B, et al. Autophagy-dependent viral recognition by plasmacytoid dendritic cells. Science (New York, NY). 2007;315(5817):1398.
- Delgado MA, Elmaoued RA, Davis AS, et al. Toll‐like receptors control autophagy. Embo J. 2008;27(7):1110–1121.
- Bhattacharya A, Eissa N. Autophagy as a stress response pathway in the immune system. International Reviews of Immunology. 2015;34(5):382–402.
- Bullon P, Marin-Aguilar F, Roman-Malo L AMPK/mitochondria in metabolic diseases. AMP-activated Protein Kinase: Springer; 2016. p. 129–152.
- Puleston DJ, Simon AKJI. Autophagy in the immune system. Immunology. 2014;141(1):1–8.
- Greenwalt DE, Lipsky RH, Ockenhouse CF, et al. Membrane glycoprotein CD36: a review of its roles in adherence, signal transduction, and transfusion medicine. Blood. 1992;80(5):1105. .
- Silverstein RL, Febbraio M. CD36, a scavenger receptor involved in immunity, metabolism, angiogenesis, and behavior. Sci Signal. 2009;2(72):re3.
- Won W-J, Bachmann MF, Kearney JF. CD36 is differentially expressed on B cell subsets during development and in responses to antigen. J Immunol. 2008;180(1):230.
- Gillotte-Taylor K, Boullier A, Witztum JL, et al. Scavenger receptor class B type I as a receptor for oxidized low density lipoprotein. J Lipid Res. 2001;42(9):1474.
- Febbraio M, Hajjar DP, Silverstein RL. CD36: a class B scavenger receptor involved in angiogenesis, atherosclerosis, inflammation, and lipid metabolism. J Clin Invest. 2001;108(6):785.
- Endemann G, Stanton LW, Madden KS, et al. CD36 is a receptor for oxidized low density lipoprotein. J Biol Chem. 1993;268(16):11811.
- Abumrad NA, El-Maghrabi MR, Amri EZ, et al. Cloning of a rat adipocyte membrane protein implicated in binding or transport of long-chain fatty acids that is induced during preadipocyte differentiation. Homology with human CD36. J Biol Chem. 1993;268(24):17665.
- Baillie AGS, Coburn CT, Abumrad NA. Reversible Binding of Long-chain Fatty Acids to Purified FAT, the Adipose CD36 Homolog. J Membr Biol. 1996;153(1):75–81.
- Sanjurjo L, Amézaga N, Aran G, et al. The human CD5L/AIM-CD36 axis: a novel autophagy inducer in macrophages that modulates inflammatory responses. Autophagy. 2015;11(3):487–502.
- Won W-J, Bachmann MF, Kearney J. CD36 is differentially expressed on B cell subsets during development and in responses to antigen. Journal of Immunology (Baltimore, Md. : 1950). 2008;180(1):230–237.
- Akkaya M, Traba J, Roesler AS, et al. Second signals rescue B cells from activation-induced mitochondrial dysfunction and death. Nature Immunology. 2018;19(8):871–884.
- Arnold J, Murera D, Arbogast F, et al. Autophagy is dispensable for B-cell development but essential for humoral autoimmune responses. Cell Death and Differentiation. 2016;23(5):853–864.
- Nakamura M, Kondo S, Sugai M, et al. High frequency class switching of an lgM+ B lymphoma clone CH12F3 to lgA+ cells. International Immunology. 1996;8(2):193–201.
- Kirisako T, Ichimura Y, Okada H, et al. The reversible modification regulates the membrane-binding state of Apg8/Aut7 essential for autophagy and the cytoplasm to vacuole targeting pathway. The Journal of Cell Biology. 2000;151(2):263–276.
- Klionsky DJ, Abdelmohsen K, Abe A, et al. Guidelines for the use and interpretation of assays for monitoring autophagy (3rd edition). Autophagy. 2016;12(1):1–222.
- Ohsumi Y. Molecular dissection of autophagy: two ubiquitin-like systems. Nat Rev Mol Cell Biol. 2001;2(3):211–216.
- Weidberg H, Shpilka T, Shvets E, et al. LC3 and GATE-16 N termini mediate membrane fusion processes required for autophagosome biogenesis. Developmental Cell. 2011;20(4):444–454.
- Kuma A, Komatsu M, Mizushima NJA. Autophagy-monitoring and autophagy-deficient mice. Autophagy. 2017;13(10):1619–1628.
- Stavnezer J. Immunoglobulin class switching. Curr Opin Immunol. 1996;8(2):199–205.
- Muramatsu M, Kinoshita K, Fagarasan S, et al. Class Switch Recombination and Hypermutation Require Activation-Induced Cytidine Deaminase (AID), a Potential RNA Editing Enzyme. Cell. 2000;102(5):553–563.
- Petersen-Mahrt SK, Harris RS, Neuberger MS. AID mutates E. coli suggesting a DNA deamination mechanism for antibody diversification. Nature. 2002;418(6893):99.
- Pone EJ, Lam T, Lou Z, et al. B cell Rab7 mediates induction of activation-induced cytidine deaminase expression and class-switching in T-dependent and T-independent antibody responses. J Immunol. 2015 [Apr 1];194(7):3065–3078.
- Kashiwamura S, Koyama T, Matsuo T, et al. Structure of the murine mb-1 gene encoding a putative sIgM-associated molecule. J Immunol. 1990;145(1):337.
- Cifarelli V, Ivanov S, Xie Y, et al. CD36 Deficiency Impairs the Small Intestinal Barrier and Induces Subclinical Inflammation in Mice. Cell Mol Gastroenterol Hepatol. 2017;3(1):82–98.
- Shinnakasu R, Inoue T, Kometani K, et al. Regulated selection of germinal-center cells into the memory B cell compartment. Nature Immunology. 2016;17(7):861.
- Robbiani DF, Bothmer A, Callen E, et al. AID is required for the chromosomal breaks in c-myc that lead to c-myc/IgH translocations. Cell. 2008;135(6):1028–1038.
- Miller BC, Zhao Z, Stephenson LM, et al. The autophagy gene ATG5 plays an essential role in B lymphocyte development. Autophagy. 2008;4(3):309–314.
- Chen M, Hong MJ, Sun H, et al. Essential role for autophagy in the maintenance of immunological memory against influenza infection. Nat Med. 2014;20(5):503.
- Martinez-Martin N, Maldonado P, Gasparrini F, et al. A switch from canonical to noncanonical autophagy shapes B cell responses. Science (New York, N.Y.). 2017;355(6325):641–647.
- Ghislat G, Lawrence TJC. immunology m. Autophagy in dendritic cells. 2018;15(11):944–952.
- Ma J, Becker C, Lowell CA, et al. Dectin-1-triggered recruitment of light chain 3 protein to phagosomes facilitates major histocompatibility complex class II presentation of fungal-derived antigens. The Journal of Biological Chemistry. 2012;287(41):34149–34156. .
- Hayashi K, Taura M, Iwasaki A. The interaction between IKKalpha and LC3 promotes type I interferon production through the TLR9-containing LAPosome.Sci Signal. 2018 [May 1];11(528):528.
- Eckl-Dorna J, Batista FD. BCR-mediated uptake of antigen linked to TLR9 ligand stimulates B-cell proliferation and antigen-specific plasma cell formation.Blood. 2009 [Apr 23];113(17):3969–3977.
- Zhang H. Targeting autophagy in lymphomas: a double-edged sword? Int J Hematol. 2018;107(5):502–512.
- Rozovski U, Harris DM, Li P, et al. STAT3-activated CD36 facilitates fatty acid uptake in chronic lymphocytic leukemia cells. Oncotarget. 2018;9(30):21268.
- Rutella S, Rumi C, Puggioni P, et al. Expression of thrombospondin receptor (CD36) in B-cell chronic lymphocytic leukemia as an indicator of tumor cell dissemination. Haematologica. 1999;84(5):419–424.
- Shalem O, Sanjana NE, Hartenian E, et al. Genome-scale CRISPR-Cas9 knockout screening in human cells. Science (New York, N.Y.). 2014;343(6166):84–87.
- Yusa K, Rad R, Takeda J, et al. Generation of transgene-free induced pluripotent mouse stem cells by the piggyBac transposon. Nature Methods. 2009;6(5):363–369.
- Wiśniewski JR, Zougman A, Nagaraj N, et al. Universal sample preparation method for proteome analysis. Nature Methods. 2009;6(5):359–362.