
ABSTRACT
Micronuclei are constantly considered as a marker of genome instability and very recently found to be a trigger of innate immune responses. An increased frequency of micronuclei is associated with many diseases, but the mechanism underlying the regulation of micronuclei homeostasis remains largely unknown. Here, we report that CGAS (cyclic GMP-AMP synthase), a known regulator of DNA sensing and DNA repair, reduces the abundance of micronuclei under genotoxic stress in an autophagy-dependent manner. CGAS accumulates in the autophagic machinery and directly interacts with MAP1LC3B/LC3B in a manner dependent upon its MAP1LC3-interacting region (LIR). Importantly, the interaction is essential for MAP1LC3 recruitment to micronuclei and subsequent clearance of micronuclei via autophagy (micronucleophagy) in response to genotoxic stress. Moreover, in contrast to its DNA sensing function to activate micronuclei-driven inflammation, CGAS-mediated micronucleophagy blunts the production of cyclic GMP-AMP (cGAMP) induced by genotoxic stress. We therefore conclude that CGAS is a receptor for the selective autophagic clearance of micronuclei and uncovered an unprecedented role of CGAS in micronuclei homeostasis to dampen innate immune surveillance.
Abbreviations: ATG: autophagy-related; CGAS: cyclic GMP-AMP synthase; CQ: chloroquine; GABARAP: GABA type A receptor-associated protein; GFP: green fluorescent protein; LAMP1: lysosomal associated membrane protein 1; LAMP2: lysosomal associated membrane protein 2; LIR, MAP1LC3-interacting region; MAP1LC3B/LC3B: microtubule associated protein 1 light chain 3 beta; NDZ: nocodazole; STING1: stimulator of interferon response cGAMP interactor 1
Selective macroautophagy is a cellular process that forms double-layered membrane vesicles to sequester macromolecules, organelles, or intracellular pathogens for lysosomal degradation [Citation1]. A number of molecules including autophagy-related (ATG) proteins orchestrate signaling events that regulate autophagy flux including autophagosome initiation, elongation, maturation and fusion with lysosomes [Citation2,Citation3]. Of these ATGs, ATG7 and Atg8-family proteins are core parts of the autophagy process [Citation4,Citation5]. Unsuccessful delivery or degradation of various cargoes is associated with a variety of human diseases [Citation6–9].
Generation of micronuclei under genotoxic stress is a hallmark of genomic instability [Citation10,Citation11]. Very recently, micronuclei are also found to be a trigger of innate immune responses [Citation12,Citation13]. Micronuclei usually originate from mis-segregation of DNA during cell division and appear as small membrane-enclosed cytoplasmic bodies containing whole or fragmented chromosomes that are surrounded by its own nuclear membrane [Citation14]. Increased frequency of micronuclei is associated with many diseases including cancer [Citation15], inflammation and autoimmune diseases [Citation16,Citation17], neurodegenerative diseases [Citation18], metabolic diseases [Citation19,Citation20] and cardiovascular diseases [Citation21]. Though recent work indicate that micronuclei can be subjected to autophagic degradation [Citation22,Citation23], the autophagy receptor responsible for the clearance of micronuclei remains unknown.
CGAS (cyclic GMP-AMP synthase) has been identified as a sensor of double-stranded DNA (dsDNA) located in the cytoplasm or micronuclei to induce innate immunity and cellular senescence [Citation12,Citation13,Citation24,Citation25]. Upon DNA binding, CGAS is activated to generate cGAMP from guanosine triphosphate (GTP) and adenosine triphosphate (ATP) [Citation24–26]. The second messenger cGAMP then binds with and activates STING1/MITA/MPYS/ERIS/TMEM173 (stimulator of interferon response cGAMP interactor 1) [Citation27–30]. The activated STING1 translocates from the endoplasmic reticulum to endoplasmic reticulum-Golgi intermediate compartment (ERGIC) to activate the downstream effectors TBK1 (TANK binding kinase 1) and IRF3 (interferon regulatory factor 3) to produce type I interferon (IFN) [Citation31]. Type I IFN act as a critical regulator in innate immunity by inducing the expression of a number of interferon-stimulated genes (ISGs) [Citation32]. Very recently, CGAS has been found to sense chromosomes upon mitotic nuclear envelope breakdown and trigger transcription-independent induction of apoptosis upon mitotic aberrations [Citation33]. Moreover, phosphoinositide interactions-mediated CGAS positioning at the plasma membrane has been revealed as a mechanism that ensure efficient discrimination of self and non-self DNA [Citation34]. Intriguingly, CGAS is also found to be located in the nucleus [Citation35–39] and nuclear CGAS has been reported to be an inhibitor of DNA damage repair to fuel genome instability [Citation36,Citation38].
CGAS has been previously reported to be recruited to micronuclei [Citation12,Citation13,Citation23,Citation39–42]. We have sought to charcterize the functional role of CGAS in the regulation of homeostasis of micronulcei. Our results showed that CGAS reduced the abundance of microculei in an autophagy-dependent manner. Moreover, CGAS directly interacts with ATG8 to recruit micronuclei for subsequent clearance via autophagy (micronucleophagy). Strikingly, CGAS-mediated micronucleophagy blunts micronuclei-mediated CGAS activation as demonstrated by the generation of cGAMP. Therefore, CGAS is considered as an autophagic receptor for the clearance of micronuclei to dampen micronuclei-mediated innate immune responses.
Results
CGAS reduced the abundance of micronuclei
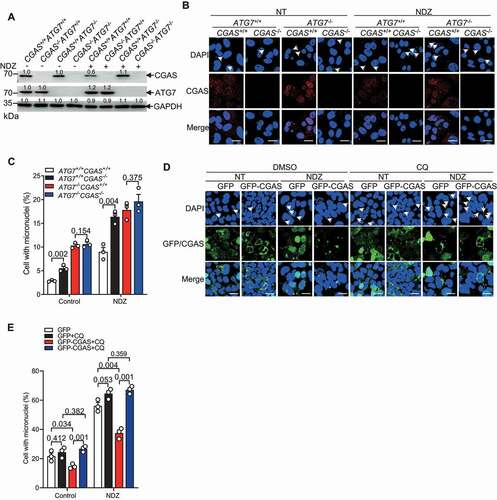
To find out whether CGAS affects the abundance of micronuclei, we transfected HEK293 cells with GFP-CGAS and induced micronucleation in these cells with available tools to examine the frequency of micronucleated cells using confocal microscopy. Overexpression of CGAS significantly reduced the frequency of cell with micronuclei in resting HEK293 cells ()). Treatment with nocodazole (NDZ) [Citation22,Citation43], paclitaxel [Citation44], camptothecin [Citation45], cisplatin [Citation46] or doxorubicin [Citation47] markedly enhanced the frequency of micronuclei-positive cells as expected (, S1A and S1B), which was significantly inhibited by CGAS overexpression as well (, S1A and S1B). We then generated CGAS knockout U2OS human osteosarcoma cell by using CRISPR–Cas9 genome editing (). Deletion of CGAS markedly increased the frequency of micronuclei in U2OS cells either left untreated or treated with NDZ, paclitaxel, camptothecin, cisplatin or doxorubicin (, S1C and S1D), which is supported by previous finding that the deletion of CGAS in replicative crisis human lung fibroblasts leads to accumulation of micronuclei [Citation48]. Of note, the complementation of CGAS−/- U2OS with WT CGAS, DNA-binding mutant CGASΔ171–174 or enzyme-inactive mutant CGASE225A,D227A [Citation24,Citation25], instead of pcDNA3.1-HA vector control all markedly reduced the frequency of micronuclei (Figure S1E and S1F), indicating that the role of CGAS in the regulation of micronuclei abundance is uncoupled from its canonical role in triggering type I IFN response. Together, these results suggested CGAS may reduce the abundance of micronuclei independent of the induction of type I IFN.
Figure 1. CGAS reduced the abundance of micronuclei. (A and B) Immunofluorescence assay showing the micronuclei in HEK293 cells stably transfected with GFP and GFP-CGAS in the absence or presence of NDZ (300 nM) treatment for 24 h followed by 48-h recovery (A). The quantification data were shown in (B). (C) Immunoblot of the lysates of U2OS cells stably transfected with control gRNA or gRNA targeting CGAS. (D and E) Immunofluorescence assay showing the micronuclei in WT and CGAS−/- U2OS cells in the absence or presence of NDZ (300 nM) treatment for 24 h followed by 48-h recovery (D). The quantification data were shown in (E). (F and G) Representative flow cytometry analysis of the micronuclei in reticulocytes isolated from WT and cgas−/- mouse left untreated or treated with NDZ at a dose of 5 mg/kg intraperitoneally for 24 h (F). The quantification data were shown in (G). Data are expressed as mean ± (SEM) of 3 independent experiments (B, E, G). n = 3 independent experiments (A, C, D, F). Nuclei were stained with DAPI (blue). One-way ANOVA with Bonferroni post hoc test were used for statistical analysis. Scale bar: 10 μm
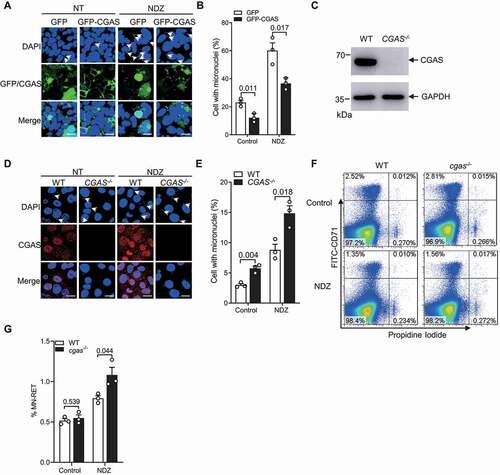
Of note, it has been implicated that micronuclei harboring signs of DNA damage are prone to be subjected to autophagic clearance [Citation22]. Moreover, CGAS has been reported to be recruited to membrane ruptured micronuclei [Citation12,Citation13]. We therefore examined whether CGAS is more prone to regulate the abundance of micronuclei harboring γH2AX, a hallmark of DNA damage [Citation49]. However, our data demonstrated that CGAS inhibited the frequency of γH2AX-positive and -negative micronuclei with similar potency (Figure S2A and S2B), indicating that CGAS may not selectively regulate the homeostasis of DNA damaged micronuclei. Moreover, FACS analysis of ANXA5/annexin-V and propidium iodide (PI) staining in WT and CGAS−/- U2OS cells treated with NDZ demonstrated that the deficiency of CGAS did not significantly affect NDZ-induced cell death in U2OS cells (Figure S2C and S2D), indicating that CGAS-mediated regulation of micronuclei homeostasis was not caused by dysregulated cell death. We further measured the diameters of the micronuclei in WT and CGAS−/- U2OS cells, and observed that the deletion of CGAS did not significantly affect the diameters of micronuclei (Figure S2E).
We then checked whether CGAS modulates the abundance of micronuclei in vivo. Both WT and cgas KO mice were treated with NDZ at a dose of 5 mg/kg intraperitoneally for 24 h, followed by quantification of the abundance of micronuclei in reticulocytes in peripheral blood by staining with FITC-CD71 and PI [Citation50,Citation51]. FACS analysis revealed that the deficiency of CGAS markedly enhanced the frequency of micronuclei-positive reticulocytes induced by NDZ (), indicating that CGAS regulates micronuclei homeostasis in vivo as well.
CGAS interacted with LC3
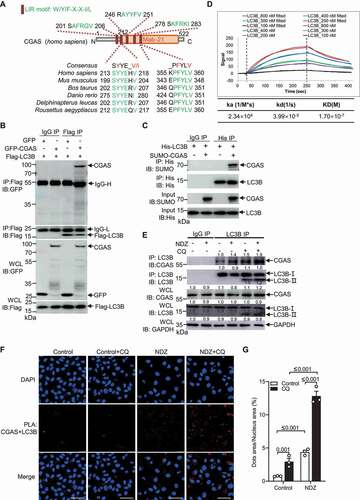
The abundance of proteins and cellular organelles is usually controlled by selective autophagy, a process mediated by autophagy receptors that simultaneously bind the cargoes and MAP1LC3/LC3 (microtubule associated protein 1 light chain 3) or GABARAP (GABA type A receptor-associated protein) proteins on phagophore membranes [Citation52]. CGAS contains 5 LC3-interacting regions (LIRs) as analyzed by iLIR web server [Citation53], 2 among which are conserved among various species (). LIR is generally required for the autophagy receptors to bind with LC3/GABARAP, a hallmark of autophagy [Citation52,Citation54]. Co-IP experiment also demonstrated the interaction of cGAS with Atg8-family proteins including yellow fluorescent protein (YFP)-tagged LC3A, LC3B, LC3C, GABARAP, GABARAPL1 and GABARAPL2, and the binding affinity of LC3B was strongest, suggesting that CGAS may interact with Atg8-family proteins with various binding affinity (Figure S3A). By purifying SUMO-tagged CGAS and GST-tagged Atg8-family proteins, GST affinity-isolation assay further demonstrated a direct interaction between CGAS and various Atg8-family proteins, and of highest binding affinity with LC3B (Figure S3B). Co-IP experiment with GFP-CGAS and Flag-LC3B further demonstrated that CGAS interacted with LC3B (). By purifying SUMO-tagged CGAS and His-tagged LC3B, an affinity-isolation assay further demonstrated a direct interaction of CGAS with LC3B (). Surface plasmon resonance (SPR) assay also revealed that the binding affinity of CGAS with LC3B is at a KD of 170 nM (). Moreover, treatment with NDZ enhanced the endogenous interaction of CGAS with LC3B in U2OS cells, and inhibition of autophagy by CQ increased the interaction (), indicating a stimuli-dependent interaction. Furtherly, we checked the interaction of CGAS with LC3B in U2OS cells left untreated or treated with NDZ in the absence or presence of CQ by proximity ligation assay [Citation55]. The data demonstrated that NDZ treatment markedly enhanced the interaction of CGAS with LC3B, which was further enhanced by blockade of autophagy with CQ (). Taken together, CGAS interacted with LC3B in response to genotoxic stress involving the induction of autophagy.
Figure 2. CGAS interacted with LC3B. (A) Prediction of LIRs in CGAS by iLIR and protein sequence alignments of conserved LIR motifs. (B) Immunoblot of cell lysates or anti-Flag immunoprecipitates from HEK293 cells that had been transfected with Flag-LC3B and GFP-CGAS. (C) Results of in vitro precipitation assay with anti-His antibody and protein agarose of His-tagged LC3B and SUMO-tagged CGAS. (D) Binding curves of surface-immobilized SUMO-tagged CGAS with His-tagged LC3B at concentrations of 800 nM, 400 nM, 300 nM, 200 nM and 100 nM. Vertical lines mark the starts of association and dissociation phases of the binding events. The dashed lines are global fits to a Langmuir reaction model; global fitting parameters are listed in the table below the plot. (E) Immunoblot of cell lysates and anti-LC3B immunoprecipitates from U2OS cells in the absence or presence of NDZ (300 nM) treatment for 24 h followed by 24-h recovery, and cells were left untreated or treated with CQ (40 μM) treatment 8 h prior to harvesting. (F and G) PLA showing the interaction of CGAS with LC3B in U2OS cells left untreated or treated with NDZ (300 nM) for 24 h followed by 48-h recovery, and cells were cultured in the absence or presence of CQ (40 μM) for 12 h prior to harvesting (F). The quantification data were shown in (G). Data are representative of n = 3 independent experiments (B-F). Data are expressed as mean ± (SEM) of 3 independent experiments (G). Scale bar: 50 μm
LIR domain of CGAS was required for CGAS-LC3 interaction
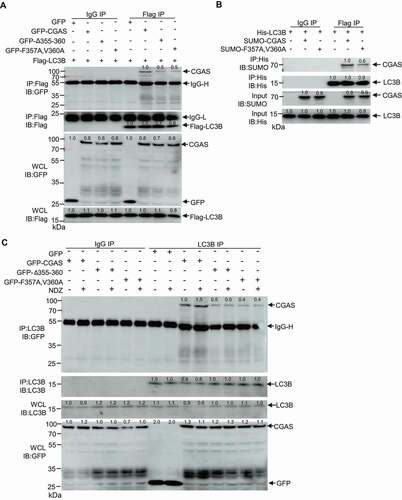
We next investigated whether LIR of CGAS is responsible for the binding of CGAS with LC3. Deleting LIR355-360 from CGAS or mutating evolutionarily conserved phenylalanine 357 and valine 360 of CGAS to alanine abolished the interaction between CGAS and LC3B ( and S3C). We then purified SUMO-tagged WT CGAS and CGASF357A,V360A, the mutation largely impaired the direct interaction of CGAS with LC3B as demonstrated by an affinity-isolation assay (). Consistently, the deletion or mutation of LIR motif also impaired the interaction of CGAS with endogenous LC3B in response to NDZ treatment (). Together, these results suggested that the LIR motif of CGAS mediates its interaction with LC3B.
Figure 3. LIR domain of CGAS was required for CGAS-LC3 interaction. (A) Immunoblot of cell lysates and anti-Flag immunoprecipitates from HEK293 cells that had been stably transfected with Flag-LC3B and GFP-CGAS, GFP-CGASΔ355-360 or GFP-CGASF357A,V360A. (B) Results of in vitro precipitation assay with anti-His antibody and protein agarose of His-tagged LC3B and SUMO-tagged CGAS or SUMO-tagged CGASF357A,V360A. (C) Immunoblot of cell lysates and anti-LC3B immunoprecipitates from U2OS cells that had been stably transfected with GFP, GFP-CGAS, GFP-CGASΔ355-360 or GFP-CGASF357A,V360A in the absence or presence of NDZ (300 nM) treatment for 24 h followed by 48-h recovery. Data are representative of n = 3 independent experiments
CGAS regulated the autophagy of micronuclei
Given that CGAS interacts with LC3B, a key autophagy regulator, we next examined whether CGAS regulates the selective autophagy of micronuclei. Confocal microscopy assay showed a colocalization of LC3B with micronuclei (), which is consistent with previous findings of LC3B-positive micronuclei [Citation22]. Furthermore, we observed a colocalization of CGAS with LC3B at micronuclei by confocal microscopy assay (). Importantly, immunogold electron microscopy assay demonstrated a localization of CGAS in the micronuclei embedded in autophagosome (). Moreover, proximity ligation assay demonstrated that NDZ treatment resulted in colocalization of CGAS with LC3B at the micronuclei, while CQ treatment markedly enhanced this process (). In addition, overexpression of CGAS markedly increased LC3B-positive micronuclei in HEK293 cells left untreated or treated with NDZ (Figure S4A and S4B). Consistently, knockout of CGAS dramatically reduced LC3B-positive micronuclei in U2OS cells left untreated or treated with NDZ (), indicating that CGAS played an essential role in regulating the autophagy of micronuclei.
Figure 4. CGAS regulated the autophagy of micronuclei. (A) Immunofluorescence assay showing the colocalization of CGAS with LC3B at micronuclei in U2OS cells treated with NDZ (300 nM) for 24 h followed by 48-h recovery, and cells were left treated with CQ (40 μM) for 12 h prior to harvesting. DAPI, nuclei. (B) Immunogold electron microscopy showing the colocalization of CGAS with MN in autophagosome. The red arrow indicated CGAS. (C and D) PLA assay showing the colocalization of CGAS with LC3B at micronuclei in U2OS cells treated with NDZ (300 nM) for 24 h followed by 48-h recovery, and cells were cultured in the absence or presence of CQ (40 μM) for 12 h prior to harvesting (C). The quantification data was shown in (D). (E and F) Immunofluorescent assay showing LC3B and micronuclei of WT and CGAS−/- U2OS cells left untreated or treated with NDZ (300 nM) for 24 h followed by 48-h recovery (E). The quantification data was shown in (F). (G) Immunoblot of cell lysates and lysosomes purified from U2OS cells left untreated or treated with NDZ (300 nM) for 24 h followed by 48-h recovery. (H) Immunofluorescence assay showing the colocalization of CGAS with LC3B and LAMP2 at micronuclei in U2OS cells that had been stably transfected with GFP-CGAS left untreated or treated with NDZ (300 nM) for 24 h followed by 48-h recovery. DAPI, nuclei. (I and J) Immunofluorescent assay showing the staining of LC3B, LAMP2 and micronuclei of WT and CGAS−/- U2OS cells left untreated or treated with NDZ (300 nM) for 24 h followed by 48-h recovery (I). The quantification data is shown in (J). Data are expressed as mean ± (SEM) of 3 independent experiments (D, F, J). Data are representative of n = 3 independent experiments (A-C, E, G-I). Nuclei were stained with DAPI (blue). One-way ANOVA with Bonferroni post hoc test were used for statistical analysis. Scale bar: 2.5 μm (A and H), 10 μm (C and I), 200 nm (B)
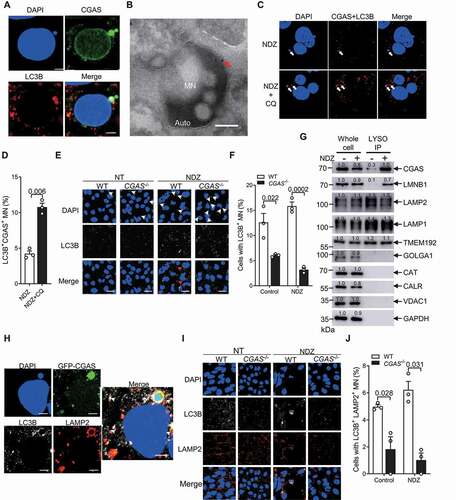
Autophagic cargoes are delivered to the lysosomes for breakdown and eventual recycling [Citation52], we therefore next examined whether CGAS accumulates in the lysosome. By using a method for the rapid isolation of mammalian lysosomes described previously [Citation56,Citation57], we generated GFP-TMEM192 stable U2OS cells to purify lysosomes. We successfully purified lysosomes as detected by lysosome markers LAMP1 and LAMP2, which are not contaminated by other cellular organelles including Golgi, peroxisome, endoplasmic reticulum and mitochondria as monitored by corresponding markers GOLGA1/Golgin-97, CAT (catalase), CALR (calreticulin) and VDAC1 (voltage dependent anion channel 1), respectively (). An enrichment of CGAS and LMNB1 (lamin B1) in lysosomes was observed in cells treated with NDZ which induces micronuclei (), suggesting that CGAS may target the micronuclei to lysosome. Considering that the proteins delivered to lysosomes may be degraded immediately by the hydrolases, we further performed the lysosome immunoprecipitation assay with lysosome hydrolases inhibitor E64D+pepstatin A [Citation58]. We found that the presence of E64D+pepstatin A increased the abundance of CGAS and LMNB1 which are supposed to be subjected to lysosomal degradation by hydrolases (Figure S5A). However, NDZ treatment consistently induced the accumulation of CGAS and LMNB1 in the lysosomes in the presence of E64D+pepstatin A (Figure S5A). Moreover, CGAS was found to colocalize with LAMP2 at LC3B-positive micronuclei (). Of note, overexpression of CGAS markedly increased the LC3B and LAMP2-positive micronuclei in HEK293 cells (Figure S5B and S5C), while knockout of CGAS dramatically reduced the colocalization of LAMP2 with LC3B positive micronuclei (). Together, these results suggested that CGAS may facilitate the delivery of autophagic micronuclei to lysosome.
CGAS promoted the clearance of micronuclei through autophagy
We next investigated whether CGAS regulates the abundance of micronuclei through autophagy. Initiation of selective autophagy depends on ATGs to drive the biogenesis of the autophagosomal membrane [Citation54]. To interrogate whether the classical autophagy pathway is involved in CGAS-mediated regulation of micronuclei homeostasis, we depleted ATG14 which are important for classical autophagy initiation [Citation59,Citation60] in U2OS cells by CRISPR-Cas9-mediated genome editing (Figure S5D) and analyzed its effect on CGAS-mediated micronucleophagy. Of note, the deletion of ATG14 markedly enhanced micronucleophagy in WT U2OS cells but not CGAS KO cells (Figure S5E and S5F), indicating that CGAS-mediated micronucleophagy is occurring via classical autophagy and distinctive from STING1-mediated autophagy via an ULK1 (unc-51 like autophagy activating kinase 1), ULK2 (unc-51 like autophagy activating kinase 2) and BECN1 (beclin 1)-independent pathway [Citation61]. However, genotoxic compounds including NDZ, camptothecin, cisplatin, paclitaxel and doxorubicin did not significantly induce the conversion of LC3-I to LC3-II even in the presence of CQ treatment (Figure S6A), though autophagy was induced by either starvation or rapamycin [Citation62] (Figure S6B). These data indicated that genotoxic stress did not significantly induce autophagy in U2OS cells, however, the basal level of autophagy may be sufficient for the initiation of micronucleophagy. Of note, the protein level of CGAS was markedly reduced in response to genotoxic stresses (Figure S6A), which was partly reversed by CQ treatment (Figure S6A), indicating a selective autophagic rather than macroautophagic pathway involving in the process of CGAS degradation. To further interrogate the effect of CGAS on autophagy and autophagy flux, the level of LC3B (both LC3B-I and LC3B-II) have been measured in WT or CGAS−/- U2OS cell treated with rapamycin in the absence or presence of CQ. Of note, the deficiency of CGAS did not significantly affect the ratio of LC3-II:LC3-I in the absence or presence of CQ (Figure S6C), indicating that CGAS did not affect autophagy or autophagy flux in U2OS cells, though CGAS has been previously reported to interact with BECN1 and activate class III phosphatidylinositol 3-kinase activity to induce autophagy [Citation63].
We then checked whether LC3 conjugation is involved in CGAS-mediated clearance of micronuclei. We therefore knocked out ATG7, an E1 enzyme critical for LC3 conjugation, in both CGAS+/+ and CGAS−/- U2OS cells by using CRISPR-Cas9 genome editing (). Of note, NDZ-treatment led to a reduction of CGAS protein level only when ATG7 is present (), indicating that CGAS undergo degradation in ATG7-dependent manner. Interestingly, deletion of ATG7 markedly enhanced the frequency of micronuclei positive cells ( S7A and S7B), and counteracted the inhibitory effect of CGAS on the number of micronuclei by either overexpression or knockout of CGAS (, S7A and S7B). Consistently, blockade of lysosome by CQ significantly enhanced the frequency of micronuclei in GFP-CGAS but not GFP-overexpressed cells left unstimulated or stimulated with NDZ (). Importantly, the inhibitory effect of CGAS on the abundance of micronuclei was not observed in CQ-treated cells (), indicating that CGAS may target autophagic micronuclei to lysosome for clearance.
Figure 5. CGAS promoted the clearance of micronuclei through autophagy. (A) Immunoblot of the lysates of U2OS cells stably transfected with control gRNA or gRNA targeting CGAS or ATG7 left untreated or treated with NDZ (300 nM) for 24 h followed by 48-h recovery. (B and C) Immunofluorescence assay showing the micronuclei in CGAS+/+ATG7+/+, CGAS−/-ATG7+/+, CGAS+/+ATG7−/- and CGAS−/-ATG7−/- U2OS cells in the absence or presence of NDZ (300 nM) treatment for 24 h followed by 48-h recovery (B). The quantification was shown in (C). (D and E) Immunofluorescence assay showing the micronuclei in U2OS cells that had been transfected with GFP or GFP-CGAS in the absence or presence of NDZ (300 nM) treatment for 24 h followed by 48-h recovery, and cells were left untreated or treated with CQ (40 μM) 8 h prior to harvesting (D). The quantification was shown in (E). Data are expressed as mean ± (SEM) of n = 3 independent experiments (C, E). Data are representative of n = 3 independent experiments (A, B, D). Nuclei were stained with DAPI (blue). Two-way ANOVA with Bonferroni post hoc test were used for statistical analysis. Scale bar: 10 μm
CGAS mediated the clearance of micronuclei as an autophagy receptor
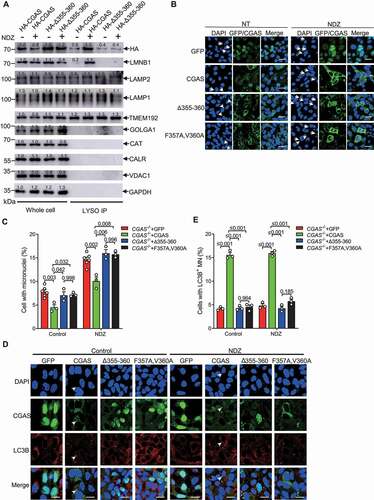
To further interrogate whether CGAS function as an micronucleophagy receptor, we further checked the requirement of LIR for CGAS-mediated micronuclei homeostasis. Interestingly, NDZ treatment induced a moderate reduction of the expression level of WT CGAS rather than CGAS mutant lacking LIR, indicating that the autophagic degradation of CGAS in response to NDZ treatment is LIR dependent. Interestingly, CGAS mutant lacking LIR failed to accumulate in lysosome in response to NDZ treatment (), indicating an essential role of LC3B-interaction in regulating CGAS recruitment to lysosome and autophagic degradation. Consistently, overexpression of CGAS LIR mutants including CGASΔ355-360 or CGASF357A,V360A failed to reduce the abundance of micronuclei in both unstimulated and NDZ-treated HEK293 cells (Figure S7C and S7D). Moreover, reconstitution of CGAS−/- U2OS cells with GFP-CGAS LIR mutants including CGASΔ355-360 or CGASF357A,V360A did not restore the inhibitory effect of CGAS on the abundance of micronuclei (), indicating that LIR-mediated interaction of CGAS with LC3B was critical for CGAS-mediated clearance of micronuclei. Further, reconstitution of CGAS−/- U2OS cells with GFP-CGAS markedly enhanced the frequency of cells with LC3B-decorated micronuclei (). However, reconstitution with GFP-CGAS LIR mutants including CGASΔ355-360 or CGASF357A,V360A did not show any effect on the abundance of LC3B positive micronuclei (), indicating that CGAS may function as an autophagy receptor for mediating micronucleophagy. Together, these results suggested that CGAS may promote the turnover of micronuclei through its LIR-mediated selective autophagy.
Figure 6. CGAS mediated the clearance of micronuclei as an autophagy receptor. (A) Immunoblot of cell lysates and lysosomes purified from U2OS cells that had been stably transfected with HA-CGAS or HA-CGASΔ355-360 in the absence or presence of NDZ (300 nM) treatment. (B-C), Immunofluorescence assay showing the micronuclei in CGAS−/- U2OS cells that had been transfected with GFP, GFP-CGAS, GFP- CGASΔ355-360 or GFP-CGASF357A,V360A in the absence or presence of NDZ (300 nM) treatment for 24 h followed by 48-h recovery (B). The quantification is shown in (C). (D and E) Immunofluorescence assay showing the LC3B positive micronuclei in CGAS−/- U2OS cells that had been stably transfected with GFP, GFP-CGAS, GFP- CGASΔ355-360 or GFP-CGASF357A,V360A left untreated or treated with NDZ (300 nM) for 24 h followed by 48-h recovery (D). The quantification is shown in (E). Data are expressed as mean ± (SEM) of n = 3 independent experiments (C, E). Data are representative of n = 3 independent experiments (A, B, D). Nuclei were stained with DAPI (blue). Two-way ANOVA with Bonferroni post hoc test were used for statistical analysis. Scale bar: 10 μm
CGAS-mediated micronucleophagy dampened micronuclei-driven innate immunity
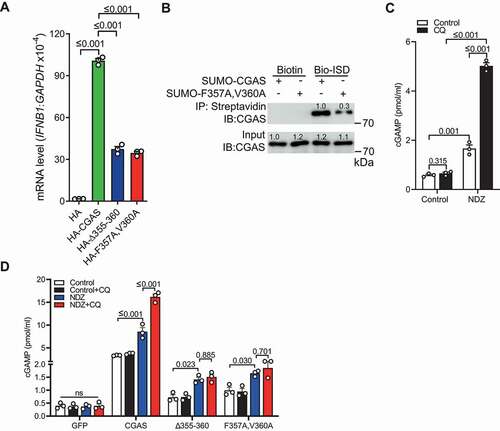
Because CGAS is required for autophagic clearance of micronuclei and micronuclei is demonstrated to trigger the expression of ISGs [Citation12,Citation13], we next investigated whether CGAS-mediated micronucleophagy is important for the regulation of micronuclei-mediated innate immunity. We firstly checked whether CGAS LIR mutation is functional in sensing cytosolic DNA. Overexpression of CGAS in HA-STING1 stably transfected HEK293T cell led to induction of IFNB1 transcripts, while CGASΔ355-360 or CGASF357A,V360A showed reduced capability to trigger type I IFN response (). Consistently, co-immunoprecipitation assay with purified CGAS and CGASF357A,V360A protein demonstrated that the mutation of LIR to F357A and V360A markedly reduced its DNA binding ability (), indicating that cGASF357A,V360A may affect DNA-induced type I IFN response by interfering with DNA binding. It has been reported that the CGAS-STING1 pathway cannot be activated in U2OS cells because STING1 is not expressed [Citation64–66]. We therefore measured the abundance of cGAMP generated by CGAS rather than the induction of type I IFN response in U2OS cells stimulated with NDZ. The data demonstrated that NDZ stimulation enhanced the abundance of cGAMP, while the inhibition of lysosome by CQ resulted in enhanced generation of cGAMP (), concurrent with increased frequency of micronuclei (). These data indicated that autophagy may be important for the regulation of innate immune response mediated by NDZ-induced micronuclei. Intriguingly, reconstitution of CGAS−/- U2OS cells with GFP-CGAS markedly enhanced the abundance of cGAMP, which was further enhanced by CQ-mediated inhibition of lysosomes (). However, the enhanced production of cGAMP by CQ treatment was not observed in CGAS−/- U2OS cells reconstituted with CGAS LIR mutants including CGASΔ355-360 or CGASF357A,V360A (), which lacks the ability to promote micronucleophagy but is still partly maintains the capability to trigger DNA-induced type I IFN response. Therefore, LIR-mediated micronucleophagy may be important for the regulation of micronuclei-driven CGAS activation and subsequent cGAMP generation. Collectively, these results suggested that CGAS played an additional important role in the downregulation of micronuclei-mediated type I IFN responses through autophagic control of micronuclei homeostasis.
Figure 7. CGAS-mediated micronucleophagy impaired micronuclei-driven innate immunity. (A) qRT-PCR assay showing the induction of IFNB1 transcripts in HA-STING1 stable HEK293T cells transfected with indicated plasmids. (B) Results of in vitro precipitation assay showing the interaction of biotin-labeled ISD with SUMO-tagged CGAS or SUMO-tagged CGAS F357A,V360A. (C) Quantification of the abundance of cGAMP in U2OS cells left untreated or treated with NDZ (300 nM) for 24 h followed by 48-h recovery, and cells were cultured in the absence or presence of CQ (40 μM) for 12 h prior to harvesting. (D) Quantification of the abundance of cGAMP level in CGAS−/- U2OS cells that had been stably transfected with GFP, GFP-CGAS, GFP-CGASΔ355-360 or GFP-CGASF357A,V360A, respectively, left untreated or treated with NDZ (300 nM) for 24 h followed by 48-h recovery, and cells were cultured in the absence or presence of CQ (40 μM) for 12 h prior to harvesting. Data are expressed as mean ± (SEM) of n = 3 independent experiments (A, C, D). Data in (B) is representative of n = 3 independent experiments. Two-way ANOVA with Bonferroni post hoc test were used for statistical analysis
Discussion
CGAS has been emerging as an important regulator in inflammatory diseases and cancer [Citation12,Citation13,Citation15,Citation38,Citation41,Citation67–69]. Though CGAS has been demonstrated to be critical for DNA-induced autophagy [Citation61,Citation63,Citation70] and xenophagic elimination of invading pathogen [Citation71], our identification of CGAS as an autophagy receptor of micronuclei adds to the growing list of selective autophagy receptors, including for ribosome [Citation56], mitochondria [Citation72,Citation73], peroxisomes [Citation74], endoplasmic reticulum [Citation75], ferritin [Citation76] as well as invading pathogens [Citation77,Citation78]. Previous work has demonstrated the presence of micronuclei in the autophagosomes in U2OS cells by electron microscopy [Citation22,Citation23], here we revealed a critical role of CGAS in the regulating the lysosomal delivery of micronuclei for degradation.
Though micronuclei have long been considered as passive indicators of chromosome instability, they were recently demonstrated to act as a key platform for chromothripsis [Citation10,Citation11] and a trigger of innate immune response [Citation12,Citation13]. DNA in micronuclei is likely to get damaged [Citation23]. When shattered chromatin from micronuclei gets reincorporated into the primary nucleus, aberrant rearrangements can take place, a phenomenon referred to as chromothripsis [Citation10,Citation11]. Chromothripsis is a catastrophic mutational process that is commonly observed in cancer [Citation79]. Moreover, rupture of micronuclear envelope exposes genomic DNA into the cytosol and results in the activation of the CGAS-STING1 cytosolic DNA-sensing pathway, which has been shown to be involved in cancer development and autoimmune diseases [Citation12,Citation13,Citation15]. Therefore, our findings of an unprecedented role of CGAS in the autophagic regulation of micronuclei homeostasis may add a novel layer of complexity for CGAS in the pathogenesis of multiple diseases.
The recruitment of CGAS to micronuclei has been well reported [Citation12,Citation13,Citation23,Citation39–42]. Breakdown of the micronuclear envelope [Citation12] and damaged micronuclear DNA [Citation23] have been implicated to be the cues for the accumulation of CGAS in micronuclei. However, the exact mechanism for CGAS recruitment to micronuclei remains elusive. Though CGAS has been found to directly interact with γH2AX (phosphorylated Histone H2AX), a hallmark of DNA damage response [Citation38], our data indicated that CGAS downregulates the abundance of γH2AX-positive and -negative micronuclei comparably. Therefore, the level of DNA damage in micronuclei may not be responsible for tiggerring CGAS recruitment to micronuclei. Of note, CGAS has been shown to be regulated by multiple post-translational modifications (PTMs) including phosphorylation, glutamylation, sumoylation and acetylation [Citation38,Citation80–83]. In addition, very recent work demonstrated that chromatin architecture protein HMGB2 (high mobility group box 2) is essential for CGAS recruitment to cytoplasmic chromatin and subsequent CGAS activation [Citation84]. Therefore, whether and how PTMs and HMGB2 are involved in the recruitment of CGAS to micronuclei warrants further investigation.
Macroautophagy/autophagy is a homeostatic process with multiple effects on immunity. One of the pivotal contributions of autophagy in immunity is the cell autonomous control of inflammation to avoid prolonged immune activation and potential host damage [Citation85,Citation86]. CGAS has been previously reported to interact with BECN1 and activate class III phosphatidylinositol 3-kinase activity to induce autophagy, which thereby remove cytosolic pathogen DNA to prevent excessive CGAS activation and persistent immune stimulation [Citation63]. A very recent work reported a primordial function of the CGAS-STING1 pathway in induction of autophagy that is dependent on WIPI2 (WD repeat domain, phosphoinositide interacting 2) and ATG5 but independent of the ULK and PIK3C3/VPS34-BECN1 kinase complexes, which is important for the clearance of DNA and viruses in the cytosol [Citation61]. Our work demonstrated that CGAS promotes the clearance of micronuclei through autophagy in ATG14- and ATG7-dependent manner, indicating CGAS-mediated micronucleophagy is occurring via classical autophagy and distinctive from STING1-mediated autophagy via an ULK1 and BECN1-independent pathway. The chromatin in micronuclei delivered by CGAS to the lysosomes may be subjected to be degradation by DNase such as TREX1 (three-prime repair exonuclease-1) and SAMHD1 (SAM and HD domain containing deoxynucleoside triphosphate triphosphohydrolase 1) [Citation87,Citation88]. Of note, our data demonstrated that deletion of ATG7 led to elevated abundance of micronuclei under both spontaneous and genotoxic stress-induced conditions, which is not observed in CGAS KO cell reconstituted with CGAS LIR mutants. Therefore, CGAS-mediated micronucleophagy may serve as an important checkpoint in innate immunity by limiting the accumulation of micronuclei-derived DNA in the cytosol. Importantly, the LIR motif but not the enzymatic activity or DNA binding ability of CGAS is critical for its autophagic clearance of micronuclei, indicating that the mechanism underlying CGAS-mediated micronucleophagy is distinctive from that underlying CGAS-induced autophagy in response to cytosolic DNA [Citation61,Citation63,Citation71,Citation89].
CGAS was originally identified as a cytoplasmic DNA sensor that can bind with DNA to induce type I IFN response. In this study we found that CGAS regulated the abundance of micronuclei by autophagy independent of its induction of type I IFN response, which is supported by previous finding that CGAS mediates autophagy in STING1-independent manner [Citation89]. In addition, it also been reported that CGAS is an inhibitor of DNA repair [Citation38,Citation90], which may fuel genome instability for the generation of micronuclei in response to irradiation [Citation90]. However, our current data revealed that CGAS also reduced the abundance of micronuclei in U2OS cells left untreated or treated with NDZ, which is supported by pervious reports that CGAS-mediated reduction of micronuclei abundance in HeLa and U2OS cells in response to NDZ stimulation [Citation66] and lung fibroblasts IMR90 expressing vectors encoding HPV-16 E6E7 which drives telomere DNA damage [Citation48]. Jiang et al have reported that CGAS promotes irradiation-induced micronuclei generation in HEK293 cells and bone marrow-derived monocytes [Citation90], which may result from the inhibitory effect of CGAS on DNA repair [Citation36,Citation38,Citation90]. One possible explanation for the opposite effect of CGAS on micronuclei abundance is probably due to the different stimuli or cell types. Therefore, our data revealed that CGAS reduces the abundance of micronuclei through functioning as a receptor for autophagic clearance of micronuclei but not due to the other reported function of CGAS.
Our findings of CGAS as an autophagy receptor for micronuclei basing on the criteria defined thus far highlights versatile functions of CGAS, suggesting that different regions of CGAS proteins may be utilized for distinct functions. It has been reported that CGAS inhibitors are screened according to the crystal structure of CGAS [Citation91]. The solution of the structure of CGAS-LC3B complex will facilitate the development of inhibitors or tethering compounds [Citation92] targeting the interacting interfaces for precise intervention of CGAS-mediated micronucleophagy.
Materials and methods
Reagents and plasmids
Nocodazole (HY-13520), paclitaxel (HY-B0015), cisplatin (HY-17394), chloroquine (HY-17589A), doxorubicin (HY-15142) and camptothecin (HY-16560) were all purchased from MedChem Express. The following antibodies were used: anti-CGAS (15102), anti-LC3B (3868), anti-H2AX (7631), anti-LAMP1 (9091), anti-CAT/catalase (12980), anti-VDAC (4661), anti-CALR/calreticulin (12239), anti-phospho-H2AX (9718), anti-GFP (2956), anti–ATG7 (8558), horseradish peroxidase (HRP)-conjugated goat anti-rabbit (7074) or anti-mouse (7076) IgG (all from Cell Signaling Technology); anti-hemagglutinin (HA; H6908), anti-FLAG (F3165) and anti-GAPDH (G9545) (all from Sigma-Aldrich); anti-LC3B (PM036) and anti-LC3B (M152-3) were obtained from Medical & Biological Laboratories; anti-LAMP2 (sc-18822) was purchased from Santa Cruz Biotechnology. GFP-Trap Agarose (gtd-20) was purchased from ChromoTek GmbH. The plasmid containing the DNA encoding human CGAS (F122086), CGAS mutation (site-directed mutation from F122086), LC3B (F102982) and TEME-192 (F100950) were obtained from Changsha Youbio Tech and cDNAs were then subcloned into the pCDH vector (Changsha Youbio Tech, VT1480). YFP-Atg8-family proteins encoding plasmids were a kind gift from Dr. Felix Randow (MRC Laboratory of Molecular Biology, UK). cgas knockout mice (026554) were obtained from Jackson Laboratory.
Cell culture
Human embryonic kidney epithelial cells (HEK293; ATCC, CRL-1573; HEK293T, ATCC, CRL-11268) and Human bone osteosarcoma epithelial cells (U2OS; ATCC, HTB-96) were cultured in Dulbecco’s Modified Eagle’s Medium (DMEM; Gibco, 11965092) supplemented with 10% (v:v) heat-inactivated fetal bovine serum (FBS; Gibco, 10100147), 1% (v:v) penicillin–streptomycin (Gibco, 15140148), 1 mM sodium pyruvate (Gibco, 11360070), 2 mM L-glutamine, 10 mM HEPES buffer (pH 7.2, Gibco, 15630106), 50 µM 2-mercaptoethanol (Gibco, 21985023). Cells were maintained at 37°C in 5% CO2. All cells included in this research were free of mycoplasma confirmed by the LookOut Mycoplasma PCR Detection Kit (Sigma-Aldrich, MP0035).
Generation of CGAS, ATG14 and ATG7 knockout cells via the CRISPR-CAS9 system
LentiCRISPRv2 vectors were utilized to generate knockout (KO) cells [Citation93]. HEK293T cells were transfected by mixture of Lipofectamine 2000 (Invitrogen, 11668030) with pMD2.G, pSPAX2 and LentiCRISPRv2 (Changsha Youbio Tech, VT8107) harboring the guide (g)RNA that targeted human ATG7 (GGGTTATTACTACAATGGT), ATG14 (CAGAGGCATAATCGCAAACT) or CGAS (CACGCAGTTATCAAAGCAG) or scrambled gRNA. The lentiviruses were harvested 48 hours after transfection and were utilized to infect U2OS or HEK293 cells. Subsequently, the infected cells were selected with puromycin (for CGAS KO, 1 μg/mL; Selleck, S7417) or hygromycin (for ATG7 and ATG14 KO, 500 μg/mL; Selleck, S2908), and clones developed from single CGAS, ATG14 or ATG7 KO cells were acquired through serial dilutions in a 96-well plate. The KO cells were confirmed by western blot. For the generation of CGAS and ATG7 or ATG14 double-knockout cells, the CGAS−/- cells were infected with lentiviruses packaging gRNA targeting ATG7 or ATG14 and selected with hygromycin (500 μg/mL). The double-KO cells were identified by western blot.
Generation of GFP, GFP-CGAS, GFP-CGASΔ355-360, GFP-CGASF357A,V360A reconstituted cells in CGAS−/- U2OS and HEK293 cells as well as GFP-TMEM192 U2OS cells
The CGAS−/- U2OS and HEK293 cells were transfected with pCDH-GFP, pCDH-GFP-CGAS, pCDH-GFP-CGASΔ355-360 or pCDH-GFP-TMEM192 by Lipofectamine 2000. The transfected cells were cultured for 4 days and the GFP-positive cells were sorted using FACS Aria cell sorting system. The cells were cultured for another 4 days and sorted again to get GFP, GFP-CGAS, GFP-CGASΔ355-360, GFP-cGASF357A,V360A or GFP-TMEM192 stable expression cells. HEK293T that stably expressing HA-STING1 were generated as previously described [Citation94].
Generation of HA, HA-CGASE225A,D227A, HA-CGASΔ171-174 and HA-CGAS reconstituted cells in CGAS−/- U2OS
The CGAS−/- U2OS cells were transfected with pcDNA3.1-HA, pcDNA3.1-HA- CGASE225A,D227A, HA-CGASΔ171-174 or HA-CGAS by lipofectamine 2000. The transfected cells were then selected with G418 (500 μg/ml, Selleck, S3028) to obtain the stable cell lines.
Immunofluorescence assay
Cells seeded on coverslips in 24-well plates were treated with nocodazole (300 nM), paclitaxel (500 nM), cisplatin (1 μM), doxorubicin (1 μM) and camptothecin (1 μM) for 24 h. The stimulated cells were further cultured for 48 h post the withdraw of the stimulators and were then fixed with 4% paraformaldehyde (PFA) in PBS (Gibco, 20012027) for 20 min at room temperature (RT). The blocking buffer, containing 2% bovine serum albumin (BSA; Sigma-Aldrich, B2064) and 0.2% Triton X-100 (Sigma-Aldrich, T8787) in PBS, was applied to block and permeabilize the cells. Cells were then incubated with indicated primary antibody in 4°C for overnight and secondary antibody for 1 h at room temperature. The following primary antibodies were utilized: anti-CGAS rabbit monoclonal antibody (D1D3G; Cell Signaling Technology, 15102), anti-LC3B rabbit polyclonal antibody (MAP1LC3B:1–120aa.; MBL Life Science, PM036), anti-LAMP2 mouse monoclonal antibody (H4B4, Santa Cruz Biotechnology, sc-18822). Corresponding Cy3 anti-mouse (Thermo Fisher Scientific, A10521) or Alexa Fluor 647 anti-rabbit (Thermo Fisher Scientific, A21244) antibodies were used as secondary antibody. Images were collected using a Leica TCS SP8 confocal laser microscopy system (Leica Microsystems, Buffalo Grove, IL).
For quantification of cell with micronuclei, at least 400 cells from more than ten different microscopic fields were counted in each independent experiment and at least 3 independent experiments were performed. The criteria for scoring micronuclei was as previously reported [Citation95]. Briefly, diameter of MN candidate should be more than 1/16 but less than 1/3 of the mean diameter of the main nuclei; the shape should be oval or round; the MN candidate should be separated from the main nucleus or close to main nucleus but have no overlap; the staining intensity of MN candidates should be similar with the main nuclei; apoptotic or necrotic cells were excluded.
Purification of recombinant His-tagged LC3B, GST-tagged Atg8-family proteins, SUMO-tagged CGAS and CGASF375,V360A
His-tagged human LC3B, GST-tagged Atg8-family proteins, SUMO-tagged human CGAS and CGASF375A,V360A cDNA was subcloned into a pET28a (for LC3B, CGAS and CGASF357A,V360A) or pGEX-4 T-1(for Atg8-family proteins) vector and BL21 (DE3) competent E. coli bacteria were then transfected with these constructs. Bacteria were grown in Luria-Bertani (LB) liquid medium to an optical density (OD) at 600 nm (OD600) of approximately 0.8. Subsequently, cells were induced with isopropyl β-D-1-thiogalactopyranoside (IPTG, 0.1 mM; Sigma-Aldrich, I6758) overnight at 16°C. Recombinant His-tagged human LC3B, SUMO-tagged human CGAS and CGASF375A,V360A were purified from bacterial lysates using a (Ni)-chelating Sepharose Fast Flow (SFF) column (GE Healthcare, 17524801). The recombinant GST-tagged human Atg8-family proteins were purified from bacterial lysates using a GSTrap FF column (GE Healthcare, 71502755). The concentration of purified protein was measured with a Pierce BCA Protein Assay Kit (Thermo Fisher Scientific, 23227).
Surface plasmon resonance (SPR)
The interaction of CGAS with LC3B was detected by OpenSPRTM (Nicoya Lifesciences, Waterloo, Canada). Briefly, CGAS protein was connected to the COOH sensor chip by capture-coupling, then LC3B protein at indicated concentrations were transfused sequentially into the chamber in PBS at 25°C. The flow rate is 20 μl/min and the binding and disassociation time were both 240 s. The buffer with 0.02% SDS was used for regenerating the chip. The wavelength shifts corresponding to the varied protein concentration was fitted according to a one-to-one diffusion-corrected model. The kinetic constants, including the affinity (KD, KD = kd/ka), dissociation constant (kd) and the association constant (ka), were analyzed with TraceDrawer software (Ridgeview Instruments ab, Sweden).
Immunoprecipitation and western blot
Cells were lysed using RIPA Lysis Buffer (Beyotime, P0013) supplemented with protease cocktail (Sigma-Aldrich, P8340), 1 mM of PMSF and phosphatase inhibitor cocktail (Sigma-Aldrich, P5726). The lysates were centrifuged at 17000x g for 15 min and the cellular debris was discarded. For immunoprecipitation, cell lysates were incubated with GFP-Trap coupled agarose (Chromotek, gat-20,), monoclonal anti-HA agarose (Sigma-Aldrich, A2095) or Anti-FLAG M2 Affinity Gel (Sigma-Aldrich, A2220) at 4°C overnight. For immunoblotting, the protein sample lysate or precipitates were denatured in 1× sodium dodecyl sulfate (SDS) protein sample buffer and then was separated using 10% or 12% SDS-polyacrylamide gel. The proteins were transferred onto nitrocellulose membrane and incubated with the antibodies. The gray value was analyzed by Adobe Photoshop CS7.
For the in vitro affinity-isolation assay, 1 μg SUMO-CGAS or SUMO-CGASF357A,V360A was mixed with 1 μg LC3B or GST-tagged Atg8-family proteins in 200 μl PBS. The anti-SUMO antibody and protein A/G agarose beads were added into the mixture and the mixture was incubated at 4°C overnight. The beads were washed with wash buffer (PBS plus 0.1% Triton X-100) for 5 times and analyzed by western blot.
Lysosome immunopurification (LysoIP)
LysoIP was performed similarly with previously reported [Citation57]. Briefly, cells were left untreated or treated with NDZ (300 nM) for 24 h followed by 48-h recovery, and were cultured in the absence or presence of E64D plus pepstatin A (10 μM) for 12 h prior to harvesting. About 35 million cells were washed twice with pre-chilled PBS and then collected in 1 mL of PBS supplemented with protease cocktail (Sigma-Aldrich, P8340), 1 mM of PMSF and phosphatase inhibitor cocktail (Sigma-Aldrich, P5726). Cells was centrifuged at 1000 × g for 2 min at 4°C and resuspended in 950 µL of the same buffer, and 25 µL (up to 2.5% of the total cell number) was reserved for extracting the whole-cell protein. The remaining cells were softly homogenized using 2 ml dounce-type homogenizer. The cell debris and cells were cleared by centrifuging at 1000 × g for 2 min at 4°C and the supernatant was collected. The supernatant containing lysosomes was incubated with 150 µL of prewashed GFP-Trap coupled agarose on a rotator shaker for 3 min at 4°C. The immunoprecipitates were then obtained by centrifuging at 1000 × g for 2 min at 4°C and then gently washed 3 times with pro-chilled PBS. The lysosomes bound with beads were lysed in 100 µL pre-chilled 1% Triton X-100 lysis buffer for 10 min on ice. The protein in the lysis buffer was detected by western blot.
Proximity ligation assay (PLA)
PLA assays were performed following the manufacturer’s protocol. Briefly, U2OS cells were stimulated with or without NDZ (300 nM) for 24 h and cultured for other 48 h with complete medium. Cells were fixed with 4% PFA for 20 min and permeabilized with 0.2% Triton X-100 in PBS for 15 min. The cells were blocked with blocking solution in the kit for 60 min at 37°C and then incubated with anti-CGAS (1:100) and anti-LC3B (1:100) primary antibodies overnight at 4°C. Cells were washed with the wash buffer for 2 times (5 min/time) and incubated with PLUS and MINUS PLA probes (1:5) for 60 min at 37°C. After washed, cells were incubated with ligase (1:40) for 30 min at 37°C and then incubated with amplification buffer containing polymerase for 100 min at 37°C. After washed with wash buffer B, cells were incubated with Duolink® In Situ Mounting Medium with DAPI for 15 min. Images were collected using a Leica TCS SP8 Confocal Laser Microscopy System (Leica Microsystems, Buffalo Grove, IL).
Measurement of cGAMP abundance
Cells were treated with or without NDZ (300 nM) for 24 h and cultured for 48 h post the withdrawal of the NDZ in the absence or presence of CQ (40 μM). Cells were lysed with RIPA Lysis Buffers and the abundance of cGAMP was measured with 2′,3′-cyclic GAMP Enzyme Immunoassay Kit (Arbor Assays, K067-H1). The assay was performed according to the manufacturer’s protocol.
In vivo micronucleus assay
The in vivo micronucleus assay was performed as reported previously [Citation96]. Briefly, the WT or cgas−/- mice were stimulated with NDZ (500 mg/kg) for 24 h and the blood was collected in 1.5 mL centrifuge tube with 300 μL heparin solution. The heparin-blood mix was added to 2 mL cold methanol (−80°C), and stored at −80°C for at least 12 h. The fixed cells were collected by centrifuging at 500x g for 5 min at 4°C and washed with cold bicarbonate buffer. Cells were then incubated with FITC-CD71 and RNase solution for 60 min at 4°C. Cells were subsequently washed and incubated with PI for 5 min and subjected for flow cytometer. The reticulocytes (RETs) were indicated as CD71 positive and the percentage of micronucleus in RETs was calculate by the ratio of (CD71+ PI+ cell):(CD71+ cell).
Apoptosis assay
U2OS cells were stimulated with or without NDZ (300 nM) for 24 h and cultured for 48 h post the withdrawal of NDZ. Cells were digested and washed with pre-cooled PBS. Cells were stained with APC-Annexin V and propidium iodide (PI) in binding buffer for 15 min in the dark. The results were analyzed using flow cytometer.
Immunogold electron microscopy assay
The GFP-CGAS overexpressed HEK293 cells were stimulated with or without NDZ (300 nM) for 24 h and cultured for 48 h post the withdrawal of NDZ. Cells were treated with CQ (40 μM) before harvesting and fixed with 4% PFA and 0.1% glutaraldehyde (in PBS) at 4°C overnight. Cells were dehydrated using a series of graded ethanol and embedded in resin. Sections were incubated with anti-CGAS antibodies at 4°C overnight. After washed, sections were incubated with 12-nm colloidal gold labeled goat anti-rabbit IgG. The images were collected using Talos L120C transmission electron microscope.
Real-time quantitative reverse-transcription PCR
Total RNA was extracted with 1 ml TRIzol reagent (Invitrogen, 15596018), as described by the manufacturer. One μg of total RNA was chose to develop cDNA by means of the ReverTra Ace® qPCR RT Kit (Toyobo, FSQ-101), and real-time quantitative PCR was performed using SYBR RT-PCR kit (Toyobo, QPK-212) in an LC480 thermocycler (Roche, Indianapolis, IN). The 2−ΔCt method was adopted to analyze the relative gene expression and the gene expression was normalized to the expression of GAPDH. Real-time quantitative reverse transcription PCR (qRT-PCR) data were collected from at least 3 independent experiments, with 3 technical replicates per experiment. Primer sequences used to amplify human IFNB1 and GAPDH were as follows: human_IFNB1_F: ATGACCAACAAGTGTCTCCTCC, h_ IFNB1_R: GGAATCCAAGCAAGTTGTAGCTC; human_GAPDH_F: ACAACTTTGGTATCGTGGAAGG, human_GAPDH_R: GCCATCACGCCACAGTTTC.
Statistical analysis
Data from independent experiments were expressed as the mean ± SEM and One-way ANOVA or Two-way ANOVA was performed for statistical analysis by using GraphPad Prism 7 (GraphPad, San Diego, CA). For all analyses, statistical significance was defined as P < 0.05.
Supplemental Material
Download Zip (13.4 MB)Acknowledgments
This project was supported by grants from the National Natural Science Foundation of China (81922030, 81770006 and 81772465 to H.L., 91542111 and 31030028 to B.G.) and the Major Research Plan of National Natural Science Foundation of China (2017YFA0505900 to B.G.) as well as the Shanghai Municipal Committee of Science and Technology (19140900600 and 18DZ2293400). H. L. is sponsored by the National Science Fund for Excellent Young Scholars (81922030), Shuguang Program supported by Shanghai Education Development Foundation and Shanghai Municipal Education Commission (20SG19), the Shanghai Pujiang Program (16PJ1408600), the Shanghai Medical and Health Services Outstanding Youth Talent Program (2017YQ078). We thank Professor Felix Randow (MRC Laboratory of Molecular Biology, Cambridge, UK) for providing YFP- Atg8-family proteins plasmids.
Data availability
The authors declare that data supporting the findings of this study are available within the Figures and Supplementary Materials of the manuscript. All raw data associated with Figures and Extended Data are available upon request from the corresponding authors.
Disclosure statement
The authors declare no competing interests
Supplemental data
Supplemental data for this article can be accessed here.
Additional information
Funding
Related Research Data
References
- Levine B, Kroemer G. Autophagy in the pathogenesis of disease. Cell. 2008;132(1):27–42.
- Deretic V, Saitoh T, Akira S. Autophagy in infection, inflammation and immunity. Nat Rev Immunol. 2013;13(10):722–737.
- Singh R, Cuervo AM. Autophagy in the cellular energetic balance. Cell Metab. 2011;13(5):495–504.
- Dikic I, Elazar Z. Mechanism and medical implications of mammalian autophagy. Nat Rev Mol Cell Biol. 2018;19(6):349–364.
- Yu L, Chen Y, Tooze SA. Autophagy pathway: cellular and molecular mechanisms. Autophagy. 2018;14(2):207–215.
- Finkbeiner S. The autophagy lysosomal pathway and neurodegeneration. Cold Spring Harb Perspect Biol. 2020;12(3):a033993.
- Yang Y, Klionsky DJ. Autophagy and disease: unanswered questions. Cell Death Differ. 2020;27(3):858–871.
- Fang EF, Hou Y, Palikaras K, et al. Mitophagy inhibits amyloid-beta and tau pathology and reverses cognitive deficits in models of Alzheimer’s disease. Nat Neurosci. 2019;22(3):401-+.
- Levine B, Kroemer G. Biological functions of autophagy genes: a disease perspective. Cell. 2019;176(1–2):11–42.
- Zhang CZ, Spektor A, Cornils H, et al. Chromothripsis from DNA damage in micronuclei. Nature. 2015;522(7555):179–184.
- Liu S, Kwon M, Mannino M, et al. Nuclear envelope assembly defects link mitotic errors to chromothripsis. Nature. 2018;561(7724):551–555.
- Mackenzie KJ, Carroll P, Martin C-A, et al. cGAS surveillance of micronuclei links genome instability to innate immunity. Nature. 2017;548(7668):461–465.
- Harding SM, Benci JL, Irianto J, et al. Mitotic progression following DNA damage enables pattern recognition within micronuclei. Nature. 2017;548(7668):466–470.
- Shelby MD. The genetic toxicity of human carcinogens and its implications. Mutat Res. 1988;204(1):3–15.
- Bakhoum SF, Ngo B, Laughney AM, et al. Chromosomal instability drives metastasis through a cytosolic DNA response. Nature. 2018;553(7689):467-+.
- Yesilada E, Sahin I, Ozcan H, et al. Increased micronucleus frequencies in peripheral blood lymphocytes in women with polycystic ovary syndrome. Eur J Endocrinol. 2006;154(4):563–568.
- Al-Rawi ZS, Gorial FI, Tawfiq RF, et al. Brief report: a novel application of buccal micronucleus cytome assay in systemic lupus erythematosus: a case-control study. Arthritis Rheumatol. 2014;66(10):2837–2841.
- Petrozzi L, Lucetti C, Scarpato R, et al. Cytogenetic alterations in lymphocytes of Alzheimer’s disease and Parkinson’s disease patients. Neurol Sci. 2002;23(Suppl 2):S97–8.
- Scarpato R, Verola C, Fabiani B, et al. Nuclear damage in peripheral lymphocytes of obese and overweight Italian children as evaluated by the γ-H2AX focus assay and micronucleus test. Faseb J. 2011;25(2):685–693.
- Mullner E, Brath H, Nersesyan A, et al. Nuclear anomalies in exfoliated buccal cells in healthy and diabetic individuals and the impact of a dietary intervention. Mutagenesis. 2014;29(1):1–6.
- Ipek E, Ermiş E, Uysal H, et al. The relationship of micronucleus frequency and nuclear division index with coronary artery disease SYNTAX and Gensini scores. Anatol J Cardiol. 2017;17(6):483–489.
- Rello-Varona S, Lissa D, Shen S, et al. Autophagic removal of micronuclei. Cell Cycle. 2012;11(1):170–176.
- Bartsch K, Knittler K, Borowski C, et al. Absence of RNase H2 triggers generation of immunogenic micronuclei removed by autophagy. Hum Mol Genet. 2017;26(20):3960–3972.
- Sun L, Wu J, Du F, et al. Cyclic GMP-AMP synthase is a cytosolic DNA sensor that activates the type I interferon pathway. Science. 2013;339(6121):786–791.
- Wu J, Sun L, Chen X, et al. Cyclic GMP-AMP is an endogenous second messenger in innate immune signaling by cytosolic DNA. Science. 2013;339(6121):826–830.
- Gao D, Wu J, Wu Y-T, et al. Cyclic GMP-AMP synthase is an innate immune sensor of HIV and other retroviruses. Science. 2013;341(6148):903–906.
- Ishikawa H, Barber GN. STING is an endoplasmic reticulum adaptor that facilitates innate immune signalling. Nature. 2008;455(7213):674–678.
- Jin L, Hill KK, Filak H, et al. MPYS is required for IFN response factor 3 activation and type I IFN production in the response of cultured phagocytes to bacterial second messengers cyclic-di-AMP and cyclic-di-GMP. J Immunol. 2011;187(5):2595–2601.
- Sun W, Li Y, Chen L, et al. ERIS, an endoplasmic reticulum IFN stimulator, activates innate immune signaling through dimerization. Proc Natl Acad Sci U S A. 2009;106(21):8653–8658.
- Zhong B, Yang Y, Li S, et al. The adaptor protein MITA links virus-sensing receptors to IRF3 transcription factor activation. Immunity. 2008;29(4):538–550.
- Bowie A. The STING in the tail for cytosolic DNA-dependent activation of IRF3. Sci Signal. 2012;5(214):pe9.
- Gao D, Li T, Li X-D, et al. Activation of cyclic GMP-AMP synthase by self-DNA causes autoimmune diseases. Proc Natl Acad Sci U S A. 2015;112(42):E5699–705.
- Zierhut C, Yamaguchi N, Paredes M, et al. The cytoplasmic DNA sensor cGAS promotes mitotic cell death. Cell. 2019;178(2):302–315.e23.
- Barnett KC, Coronas-Serna JM, Zhou W, et al. Phosphoinositide interactions position cGAS at the plasma membrane to ensure efficient distinction between self- and viral DNA. Cell. 2019;176(6):1432–1446. e11.
- Gentili M, Lahaye X, Nadalin F, et al. The N-terminal domain of cGAS determines preferential association with centromeric DNA and innate immune activation in the nucleus. Cell Rep. 2019;26(13):3798.
- Jiang H, Xue X, Panda S, et al. Chromatin-bound cGAS is an inhibitor of DNA repair and hence accelerates genome destabilization and cell death. Embo J. 2019;38(21):e102718.
- Volkman HE, Cambier S, Gray EE, et al. Tight nuclear tethering of cGAS is essential for preventing autoreactivity. In: Elife. 2019;8:e47491.
- Liu H, Zhang H, Wu X, et al. Nuclear cGAS suppresses DNA repair and promotes tumorigenesis. Nature. 2018;563(7729):131–136.
- Yang H, Wang H, Ren J, et al. cGAS is essential for cellular senescence. Proc Natl Acad Sci U S A. 2017;114(23):E4612–E4620. E4612-E4620.
- Gratia M, Rodero MP, Conrad C, et al. Bloom syndrome protein restrains innate immune sensing of micronuclei by cGAS. J Exp Med. 2019;216(5):1199–1213.
- Dou Z, Ghosh K, Vizioli MG, et al. Cytoplasmic chromatin triggers inflammation in senescence and cancer. Nature. 2017;550(7676):402–406.
- Gluck S, Guey B, Gulen MF, et al. Innate immune sensing of cytosolic chromatin fragments through cGAS promotes senescence. Nat Cell Biol. 2017;19(9):1061–1070.
- Crasta K, Ganem NJ, Dagher R, et al. DNA breaks and chromosome pulverization from errors in mitosis. Nature. 2012;482(7383):53–58.
- Reinecke P, Corvin J, Gabbert HE, et al. Antiproliferative effects of paclitaxel (Taxol) on human renal clear cell carcinomas in vitro. Eur J Cancer. 1997;33(7):1122–1129.
- Utani K, Okamoto A, Shimizu N. Generation of micronuclei during interphase by coupling between cytoplasmic membrane blebbing and nuclear budding. PLoS One. 2011;6(11):e27233.
- Lewis CW, Golsteyn RM. Cancer cells that survive checkpoint adaptation contain micronuclei that harbor damaged DNA. Cell Cycle. 2016;15(22):3131–3145.
- Aparecida Resende F, De Andrade Barcala CAM, Da Silva Faria MC, et al. Antimutagenicity of ursolic acid and oleanolic acid against doxorubicin-induced clastogenesis in Balb/c mice. Life Sci. 2006;79(13):1268–1273.
- Nassour J, Radford R, Correia A, et al. Autophagic cell death restricts chromosomal instability during replicative crisis. Nature. 2019;565(7741):659-+.
- Ciccia A, Elledge SJ. The DNA damage response: making it safe to play with knives. Mol Cell. 2010;40(2):179–204.
- Quezada-Vidal J, Ortíz-Muñiz R, Cervantes-Ríos E, et al. In vivo kinetics of the genotoxic and cytotoxic activities of cladribine and clofarabine. Environ Mol Mutagen. 2020;61(9):922–927.
- Masuda-Herrera MJ, Dobo KL, Kenyon MO, et al. In vivo mutagenicity testing of arylboronic acids and esters. Environ Mol Mutagen. 2019;60(9):766–777.
- Choi AM, Ryter SW, Levine B. Autophagy in human health and disease. N Engl J Med. 2013;368(19):1845–1846.
- Kalvari I, Tsompanis S, Mulakkal NC, et al. iLIR: a web resource for prediction of Atg8-family interacting proteins. Autophagy. 2014;10(5):913–925.
- Nakatogawa H, Lane JD. Two ubiquitin-like conjugation systems that mediate membrane formation during autophagy. Essays Biochem. 2013;55:39–50.
- Leuchowius KJ, Weibrecht I, Soderberg O. In situ proximity ligation assay for microscopy and flow cytometry. Curr Protoc Cytom. 2011;56(1). Chapter 9: p. Unit 9 36. DOI:https://doi.org/10.1002/0471142956.cy0936s56
- Wyant GA, Abu-Remaileh M, Frenkel EM, et al. NUFIP1 is a ribosome receptor for starvation-induced ribophagy. Science. 2018;360(6390):751–758.
- Abu-Remaileh M, Wyant GA, Kim C, et al. Lysosomal metabolomics reveals V-ATPase- and mTOR-dependent regulation of amino acid efflux from lysosomes. Science. 2017;358(6364):807–813.
- Li M, Khambu B, Zhang H, et al. Suppression of lysosome function induces autophagy via a feedback down-regulation of MTOR complex 1 (MTORC1) activity. J Biol Chem. 2013;288(50):35769–35780.
- Stipanuk MH. Macroautophagy and its role in nutrient homeostasis. Nutr Rev. 2009;67(12):677–689.
- Noda T, Yoshimori T. Molecular basis of canonical and bactericidal autophagy. Int Immunol. 2009;21(11):1199–1204.
- Gui X, Yang H, Li T, et al. Autophagy induction via STING trafficking is a primordial function of the cGAS pathway. Nature. 2019;567(7747):262–266.
- Kuballa P, Nolte WM, Castoreno AB, et al. Autophagy and the immune system. Annu Rev Immunol. 2012;30(1):611–646.
- Liang Q, Seo G, Choi Y, et al. Crosstalk between the cGAS DNA sensor and Beclin-1 autophagy protein shapes innate antimicrobial immune responses. Cell Host Microbe. 2014;15(2):228–238.
- Chen Y-A, Shen Y-L, Hsia H-Y, et al. Extrachromosomal telomere repeat DNA is linked to ALT development via cGAS-STING DNA sensing pathway. Nat Struct Mol Biol. 2017;24(12):1124-+.
- Deschamps T, Kalamvoki M. Impaired STING pathway in human osteosarcoma U2OS cells contributes to the growth of ICP0-null mutant herpes simplex virus. J Virol. 2017;91(9):e00006-17.
- Basit A, Cho M-G, Kim E-Y, et al. The cGAS/STING/TBK1/IRF3 innate immunity pathway maintains chromosomal stability through regulation of p21 levels. Exp Mol Med. 2020;52(4):643–657.
- Ablasser A, Chen ZJ. cGAS in action: expanding roles in immunity and inflammation. Science. 2019;363(6431):eaat8657.
- Woo SR, Fuertes M, Corrales L, et al. STING-dependent cytosolic DNA sensing mediates innate immune recognition of immunogenic tumors. Immunity. 2014;41(5):830–842.
- Vanpouille-Box C, Hoffmann JA, Galluzzi L. Pharmacological modulation of nucleic acid sensors - therapeutic potential and persisting obstacles. Nat Rev Drug Discov. 2019;18(11):845–867.
- Yang J, Tang X, Nandakumar KS, et al. Autophagy induced by STING, an unnoticed and primordial function of cGAS. Cell Mol Immunol. 2019;16(8):683–684.
- Watson RO, Bell S, MacDuff D, et al. The cytosolic sensor cGAS detects mycobacterium tuberculosis dna to induce type I interferons and activate autophagy. Cell Host Microbe. 2015;17(6):811–819.
- Wei Y, Chiang W-C, Sumpter R, et al. Prohibitin 2 is an inner mitochondrial membrane mitophagy receptor. Cell. 2017;168(1–2):224–238. e10.
- Wong YC, Holzbaur EL. Optineurin is an autophagy receptor for damaged mitochondria in parkin-mediated mitophagy that is disrupted by an ALS-linked mutation. Proc Natl Acad Sci U S A. 2014;111(42):E4439–48.
- Deosaran E, Larsen KB, Hua R, et al. NBR1 acts as an autophagy receptor for peroxisomes. J Cell Sci. 2013;126(4):939–952.
- Khaminets A, Heinrich T, Mari M, et al. Regulation of endoplasmic reticulum turnover by selective autophagy. Nature. 2015;522(7556):354–358.
- Mancias JD, Wang X, Gygi SP, et al. Quantitative proteomics identifies NCOA4 as the cargo receptor mediating ferritinophagy. Nature. 2014;509(7498):105–109.
- Verlhac P, Grégoire I, Azocar O, et al. Autophagy receptor NDP52 regulates pathogen-containing autophagosome maturation. Cell Host Microbe. 2015;17(4):515–525.
- Thurston TLM, Ryzhakov G, Bloor S, et al. The TBK1 adaptor and autophagy receptor NDP52 restricts the proliferation of ubiquitin-coated bacteria. Nat Immunol. 2009;10(11):1215–1221.
- Stephens PJ, Greenman CD, Fu B, et al. Massive genomic rearrangement acquired in a single catastrophic event during cancer development. Cell. 2011;144(1):27–40.
- Dai J, Huang Y-J, He X, et al. Acetylation Blocks cGAS Activity and Inhibits Self-DNA-Induced Autoimmunity. Cell. 2019;176(6):1447–1460. e14.
- Hu -M-M, Yang Q, Xie X-Q, et al. Sumoylation promotes the stability of the DNA sensor cGAS and the adaptor STING to regulate the kinetics of response to DNA virus. Immunity. 2016;45(3):555–569.
- Seo GJ, Yang A, Tan B, et al. Akt kinase-mediated checkpoint of cGAS DNA sensing pathway. Cell Rep. 2015;13(2):440–449.
- Xia P, Ye B, Wang S, et al. Glutamylation of the DNA sensor cGAS regulates its binding and synthase activity in antiviral immunity. Nat Immunol. 2016;17(4):369–378.
- Zhao B, Liu P, Fukumoto T, et al. Topoisomerase 1 cleavage complex enables pattern recognition and inflammation during senescence. Nat Commun. 2020;11(1):908.
- Deretic V, Levine B. Autophagy balances inflammation in innate immunity. Autophagy. 2018;14(2):243–251.
- Martin PK, Marchiando A, Xu R, et al. Autophagy proteins suppress protective type I interferon signalling in response to the murine gut microbiota. Nat Microbiol. 2018;3(10):1131–1141.
- Fiehn C. Familial chilblain lupus - what can we learn from type I interferonopathies? Curr Rheumatol Rep. 2017;19(10):61.
- Coquel F, Neumayer C, Lin Y-L, et al. SAMHD1 and the innate immune response to cytosolic DNA during DNA replication. Curr Opin Immunol. 2019;56:24–30.
- Lei Z, Deng M, Yi Z, et al. cGAS-mediated autophagy protects the liver from ischemia-reperfusion injury independently of STING. Am J Physiol Gastrointest Liver Physiol. 2018;314(6):G655–G667.
- Jiang H, Xue XY, Panda S, et al. Chromatin-bound cGAS is an inhibitor of DNA repair and hence accelerates genome destabilization and cell death. Embo J. 2019;38(21):e102718.
- An J, Woodward JJ, Sasaki T, et al. Cutting edge: antimalarial drugs inhibit IFN-beta production through blockade of cyclic GMP-AMP synthase-DNA interaction. J Immunol. 2015;194(9):4089–4093.
- Li Z, Wang C, Wang Z, et al. Allele-selective lowering of mutant HTT protein by HTT–LC3 linker compounds. Nature. 2019;575(7781):203–209.
- Sanjana NE, Shalem O, Zhang F. Improved vectors and genome-wide libraries for CRISPR screening. Nat Methods. 2014;11(8):783–784.
- Liu H, Moura-Alves P, Pei G, et al. cGAS facilitates sensing of extracellular cyclic dinucleotides to activate innate immunity. EMBO Rep. 2019;20(4):e46293.
- Fenech M, Chang WP, Kirsch-Volders M, et al. HUMN project: detailed description of the scoring criteria for the cytokinesis-block micronucleus assay using isolated human lymphocyte cultures. Mutat Res. 2003;534(1–2):65–75.
- Balmus G, Karp NA, Ng BL, et al. A high-throughput in vivo micronucleus assay for genome instability screening in mice. Nat Protoc. 2015;10(1):205–215.