
ABSTRACT
Hepatic macroautophagy/autophagy and fatty acid metabolism are transcriptionally regulated by nuclear receptors (NRs); however, it is not known whether their transcriptional co-activators are involved in autophagy. We thus examined MED1 (mediator complex subunit 1), a key component of the Mediator Complex that directly interacts with NRs, on these processes. We found that MED1 knockdown (KD) in cultured hepatic cells decreased autophagy and mitochondrial activity that was accompanied by decreased transcription of genes involved in these processes. Lipophagy and fatty acid β-oxidation also were impaired. These effects also occurred after thyroid hormone stimulation, nutrient-replete or -deplete conditions, and in liver-specific Med1 KD (Med1 LKD) mice under fed and fasting conditions. Together, these findings showed that Med1 played a key role in hepatic autophagy, mitochondria function, and lipid metabolism under these conditions. Additionally, we identified downregulated hepatic genes in Med1 LKD mice, and subjected them to ChIP Enrichment Analysis. Our findings showed that the transcriptional activity of several NRs and transcription factors (TFs), including PPARA and FOXO1, likely were affected by Med1 LKD. Finally, Med1 expression and autophagy also were decreased in two mouse models of nonalcoholic fatty liver disease (NAFLD) suggesting that decreased Med1 may contribute to hepatosteatosis. In summary, MED1 plays an essential role in regulating hepatic autophagy and lipid oxidation during different hormonal and nutrient conditions. Thus, MED1 may serve as an integrator of multiple transcriptional pathways involved in these metabolic processes.
Abbreviations: BAF: bafilomycin A1; db/db mice; Leprdb/db mice; ECAR: extracellular acidification rate; KD: knockdown; MED1: mediator complex subunit 1; NAFLD: nonalcoholic fatty liver disease; OCR: oxygen consumption rate; PPARA/PPARα: peroxisomal proliferator activated receptor alpha; TF: transcription factor; TFEB: transcription factor EB; tf-LC3: tandem fluorescence RFP-GFP-LC3; TG: triglyceride; TH: Thyroid hormone; TR: thyroid hormone receptors; V-ATPase: vacuolar-type H+-ATPase; WDF: Western diet with 15% fructose in drinking water
Introduction
Autophagy is a highly conserved cellular process that degrades intracellular components by autophagosome engulfment of various intracellular cargos, followed by fusion with lysosomes to form autolysosomes, and lysosomal degradation of its contents [Citation1,Citation2]. This process plays an important role in maintaining energy homeostasis by degrading macromolecules such as lipid droplets, glycogen, and proteins to provide substrates for cellular metabolism [Citation3].
During periods of starvation, cells shift their metabolism from glucose metabolism to fatty acid oxidation to produce energy [Citation4,Citation5]. In the liver, autophagy is activated by starvation, and preferentially degrades intrahepatic lipid droplets to release free fatty acids for mitochondrial β-oxidation [Citation6,Citation7], a process also termed as lipophagy. Loss of lipophagy impairs the mobilization of triglycerides from lipid droplets and results in hepatosteatosis [Citation6,Citation7]. This connection between autophagy and lipid metabolism is further demonstrated by their co-regulation during starvation or in response to hormonal stimuli [Citation8–11]. For example, starvation activates TFEB (transcription factor EB) to initiate the transcription of autophagy and lysosomal genes [Citation12,Citation13], as well as genes for lipid metabolism [Citation14]. The nuclear receptor PPARA/PPARα (peroxisomal proliferator activated receptor alpha) plays a critical role in nutrient-sensing, and regulates hepatic autophagy and lipid metabolism during fasting and feeding cycles [Citation15,Citation16]. Thyroid hormone (TH) binding to thyroid hormone receptors (TRs) also increases autophagy and mitochondrial lipid oxidation [Citation7,Citation17,Citation18]. Currently, little is known about the role of transcriptional co-activators on autophagy and lipid metabolism during starvation or hormone stimulation.
MED1 (mediator complex subunit 1) is a major component of the multi-subunit mediator complex that bridges transcription factors (TFs) or nuclear receptors (NRs) bound to promoter enhancer elements with RNA polymerase II and the general transcriptional machinery. As such, it serves as a co-activator to increase the transcription of target genes [Citation19]. MED1 directly binds to multiple NRs, including thyroid hormone receptors (TRs) [Citation20], through its two LXXLL motifs. Currently, it is not known whether MED1 is involved in the regulation of autophagy during starvation or hormone stimulation. In the current study, we demonstrate that loss of MED1 not only regulated these processes during nutrient-replete and starvation conditions but also decreased T3-stimulated autophagy, β-oxidation, and lipid clearance. Liver-specific KD of MED1 also decreased the transcription of autophagic and mitochondrial genes. Med1 expression and autophagy also were decreased in two mouse models of nonalcoholic fatty liver disease (NAFLD). Taken together, these results suggest that MED1 is an important modulator of hepatic autophagy, β-oxidation, and lipid clearance, and also may modify the severity of NAFLD by its effects on autophagy and mitochondrial function.
Results
MED1 KD decreases autophagy in hepatic cells
To investigate the role of MED1 on hepatic autophagy, we employed MED1 siRNA to knock down its endogenous expression in HepG2 human hepatoma cells, which retain many liver-specific metabolic functions [Citation21]. Knockdown of MED1 did not affect the viability or cell number of these cells (Fig. S1). Western blotting showed that siRNA knockdown (KD) of MED1 decreased the protein level of autophagosome marker MAP1LC3B/LC3B-II (). MED1 KD also decreased the number of eGFP-LC3B puncta in cells transfected with this plasmid suggesting there was less autophagosome formation thereby a decrease in autophagy (Fig. S2). Furthermore, immunofluorescence staining for endogenous MAP1LC3B further confirmed that there was decreased autophagosome number in MED1 KD cells ().
Figure 1. siRNA KD of MED1 decreased autopahgy in HepG2 cells. (A) Immunoblot and densitometric analysis showing that 48 h after siRNA (10 nM) KD of MED1 decreased MAP1LC3B-II and increased SQSTM1. Bars represent the mean of the respective individual ratios ± SEM (n = 3). (B) MAP1LC3B immunostaining showing decreased endogenous MAP1LC3B puncta in MED1 KD cells. Scale bar: 50 µm. MAP1LC3B puncta/per cell were counted. Bars represent the mean ± SEM (n = 30) (C) Evaluation of autophagy flux in HepG2 cells using lysosomal inhibitor bafilomycin A1 (Baf, 150 nM). Baf-induced accumulation of MAP1LC3B-II in control or MED1 siRNA transfected cells were represented as mean ± SEM (n = 3). (D) Quantification and representative image of autophagosomes (yellow puncta on overlay) and autolysosomes (RFP puncta on overlay) in tandem RFP/GFP-tagged MAP1LC3B plasmid-transfected HepG2 cells with or without MED1 KD. Yellow and red puncta per transfected cells were counted, and the ratio of yellow to red puncta were calculated. Scale bar: 10 µm. Data are represented as mean ± SEM (n ≥ 10)
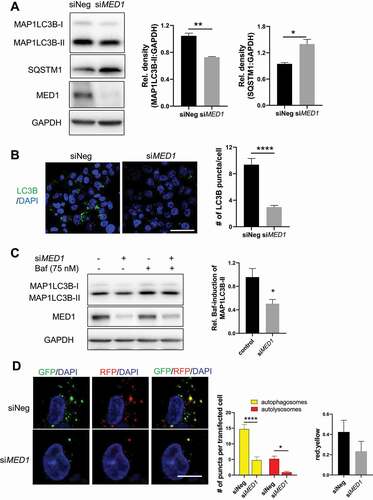
SQSTM1/p62 is an ubiquitin-binding scaffold protein that binds to ubiquitinated protein aggregates and accumulates when autophagic flux is inhibited [Citation22]. In MED1 KD cells, we observed increased SQSTM1 protein (). In conjunction with decreased MAP1LC3B-II, these data suggested that autophagic flux was decreased by MED1 KD. We then examined the accumulation of MAP1LC3B-II in the presence of bafilomycin A1 (Baf), a V-ATPase (vacuolar-type H+-ATPase) inhibitor that neutralizes lysosomal acidity to inhibit the lysosomal/autolysosomal degradation [Citation23]. As shown in , we observed a smaller induction of MAP1LC3B-II levels in MED1 KD cells than control cells after Baf treatment, indicating there was a decrease in autophagic flux in MED1 KD cells. To eliminate the possibility of off-target effects affecting autophagy, we tested 3 individual siRNAs that targeted human MED1 in HepG2 cells, and consistently observed decreased autophagic flux (Fig. S3). Similar results also were observed in immortalized mouse AML-12 hepatic cells (Fig. S4).
We further analyzed autophagy flux by transfecting control and MED1 KD HepG2 cells with a tandem fluorescence RFP-GFP-LC3 (tf-LC3) plasmid [Citation24]. In this assay, dual fluorescence of both GFP and RFP tagged to LC3 occurred in autophagosomes whereas the single fluorescence from RFP occurred only in autolysosomes since GFP was denatured in the acidic autolysosome environment. Thus, in the overlaid images, yellow dots represented autophagosomes, and red dots represented autolysosomes. Using this assay, we observed decreases in the amounts of both autophagosomes (yellow dots) and autolysosomes (red dots) in MED1 KD cells (). Interestingly, the ratio of red to yellow puncta was not significantly different. Taken together, our results demonstrated that MED1 KD decreased autophagy flux by reducing autophagosome formation.
MED1 KD decreases oxidative phosphorylation and fatty acid β-oxidation and in hepatic cells
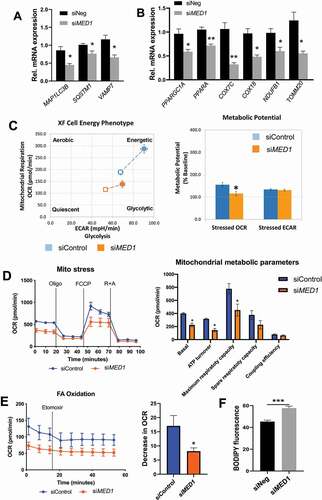
Because MED1 is a transcriptional coactivator, we next examined its role in the transcriptional regulation of several key autophagy genes. MED1 KD decreased MAP1LC3B, SQSTM1/p62, and VAMP7 mRNA levels (). Interestingly, the mRNA levels of two important regulators of mitochondrial fatty acid β-oxidation, PPARA, and PPARGC1A/PGC1α, and several other mitochondrial genes also were decreased (). To assess the net effect of MED1 KD on cellular oxidative and glycolytic function, we used Seahorse XF Cell Energy Phenotype Test Kit to examine oxygen consumption rate (OCR) and extracellular acidification rate (ECAR). Control cells had a greater increase in OCR than MED1 KD cells, suggesting that MED1 KD cells had compromised oxidative function (). Analyses of metabolic potential as a percentage of baseline showed a decrease in OCR in MED1 KD cells compared to control cells (). Interestingly, glycolytic potential did not significantly change in both control and MED1 KD cells during stress condition since no change of ECAR was observed. These findings demonstrated that MED1 KD decreased mitochondrial function but did not affect glycolytic function. We further assessed the effect of MED1 KD on mitochondrial function using the Mito Stress test. MED1 KD decreased mitochondrial basal respiration, ATP turnover, and maximum respiratory capacity (), further confirming that MED1 KD led to a decreased mitochondrial activity. To determine the effects of MED1 KD on mitochondrial fatty acid oxidation, we next measured cellular OCR before and after addition of the CPT1α inhibitor, Etomoxir, which blocks acylcarnitine uptake into mitochondria and inhibits β-oxidation; thus, the decrease in OCR is an indicator of mitochondrial fatty acid β-oxidation. MED1 KD cells had lower basal OCR as well as less reduction in OCR after Etomoxir treatment when compared with control cells under similar conditions (), indicating there was decreased fatty acid oxidation in MED1 KD cells compared to control cells. Consistent with these findings, we also observed a small, but significant, reciprocal increase in intracellular lipid content in MED1 KD cells compared to cells transfected with control siRNA under basal conditions ().
Figure 2. siRNA KD of MED1 decreased fatty acid oxidation, oxidative phosphorylation and lipid clearance in HepG2 cells. Assays were performed 48 h after siRNA transfection. (A) KD of MED1 decreased mRNA expression of autophagic genes. Bars represent the mean ± SEM (n = 3). (B) KD of MED1 decreased mRNA expression of key metabolic and mitochondrial genes. Bars represent the mean ± SEM (n = 3). (C). Seahorse XF cell energy phenotype test showed that KD of MED1 decreased metabolic bioenergetics and oxidative potential. Bars represent the mean ± SEM (n = 12). (D) Seahorse XF Mito Stress Test showed that KD of MED1 decreased oxygen consumption rate (OCR) and mitochondrial metabolic potential in HepG2 cells. Data are presented as mean ± SEM (n = 12). (E) Seahorse XF Fatty Acid (FA) Oxidation test showed decreased fatty acid oxidation in MED1 KD HepG2 cells. Data are presented as mean ± SEM (n = 12). (F) KD of MED1 increased cellular neutral lipid content in HepG2 cells. Lipid droplets was stained with BODIPY 493/503 (5 µg/ml), and measured by flow cytometry. Data are represented as mean ± SEM (n = 3)
MED1 KD decreases induction of autophagy, lipophagy, oxidative phosphorylation, and target gene expression by T3 in hepatic cells
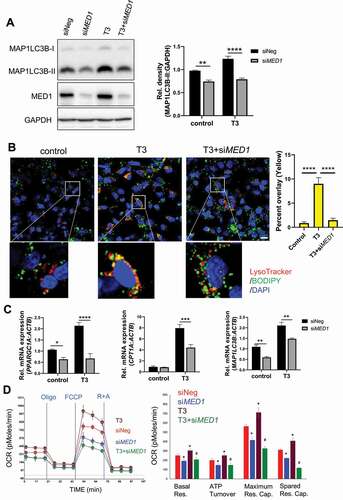
We previously reported that T3 stimulated hepatic autophagy of lipids from fat droplets (lipophagy) to increase β-oxidation of fatty acids [Citation7,Citation25]. Since MED1 is an important co-activator for TRs, we examined whether T3 could stimulate autophagy after MED1 KD in hepatic cells. Interestingly, MED1 KD abrogated stimulation of MAP1LC3B-II expression by T3 (). We next investigated whether stimulation of lipophagy by T3 was modulated by MED1, and found that T3 treatment of control siRNA-transfected cells had significantly more colocalization of BODIPY and LysoTracker staining than T3 treatment of MED1 KD cells (yellow puncta, ), indicating that MED1 KD decreased the lipophagy induced by T3. We analyzed the expression of several target genes stimulated by T3: PPARGC1A, CPT1A, and MAP1LC3B, which are involved in mitochondrial biogenesis and function, fatty acid entry into mitochondria, and autophagy, respectively, and found that MED1 KD blunted transcriptional induction of these genes by T3 (). Finally, we examined stimulation of OCR by T3 in HepG2 cells, and found that MED1 KD abrogated the stimulation of basal respiration, ATP turnover, maximum respiratory capacity, and spare respiratory capacity induced by T3 (). Taken together, these results showed that T3-mediated autophagy/lipophagy and oxidative phosphorylation was abolished by MED1 KD.
Figure 3. siRNA KD of MED1 decreased T3-induced lipophagy and mitochondrial activity in HepG2-TRβ cells. Forty-eight h after KD of MED1, the cells were treated with or without 100 nM T3 for another 24 h. (A) Immunoblot and densitometric analysis of MAP1LC3B-II showing that KD of MED1 decreased T3-induced autophagy. Data are represented as mean ± SEM (n = 3). (B) KD of MED1 decreased T3-induced lipophagy. Cells were stained with LysoTracker (200 nM, red) and BODIPY 493/503 (1 µg/mL, green). Colocalization of LysoTracker (lysosome) and BODIPY (lipid droplets) is shown as yellow spots. Scale bar: 20 µm. Percent colocalization of each cell was quantified. Data are represented as mean ± SEM (n = 25). (C) KD of MED1 decreased T3-induced transcription of PPARGC1A, CPT1A and MAP1LC3B. Data are represented as mean ± SEM (n = 3). (D) Seahorse XF Mito Stress Test showed that KD of MED1 decreased T3-induced mitochondrial activity. KD of MED1 decreased basal respiration (Basal Res.), ATP turnover, maximum respiratory capacity (Maximum Res. Cap.), and spared respiratory capacity (Spared Res. Cap). Data are represented as mean ± SEM (n = 6)
MED1 KD decreases autophagy, lipophagy, and fatty acid oxidation induced by starvation in hepatic cells
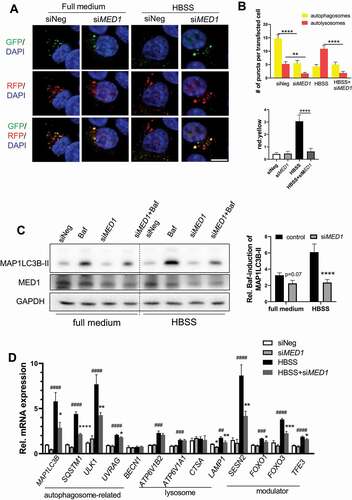
During starvation, induction of autophagy promotes the breakdown of lipid droplets and the release of free fatty acid for mitochondrial β-oxidation to generate ATP. Thus, we investigated whether MED1 played a role in stimulating autophagy and lipid catabolism in hepatic cells during starvation. Fluorescence imaging of HepG2 cells transfected with tf-LC3 plasmid which expressed both green and red fluorescent proteins showed more yellow puncta (autophagosomes) than red puncta (autolysosomes) in full medium (). There also was an increase in the ratio of red to yellow puncta after HBSS starvation (). In full medium, MED1 KD cells had a similar puncta pattern as HepG2 cells but at much lower levels. In contrast to HepG2 control cells, MED1 KD cells did not show any change in the ratio of red to yellow puncta after starvation (). These data suggested that there was decreased levels of autophagosomes and autolysosomes after MED1 KD as well as decreased autophagic flux during starvation. These findings were further confirmed by the abrogation of the bafilomycin A1-induced accumulation of MAP1LC3B-II during starvation in MED1 KD cells (). Transcriptional induction of autophagy genes is necessary in order to sustain autophagy over prolonged periods of time. We thus examined the effects of MED1 KD on autophagy and lysosomal gene expression. As shown in , starvation induced the transcription of autophagosome and lysosome genes as well as several key TFs that regulate the transcription of autophagy and lysosomal genes in cells transfected with control siRNA. In contrast, the gene expressions of MAP1LC3B, SQSTM1, ULK1, UVRAG and LAMP1 as well as the autophagy regulators SESN2, FOXO1, FOXO3, and TFE3 were attenuated by MED1 KD during starvation ().
Figure 4. siRNA KD of MED1 decreased starvation-induced autophagy. (A-B) Evaluation of autophagy flux using tandem RFP/GFP-tagged MAP1LC3B plasmid in HepG2 cells with or without 8 h HBSS starvation. Representative image (A) and Quantification (B) of autophagosomes (yellow puncta on overlay) and autolysosomes (RFP puncta on overlay) in tandem RFP/GFP-tagged LC3 plasmid transfected HepG2 cells with or without MED1 KD. Yellow or red puncta per transfected cells were counted. Scale bar: 10 µm. Data are represented as mean ± SEM. (n ≥ 15). (C) Immunoblot and densitometric analysis showing Baf-caused accumulation of MAP1LC3B-II was decreased by KD of MED1 under HBSS starvation. Forty-eight h after siRNA (10 nM) KD of MED1, cells were cultured in full medium or HBSS for 1 h. Baf (150 nM) was added 4 h before cells were harvested. Bars represent the mean of the respective individual ratios ± SEM (n = 3). (D) HBSS (8 h) starvation-induced expression of autophagic genes were impaired by MED1 KD. Data are represented as mean ± SEM (n = 3)
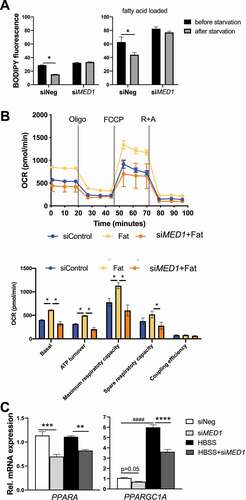
We next examined colocalization of BODIPY and MAP1LC3B staining and found that there were more lipid-laden autophagosomes (yellow) in control hepatic cells than MED1 KD cells in both glucose-replete and glucose-starvation conditions (Fig. S5). These findings showed that lipophagy of lipid droplets was impaired by the loss of MED1 during both conditions. We then pre-loaded cells with or without fatty acids (0.1 mM palmitic acid and 0.2 mM oleic acid) overnight, and then subjected them to 24 h of glucose starvation. Cells then were stained for intracellular lipid using BODIPY fluorescent dye followed by flow cytometry measurement before and after 24 h of glucose starvation. We determined starvation-induced lipid oxidation by measuring the difference in BODIPY fluorescence before and after starvation. We observed significant decreases in lipid content after starvation in control cells regardless of whether fatty acids were loaded or not. In contrast, there were no decreases in starvation-induced lipid content in MED1 KD cells during these conditions (). Since fatty acids are the primary fuel for hepatic cells during starvation, we next examined the effects of MED1 KD on fatty acid-stimulated OCR using Seahorse extracellular flux analyzer. We found that basal respiration, ATP turnover, maximum respiratory capacity, and spare respiratory capacity were induced by fatty acids in control cells, but not in MED1 KD cells (). mRNA levels of PPARA and PPARGC1A, which regulate fatty acid β-oxidation and mitochondrial biogenesis, also were significantly decreased in MED1 KD cells during starvation (). Taken together, our results showed that loss of MED1 led to decreased autophagic breakdown of lipid droplets and mitochondrial oxidation of fatty acids during starvation.
Figure 5. siRNA KD of MED1 decreased oxidative phosphorylation, and lipid clearance in HepG2 cells. (A) KD of MED1 decreased starvation-induced lipid oxidation. 48 h after transfection with control or MED1 siRNA, HepG2 cells were loaded with or without 2% BSA-conjugated fatty acid (0.1 mM palmitic acid and 0.2 mM oleic acid) overnight. To Measure the lipid content before starvation, cells were stained with BODIPY (5 µg/ml) for 10 min, and harvested for flow cytometry measurement. To measure lipid content after starvation, the medium was replenished with 5% FBS containing, glucose and pyruvate-free medium for another 24 h. The cells then were stained with BODIPY 493/503, and harvested for flow cytometry measurement. Thus, the difference in BODIPY fluorescence before and after starvation condition represented the starvation-induced lipid oxidation. Data are represented as mean ± SEM (n = 3). (B) Seahorse XF Mito Stress test showed that KD of MED1 decreased fatty acids (Fat)-stimulated mitochondrial activity. Data are represented as mean ± SEM (n = 6). (C) HBSS (8 h) starvation-induced expression of metabolic genes were impaired by MED1 KD. KD of MED1 decreased key metabolic genes PPARA and PPARGC1A. Data are represented as mean ± SEM (n = 3)
Induction of hepatic autophagy and β-oxidation by starvation is attenuated in Med1 liver-specific KD (Med1 LKD) mice.
We next investigated the role of Med1 in the regulation of hepatic autophagy and β-oxidation during acute feeding vs. starvation in vivo. Ten-week old male C57BL/6 mice were injected with adeno-associated virus serotype-8 carrying Med1 shRNA under the control of Alb promoter (AAV8-ALBp-eGFP-mMed1-shRNAmir) or control AAV8-Null to generate Med1 liver-specific KD (Med1 LKD) mice and control mice, respectively. Three weeks after injections, these mice were given normal chow diet from 9 am to 3 pm, or fasted for 22 h before sacrificing them and harvesting their livers. We demonstrated that hepatic Med1 KD in vivo was successful by showing Med1 mRNA and protein expression was decreased during fed and starvation states in the Med1 LKD mice (Fig. S6A and ). Furthermore, the mRNA levels of three TH target genes, Dio1, Thrsp and Me1 were decreased in Med1 LKD mice (Fig. S6B-D). Interestingly, T3-treated mice showed an increase in Med1 mRNA expression in a time-dependent manner (Fig. S7). Starvation did not change hepatic MAP1LC3B expression but decreased SQSTM1 protein expression in control mice (black bars) suggesting that there was increased autophagic degradation caused by starvation. In contrast, hepatic protein levels of MAP1LC3B-II was lower and SQSTM1 was higher in Med1 LKD mice than in control mice during both the fed and starved states, indicating there was decreased autophagy in the Med1 LKD mice during both conditions (). We next measured the level of β-hydroxybutyrate, the end product of β-oxidation. Starvation increased serum β-hydroxybutyrate levels in mice injected with control AAV8; however, this increase was attenuated in Med1 LKD mice (). We next measured the hepatic and circulating triglyceride (TG) levels. Interestingly, there was an elevation of serum TG level, but no change in hepatic TG, in Med1 LKD mice during both fed and fasting states (). Taken together with our previous findings in hepatic cells, these results showed that autophagy and β-oxidation of fatty acids induced by starvation was impaired by loss of Med1 in vivo. Transcriptional pathway analysis of the hepatic transcriptomes of control and Med1 LKD mice during the fed and fasting states showed that several of the major gene pathways affected by Med1 LKD during the fed and fasting states were involved in hormone signaling, fatty acid, glucose, ketone metabolism, and gluconeogenesis (, and Table S1).
Table 1. Gene Set Enrichment Analysis (GSEA) pathway analysis of transcriptomics performed in the livers from fed or fasting mice with control or Med1 shRNA under the Alb promoter carried by AAV8
Figure 6. Liver-specific KD of Med1 decreased autophagy and fatty acid β-oxidation in vivo. Liver-specific KD of Med1 or control animals were generated by injecting ALB-mMed1-shRNA-expression adeno-associated virus (AAV8-ALBp-eGFP-mMed1-shRNAmir) or control adenovirus. (A) Immunoblot and densitometric analysis of MAP1LC3B-II, SQSTM1 in the liver from control or Med1 KD C57BL/6 J mice under fed or fasting condition. (B) Serum β-hydroxybutyrate and (C) Hepatic TG, serum TG levels from control or Med1 KD C57BL/6 J mice under fed or fasting condition. Data are represented as mean ± SEM. Control fed (n = 7), siMed1 LKD fed (n = 8), fast control (n = 8), siMed1 LKD fast (n = 8)
Induction of hepatic genes involved in autophagy, lysosomal degradation, and lipid metabolism by starvation is attenuated in Med1 LKD mice
Autophagy plays a prominent role in cellular fasting response, fatty acid metabolism, and ketogenesis. All of these pathways, including autophagy were decreased in MED1 KD cells. We thus examined the hepatic expression of target genes involved in autophagy and lysosome function in Med1 LKD mice. Three general patterns of gene expression emerged when genes involved in lysosome and autophagy function were analyzed. In one group, were increased by starvation in control mice and the increases were attenuated in Med1 LKD mice (). Genes such as Map1lc3b, Vps113c, Atp6v0d2, Atp6v1b1, Sesn2, and Tfeb displayed this gene expression pattern. In the second group, gene expression was not changed by fasting in control mice but was attenuated in both the fed and fasting states in Med1 LKD mice. This pattern was observed in genes such as Atg7, Vps13d, Ctsa, Lamp1, and Lamp2. Yet another group exhibited increased gene expression after fasting, while the Med1 LKD mice had decreased expression during both the fasting and fed states (e.g., Ulk1, Foxo1). These findings suggested that Med1 regulated both basal and starvation-induced expression of some genes involved in autophagy and lysosomal function whereas it selectively attenuated starvation-induced gene expression in others.
Figure 7. Expression of autophagy genes was attenuated in the livers from control or Med1 LKD mice under fed or fasting conditions. Data are represented as mean ± SEM. Control fed (n = 7), siMed1 LKD fed (n = 8), fast control (n = 8), siMed1 LKD fast (n = 8)
Induction of hepatic mitochondrial genes by starvation is attenuated in Med1 LKD mice
We earlier observed that Med1 KD decreased oxidative phosphorylation in hepatic cells (, , and ). We thus examined the effects of Med1 KD on the expression of genes involved in mitochondrial function or biogenesis during the fed and fasting states (). Ppargc1a and Ppara mRNA expression was induced by starvation in control mice but this starvation-induced increase was attenuated in Med1 LKD mice. mRNA expression of a mitochondrial protein (Cox18), mitochondrial enzymes (Cs, Fh1) and subunits belonging to mitochondrial electron transport chain (ETC) complexes (Ndufb8, Sdhb, Uqcrc2, Atp5a1) as well as a lipid metabolic enzyme (Acsl1) did not change between the fasting and fed states in control mice; however, the expression of most of these genes were reduced in both the fed and starvation states in Med1 LKD mice.
Figure 8. Expression of mitochondrial and metabolic genes was attenuated in the livers from control or Med1 LKD mice under fed or fasting conditions. Data are represented as mean ± SEM. Control fed (n = 7), siMed1 LKD fed (n = 8), fast control (n = 8), siMed1 LKD fast (n = 8)
Impaired PPARA – and FOXO1- mediated transcription in the livers of Med1 LKD mice
In order to identify the NR or TF that might require Med1 for their transcription activity in the liver under starvation, we uploaded 252 hepatic genes that were downregulated in Med1 LKD mice during fasting that were identified by RNA-seq analysis (235 genes) and qRT-PCR (17 genes), and performed ChIP Enrichment Analysis [Citation26] (ChEA-2016, https://maayanlab.cloud/Enrichr/). This program employs transcription factor binding site profiles from published CHIP-chip and CHIP-seq studies. Interestingly, the downregulated hepatic genes in the Med1 KD mice during fasting were enriched for genes containing NR or TF binding sites (Table S2). Previous studies showed that RXR, LXR, PPARA, ESR1, and thyroid hormone receptors were NRs that required MED1 for their transcription activity [Citation27–29]. Transcriptionally-regulated genes containing their binding sites (NRs: Ppara, Esr1, Lxr, and Rxr, and transcription factors: Egr1, Nfe2, and Foxo1) were identified by this unbiased approach. Notably, Ppara, Esr1, Egr1, Nfe2, and Foxo1 regulate autophagy at the transcriptional level [Citation15,Citation30–33]. In particular, both Ppara and Foxo1 have been reported to regulate hepatic autophagy and energy homeostasis (e.g., lipid oxidation or gluconeogenesis) during starvation. We found the mRNA and protein expression of Ppara and Foxo1 were decreased in the livers of Med1 LKD animals (, ). We also used qRT-PCR to validate additional putative PPARA and FOXO1 target genes Kcnk5, Tat, Insig2, Pdk1, Igfbp1, G6pc, Abca8a, Pck1, Lpin1, Ahcy, and Klf9. Most of these genes are highly involved in lipid or glucose metabolism, and all of them were downregulated at the mRNA level in Med1 LKD mice (). Additionally, the mRNA expression of several autophagic and mitochondrial genes that are putative target genes of Ppara including Map1lc3b, Atp6v0d2, Fh1, and Cs were downregulated in livers from Med1 LKD mice (Table S2). Taken together, our data showed that knockdown of Med1 in the liver decreased both mRNA and protein levels of Foxo1, and Ppara, and the mRNA expression of their target genes. These results suggested that during fating, Ppara- and Foxo1-mediated transcription likely were impaired in the livers of Med1 LKD animals.
Figure 9. PPARA and FOXO1 protein levels, and mRNA expression of their target genes in the livers from control or Med1 LKD mice under fed or fasting conditions. (A) Immunoblot and densitometric analysis of PPARA, and FOXO1 in the liver from control or Med1 KD C57BL/6 J mice under fed or fasting condition. (B) Quantitative RT-PCR measurement of PPARA and FOXO1 target genes. Data are represented as mean ± SEM. Control fed (n = 7), siMed1 LKD fed (n = 8), fast control (n = 8), siMed1 LKD fast (n = 8)
Basal expression of hepatic Med1 protein as well as autophagy is reduced in mouse models of nonalcoholic fatty liver disease (NAFLD)
We next examined whether there was a decrease in hepatic Med1 expression in NAFLD by employing two mouse models of NAFLD [Citation34]. Mice that were fed Western Diet with 15% fructose in drinking water (WDF) for 16 weeks had increased liver triglyceride content (). We also found they had decreased Med1 protein expression (). There also was no change in MAP1LC3B-II in the livers from mice fed WDF; however, there was accumulation of SQSTM1 in these mice (), suggesting that there was decreased autophagy in NAFLD when Med1 expression was decreased. A genetic model of NAFLD, Leprdb/db mice (db/db), can develop hepatosteatosis when fed normal chow diet in an age-dependent manner [Citation34]. We analyzed the livers from 12 weeks old C57BL/6 J wildtype and db/db mice fed normal chow diet ad libitum, and found that db/db mice showed increased hepatic triglyceride content (), decreased protein level of MED11, and increased accumulation of both MAP1LC3B-II and SQSTM1 (). Taken together, the two models of NAFLD displayed hepatosteatosis and impaired autophagy that was associated with decreased level of Med1 protein expression. These findings raise the possibility that changes in Med1 could contribute to the decreased autophagy and hepatic lipid metabolism that occur in NAFLD.
Figure 10. Med1 protein and autophagy was decreased in animal models of hepatosteatosis. (A-C) Med1 protein level was decreased in WDF feeding-induced hepatosteatosis. Liver triglyceride content was measured in the liver from C57BL/6 J mice fed with NCD (n = 5) or WDF (n = 5) diet for 16 weeks (A), Immunoblot (B), and densitometric analysis (C) of Med1, MAP1LC3B-II, and SQSTM1 in the liver from C57BL/6 J mice fed with NCD (n = 7) or WDF (n = 7) diet for 16 weeks. (C-F) A lower protein level of Med1 was observed in the liver from db/db mice than age-matched C57BL/6 J mice. Liver triglyceride content was measured in the liver C57BL/6 J (n = 5) or db/db (n = 5) mice fed with NCD diet (D), Immunoblot (E), and densitometric analysis (F) of Med1, MAP1LC3B-II, and SQSTM1 in the liver from C57BL/6J (n = 8) or db/db (n = 8) mice fed with NCD diet. Data are represented as mean ± SEM
Discussion
Recent evidence has shown that transcriptional regulation of autophagy is important for maintaining basal autophagy and regenerating autophagy/lysosome components degraded during chronic conditions such as prolonged starvation [Citation8–11,Citation35]. TFs such as CREB [Citation16], TFEB [Citation36], FOXO1 [Citation37], and PPARA [Citation15] play key roles in the induction of autophagy gene transcription during starvation; however, little is known about the role of their transcriptional co-activators. In the current study, we have provided several lines of evidence suggesting that the co-activator, MED1 is involved in regulating hepatic autophagy during both fed and starved conditions (, , ), and after T3 treatment (). In cultured hepatic cells and in mice with liver-specific KD of Med1, we observed transcription of hepatic genes under both nutrient replete/fed and fasting conditions (, , and ). The genes included proteins involved in autophagosome and lysosome formation, tethering proteins, autophagy receptors, and transcriptional modulators. These genes were upregulated during starvation. However, after Med1 KD, the expression of some of these genes attenuated during fasting conditions, whereas others were attenuated during both conditions.
During starvation, autophagy is activated to break down macromolecules that provide substrates for gluconeogenesis and fatty acids for mitochondrial metabolism [Citation6,Citation38]. The decreased supply of nutrients and/or lower energy stores within the cell, leads to increased hepatic lipophagy [Citation6]. In this connection, we observed increased autophagy and decreased amounts of intracellular lipid in hepatic cells during starvation, which were attenuated in MED1 KD cells (, ). The number of lipophagosomes were also decreased in MED1 KD cells (Fig. S5). Furthermore, the increases in starvation-induced autophagy and serum β-hydroxybutyrate observed in control mice were not found in the Med1 LKD mice (). Taken together, our data strongly suggest that MED1 KD in hepatic cells led to decreased autophagy and decreased fatty acid β-oxidation during starvation.
We also investigated the role of MED1 on mitochondrial activity and oxidative phosphorylation by using Seahorse XF extracellular flux analyzer to perform cell energy phenotype, mitochondrial stress, and mitochondrial fatty acid oxidation tests. MED1 KD decreased mitochondrial OCR with little effect on anaerobic glycolysis, mitigated OCR during mitostress conditions, attenuated OCR response to long chain fatty acid supplementation, and reduced lipid clearance (, ). We also found that MED1 KD resulted in decreased transcription of mitochondrial genes in both cultured hepatic cells as well as in mouse liver (, , and ). In the livers of Med1 LKD mice, genes encoding enzymes in ETC complexes, enzymes involved in oxidative phosphorylation, and key regulators for mitochondrial biogenesis such as Ppargc1a and Ppara were downregulated (). Additionally, loss of Med1 decreased lipid oxidation during starvation through reduced transcription of autophagy, lysosomal, and mitochondrial genes (). RNA-seq and pathway analysis showed that genes regulated by Med1 belonged to pathways involved in hormone response as well as fatty acid and glucose metabolism ( and Table S1).
Increased lipophagy, mitochondrial oxidative phosphorylation capacity, and β-oxidation of fatty acids have been reported for NRs such as PPARA and TR [Citation6,Citation7,Citation25,Citation39,Citation40]. Interestingly, both PPARA and TR directly bind to MED1, which serves as a co-activator for their ligand-mediated transcription [Citation20,Citation27,Citation41]. We found that MED1 played a key role in TR-mediated transcriptional activity since the induction of several target genes by T3 in control hepatic cells was dampened in MED1 KD cells (). Significantly, the increases in autophagy, lipophagy, oxygen consumption and ATP production by T3 observed in control hepatic cells also were decreased in MED1 KD cells (). Thus, these findings demonstrate a critical role of MED1 on T3-mediated effects on these processes. Interestingly, we also found that long-term T3 treatment of mice induced the expression of hepatic Med1 mRNA (Fig. S6). This raises the intriguing possibility that concurrent rises in T3 and Med1 co-activator levels could synergistically increase the sensitivity and response of target genes to TH. In this connection, we observed the gene expressions of Thrsp and Me1, two well-known TH-regulated target genes, were decreased in the Med1 LKD mice during both the fed and fasting states (Fig. S6).
To understand the global effects of Med1 on transcription during starvation, we performed RNA-seq and qRT-PCR analysis in the livers from control and Med1 LKD animals under fed and fasting conditions, and identified the downregulated genes due to KD of Med1. Some of these genes were involved in autophagy, mitochondrial function, as well as lipid and glucose metabolism (, Table S1). We then performed ChIP Enrichment Analysis (ChEA-2016) on this set of Med1 target genes. PPARA and FOXO1, as well as RXR and LXR, were identified by this unbiased approach, suggesting that these NRs and TFs were potential transcription factors regulating these genes through Med1 (Table S2). Additionally, we found that hepatic mRNA levels of Ppara and Foxo1 target genes were decreased during starvation in Med1 LKD mice ( and Table S2). Furthermore, the hepatic mRNA and protein expression of Ppara and Foxo1 were decreased in Med1 LKD mice ( and ), suggesting yet another mechanism for regulating their activities. In this connection, it is noteworthy that previous studies showed that KD of Med1 inhibited ESR1-induced Foxo1 transcription [Citation29], whereas PPARA directly bound to Med1’s LxxLL motif and utilized Med1 as an indispensable co-activator for its transcriptional activity [Citation27,Citation42]. Our findings suggest that during starvation, MED1 may be involved in the induction of autophagy genes regulated by PPARA, FOXO1, and other transcription factors.
Finally, we found reduced Med1 expression in two mouse models of NAFLD: mice fed WFD for 16 weeks and Leprdb/db (db/db) mice. Additionally, there was decreased hepatic autophagy and increased hepatosteatosis in both NAFLD mouse models. These findings suggest that reduced hepatic MED1 expression in NAFLD may be involved in the decreased hepatic autophagy, mitochondrial function, and β-oxidation found in this condition.
In summary, we have demonstrated that MED1 mediator subunit plays an important role in the regulation of autophagy during fed and starvation states. Our findings suggest that MED1 regulation of autophagy may be a novel mechanism to control autophagy, β-oxidation, oxidative phosphorylation, and lipid metabolism. Declines in hepatic MED1 level in NAFLD may contribute to the pathogenesis of this condition. Additionally, pathway analysis of the control and Med1 LKD mice transcriptomes showed that Med1 serves as modulator of a wide range of cellular metabolic programs and pathways. Thus, MED1 most likely integrates the signaling of multiple TFs and NRs that utilize it as a co-activator, and its expression also may augment or dampen the transcriptional activity by TFs and NRs, particularly during different nutrient or hormonal states. Our findings demonstrate not only the important role of MED1 and Mediator complex for the transcriptional activity of NRs but also demonstrate that it is a key participant in promoting autophagy and metabolic homeostasis in the liver during different nutrient and hormonal conditions.
Materials and Methods
Reagents
Antibodies recognizing MAP1LC3B/LC3B (2775), GAPDH (2118), SQSTM1/p62 (5114) were purchased from Cell Signaling Technology, antibody recognizing MED1 was purchased from Bethyl Laboratories (A300-793A), whereas antibodies recognizing ACTB/β-actin (sc-47,778), and HRP-conjugated secondary antibodies recognizing mouse (sc-2005) and rabbit (sc-2357) IgG were purchased from Santa Cruz Biotechnology. Control or MED1 siRNA targeting human or mouse MED1 were purchased from Dharmacon (L-004126-00-0005). Culture media (D5796) from Invitrogen, and serum (F2442) from Sigma-Aldrich. GFP-RFP-LC3 (tf-LC3) (Addgene, 21,074) and eGFP-LC3 (Addgene, 21,073) plasmids were gifts from Prof. T. Yoshimori (Osaka University, Osaka, Japan) [Citation24,Citation43].
Cell Culture and Transfection
HepG2 cells were purchased from ATCC (HB-8065) and maintained at 37°C in DMEM containing 10% FBS in a 5% CO2 atmosphere. For siRNA transfection, HepG2, HepG2-TRβ, or AML12 cells were trypsinized, mixed with opti-MEM medium (Invitrogen, 31,985,070) containing Lipofectamine RNAimax (Invitrogen, 13,778,150) and MED1 or control siRNA (10 nM) according to the manufacturer’s recommendations. For cDNA transfection, GFP-RFP-LC3 (tf-LC3) and eGFP-LC3 plasmid was transfected into HepG2 cells using Lipofectamine 2000 reagent (Invitrogen, 11,668,019) 48 h after the transfection of control or MED1 siRNA.
For nutrient-deprived conditions, amino acid deprivation was introduced by replenish the normal nutritional medium with HBSS (Gibco, 14,025–092); glucose deprivation was introduced by replenishing the medium with DMEM (without glucose, sodium pyruvate; Mediatech Inc, 17–207-cv) containing 5% FBS, which was referred to as starvation.
To assess the effect of MED1 KD under basal condition, HepG2 cells were transfected with negative control or MED1 siRNA. Cells were harvested 48 h after transfection.
To assess the effect of MED1 KD on T3 action, HepG2-TRβ cells were transfected with negative control or MED1 siRNA. 48 h after transfection, cells were treated with or without 100 nM T3 (Sigma-Aldrich, T6397) for another 24 h.
Crystal violet staining
Forty-eight h after transfection with control or MED1 siRNA, HepG2 cells were washed with PBS (VWR Life Science, VWRCE504-500ML), fixed with 90% ethanol and stained with 0.1% crystal violet. Following extensive washing with tap water and air-dry, dye was extracted with 10% acetic acid and quantified by measuring absorbance at 595 nm on a multiwall spectrophotometer (Bio-Rad).
Western blot analysis
Proteins were separated by SDS–PAGE under reducing conditions and transferred to nitrocellulose membranes. Membranes were blocked with 5% nonfat milk in phosphate-buffered saline with 0.1% Tween 20 (Sigma-Aldrich, P9416; PBST). The blots were incubated overnight at 4°C with primary antibodies. Immunoblot analysis was performed using an enhanced chemiluminescence procedure (GE Healthcare, RPN2106).
For autophagy flux analysis, the bafilomycin A1 (150 nM for HepG2 cells, and 10 nM for AML12 cells; ATCC, CRL-2254) was added 4 h before cells were harvested.
Immunofluorescence studies
For endogenous MAP1LC3B puncta staining, cells were washed in PBS and then fixed with 4% paraformaldehyde for 15 min at room temperature. Fixed cells were washed with PBS, permeabilized in 100% methanol for 10 min at – 20°C, washed in PBS, and blocked in blocking buffer for 1 h at room temperature. Cells subsequently were incubated with anti- MAP1LC3B antibody (1:300 dilution) overnight at 4°C. After 3 TBST washes, cells were incubated with Alexa Fluor–anti-rabbit antibody (Invitrogen, A27034) for 2 h at room temperature and then washed 3 times in TBST. Coverslips were mounted on slides using Vectashield anti-fade reagent with 4′,6-diamidino-2-phenylindole (Invitrogen, P36931). Cells were visualized using LSM710 Carl Zeiss confocal microscope.
To assess the effect of MED1 KD on T3-induced lipophagy, 48 h after HepG2-TRβ cells were transfected with negative control or MED1 siRNA, cells were treated with 100 nM T3 for 24 h. Cells were stained with LysoTracker Red DND-99 (Thermo Fisher Scientific, L7528; 200 nM) for 60 min, washed with PBS, fixed with 4% formaldehyde. Fixed cells was stained with BODIPY 493/503 (1 µg/ml; Invitrogen, D3922) and DAPI (Invitrogen, D1306). Colocalization of LysoTracker and BODIPY was performed using CoLocalizer Pro software (CoLocalization Research Software).
To assess the effect of MED1 KD on starvation-induced lipophagy, 48 h after HepG2 cells were transfected with negative control or MED1 siRNA, the cells were loaded with BSA-conjugated fatty acids (0.1 mM palmitic acid [Sigma-Aldrich, P0500], 0.2 mM oleic acid [Sigma-Aldrich, O1008]); overnight. To starve the cells, the medium was replenished with 5% FBS containing glucose and pyruvate-free medium. Cells were cultured for another 24 h before fixation. Colocalization analysis of MAP1LC3B and BODIPY was performed using CoLocalizer Pro software.
Cellular oxygen consumption rate (OCR) analysis
Mitochondrial stress test was performed using Mito stress test kit (Seahorse Biosciences, 103,015–100). Oxygen consumption was measured at 37°C using an XF24 extracellular analyzer (Seahorse Bioscience Inc., North Billerica, MA, USA). HepG2 or HepG2-TRβ cells (40,000) were seeded in 24-well plates and transfected with MED1 siRNA or negative control siRNA. Forty-eight h after transfection, mitochondrial metabolic parameters were assessed using Mito stress test kit according to manufacturer’s instructions. Every point represents an average from five different wells. For T3 treatment, 48 h after transfection with negative or MED1 siRNA, HepG2-TRβ cells were treated with or without 100 nM T3. For fatty acids loading, 48 h after transfection with negative or MED1 siRNA, HepG2 cells were treated with 2% BSA-conjugated fatty acid (0.33 mM palmitic acid and 0.66 mM oleic acid) for 24 h.
Bioenergetic phenotyping and fatty acid oxidation assay were performed using Agilent Seahorse XFe96 Extracellular Flux Analyzer. Briefly, HepG2 cells (6,400) were seeded in 96-well plates transfected with negative or MED1 siRNA. Forty-eight h after transfection, bioenergetic phenotyping or fatty acid oxidation assay was performed using XF Cell Energy Phenotype Test Kit or using long chain fatty acid oxidation inhibitor etomoxir (4 µM).
BODIPY 493/503 Staining and cellular fat content measurement in vitro
The neutral lipid was stained with fluorescent dye BODIPY 493/503 (5 µg/ml) for 10 min, followed by measurement using a Macsquant flow cytometer (Miltenyi Biotec) as previously described [Citation44]. For measurement of neutral lipid under basal condition, 48 h after HepG2 cells were transfected with negative control or MED1 siRNA, cells were stained with BODIPY 493/503 for measurement.
For fatty acid oxidation before and after starvation, 48 h after transfection with negative control or MED1 siRNA, HepG2 cells were loaded with or without 2% BSA-conjugated fatty acid (0.1 mM palmitic acid and 0.2 mM oleic acid) overnight. For non-starved condition, the cells were stained and harvested for flow cytometry measurement. For the starved cells, the medium was replenished with 5% FBS containing glucose and pyruvate-free medium for another 24 h. Then the cells were stained with BODIPY 493/503, and harvested for flow cytometry measurement.
RNA purification and RT-PCR
Total cellular RNA was isolated with the High Pure RNA isolation Kit (Roche, 11,828,665,001) following the manufacturer’s protocol and total RNA was quantified with a Nanodrop ND-1000 spectrophotometer. Total RNA (1 μg) was reverse-transcribed using iSCRIPT cDNA synthesis kit (Bio-Rad, 1,708,890) under conditions defined by the supplier. cDNA was quantified by real-time PCR on the Rotor-Gene Q System (Qiagen). PCR was done using QuantiFast SYBR Green PCR Kit (Qiagen, 204,156) according to the manufacturer’s instructions.
For HBSS starvation, HepG2 cells were transfected with negative control or MED1 siRNA. 48 h after transfection, the medium was replenished with full DMEM medium or HBSS for 8 h before RNA extraction.
Generation of liver-specific Med1 KD mice
Animal studies were conducted in accordance with the principles and procedures outlined in the National Institutes of Health Guide for the Care and Use of Laboratory Animals and were approved by the Institutional Animal Care and Use Committee (IACUC) at the Duke-National University of Singapore Graduate Medical School. The authors confirm that all experiments were performed in accordance with relevant guidelines and regulations. The authors also confirm that the experimental protocol was approved by Duke-NUS Medical School, Singapore institutional committee.
Male C57BL/6 mice (8 weeks old) were obtained from NUSCARE and housed in hanging polycarbonate cages under a 12-h light/12-h dark cycle at 23°C with normal chow diet (Research Diests, D11112201) and water available ad libitum. Mice (10 weeks old) were injected with Med1 shRNA carried by the Alb (albumin) promoter (Albp)-eGFP-expression adeno-associated virus (AAV8-Albp-eGFP-mMED1-shRNAmir) or control adeno-associated virus (AAV8-ALBp-eGFP-null). 1 × 10¹² GC/mice in 0.25 ml of sterile 0.9% NaCl was injected through the tail vein. Four weeks after the injection, the mice were used for acute fasting and feeding experiment.
Acute fasting and feeding
Feeding after a fast was carried out as described [Citation45]. Briefly, normal chow diet and cage bedding were removed at 5 PM until 10 AM the next day, and food was provided until 5 PM and removed again afterward. At 9 AM the next day, food was provided for 7 control AAV8 injected mice (fed control) and 8 Med1 shRNA injected mice (fed Med1 LKD) only, and other 8 control AAV8 injected mice (fast control) and 8 Med1 shRNA-injected mice (fast Med1 LKD) remained fasted. Six h later, animals were sacrificed in CO2 chambers, blood and livers were collected. Liver tissue was snap frozen in liquid N2 and subsequently used for protein and RNA isolation.
RNA-seq, pathway and ChIP Enrichment Analysis analysis
RNA was isolated from liver tissue using QIAzol (Qiagen, 79,306), followed by clean-up using Invitek Mini Kit (Invitek, 1,032,100,300) following the manufacturer’s protocol. RNA-seq and pathway analysis on pooled samples of each fed (n = 4), fed with Med1 LKD (n = 4), fast, and fast with Med1 LKD (n = 4) were performed by NovogeneAIT Genomics Singapore Pte Ltd. Briefly, Alignments were parsed using Tophat program and differential expressions were determined through DESeq2/edgeR. GO enrichment were implemented by the ClusterProfiler.
The downregulated genes (fast with Med1 LKD vs fast) identified by RNA-seq analysis (235 genes), and qRT-PCR (17 genes) were used for ChIP Enrichment Analysis (ChEA-2016, https://maayanlab.cloud/Enrichr/) [Citation26], which consists transcription factor binding sites profiles from published CHIP-chip, and CHIP-seq studies. Thus, this unbiased approach enabled us to identify putative NRs or TFs that requires Med1 for its transcription under starvation.
Dietary and genetic models of hepatosteatosis
Previously characterized diet-induced NAFLD mice using WDF (western diet [Research Diets, D12079B] with 15% fructose [Sigma-Aldrich, 57–48-7] in the drinking water) feeding was used [Citation34]. Male C57BL/6 J (10 weeks) were fed with normal chow diet (NCD) or WDF for 16 weeks before the animals were sacrificed, and livers were harvested.
Genetic mice model of NAFLD Leprdb/db (db/db) mice were purchased from The Jackson Laboratory (009659). Wild-type C57BL/6 J mice were obtained from NUSCARE (C57BL/6 JInv). Both db/db and C57BL/6 J were fed on NCD for 12 weeks, and sacrificed for tissue harvest.
Biochemical assays
Serum β-hydroxybutyrate and serum triglyceride content were determined using Cayman β-Hydroxybutyrate (Ketone Body) Colorimetric Assay Kit (700,190) and Triglyceride Colorimetric Assay Kit (10,010,303), respectively, according to manufacturer’s instructions. Hepatic lipid from the control and Med1 LKD mice under fed and fast was extracted as follows. 50 mg of liver tissue was homogenized in chloroform:methanol (2:1) mix (20 µl solution per 1 mg tissue) at 4000 rpm for 99 s. 500 µl tissue homogenate was transferred to a 1.5-ml tube, 500 µl of NaCl 0.9% and 500 µl chloroform were added, and vigorously shaken (2000 rpm) for 1 h at 4°C. Centrifuge at 18,800 g for 5 min at room temperature. Two phases will form, with an interphase in the middle. Part of the lower phase (500 µl; lipids and chloroform) was transferred to a new 1.5-ml tube. The solvent was removed by passing nitrogen gas in a in a fume hood. The lipid pellets were dissolved in 50 µl of 2% NP-40 (Sigma-Aldrich, 127,087–87-0) with sonication at amplitude 80 for 5 min. The extracted hepatic lipid samples were used to determine hepatic TG using Cayman Triglyceride Colorimetric Assay kit.
Statistics
Statistical analysis was performed using GraphPad Prism 8. For two experimental groups, statistical significance was determined by Student’s t-test. For three experimental groups, One-way ANOVA was performed followed by Fisher’s Least Significant Difference (LSD) test. For in vivo studies involve fed and fasted animals with or without liver-specific Med1 KD, statistical significance was determined by two-way ANOVA analysis of variance followed Fisher’s LSD multiple comparisons test.
Financial support
This work was supported by Ministry of Health, A*STAR and National Medical Research Council Singapore grants MOH-000306 (MOH-CSASI19may-0001) to PMY; NMRC/OFYIRG/0002/2016 and MOH-000319 (MOH-OFIRG19may-0002) to BKS. Duke-NUS Medical School and Estate of Tan Sri Khoo Teck Puat Khoo Pilot Award (Collaborative) Duke-NUS-KP(Coll)/2018/0007A to JZ.
Supplemental Material
Download MS Word (2.9 MB)Acknowledgments
The authors would like to thank Dr. Winifred WY. Yau, (Cardiovascular and Metabolic Disorders Program, Duke-NUS Graduate Medical School), Dr. Madhulika Tripathi (Stroke and Trial Unit, National Neuroscience Institute Singapore), for their helpful advice and constructive comments. This research was funded by a Duke-NUS Graduate Medical School Faculty Start Up grant to PMY from the NMRC, A*STaR, and Singapore Ministry of Education.
Disclosure statement
The authors have no conflict of interest.
Supplementary material
Supplemental data for this article can be accessed here.
Additional information
Funding
Related Research Data
References
- Kaur J, Debnath J. Autophagy at the crossroads of catabolism and anabolism. Nat Rev Mol Cell Biol. 2015 Aug;16(8):461–472.
- Galluzzi L, Green DR. Autophagy-independent functions of the autophagy machinery. Cell. 2019Jun13; 177(7):1682–1699.
- Abdrakhmanov A, Gogvadze V, Zhivotovsky B. To eat or to die: deciphering selective forms of autophagy. Trends Biochem Sci. 2020 Apr;45(4):347–364.
- Eaton S. Control of mitochondrial beta-oxidation flux. Prog Lipid Res. 2002 May;41(3):197–239.
- Condello M, Pellegrini E, Caraglia M, et al. Targeting autophagy to overcome human diseases. Int J Mol Sci. 2019Feb8 20;(3)3.
- Singh R, Kaushik S, Wang Y, et al. Autophagy regulates lipid metabolism. Nature. 2009Apr30 458;(7242)1131–1135.
- Sinha RA, You SH, Zhou J, et al. Thyroid hormone stimulates hepatic lipid catabolism via activation of autophagy. J Clin Invest. 2012 Jul;122(7):2428–2438.
- Baek SH, Kim KI. Epigenetic control of autophagy: nuclear events gain more attention. Mol Cell. 2017Mar2; 65(5):781–785.
- Fullgrabe J, Klionsky DJ, Joseph B. The return of the nucleus: transcriptional and epigenetic control of autophagy. Nat Rev Mol Cell Biol. 2014 Jan;15(1):65–74.
- Fullgrabe J, Ghislat G, Cho DH, et al. Transcriptional regulation of mammalian autophagy at a glance. J Cell Sci. 2016Aug15 129;(16)3059–3066.
- Shin HJ, Kim H, Oh S, et al. AMPK-SKP2-CARM1 signalling cascade in transcriptional regulation of autophagy. Nature. 2016Jun23 534;(7608)553–557.
- Sardiello M, Palmieri M, Di Ronza A, et al. A gene network regulating lysosomal biogenesis and function. Science. 2009Jul24 325;(5939)473–477.
- Settembre C, Di Malta C, Polito VA, et al. TFEB links autophagy to lysosomal biogenesis. Science. 2011Jun17 332;(6036)1429–1433.
- Settembre C, De Cegli R, Mansueto G, et al. TFEB controls cellular lipid metabolism through a starvation-induced autoregulatory loop. Nat Cell Biol. 2013 Jun;;15(6):647–658.
- Lee JM, Wagner M, Xiao R, et al. Nutrient-sensing nuclear receptors coordinate autophagy. Nature. 2014Dec4 516;(7529)112–115.
- Seok S, Fu T, Choi SE, et al. Transcriptional regulation of autophagy by an FXR-CREB axis. Nature. 2014Dec4 516;(7529)108–111.
- Sinha RA, Singh BK, Zhou J, et al. Thyroid hormone induction of mitochondrial activity is coupled to mitophagy via ROS-AMPK-ULK1 signaling. Autophagy. 2015;11(8):1341–1357.
- Sinha RA, Singh BK, Yen PM. Direct effects of thyroid hormones on hepatic lipid metabolism. Nat Rev Endocrinol. 2018 May;14(5):259–269.
- Chen W, Roeder RG. Mediator-dependent nuclear receptor function. Semin Cell Dev Biol. 2011 Sep;22(7):749–758.
- Yuan CX, Ito M, Fondell JD, et al. The TRAP220 component of a thyroid hormone receptor- associated protein (TRAP) coactivator complex interacts directly with nuclear receptors in a ligand-dependent fashion. Proc Natl Acad Sci U S A. 1998Jul7 95;(14)7939–7944.
- Javitt NB. Hep G2 cells as a resource for metabolic studies: lipoprotein, cholesterol, and bile acids. Faseb J. 1990Feb1; 4(2):161–168.
- Bjorkoy G, Lamark T, Pankiv S, et al. Monitoring autophagic degradation of p62/SQSTM1. Methods Enzymol. 2009;452:181–197.
- Klionsky DJ, Abdalla FC, Abeliovich H, et al. Guidelines for the use and interpretation of assays for monitoring autophagy. Autophagy. 2012 Apr;8(4):445–544.
- Kimura S, Noda T, Yoshimori T. Dissection of the autophagosome maturation process by a novel reporter protein, tandem fluorescent-tagged LC3. Autophagy. 2007 Sep-Oct;3(5):452–460.
- nsSingh BK, Sinha RA, Tripathi M, et al. Thyroid hormone receptor and ERRalpha coordinately regulate mitochondrial fission, mitophagy, biogenesis, and function. Sci Signal. 2018Jun26;11:536.
- Lachmann A, Xu H, Krishnan J, et al. ChEA: transcription factor regulation inferred from integrating genome-wide ChIP-X experiments. Bioinformatics. 2010Oct1 26;(19)2438–2444.
- Zhu Y, Qi C, Jain S, et al. Isolation and characterization of PBP, a protein that interacts with peroxisome proliferator-activated receptor. J Biol Chem. 1997Oct10 272;(41)25500–25506.
- Son YL, Lee YC. Molecular determinants of the interactions between LXR/RXR heterodimers and TRAP220. Biochem Biophys Res Commun. 2009Jul3; 384(3):389–393.
- Kaya Okur HS, Das A, Taylor RN, et al. Roles of estrogen receptor-alpha and the coactivator MED1 during human endometrial decidualization. Mol Endocrinol. 2016 Mar;30(3):302–313.
- Peeters JGC, Picavet LW, Coenen S, et al. Transcriptional and epigenetic profiling of nutrient-deprived cells to identify novel regulators of autophagy. Autophagy. 2019 Jan;15(1):98–112.
- Xiang J, Liu X, Ren J, et al. How does estrogen work on autophagy? Autophagy. 2019 Feb;15(2):197–211.
- Jegga AG, Schneider L, Ouyang X, et al. Systems biology of the autophagy-lysosomal pathway. Autophagy. 2011 May;7(5):477–489.
- The Foxo-autophagy CZ. Axis in health and disease. Trends Endocrinol Metab. 2019 Sep;30(9):658–671.
- Widjaja AA, Singh BK, Adami E, et al. Inhibiting interleukin 11 signaling reduces hepatocyte death and liver fibrosis, inflammation, and steatosis in mouse models of nonalcoholic steatohepatitis. Gastroenterology. 2019 Sep;157(3):777–792 e14.
- Lipinski MM, Hoffman G, Ng A, et al. A genome-wide siRNA screen reveals multiple mTORC1 independent signaling pathways regulating autophagy under normal nutritional conditions. Dev Cell. 2010Jun15 18;(6)1041–1052.
- Settembre C, Zoncu R, Medina DL, et al. A lysosome-to-nucleus signalling mechanism senses and regulates the lysosome via mTOR and TFEB. Embo J. 2012Mar7 31;(5)1095–1108.
- Liu HY, Han J, Cao SY, et al. Hepatic autophagy is suppressed in the presence of insulin resistance and hyperinsulinemia: inhibition of FoxO1-dependent expression of key autophagy genes by insulin. J Biol Chem. 2009 Nov6 284;(45)31484–31492.
- Ezaki J, Matsumoto N, Takeda-Ezaki M, et al. Liver autophagy contributes to the maintenance of blood glucose and amino acid levels. Autophagy. 2011 Jul;7(7):727–736.
- Waskowicz LR, Zhou J, Landau DJ, et al. Bezafibrate induces autophagy and improves hepatic lipid metabolism in glycogen storage disease type Ia. Hum Mol Genet. 2019Jan1 28;(1)143–154.
- Zhou J, Waskowicz LR, Lim A, et al. A liver-specific thyromimetic, VK2809, decreases hepatosteatosis in glycogen storage disease type ia. Thyroid. 2019 Aug;29(8):1158–1167.
- Fondell JD. The mediator complex in thyroid hormone receptor action. Biochim Biophys Acta. 2013 Jul;1830(7):3867–3875.
- Jia Y, Qi C, Kashireddi P, et al. Transcription coactivator PBP, the peroxisome proliferator-activated receptor (PPAR)-binding protein, is required for PPARalpha-regulated gene expression in liver. J Biol Chem. 2004Jun4 279;(23)24427–24434.
- Kabeya Y, Mizushima N, Ueno T, et al. LC3, a mammalian homologue of yeast Apg8p, is localized in autophagosome membranes after processing. Embo J. 2000Nov1 19;(21)5720–5728.
- Zhou J, Farah BL, Sinha RA, et al. Epigallocatechin-3-gallate (EGCG), a green tea polyphenol, stimulates hepatic autophagy and lipid clearance. PLoS One. 2014;9(1):e87161.
- Denis RG, Joly-Amado A, Webber E, et al. Palatability can drive feeding independent of AgRP neurons. Cell Metab. 2015Oct6 22;(4)646–657.