
ABSTRACT
Macroautophagy/autophagy, an evolutionarily conserved process, plays an important role in the regulation of immune inflammation and nervous system homeostasis. However, the exact role and mechanism of autophagy in pain is still unclear. Here, we showed that impaired autophagy flux mainly occurred in astrocytes during the maintenance of neuropathic pain. No matter the stage of neuropathic pain induction or maintenance, activation of autophagy relieved the level of pain, whereas inhibition of autophagy aggravated pain. Moreover, the levels of neuroinflammation and reactive oxygen species (ROS) were increased or decreased following autophagy inhibition or activation. Further study showed that inhibition of autophagy slowed the induction, but increased the maintenance of neuroinflammatory responses, which could be achieved by promoting the binding of TRAF6 (TNF receptor-associated factor 6) to K63 ubiquitinated protein, and increasing the levels of p-MAPK8/JNK (mitogen-activated protein kinase 8) and nuclear factor of kappa light polypeptide gene enhancer in B cells (NFKB/NF-κB). Impaired autophagy also reduced the protective effect of astrocytes on neurons against ROS stress because of the decrease in the level of glutathione released by astrocytes, which could be improved by activating the NFE2L2/NRF2 (nuclear factor, erythroid derived 2, like 2) pathway. We also demonstrated that simultaneous activation of autophagy and the NFE2L2 pathway further relieved pain, compared to activating autophagy alone. Our study provides an underlying mechanism by which autophagy participates in the regulation of neuropathic pain, and a combination of autophagy and NFE2L2 activation may be a new treatment approach for neuropathic pain.
Abbreviation: 3-MA: 3-methyladenine; 8-OHdG: 8-hydroxydeoxy-guanosine; ACTB: actin, beta; AMPAR: alpha-amino-3-hydroxy-5-methyl-4-isoxazole propionate receptor; ATG: autophagy-related; CAMK2/CaMKII: calcium/calmodulin-dependent protein kinase II; CCL7: chemokine (C-C motif) ligand 7; CGAS: cyclic GMP-AMP synthase; CQ: chloroquine; GABA: gamma-aminobutyrate; GCLC: glutamate-cysteine ligase, catalytic subunit; GFAP: glial fibrillary acidic protein; GSH: glutathione; HMOX1/HO-1: heme oxygenase 1; KEAP1: kelch-like ECH-associated protein 1; MAP1LC3/LC3-II: microtubule-associated protein 1 light chain 3 beta (phosphatidylethanolamine-conjugated form); MAPK: mitogen-activated protein kinase; MAPK1/ERK: mitogen-activated protein kinase 1; MMP2: matrix metallopeptidase 2; MAPK8/JNK: mitogen-activated protein kinase 8; MAPK14/p38: mitogen-activated protein kinase 14; NFE2L2/NRF2: nuclear factor, erythroid derived 2, like 2; NFKB/NF-κB: nuclear factor of kappa light polypeptide gene enhancer in B cells; ROS: reactive oxygen species; SLC12A5: solute carrier family 12, member 5; SNL: spinal nerve ligation; TLR4: toll-like receptor 4; TRAF6: TNF receptor-associated factor; TRP: transient receptor potential.
Introduction
Neuropathic pain is one of the most common chronic pains, and arises as a direct consequence of a lesion or disease affecting the somatosensory system. The four major symptoms associated with neuropathic pain are allodynia, hyperalgesia, spontaneous pain, and abnormal sensation [Citation1,Citation2]. Increasing evidence indicates that neuroinflammation and the immune system play important roles in the occurrence and development of neuropathic pain [Citation3,Citation4]. Moreover, reactive oxygen species (ROS) is also one of the key factors in the regulation of pain [Citation5,Citation6]. As neuromodulators, ROS activate CAMK2/CaMKII (calcium/calmodulin-dependent protein kinase II) in glutamatergic neurons in the spinal cord, and ROS also play roles in disinhibition by inhibiting GABAergic interneurons. Furthermore, ROS can activate TRP (transient receptor potential cation channel) family members, especially TRPA1, TRPM2, and TRPV1, which integrate multiple endogenous and exogenous sensory stimuli during pathological pain [Citation7,Citation8]. Although progress has been made on the mechanism of neuropathic pain, an effective treatment is still limited.
Autophagy is an evolutionarily conservative process for the recycling and degradation of cytoplasmic constituents [Citation9]. It plays a fundamental role in cellular development, function, and death [Citation10,Citation11]. Autophagy is known to represent an anti-inflammatory mechanism; it keeps off endovascular damage caused by a variety of endogenous or infectious sources and prevents unnecessary or excessive inflammation [Citation12]. The role of autophagy in inflammatory diseases, cancer and neurodegenerative diseases such as Alzheimer and Parkinson disease has been studied [Citation13]. Autophagy is particularly important in the physiological and pathological processes of the nervous system because neurons are more sensitive to damaged organelles and proteins [Citation14,Citation15]. For example, autophagy deficiency in the adolescent brain can lead to neuropsychiatric disorders by impairing GABAA receptor trafficking [Citation16]. Studies show that targeting specific types and steps of autophagy may be a potential therapeutic strategy for neurodegenerative diseases and cerebral ischemia [Citation17,Citation18]. Increasing evidence also indicates that autophagy plays an important role in the regulation of immune inflammation and ROS production [Citation19,Citation20]. Previous studies have shown that autophagy is closely related to the development of neuropathic pain [Citation21]. In addition, autophagy is associated with neuropathic pain microglia-induced inflammation [Citation22,Citation23]. Although autophagy plays an important role in the pathophysiology of the nervous system and the regulation of immune inflammation, there is little research on the relationship between autophagy and pain, mainly concentrating on the induction stage and the peripheral nervous system [Citation21,Citation24].
Ubiquitin modification is a crucial step in autophagy. It has been reported that in the process of autophagy, TRAF6, BECN1/Beclin1, SQSTM1/p62 and other proteins can be modified by ubiquitin [Citation25]. The ubiquitination of TRAF6 may be essential for NFKB and MAPK (mitogen-activated protein kinase) signaling pathway activation [Citation26]. Previous studies have implicated the TLR4-NFKB signaling pathway plays an important role in the activation of neuroinflammation [Citation27]. PELI1 regulates neuropathic pain and microglia activation by modulating MAPK-NFKB signals in the spinal cord [Citation28]. NFKB has been shown to significantly regulate the expression of a variety of pro-inflammatory factors, such as IL6, leading to neuropathic pain [Citation29], and inhibition of NFKB could reduce pain and inflammation after peripheral nerve injury [Citation30]. In this study, we focused on the changes and cell type location of autophagy flux in the spinal cord during the maintenance of neuropathic pain, and further explored the potential mechanisms of autophagy on pain regulation. The NFE2L2 (nuclear factor, erythroid derived 2, like 2) pathway plays an important role in antioxidant stress [Citation31]. The relevance of NFE2L2 in modulation of acute and chronic neuroinflammation has been reported in several studies [Citation32,Citation33]. Herein, we also studied whether the NFE2L2 pathway participated in the regulation of autophagy on ROS. Our studies showed that activation of autophagy could relieve pain during both neuropathic pain induction and maintenance. Furthermore, compared with activated autophagy alone, simultaneous activation of autophagy and the NFE2L2 pathway had better analgesic effects.
Results
Autophagy flux was impaired and mainly existed in astrocytes during the maintenance of neuropathic pain
In order to evaluate the changes of autophagy flux in the spinal cord during the maintenance of neuropathic pain, a model was established using L5 spinal nerve ligation (SNL) (Fig. S1, Experiment 1). The SNL model is a classical neuropathic pain model, with stable symptoms and lasting at least 8 weeks [Citation34]. As shown in , the thresholds of mechanical allodynia (left) and thermal hyperalgesia (right) were decreased and lasted until 28 d after SNL (P < 0.01). In order to further evaluate the success of the neuropathic pain model, the expression levels of ROS and proinflammatory cytokines were detected in -D. The compound 8-hydroxydeoxy-guanosine (8-OHdG) can label oxidized DNA and reflects the ROS level in cells [Citation35]. Our results showed that the levels of ROS and proinflammatory cytokines IL1B/IL-1β and TNF/TNF-α were significantly increased after SNL (-D) (P < 0.01), which was consistent with previous reports [Citation36–39]. In addition, ROS were mainly located in neurons of spinal cords from the SNL 14 d group ().
Figure 1. Autophagy flux is impaired during the maintenance of neuropathic pain. (A) The thresholds of mechanical allodynia (left) and thermal hyperalgesia (right) after spinal nerve ligation (SNL) were performed before catheter implantation (baseline value, BL), and on days 3, 7, 14 and 28 postsurgery. Each test was repeated 3 times. Data are presented as the mean ± SD. **p < 0.01 vs sham; n = 6 mice/group. (B) Reactive oxygen species (ROS) levels in the dorsal horn (DH) of the spinal cords reflected by 8-hydroxydeoxyguanosine (8-OHdG) immunofluorescence intensity at different time points after SNL. Bar: 50 μm. (C) Statistical results of intensity of 8-OHdG staining in Figure 1B. Data are presented as the mean ± SD. **p < 0.01 vs sham; n = 3 mice/group, 6 slices per mouse were employed. (D) Pro-inflammatory factor levels of IL1B, TNF, CCL7, and MMP2 in spinal cords from a sham 14 d group and SNL 14 d group. **P < 0.01 vs sham; n = 4 mice/group. (E) Double immunofluorescence staining of 8-OHdG (green) with neuron marker RBFOX3/NeuN (red, upper) or astrocyte marker glial fibrillary acidic protein (GFAP, red, down) in the dorsal horn of the spinal cords, SNL 14 d (SNL postoperative 14 d), respectively, n = 4 mice/group, 6 slices per mice were employed. Bar: 50 μm. (F) Western blots of autophagy proteins, including LC3, ATG5, and SQSTM1. ACTB was used as loading control. Data are presented as the mean ± SD (N = 3). *p < 0.05, **p < 0.01 vs Sham; ns: no significance. n = 3 mice/group. (G) The mRNA level of Sqstm1 in spinal cords on day 7, 14 and 28 after SNL. Data are presented as the mean ± SD. ns: no significance; n = 4 mice/group. (H) Representative immunofluorescence images of spinal dorsal cord staining LC3 or SQSTM1 from sham 14 d and SNL 14 d groups. n = 3 mice/group, 6 slices per mouse were employed. Data are presented as the mean ± SD, **p < 0.01 vs Sham
The process of neuropathic pain can be divided into early- and late-phase (induction- and maintenance-phase), and the maintenance-phase refers to more than 7 d after SNL [Citation40]. In order to detect changes in autophagy levels during the maintenance phase of neuropathic pain, the expression levels of autophagy marker proteins, LC3-II (phosphatidylethanolamine-conjugated form of MAP1LC3B [microtubule-associated protein 1 light chain 3 beta]), ATG5 (autophagy related 5), and the autophagy receptor SQSTM1 were determined. Compared with the sham group, LC3-II and ATG5 were decreased while SQSTM1 was increased in spinal cords at 7 d, 14 d, and 28 d after SNL () (P < 0.05), indicating a reduction in autophagy levels during the maintenance phase of neuropathic pain. In order to exclude that the increase of SQSTM1 protein level was caused by increased gene transcription, we further detected the change of Sqstm1 mRNA level. As shown in , the Sqstm1 mRNA level was not significantly changed after SNL (P > 0.05). The fluorescence intensity of LC3 was weakened and SQSTM1 was enhanced ( and S2A-C) (P < 0.01), which was consistent with the western blot results (). Electron microscopy is the gold standard for detecting autophagosomes [Citation41]. The electron microscopic results also showed a decrease in the number of autophagosomes after SNL ( and ) (P < 0.01). To further confirm the impairment of autophagy flux after SNL, autophagy flux was determined in fresh spinal cord slices from SNL 14 d and sham 14 d mice as shown in a previous study [Citation42]. After incubating for 2 h in the absence or presence of chloroquine (CQ), the data demonstrated that LC3-II increased significantly in spinal cord slices from Sham 14 d mice treated with CQ as compared to untreated mice (P < 0.05). However, LC3-II levels in spinal cord slice from SNL 14 d mice with or without CQ treatment were not changed ( and ) (P > 0.05). The above data indicated that autophagy flux in spinal cord was impaired after SNL. Moreover, in spinal cords from the SNL 14 d and corresponding sham group, we found that spinal cord astrocytes were dramatically activated on day 14 after SNL and SQSTM1 was mainly co-labeled with GFAP (glial fibrillary acidic protein) rather than RBFOX3/NeuN antibodies, which indicated impaired autophagy flux was mainly in astrocytes at 14 d after SNL ( and ) (P < 0.01). We also detected the morphological changes of mitochondria in the spinal cord after SNL by electron microscopy. Our results showed that the expansion of mitochondria after SNL, indicating a decrease of the ratio of length to width ( and ) (P < 0.01), which indicated the decrease of mitochondrial function.
Figure 2. Impaired autophagy flux has mainly existed in astrocytes during the maintenance of neuropathic pain. (A,B) Transmission electron microscopic representative images of spinal cord in sham 14 d and SNL 14 d groups. Black arrows are classic autophagosomes with double membranes. N: nucleus; bar: 1 μm. Statistical histogram of the number of autophagosomes in each electron microscopic field. Data are presented as the mean ± SD. **p < 0.01 vs sham; n = 4 mice/group, 6 slices per mouse were employed. (C,D) Western blots of autophagy flux detection of spinal cord in sham 14 d and SNL 14 d groups. CQ: chloroquine. Data are presented as the mean ± SD (N = 3). *p < 0.05; ns: no significance. n = 4 mice/group. (E,F) Double immunofluorescence staining of SQSTM1 with astrocyte marker GFAP or neuron marker RBFOX3/NeuN, respectively. Statistical results of SQSTM1-positive cell type. Data are presented as the mean ± SD (N = 4). **p < 0.01; n = 3 mice/group, 6 slices per mice were employed. Bar: 50 μm. (G,H) Electron microscopic results of autophagosomes (A) and mitochondria (M) in spinal cords at different time points after SNL. The enlarged mitochondria are shown in the lower images. Bar: 1 μm. The statistical results of the number of autophagosomes and the ratio of length to width of mitochondria were shown. Data are presented as the mean ± SD (N = 3). **p < 0.01 vs sham; n = 4 mice/group, 6 slices per mice were employed
Impaired autophagy promoted the maintenance of neuropathic pain by increasing the levels of neuroinflammation and ROS in the spinal cord
In order to explore the effect of autophagy on the maintenance of neuropathic pain, different concentrations of autophagy inhibitor (3-methyladenine; 3-MA) and inducer (rapamycin) were intrathecally injected on day 7 to day 9 after SNL (once a day) (Fig. S1, experiment 2). With the increase in the concentration of 3-MA (, upper) or rapamycin (, down), thresholds of mechanical allodynia significantly decreased and increased, respectively, and lasted more than 7 d (P < 0.05). We achieved similar results by intrathecal injection of 3-MA and rapamycin during neuropathic pain induction (Fig. S3A and S3B) (P < 0.01) (Fig. S1, Experiment 3). As there was no significant difference between the 5 μg group and 50 μg group, we chose 3-MA or rapamycin at 5 μg/mouse/d in the following experiments, and thresholds for mechanical allodynia and hyperalgesia were further retested (Fig S1, experiment 3). Both thresholds of mechanical allodynia (, upper) and thermal hyperalgesia (, down) decreased with the inhibition of autophagy and increased with the activation of autophagy (P < 0.01). On day 14 after SNL, spinal autophagy protein LC3 decreased and SQSTM1 increased after intrathecal injection of 3-MA (5 μg/mouse/d) when compared with the DMSO group, while the opposite trend was observed after rapamycin (5 μg/mouse/d) injection () (P < 0.05), which suggested that intrathecal injection of 3-MA decreased the autophagy level and rapamycin activated it. We further detected the effects of inhibition or activation of autophagy on neuroinflammation and ROS in the spinal cord during neuropathic maintenance. Because CCL7 (chemokine [C-C motif] ligand 7) and MMP2 (matrix metalloprotease-2) are mainly present in astrocytes during the maintenance stage of neuropathic pain [Citation40,Citation43], we also detected the effects of autophagy on the levels of CCL7 and MMP2. Levels of neuroinflammatory factors, including IL1B, TNF, CCL7, and MMP2 were increased by inhibition of autophagy and decreased by induction of autophagy () (P < 0.05). We also noted that autophagy activation decreased the level of ROS in spinal cord neurons (P < 0.01), and autophagy inhibition increased ROS levels (P < 0.05) ( and ). In general, the data indicated the process of autophagy participated in the regulation of neuropathic pain.
Figure 3. Impaired autophagy promotes the maintenance of neuropathic pain. (A) Effects of different concentrations of autophagy inhibitor 3-methyladenine (3-MA, upper) and autophagy activator rapamycin (Rapa, down) on the thresholds of mechanical allodynia during neuropathic pain maintenance. The paw withdrawal threshold tests were carried out one day before spinal nerve ligation surgery (−1), and at days 7, 10, 14, 21, and 28 after SNL. Each test was repeated 3 times. Data are presented as the mean ± SD, n = 6 mice/group. *p < 0.05, **p < 0.01 vs DMSO group. The black arrow represents the time points of intrathecal administration. (B) Effects of autophagy inhibitor 3-MA (5 μg/d/mouse) and autophagy activator Rapa (5 μg/d/mouse) on the thresholds of mechanical allodynia (upper) and thermal hyperalgesia (down) during neuropathic pain maintenance. Each test was repeated 3 times. Data are presented as the mean ± SD, n = 6 mice/group. **p < 0.01; ns: no significance. (C) Western blots analysis of autophagy marker LC3-II and SQSTM1 in spinal cords after treatment with 3-MA or Rapa, SNL14d (SNL postoperative 14 d). The statistical results of protein levels of LC3-II and SQSTM1 were shown. Data are presented as the mean ± SD, n = 3 mice/group. *p < 0.05, **p < 0.01. (D) Effect of autophagy inhibitor 3-MA and autophagy activator Rapa on the level of neuroinflammation in spinal cords, SNL14d. Data are presented as the mean ± SD, n = 4 mice/group. *p < 0.05; **p < 0.01. (E) Double immunofluorescence staining in the spinal dorsal horn of 8-OHdG (green) and RBFOX3/NeuN, a neuronal marker (red) after treatment with 3-MA or Rapa, SNL14d. Bar: 100 μm. (F) The statistical results of ROS levels in spinal cord neurons after inhibition or activation of autophagy in Figure 3E. Data are presented as the mean ± SD. n = 3 mice/group, 6 slices per mouse were employed. *p < 0.05, **p < 0.01
Impairment of autophagy delayed the initiation, but promoted the maintenance of inflammatory responses
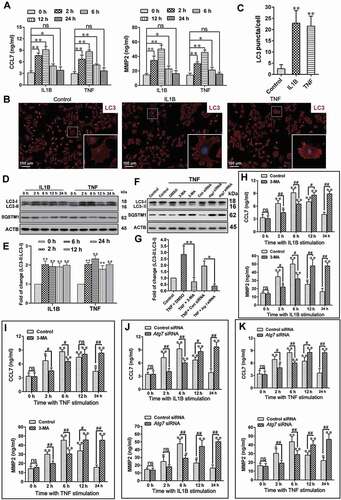
In order to further study the mechanism of autophagy on neuroinflammation regulation, primary astrocytes was cultured (Fig. S4A). IL1B (10 ng/mL) or TNF (10 ng/mL) was used to activate astrocytes, and the levels of neuroinflammation and autophagy were tested. After treatment with IL1B or TNF, levels of CCL7 and MMP2 in the supernatant increased and reached the peak at 6 h () (P < 0.01). In addition, the number of autophagosomes markedly increased ( and ) (P < 0.01), and the autophagy protein level of LC3-II was increased in astrocytes ( and ) (P < 0.05), which was consistent with the results of previous studies [Citation44]. In order to further study the effects of autophagy on CCL7 and MMP2 in astrocytes, we inhibited autophagy with 3-MA and Atg7 (autophagy related 7) siRNA, respectively. After treatment with 3-MA or Atg7 siRNA, the autophagy marker LC3-II decreased and autophagy substrate protein SQSTM1 increased ( and ) (P < 0.05), which indicated autophagy level was inhibited. The results showed that inhibition of autophagy decreased the levels of CCL7 and MMP2 in the supernatant at 2 h and 6 h after stimulation of astrocytes with IL1B or TNF, and were raised at 12 h and 24 h (-K) (P < 0.05). The data above indicated that inhibition of autophagy slowed the initiation of the inflammatory response in astrocytes, but prolonged its maintenance time.
Figure 4. Impairment of autophagy delays the initiation, but promotes the maintenance of the inflammatory response. (A) The levels of inflammatory factors, CCL7 and MMP2, released by primary astrocytes after treatment with IL1B or TNF. Data are presented as the mean ± SD (N = 3). *p < 0.05; **p < 0.01; ns: no significance. (B) Immunofluorescence results of LC3-labeled autophagosomes in primary astrocytes after treatment with IL1B or TNF. The image in the lower right corner is the magnification of the white box. Bar: 100 μm. (C) Statistical results of the number of autophagosomes (LC3 puncta) per astrocyte in Figure 4B. Data are presented as the mean ± SD. **p < 0.01. (D,E) Western blots analysis and statistical result of autophagy marker LC3-II and autophagy receptor SQSTM1 in primary astrocytes after treatment with IL1B or TNF. Data are presented as the mean ± SD (N = 3). *p < 0.05, **p < 0.01 compared with the 0-h group. (F,G) Western blot analysis and statistical result of autophagy marker LC3-II and autophagy receptor SQSTM1 in astrocytes after treatment with autophagy inhibitor 3-MA or Atg7 siRNA. Data are presented as the mean ± SD (N = 3). *p < 0.05, **p < 0.01. (H) The levels of CCL7 (left) and MMP2 (right) released by primary astrocytes after treatment with autophagy inhibitor 3-MA and astrocyte activator IL1B. Data are presented as the mean ± SD (N = 3). *p < 0.05, **p < 0.01 compared with 0 h group; #p < 0.05, ##p < 0.01; ns: no significance. (I) The levels of CCL7 (left) and MMP2 (right) released by primary astrocytes after treatment with autophagy inhibitor 3-MA and astrocyte activator TNF. Data are presented as the mean ± SD (N = 3). *p < 0.05, **p < 0.01 compared with 0 h group; #P < 0.05, ##P < 0.01; ns: no significance. (J) The levels of CCL7 (left) and MMP2 (right) released by primary astrocytes after treatment with autophagy inhibitor Atg7 siRNA and astrocyte activator IL1B. Data are presented as the mean ± SD (N = 3). *p < 0.05, **p < 0.01 compared with 0 h group; #p < 0.05, ##p < 0.01; ns: no significance. (K) The levels of CCL7 (left) and MMP2 (right) released by primary astrocytes after treatment with autophagy inhibitor Atg7 siRNA and astrocyte activator TNF. Data are presented as the mean ± SD (N = 3).*p < 0.05, **p < 0.01 compared with 0 h group; #p < 0.05, ##p < 0.01; ns: no significance
Impaired autophagy increased the levels of neuroinflammatory factors by activating the TRAF6-MAPK8-NFKB signaling pathways
The MAPK and NFKB pathways are the key mechanisms to mediate the production of neuroinflammation. In order to further explore whether autophagy inhibition increased the levels of CCL7 and MMP2 by regulating MAPKs or NFKB pathways at late phase, the phosphorylation levels of MAPK8/JNK (mitogen-activated protein kinase 8), MAPK14/p38 (mitogen-activated protein kinase 14), MAPK1/ERK (mitogen-activated protein kinase 1) and RELA/p65 were detected in primary astrocytes. At 24 h after IL1B or TNF stimulation, the protein expression levels of p-MAPK8 and p-RELA (P < 0.01), but not p-MAPK14 and p-MAPK1 (P > 0.05), were remarkably increased in the Atg7 siRNA group, as compared to the control siRNA group. Moreover, compared with the control siRNA group, the protein expression levels of p-MAPK8 and p-RELA were reduced in the Atg7 siRNA group at 2 h after IL1B or TNF stimulation (-E) (P < 0.05). This was consistent with the results of the expression of CCL7 and MMP2, which suggested that the MAPK8 and NFKB pathways might be involved in neuroinflammatory regulation after inhibition of autophagy. In order to confirm this, specific inhibitors of MAPK8 (SP600125), MAPK14 (SB203580), MAPK1 (U0126), and NFKB (JSH-23) were used [Citation45]. The results showed that inhibition of the MAPK8 or NFKB pathway (P < 0.01), rather than the MAPK14 or MAPK1 pathway (P > 0.05), markedly decreased expression levels of CCL7 and MMP2 after autophagy inhibition ( and ). The data indicated that the MAPK8 and NFKB pathways, not the MAPK14 and MAPK1 pathways, were involved in the neuroinflammatory regulation after autophagy inhibition.
Figure 5. Impaired autophagy increases the levels of neuroinflammatory factors by activating the TRAF6-MAPK8-NFKB signaling pathways. (A) Western blot analysis of p-MAPK8, p-MAPK14, p-MAPK1, and p-RELA in primary astrocytes after treatment with autophagy inhibitor Atg7 siRNA and astrocyte activators IL1B or TNF. (B-E) The statistical results of p-MAPK8 (B), p-RELA (C), p-MAPK14 (D) and p-MAPK1 (E) in Figure 5A. Data are presented as the mean ± SD (N = 3). *p < 0.05, **p < 0.01; ns: no significance. (F,G) Effects of inhibitors (in-) of MAPK8 (SP600125), MAPK14 (SB203580), MAPK1 (U0126), and RELA (JSH-23) on CCL7 (F) and MMP2 (G) release from autophagy impaired astrocytes. Data are presented as the mean ± SD (N = 3). **p < 0.01; ns: no significance. (H) Immunoprecipitation results of K63 ubiquitin proteins and TRAF6 in cultured primary astrocytes after treatment with or without autophagy inhibitor Atg7 siRNA and astrocyte activators IL1B or TNF. (I) Effect of TRAF6 inhibition on levels of p-MAPK8 and p-RELA in autophagy impaired astrocytes after treatment with astrocyte activators IL1B or TNF. (J) The statistical results of ATRAF6, p-MAPK8, and p-RELA in Figure 5I. Data are presented as the mean ± SD (N = 3). **p < 0.01 compared with control (Ctrl) siRNA group. ##p < 0.01 compared with the Atg7 siRNA treated group. (K) Immunoprecipitation results of K63 ubiquitin proteins and TRAF6 in spinal cords after intrathecal injection of autophagy inhibitor 3-MA or activator rapamycin (Rapa) during the maintenance phase of neuropathic pain. (L) Western blots and statistical results of TRAF6 in spinal cord after intrathecal injection of autophagy inhibitor 3-MA or activator rapamycin (Rapa). Data are presented as the mean ± SD (N = 3). n = 4 mice/group. *p < 0.05, **p < 0.01 compared with DMSO group
TRAF6 is a ubiquitin ligase involved in mediating NFKB and MAPKs signaling pathways [Citation46–48]. In order to further explore the regulation mechanism of inhibition of autophagy on neuroinflammation, we detected the levels of TRAF6-binding K63 ubiquitin proteins in cultured astrocytes. The results showed that inhibition of autophagy increased the levels of TRAF6-binding K63 ubiquitin proteins (), while inhibition of TRAF6 expression by Traf6 siRNA treatment reversed the increase of p-MAPK8 and NFKB levels induced by autophagy inhibition ( and ) (P < 0.01). We further tested the levels of TRAF6-binding K63 ubiquitin proteins in spinal cord after intrathecal injection of autophagy inhibitor 3-MA or autophagy activator rapamycin. The results showed that the levels of TRAF6-binding K63 ubiquitin proteins in the spinal cord were increased by inhibiting autophagy and decreased by activating autophagy (). Moreover, the TRAF6 protein level in spinal cord was also decreased by activating autophagy () (P < 0.05). The data indicated that impaired autophagy increased neuroinflammatory levels by promoting the binding level of TRAF6 to K63 ubiquitin protein, and then increasing the levels of p-MAPK8 and NFKB.
Impaired autophagy of astrocytes reduced the protective effect of antioxidant stress on neurons by reducing glutathione (GSH) release, which was improved by activating the NFE2L2 pathway
In order to further explore the regulatory mechanism of autophagy impairment of astrocytes on ROS, we first explored the effect of autophagy on the level of ROS in astrocytes. Intracellular ROS were assessed by measuring the fluorescence intensity of 2,7-dichloro-dihydrofluorescein diacetate (DCFH-DA) using flow cytometry, as described in a previous study [Citation49]. Under conventional conditions, autophagy had no effect on the level of ROS in astrocytes; however, under oxidative stress induced by hydrogen peroxide, activation of autophagy by rapamycin decreased the level of ROS in astrocytes, and inhibition of autophagy by 3-MA increased ROS levels ( and ) (P < 0.01). In order to confirm these results, autophagy was inhibited by Atg7 siRNA, and this treatment achieved parallel results () (P < 0.01). The glutathione system plays an important role in antioxidant stress [Citation50], therefore, we further detected the effect of autophagy on the level of glutathione in astrocytes during oxidative stress. The results showed that under oxidative stress, autophagy activation increased levels of glutathione in astrocytes and culture medium, while autophagy inhibition reduced glutathione levels ( and ) (P < 0.05). By co-culturing of astrocytes and neurons, we further detected the effect of autophagy impairment of astrocytes on the level of ROS in neurons. The results indicated that autophagy impairment of astrocytes increased the level of ROS in neurons during oxidative stress ( and ) (P < 0.01). In addition, autophagy impairment of astrocytes reduced the levels of glutathione in neurons and culture medium under oxidative stress () (P < 0.01). In order to further confirm whether autophagy impairment of astrocytes increased the level of ROS in neurons by reducing the level of glutathione, we added exogenous glutathione to the co-culture medium. The results showed that exogenous glutathione significantly reversed the increase of ROS and the decrease of glutathione in neurons induced by autophagy impairment of astrocytes during oxidative stress () (P < 0.01). These results suggested that autophagy impairment of astrocytes reduced the release of glutathione; thus, reducing the protective effect on neurons.
Figure 6. Impaired autophagy of astrocytes reduces the protective effect of antioxidant stress on neurons by reducing GSH release, which can be improved by activating the NFE2L2 pathway. (A) Effect of inhibition (3-MA) or activation (Rapa) of autophagy on reactive oxygen species (ROS) levels of astrocytes as detected by flow cytometry. (B) Statistical results of ROS levels in astrocytes in Figure 6A. Data are presented as the mean ± SD (N = 4). **p < 0.01; ns: no significance. (C) Statistical results of ROS levels in astrocytes after inhibiting autophagy by Atg7 siRNA. Data are presented as the mean ± SD (N = 4). **p < 0.01; ns: no significance. (D) Levels of glutathione in astrocytes (left) and culture media (right) after inhibition (3-MA) or activation (Rapa) of autophagy. Data are presented as the mean ± SD (N = 4). *p < 0.05, **p < 0.01; ns: no significance. (E) Levels of glutathione in astrocytes (left) and culture media (right) after inhibiting autophagy by Atg7 siRNA. Data are presented as the mean ± SD (N = 4). **p < 0.01; ns: no significance. (F) ROS levels in neurons detected by flow cytometry after co-cultured with control (Con) astrocytes or autophagy impaired (AI) astrocytes. (G) Statistical results of ROS levels in neurons co-cultured with control (Con) astrocytes or autophagy impaired (AI) astrocytes. Data are presented as the mean ± SD (N = 4). **p < 0.01; ns: no significance. (H) Levels of glutathione in neurons (left) and culture media (right) after co-cultured with control (Con) astrocytes or autophagy impaired (AI) astrocytes. Data are presented as the mean ± SD (N = 4).**p < 0.01; ns: no significance. (I) Effects of exogenous glutathione added into culture medium on the levels of glutathione and ROS in neurons co-cultured with control (Con) astrocytes or autophagy impaired (AI) astrocytes. Data are presented as the mean ± SD (N = 4). **p < 0.01. (J) Effect of inhibition (Nfe2l2 siRNA) or activation (Keap1 siRNA) of NFE2L2 on glutathione levels released by autophagy-activated astrocytes. Data are presented as the mean ± SD (N = 4).*p < 0.05, **p < 0.01; ns: no significance. (K) Effect of inhibition (Nfe2l2 siRNA) or activation (Keap1 siRNA) of NFE2L2 on glutathione levels released by autophagy impaired astrocytes. Data are presented as the mean ± SD (N = 4). **p < 0.01. (L) Effect of inhibition (Nfe2l2 siRNA) or activation (Keap1 siRNA) of NFE2L2 on ROS levels in neurons co-cultured with autophagy impaired astrocytes. Data are presented as the mean ± SD (N = 4). **p < 0.01; ns: no significance. (M) Effect of inhibition (Nfe2l2 siRNA) or activation (Keap1 siRNA) of NFE2L2 on glutathione levels in neurons (left) and culture media (right) after co-cultured with autophagy impaired astrocytes. Data are presented as the mean ± SD (N = 4). *p < 0.05, **p < 0.01; ns: no significance
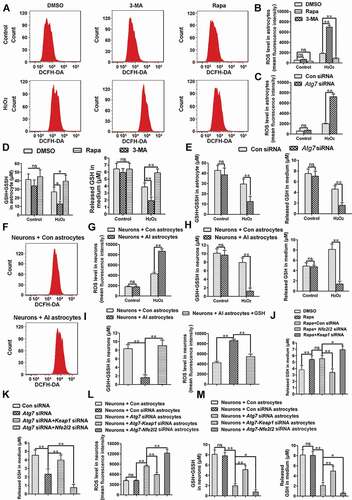
NFE2L2 plays a pivotal role in the regulation of the antioxidant response [Citation51]. We further studied whether activation of the NFE2L2 pathway in astrocytes decreased the increase of ROS in neurons induced by autophagy impairment of astrocytes during oxidative stress. Under normal conditions, NFE2L2 levels were low in cells because of KEAP1 (kelch-like ECH-associated protein 1)-mediated proteasomal degradation; the NFE2L2 pathway can be activated by inhibition of KEAP1 [Citation52]. We inhibited or activated the NFE2L2 pathway through Nfe2l2 siRNA and Keap1 siRNA, respectively. When autophagy of astrocytes was activated using rapamycin, activation of the NRF2 pathway increased the level of glutathione in the medium, and inhibition of the NFE2L2 pathway decreased glutathione during oxidative stress () (P < 0.05). Moreover, we achieved similar results after inhibiting autophagy with Atg7 siRNA during oxidative stress () (P < 0.01). We further examined the effects of activation or inhibition of the astrocyte NFE2L2 pathway on the level of ROS in neurons. The results showed that activation of the astrocyte NFE2L2 pathway reduced the increase of ROS in neurons caused by autophagy impairment of astrocytes during oxidative stress () (P < 0.01). Moreover, activation of the astrocyte NFE2L2 pathway also increased the level of glutathione in neurons and medium () (P < 0.05). The results indicated that activation of the astrocyte NFE2L2 pathway improved the reduced protective effect of autophagy- impaired astrocytes on neurons during oxidative stress.
Simultaneous activation of autophagy and the NFE2L2 pathway further relieved pain as compared to activating autophagy alone
Expression of NFE2L2 protein was significantly increased with time dependence, and the peak was reached 14 days after SNL ( and ) (P < 0.01). Moreover, compared with the Sham 14 d group, NFE2L2 target genes, Gclc (glutamate-cysteine ligase, catalytic subunit), Hmox1/HO-1 (heme oxygenase 1), and Nqo1 (NAD[P]H dehydrogenase, quinone 1) [Citation53,Citation54] expressions were also increased significantly in the SNL 14 d group () (P < 0.01). These results indicated activation of the NFE2L2 pathway after NSL. In order to further verify the above conclusion, nuclear transfer level of NFE2L2 was detected. The results showed that the number of NFE2L2 nucleation was significantly increased () in SNL 14-d group. In addition, NFE2L2 was mostly co-labeled with astrocyte marker GFAP ( and ) (P < 0.01), which indicated the increase of NFE2L2 was mainly in astrocytes at 14 d after SNL.
Figure 7. Simultaneous activation of autophagy and the NFE2L2 pathway can further relieve pain, compared to activating autophagy alone. (A,B) Western blot analysis and statistical results of NFE2L2 in spinal cord after spinal nerve ligation (SNL). Data are presented as the mean ± SD (N = 3), n = 4 mice/group. **p < 0.01, ***p < 0.001; ns: no significance. (C) Expression levels of NFE2L2 target genes Gclc, Hmox1, and Nqo1 in spinal cords from the sham 14 d group and SNL 14 d group. Data are presented as the mean ± SD, n = 4 mice/group. **p < 0.01 vs sham group. (D) Immunofluorescence representative images of NFE2L2 protein entering the nucleus. Bar: 50 μm; n = 4 mice/group, 6 slices per mice were employed. (E,F) Double immunofluorescence staining of NFE2L2 with neuron marker RBFOX3/NeuN or astrocyte marker GFAP, respectively. Bar: 100 μm. Data are presented as the mean ± SD, n = 3 mice/group, 6 slices per mice were employed. **p < 0.01. (G,H) Western blot analysis and statistical results of NFE2L2 protein in spinal cord after intrathecal injection of autophagy inhibitor 3-MA or activator rapamycin (Rapa) during the maintenance phase of NPP. Data are presented as the mean ± SD (N = 3), n = 3 mice/group. *p < 0.05, **p < 0.01. (I) Expression levels of NFE2L2 target genes Gclc and Hmox1 in spinal cords after intrathecal injection of autophagy inhibitor 3-MA or activator Rapa. Data are presented as the mean ± SD, n = 4 mice/group. *p < 0.05, **p < 0.01. (J,K) Western blot and statistical results of KEAP1 and NFE2L2 in spinal cord after intrathecal injection of Rapa or AAV containing Keap1 shRNA. Data are presented as the mean ± SD from 3 (N = 3), n = 3 mice/group. **p < 0.01; ##p < 0.01; ns: no significance. (L) Expression levels of NFE2L2 target genes Gclc and Hmox1 in spinal cords after intrathecal injection of Rapa or AAV containing Keap1 shRNA. Data are presented as the mean ± SD, n = 4 mice/group. **p < 0.01; ns: no significance. (M,N) The thresholds of mechanical allodynia and thermal hyperalgesia after intrathecal injection of Rapa or AAV containing Keap1 shRNA. Data are presented as the mean ± SD, n = 6 mice/group. **p < 0.01; ##p < 0.01; ns: no significance. (O) Change of reactive oxygen species in spinal cord neurons after intrathecal injection of Rapa or AAV containing Keap1 shRNA. Bar: 100 μm; n = 4 mice/group, 6 slices per mouse were employed
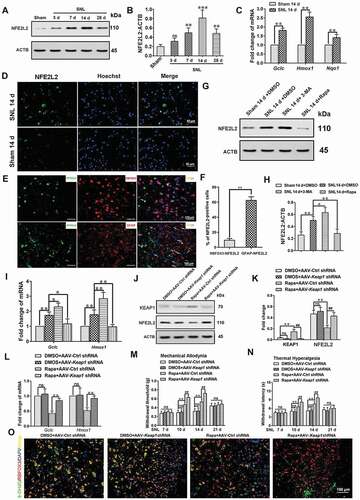
We further examined the effect of activation or inhibition of autophagy on the expression of NFE2L2 during the maintenance phase of neuropathic pain. The results showed that the expression of NFE2L2 protein was significantly increased after inhibition of autophagy and decreased after activation of autophagy ( and ) (P < 0.05). Moreover, NFE2L2 target genes, Gclc and Hmox1, expressions were also increased after autophagy inhibition and decreased after autophagy activation () (P < 0.05). This suggested that during the maintenance of neuropathic pain, the inhibition of autophagy led to the upregulation of the NFE2L2 pathway, while activation of autophagy led to the downregulation of the NFE2L2 pathway. In order to further study whether simultaneous activation of both NFE2L2 and autophagy had stronger analgesic effects, we activated the NFE2L2 pathway by intrathecal injection of adeno-associated virus (AAV)-Keap1 shRNA. Intrathecal injection of AAV-Keap1 shRNA decreased the levels of KEAP1 and increased the levels of NFE2L2 and its target genes in the rapamycin-treated group (P < 0.01), but had no effect on the DMSO-treated group (-L) (P > 0.05). Compared with activating autophagy alone, simultaneous activation of autophagy and the NFE2L2 pathway further increased the thresholds of mechanical allodynia and thermal hyperalgesia ( and ) (P < 0.01). Combination of autophagy and NFE2L2 activation further decreased the ROS levels in spinal cord neurons ().
Impaired autophagy activated NFE2L2 through the SQSTM1-KEAP1 pathway in astrocytes
In order to further study the mechanism of autophagy regulation of NFE2L2, autophagy of primary astrocytes was inhibited by Atg7 siRNA. Compared with the control group, inhibition of autophagy increased the level of nuclear NFE2L2 in astrocytes after TNF or hydrogen peroxide stimulation (-C) (P < 0.05). We also used 3-MA or rapamycin to inhibit or activate autophagy, and then detected the expression levels of NFE2L2 proteins in astrocytes after hydrogen peroxide stimulation. The results showed that compared with the DMSO treatment group, inhibition of autophagy upregulated NFE2L2 protein levels, while activation of autophagy downregulated NFE2L2 protein levels in astrocytes ( and ) (P < 0.01). Although studies have shown that SQSTM1 phosphorylation can activate the KEAP1-NFE2L2 pathway in hepatocellular carcinoma cells [Citation55,Citation56], it is not clear whether autophagy in astrocytes regulates NFE2L2 through SQSTM1. Our results showed that the inhibition of SQSTM1 protein in astrocytes by Sqstm1 siRNA could reverse the activation of the NFE2L2 pathway induced by inhibition of autophagy during oxidative stress ( and ) (P < 0.01). This could be mediated by KEAP1 because simultaneous inhibition of autophagy and SQSTM1 increased the level of KEAP1 compared with the inhibition of autophagy alone ( and ) (P < 0.05). These results suggested that autophagy impairment of astrocytes upregulated the level of NFE2L2 through the SQSTM1-KEAP1 pathway.
Figure 8. Impaired autophagy can activate NFE2L2 through the SQSTM1-KEAP1 pathway in astrocytes. (A) Western blot analysis of nuclear NFE2L2 protein levels in astrocytes after treatment with autophagy inhibitor Atg7 siRNA and astrocyte activators TNF or H2O2. (B,C) Statistical results of nuclear NFE2L2 protein after treatment with TNF (B) or H2O2 (C) in Fig. 8A. Data are presented as the mean ± SD (N = 3). *p < 0.05, **p < 0.01; ns: no significance. (D,E) Western blot analysis (D) and statistical results (E) of the protein levels of LC3-II, SQSTM1, and NFE2L2 in astrocytes after treatment with H2O2 or 3-MA or rapamycin (Rapa). Data are presented as the mean ± SD (N = 3). *p < 0.05, **p < 0.01. (F) Effect of inhibition of SQSTM1 on the protein levels of KEAP1 and nucleus NFE2L2 in autophagy impaired astrocytes. (G) Statistical results of the protein levels of SQSTM1, KEAP1, and NFE2L2 in Fig. 8 F. Data are presented as the mean ± SD (N = 3). *p < 0.01, **p < 0.01; ns: no significance
Discussion
Autophagy is associated with a variety of human diseases, especially neurodegeneration, inflammatory disorders, and cancer [Citation57]. Our previous study using a model of lung ischemia-reperfusion injury showed that autophagy induced by damage-associated molecules participated in the regulation of inflammatory response [Citation45]. In the present study, we explored the changes of autophagy flux in a neuropathic pain model and the mechanism of autophagy regulation of pain. Although several studies have observed the changes of autophagy proteins in neuropathic pain [Citation21,Citation58], they were mainly concentrated in Schwann cells in the peripheral nervous system or at the induction phase of neuropathic pain. However, due to the lack of effective treatment, most patients are in the maintenance stage of neuropathic pain rather than the induction stage. Herein, we found that autophagy flux impairment was mainly located in spinal cord astrocytes during the maintenance phase of neuropathic pain. Astrocytes are the largest number of cells in the central nervous system and play a key role in maintenance of central sensitization of neuropathic pain [Citation59,Citation60]. Furthermore, we also showed that intrathecal injection of autophagy inhibitor 3-MA aggravated pain, and intrathecal injection of autophagy inducer rapamycin relieved pain, whether in the neuropathic pain induction stage or maintenance stage. Although current autophagy inhibitors such as 3-MA and autophagy inducers such as rapamycin were limited by issues of selectivity and potency, our data suggested autophagy impairment of astrocytes played an important role in the regulation of neuropathic pain maintenance.
Immune inflammation is closely linked with neuropathic pain [Citation61–63]. In agreement with previous studies, we observed that not only proinflammatory cytokines TNF and IL1B, but also chemokines CCL7 and MMP2 (matrix metallopeptidase 2) were also found to increase during the maintenance phase of neuropathic pain [Citation40,Citation45,Citation61]. Additionally, we found that inhibition of autophagy increased the levels of TNF, IL1B, CCL7, and MMP2, and activation of autophagy decreased these levels. As previous studies showed that CCL7 and MMP2 were mainly expressed in astrocytes [Citation40,Citation43], our results suggested that impaired autophagy in astrocytes aggravated neuropathic pain through an increase in neuroinflammation. We showed that impairment of autophagy in primary astrocytes decreased levels of CCL7 and MMP2 at an early phase after stimulation with proinflammatory factors, but increased the levels of CCL7 and MMP2 at late phase. This indicated impaired autophagy delayed the initiation, but promoted the maintenance of neuroinflammation. This result was not in agreement with other studies in which inhibition of autophagy increased inflammatory responses [Citation64,Citation65]. However, we found that impairment of autophagy in astrocytes decreased the protein levels of p-MAPK8, p-RELA, and p-MAPK14, but not p-MAPK1 in the early phase after stimulation with proinflammatory factors, while impairment of autophagy increased the protein levels of p-MAPK8 and p-RELA rather than p-MAPK14 or p-MAPK1 in the late phase. These results indicated that autophagy impairment of astrocytes had different regulatory mechanisms at different stages of inflammatory stimulation. Moreover, we observed that the increased levels of CCL7 and MMP2 could be reversed by specific inhibitors of the MAPK8 pathway and NFKB pathways, but not the MAPK14 pathway or MAPK1 pathway. The results suggested autophagy impairment of astrocytes promoted the maintenance of neuroinflammation by continuously activating the MAPK8 and NFKB pathways. Most importantly, our findings supported the critical role of impairment of autophagy in increasing the level of neuroinflammation. Furthermore, we also proved that impaired autophagy in astrocytes increased neuroinflammatory levels by promoting the binding level of TRAF6 to K63 ubiquitin protein, and then increasing the levels of p-MAPK8 and NFKB.
Increased ROS levels can aggravate pain by increasing neuronal excitability [Citation7]. We demonstrated that impaired autophagy of astrocytes increased ROS levels in neurons during the maintenance of neuropathic pain. This was at least partly due to the decrease in the level of glutathione released by astrocytes after autophagy impairment, which may not be enough to maintain the demand for glutathione in the highly active state of neurons. Because highly activated neurons have a higher demand for glutathione, this requires coordinated transcription to increase the production capacity of the glutathione system [Citation50]. We showed that the levels of ROS were upregulated and the levels of glutathione were downregulated in neurons co-cultured with autophagy impaired astrocytes during oxidative stress. Moreover, the addition of exogenous glutathione to the culture medium reversed the effects. Our results also showed that autophagy impairment led to a decrease in the level of glutathione release from primary astrocytes during oxidative stress when cultured alone or co-cultured with neurons. This may be due to an increase in glutathione consumption rather than a decrease in glutathione production during autophagy injury. We found that impairment of autophagy in astrocytes upregulated NFE2L2, a key protein playing an important role in increasing glutathione levels and antioxidant stress [Citation50,Citation51], during oxidative stress. In addition, we found autophagy impairment also increased the levels of ROS in primary astrocytes during oxidative stress, which may be related to the dysfunction of mitochondria. A previous study has shown that autophagy is essential for regenerating astrocyte mitochondrial networks during inflammation [Citation66].
NFE2L2 (nuclear factor, erythroid derived 2, like 2) binds to the promoter antioxidant reaction element (ARE) and is a key regulator of intracellular antioxidant enzymes. It participates in the elimination of ROS and the prevention of cell damage caused by oxidative stress [Citation2]. In addition, NFE2L2 has also been shown to regulate cell redox balance and is primarily involved in anti-inflammatory reactions [Citation67]. In this paper, we found that during the maintenance stage of neuropathic pain, the NFE2L2 pathway of spinal cord astrocytes was activated, which could be a compensatory behavior after autophagy impairment. There may be many responsible factors, including ROS [Citation68,Citation69], but we have shown that autophagy impairment in astrocytes activated the NFE2L2 pathway through SQSTM1-KEAP1. During the maintenance phase of neuropathic pain, increased autophagy disintegrate activation of the NFE2L2 pathway. Therefore, we further studied whether the simultaneous activation of autophagy and the NFE2L2 pathway had a stronger analgesic effect. Our results showed that compared with activating autophagy alone, synchronized activation of autophagy and the NFE2L2 pathway further increased the thresholds of mechanical allodynia and thermal hyperalgesia. We further demonstrated that activation of autophagy and the NFE2L2 pathway reduced the level ROS in spinal cord neurons during the maintenance of neuropathic pain compared with the activation of autophagy alone.
A strong relationship between TRAF6 and autophagy has been reported in the literature. TRAF6 ubiquitin-ligase activity was indispensable in the initiation and function of cellular autophagy. TRAF6 plays a central role in NFKB activation and autophagy activation induced by TLR4 (toll-like receptor 4) signaling [Citation70]. In this study, we proved that activation of autophagy reduces TRAF6 protein levels in the spinal cord. Prior studies have noted the importance of TRAF6 as a potential target in neuroinflammation. TRAF6 upregulation binds and ubiquitinates RAC1 directly, which promotes neuron death through neuroinflammation and neuro-oxidative signals [Citation71]. The TRAF6-MAPK8-MAPK14-ATF2 axis has been shown to promote inflammatory activation of microglia cells and aggravate neuronal injury in the brain [Citation72]. Atorvastatin may protect OGD-induced inflammatory damage of BV-2 microglia cells and hippocampal neurons by inhibiting the TLR4-TRAF6-NFKB pathway [Citation73]. The data in this study indicated that impaired autophagy could increase neuroinflammatory levels by promoting the binding level of TRAF6 to K63 ubiquitin protein, and then increasing the levels of p-MAPK8 and NFKB. Prior studies have underlined the importance of the role of autophagy in neurotrauma. Previous studies have also shown that markers inhibiting autophagy flux after injury are related to the aggravation of ER stress, which suggests a connection between autophagy inhibition and ER stress-mediated neuronal cell death [Citation42,Citation74]. Despite these promising results, questions remain. The mechanism of autophagy impairment in astrocytes during the maintenance phase of neuropathic pain is not yet clear, but studies have given us some clues. A study has shown that activation of TLR4 suppresses autophagy through inhibition of FOXO3 in microglia [Citation75]. Moreover, increased Mir195 in microglia inhibits autophagy by targeting ATG14 [Citation58]. Therefore, whether some molecules inhibit the expression or continuous inflammatory stimulation leads to the depletion of autophagy proteins in astrocytes during neuropathic pain needs to be studied to further regulate autophagy and treat neuropathic pain more effectively.
In summary, we found that impaired autophagy increased the level of neuroinflammation through the TRAF6-MAPK8-NFKB pathway and reduced the protective effect of astrocytes on antioxidant stress in neurons by reducing the release of glutathione; thus, promoting the maintenance of neuropathic pain. More importantly, we found that activated autophagy downregulated the activity of antioxidant stress key protein NFE2L2 and its target genes, and synergistic activation of autophagy and the NFE2L2 pathway had stronger analgesic effects than activation of autophagy alone. Our research suggested that the combination of autophagy and NFE2L2 activation may be an approach for the treatment of neuropathic pain.
Materials and methods
Contact for reagents and resource sharing.
Further information and requests for resources and reagents should be directed to and will be fulfilled by the Lead Contact, Hongbin Yuan ([email protected]).
Animals and reagents
Male C57BL/6 J mice, 8- to 10-week-old, were purchased from the Laboratory Animal Center of the Second Military Medical University (Shanghai, China). Mice were maintained in an environment with a controlled 12-h light/dark cycle at 22–24°C. All animals received food and water ad libitum. All animal experiments were reviewed and approved by the Institutional Animal Care and Use Committee of the Second Military Medical University and followed the guidelines for the study of pain in awake animals established by the International Association for the Study of Pain. All reagent information is shown in . The experimental timeline of this study was shown in Fig. S1.
Table 1. Primers used in this study
Table 2. Reagents used in this study
Preparation of L5 spinal nerve ligation (SNL)
The SNL model was utilized for induce neuropathic pain. After anesthesia with sodium pentobarbital (50 mg/kg body weight, i.p.) and preoperative skin preparation, dermotomy was carried out. The left paraspinal muscles were bluntly separated at the L5-L6 levels and the L6 transverse process was removed carefully. Isolation and tight ligation of the L5 spinal nerve was with 4–0 silk threads. Then, the muscle and skin were sutured for completion of the operation. For the sham group, the L5 spinal nerve was isolated but without ligation.
Behavioral tests
Animal were habituated to the test environment for two days prior to behavioral testing. Mechanical paw withdrawal thresholds were evaluated by measuring the withdrawal response after stimulation of the left sole with an electric Von Frey apparatus (Stoelting, Wood Dale, IL, USA), and were recorded in g. Thermal hyperalgesia was tested using a Hargreaves radiant heat apparatus (IITC Life Science, Woodland Hills, CA, USA), and the radiant heat source was adjusted to produce a baseline latency between 11–14 s. A cutoff point was set at 20 s to avoid tissue damage. The typical positive reaction was shown as dodging, shaking, or flinching. All behavioral tests were performed between 11 a.m. and 3 p.m., and all measurements were repeated three times for each mouse. The baseline pain threshold was obtained 1 d before the operation, and the remaining testing time was 3 d, 7 d, 14 d, and 28 d after the operation and 3 d, 7 d, and 14 d after the intraoperative drug injection, so as to evaluate the surgical effect and the effect of the drug on the pain threshold. Behavioral investigators are blind to the conditions under which drugs are administered.
Intrathecal injection
After anesthesia, mice were bent at the waist. The rapamycin (autophagy inducer; Merck Millipore, 553,210; 50, 5.0 and 0.5 µg/d/mouse) and 3-MA (autophagy inhibitor; Merck Millipore, 189,490; 50, 5.0 and 0.5 µg/d/mouse) were intrathecally administered 10 µl on postoperative day 7, 8 and 9 during the maintenance stage of neuropathic pain and on postoperative day 0, 1 and 2 in the early stages of neuropathic pain, respectively. Adeno-associated virus (AVV) vector was injected into the cerebrospinal fluid through the L5-L6 lumbar intervertebral space using a 10 μL microsyringe. The operation was considered as successful if the mice showed a slight tail flick reaction.
Tissue collection
After completion of the behavioral tests, the mice were killed by administering an overdose of sodium pentobarbital solution in each group, the ipsilateral part of the L4-L5 segment of the spinal cord was taken and stored at −80°C for further western blot analysis. For immunofluorescence, mice were perfused through the aorta with 0.01 M phosphate-buffered saline (PBS, Aspen, AS1025, pH 7.2–7.4, 4°C), followed by 4% paraformaldehyde (PFA). L4-L5 spinal cord segments were removed and post-fixed in 4% PFA overnight at 4°C. Then, the spinal cords were removed to a 20% sucrose (Fisher Scientific, BP220–212) solution in 0.1 M PBS, followed by 30% sucrose solution.
Primary astrocyte culture and treatment
As described previously, astrocytes were acquired from neonatal mice (P2-3). The mixed cells were plated into culture flasks, which were coated with poly-L-lysine, and cultured in DMEM/F12 (Gibco-BRL, 1,132,003) containing 10% fetal bovine serum (FBS) (Gibco-BRL, 41 F4234K). The medium was changed every 2–3 d, and 6–10 d later, the cultures were put in a shaker (2.5 g, 37°C, 5% CO2) overnight to remove microglia and oligodendrocyte lineage cells. The astrocytes were harvested and plated (1 × 10⁵/cm2) onto coverslips in 12-well plates and cultured in a moist incubator at 37°C, 5% CO2. After 3–4 d, astrocytes were stimulated with 10 ng/mL IL1B (Merck Millipore, SRP8033) or TNF (Merck Millipore, T7539) for 0, 2, 6, 12, and 24 h. Astrocytes or supernatants were harvested for further detection. For autophagy flux detection, chloroquine (Merck Millipore, C6628) was added into the medium 2 h before cell collection. The 3-MA or DMSO was added in the medium 2 h before stimulation with IL1B or TNF, and Keap1 siRNA, Atg7 siRNA, or control siRNA was added to the medium 24 h before cell stimulation. Inhibitors of MAPKs or the NFKB pathway was added into the medium 3 h before cell collection.
Indirect co-culture of neurons and astrocytes
The classical Transwell chamber model (corning, 3460–1) was used to co-culture neurons and astrocytes indirectly. Specific methods were improved with reference to the relevant literature [Citation76]. Neurons were obtained from neonatal mice (P1), and 1 μΜ AraC (Sigma-Aldrich, C6645) was used at the 3rd day after culture in order to prevent glial cell proliferation. At day 14 of neuronal culture, autophagy impaired or control astrocytes were placed in the Transwell. Three days later, experiments were performed. After 24 h of hydrogen peroxide stimulation, neurons or culture media were collected, and then levels of ROS and glutathione were measured.
Electron microscopy
On the 14 day postoperation, SNL or sham-operated mice were anesthesia with sodium pentobarbital, the L5 segment of the ipsilateral spinal cord (1 mm3) was fixed in glutaraldehyde solution, followed by rinsing with 0.1 M PBS three times. Then, the spinal cord was fixed with 1% serum-starving solution (DMEM supplemented with 2 mM L-glutamine, 1% penicillin-streptomycin (Sigma-Aldrich, 11,074,440,001), and 0.1% FBS), and followed by rinsing with 0.1 M PBS. After gradient dehydration with ethanol solution, the spinal cord was treated with acetone for 20 min. The tissue was dehydrated through a graded series of acetone dilutions (Sigma-Aldrich, 179,124), cleared with propylene oxide (Sigma-Aldrich, 82,320), infiltrated overnight, followed by polymerization at 70°C overnight with a heating polymerization apparatus. Transverse spinal cord sections (50–70 nm) were acquired using an ultrathin slice instrument (EM UC 7; Leica, Wetzlar, Germany). The tissue samples were stained with uranyl acetate and 50% ethanol saturated solution for 15 min to 1 h. Finally, the samples were observed and photographed with a Hitachi H-7650 (Hitachi, San Jose, CA, USA) transmission electron microscope.
Western blot analysis
Spinal cord tissues or treated astrocytes were homogenized in lysis buffer (Cell Signaling Technology, 9803) containing protease inhibitor and phosphate inhibitor (Merck Millipore, 539,131). Triton X-100 (Sigma-Aldrich, X100) was added to the homogenates and the final concentration was 1%. Then, the homogenates were incubated on ice for 30 min, and centrifuged at 20,000 × g for 15 min. The protein concentration was quantified with a BCA protein assay kit (Pierce, 23,227). The supernatant was separated on a 12% SDS-polyacrylamide gel and then wet electro-transferred to a 0.4-μm polyvinylidene fluoride (PVDF) membrane (Merck Millipore, IPFL00005). After blocking with 10% evaporated skimmed milk (Sangon Biotech, C520013) at room temperature for 1 h on a rocker, the PVDF membrane was incubated overnight at 4°C with anti-LC3 (1:1000; Abcam, ab51520), anti-SQSTM1/p62 (1:2,000; Abcam, ab56416), anti-NFE2L2 (1:1,000; Abcam, ab137550), anti-KEAP1 (1:500; Abcam, ab119403), anti-p-MAPK8 (1:2,000; Cell Signaling Technology, 9255), anti-p-MAPK14 (1:1,000; Cell Signaling Technology, 9215), anti-p-MAPK1 (1:2,000; Cell Signaling Technology, 9106), anti-p-RELA (1:1,000; Cell Signaling Technology, 3033), anti-K63-linkage-specific polyubiquitin (1:1,000; Cell Signaling Technology, 12,930) or anti-TRAF6 (1:1,000; Cell Signaling Technology, 8028). Blots were rinsed with 0.01 M PBS three times for 10 min each and incubated in the secondary antibody conjugated with horseradish peroxidase (1:1,000; Sigma-Aldrich, 18–160) for 1 h. An enhanced chemiluminescence (ECL) detection system (Pierce, PI80196) was used to measure the target proteins. The target proteins were normalized with a monoclonal anti-ACTB/β-actin antibody (1:2000; Abcam, ab20272). The signal intensity was detected with ImageJ software (NIH, Bethesda, MD, USA).
Immunoprecipitation
After astrocytes or spinal cord tissue were lysed, immunoprecipitation was performed as described in our previous study [Citation45]. One μg TRAF6 antibody was added to the cell lysates and incubated at 4°C overnight. Ten μL protein A + G agarose beads (Beyotime, P2028) were washed with lytic buffer three times followed by centrifuging at 3,000 × g for 3 min each time. Then the pretreated agarose beads were added to the cell lysate incubated with TRAF6 antibody (1:) at 4°C for 2–4 h. Agarose beads were obtained by centrifugation at a rate of 3,000 × g for 3 min, and then cleared with cell lysis buffer three times. Agarose beads were added into 15 μL 2 × SDS sample buffer, and boiled for 5 min. Then the K63 ubiquitin proteins were analyzed according to the above-described western blot steps.
mRNA level assay
Total RNA was isolated from spinal cord tissues of SNL and sham-operated mice or astrocytes with TRIzol reagent (Invitrogen, 15,596–026) and RNA concentration was measured spectrophotometrically. The cDNA synthesis was carried out using a RevertAid First Strand cDNA Synthesis Kit (Fermentas, K1622) according to the manufacturer’s instructions. Analysis was performed using RT-PCR with gene-specific primers () on a MyiQTM apparatus (Bio-Rad, Hercules, CA, USA) with SYBR Green Real-time PCR Master Mix (Toyobo Biotech, QPK-201). Amplification of target cDNA was normalized to Gapdh expression. Relative levels of target mRNA expression were calculated using the 2−ΔΔCt method.
Enzyme-linked immunosorbent assay (ELISA)
Total IL1B, TNF, CCL7 and MMP2 levels in spinal cord tissues or astrocyte supernatants were measured by ELISA Kits (SRP8033 for IL1B and T7539 for TNF, Merck Millipore; ab254516 for MMP2 and ab205571 for CCL7, Abcam). Spinal cord tissues were homogenized with lysis buffer including the protease inhibitor. Then, a BCA Protein Assay Kit (Pierce, #23,227) was used to detect protein concentrations. ELISAs were performed and the standard curve was depicted according to the manufacturer’s protocol.
Fluorescence and confocal microscopy analyses
Transverse sections (20 μm) of spinal cord tissues were mounted onto Thermo Fisher Scientific super frost plus glass slides (VWR International, MENZJ1800AMNZ). For cell samples, astrocytes were fixed with 2% PFA for 1 h for further study. Sections or astrocytes were washed with 0.01 M PBS three times and incubated with specific primary antibodies at 4°C overnight, as follows: rabbit polyclonal to LC3B (1:200; Novus Biologicals, NB600-1384), rabbit polyclonal to SQSTM1 (1:200; Abcam, ab91526), mouse monoclonal to 8-OHdG (1:200; Abcam, ab62623), rabbit polyclonal to NFE2L2 (1:200; Abcam, ab91526), chicken polyclonal to RBFOX3/NeuN (1:600; Abcam, ab134014) and chicken polyclonal to GFAP (1:500, Abcam, ab4674). After washing three times, sections or astrocytes were then incubated with the secondary antibodies, including donkey anti-rabbit IgG H&L (Alexa Fluor® 488, 1:1,000; Abcam, ab150073), donkey anti-rabbit IgG H&L (Alexa Fluor® 647, 1:1,000; Abcam, ab150075), goat anti-mouse IgG H&L (FITC, 1:800; Abcam, ab6785), goat anti-chicken IgY H&L (Alexa Fluor® 405, 1:1,000; Abcam, ab15764), and donkey anti-chicken IgY H&L (FITC, 1:800; Abcam, ab63507) for 1 h at room temperature. DAPI (1: 2000; Abcam, ab104139) was used to stain the cell nuclei. A 50% glycerol (Sigma-Aldrich, G5516) solution was used to block and then the slide was analyzed and photographed under a confocal microscope (Olympus AX80; Olympus Optical, Tokyo, Japan).
Glutathione assay
Total glutathione (GSH + GSSH) in astrocytes or neurons and released glutathione (GSH) in the medium were tested according to the instructions of the reagent company (Sigma-Aldrich, CS0260). Cells were added incubated with 5% 5-sulfosalicylic acid solution and centrifuged to remove the precipitated protein. Ten microliter of sample or the prepared glutathione standard solutions were added and 150 μL of the working mixture was added into separate wells of the plate. After incubating for 5 min at room temperature, 50 μL of the diluted NADPH solution was added into each well and mixed. The final concentration of the components in the reaction mixture was 95 mM potassium phosphate buffer, pH 7.0, 0.95 mM EDTA, 48 μM NADPH (Sigma-Aldrich, N6505), 0.031 mg/mL DTNB (Sigma-Aldrich, D8130), 0.115 units/mL glutathione reductase (Sigma-Aldrich, G4544), 0.24% 5-sulfosalicylic acid (Sigma-Aldrich, S2130). We used a plate reader to measure the absorbance in each well at 412 nm at 1 min and at intervals for 5 min. The glutathione concentration (nmol per mL of sample) = (slope of sample × dilution of multiple of sample)/(slope of 1 nmol GSH × volume of sample).
Synthesis of siRNAs.
Three siRNAs targeting mouse Atg7 (#1, #2) or Keap1 and two control siRNAs (#1, #2) were designed and synthesized by Shanghai GeneChem. (China). The gene sequences were as follows: Atg7 siRNA (#1): 5ʹ-TTCTGTCACGG TTCGATAATG-3ʹ; Atg7 siRNA (#2): 5ʹ- CCAGCTCTGAACTCAATAATA-3ʹ; Sqstm1 siRNA: 5ʹ-CCGCATC TACATTAAAGAGAA-3ʹ; Nfe2l2 siRNA: 5ʹ-AGGCAGCCATGACTGATTTAA-3ʹ; Keap1 siRNA: 5ʹ-TCCTCCAGCCCAGTCTTTAAA-3ʹ; Traf6 siRNA: 5ʹ-GACGGTAAAGTG CCCAAATAA-3ʹ; Control siRNA (#1): 5ʹ-TTCTTCGAACGTGTCACGT-3ʹ; Control siRNA (#2): 5ʹ-GAC CCGACATAATTGCATAAA-3ʹ.
Synthesis of AAV-Keap1 shRNA.
The Keap1 shRNA and control shRNA were designed and synthesized by Shanghai GeneChem, cloned into a suitable viral vector pAAV-Rnu6-shRNA-CMV bGlobin-eGFP (GeneChem, GV119), and the recombinant plasmid and pHelper (Biovector, 1058 4–5) and pAAV-RC plasmids (Biovector, 1058 4–4 were transfected into AAV-293 cells (Agilent Technologies, 240,073). AAV virus particles were collected from infected AAV-293 cells, followed by concentration and purification of the supernatant containing virus particles. The gene sequences are shown as follows: Keap1 shRNA (#1): 5ʹ-CCGGTCCTCCAGCCCAGTCTTTAAACTCGAGTTTAAAGACTGGGCTGGAGGA TTTTTG-3ʹ; Keap1 shRNA (#2): 5ʹ-AATTCAAAAATCCTCCAGCCCAGTCTTTAA ACTCGAGTTTAAAGACTGGGCTGGAGGA-3ʹ; Control shRNA: 5ʹ-ACCGGCGCTG AGTACTTCGAAATGTCTTCAAGAGAGACATTTCGAAGTACTCAGCGTTTTT-3ʹ
Statistical analysis
Data are expressed as the mean ± standard deviation (SD). Statistical comparisons were made using the Student’s t-tests or one-way factorial analysis of variance (ANOVA), two-way ANOVA, and two-way repeated-measures ANOVA followed by Dunnett’s post hoc test. P ≤ 0.05 was considered to be statistically significant. SPSS software version 21.0 (SPSS, Chicago, IL, USA) and GraphPad Prism software version 6.00 (GraphPad Software, San Diego, CA, USA) were used for statistical analyses and graphic production.
Supplemental Material
Download MS Word (17.5 MB)Acknowledgments
This work was sponsored by the National Nature Science Foundation of China (81671079 and 81971046), the National Science Foundation for Young Scientists of China (81801097) and the Shanghai Sailing Program (18YF1423200). We thank International Science Editing (http://www.internationalscienceediting.com) for editing this manuscript.
Disclosure statement
The authors declare no conflict of interest.
Supplementary material
Supplemental data for this article can be accessed here.
Additional information
Funding
References
- Tibbs GR, Posson DJ, Goldstein PA. Voltage-gated ion channels in the PNS: novel therapies for neuropathic pain? Trends Pharmacol Sci. 2016;37(7):S0165614716300335.
- Jensen TS, Finnerup NB. Allodynia and hyperalgesia in neuropathic pain: clinical manifestations and mechanisms. Lancet Neurol. 2014;13(9):924–935.
- Grace PM, Hutchinson MR, Maier SF, et al. Pathological pain and the neuroimmune interface. Nat Rev Immunol. 2014;14(4):217–231.
- Walker AK, Kavelaars A, Heijnen CJ, et al. Neuroinflammation and comorbidity of pain and depression. Pharmacol Rev. 2014;66(1):80–101.
- Kallenborn-Gerhardt W, Schröder K, Geisslinger G, et al. NOXious signaling in pain processing. Pharmacol Ther. 2013;137(3):309–317.
- Kim D, You B, Jo EK, et al. NADPH oxidase 2-derived reactive oxygen species in spinal cord microglia contribute to peripheral nerve injury-induced neuropathic pain. Proc Natl Acad Sci U S A. 2010;107(33):14851–14856.
- Grace PM, Gaudet AD, Staikopoulos V, et al. Nitroxidative signaling mechanisms in pathological pain. Trends Neurosci. 2016;39(12):S0166223616301400.
- Miyake T, Nakamura S, Zhao M, et al. Cold sensitivity of TRPA1 is unveiled by the prolyl hydroxylation blockade-induced sensitization to ROS. Nat Commun. 2016;7(1):12840.
- .Poillet PL, Xie X, Zhan L. et al. Autophagy maintains tumour growth through circulating arginine. Nature. 2018; 563(7732):569-573.
- Johnna D, Be H. Life, death and autophagy. Nat Cell Biol. 2018 20(10), 1110-1117.
- Napoletano F, Baron O, Vandenabeele P, et al. Intersections between regulated cell death and autophagy. Trends Cell Biol. 2019;29(4):323–338.
- Deretic V, Levine B. Autophagy balances inflammation in innate immunity. Autophagy. 2018 14(2), 243-251.
- Matsuzawa-Ishimoto Y, Hwang S, Autophagy CK. Inflammation. Annu Rev Immunol. 2018;36(1):73–101.
- Menzies FM, Fleming A, Caricasole A, et al. Autophagy and neurodegeneration: pathogenic mechanisms and therapeutic opportunities. Neuron. 2017;93:1015–1034.
- Xilouri M, Brekk OR, Polissidis A, et al. Impairment of chaperone-mediated autophagy induces dopaminergic neurodegeneration in rats. Autophagy. 2016;12(11):2230–2247.
- Hui KK, Takashima N, Watanabe A, et al. GABARAPs dysfunction by autophagy deficiency in adolescent brain impairs GABAA receptor trafficking and social behavior. Sci Adv. 2019;5(4):eaau8237.
- Liu Y, Xue X, Zhang H, et al. Neuronal-targeted TFEB rescues dysfunction of the autophagy-lysosomal pathway and alleviates ischemic injury in permanent cerebral ischemia. Autophagy. 2019;15(3):493–509.
- Scrivo A, Bourdenx M, Pampliega O, et al. Selective autophagy as a potential therapeutic target for neurodegenerative disorders. Lancet Neurol. 2018;17(9):802–815.
- Broda M, Millar AH, Van Aken O. Mitophagy: a mechanism for plant growth and survival. Trends Plant Sci. 2018;23(5):434–450.
- Harper JW, Ordureau A, Heo JM. Building and decoding ubiquitin chains for mitophagy. Nat Rev Mol Cell Biol. 2018;19(2):93–108.
- Marinelli S, Nazio F, Tinari A, et al. Schwann cell autophagy counteracts the onset and chronification of neuropathic pain. Pain. 2014;155(1):93–107.
- Meng XL, Fu P, Wang L, et al. Increased EZH2 levels in anterior cingulate cortex microglia aggravate neuropathic pain by inhibiting autophagy following brachial plexus avulsion in rats. 2020;36. Neuroence Bulletin. 2020;36(7):793-805.
- Chen H, Zhou C, KeliangXie MX, et al. Hydrogen-rich saline alleviated the hyperpathia and microglia activation via autophagy mediated inflammasome inactivation in neuropathic pain rats. Neuroence. 2019;421:17–30.
- Berliocchi L, Maiaru M, Varano GP, et al. Spinal autophagy is differently modulated in distinct mouse models of neuropathic pain. Mol Pain. 2015;11:3.
- Yan K, Wu C, Ye Y, et al. A20 inhibits osteoclastogenesis via TRAF6‐dependent autophagy in human periodontal ligament cells under hypoxia. Cell Prolif. 2020;53(3). DOI:https://doi.org/10.1111/cpr.12778
- Zhu G, Cheng Z, Huang Y, et al. TRAF6 promotes the progression and growth of colorectal cancer through nuclear shuttle regulation NF-kB/c-jun signaling pathway. Life Sci. 2019;235:116831.
- Pang L, Zhang N, Dong N, et al. Erythropoietin protects rat brain injury from carbon monoxide poisoning by inhibiting toll-like receptor 4/NF-kappa B-Dependent inflammatory responses. Inflammation. 2015;39(2):561–568.
- Wang L, Yin C, Liu T, et al. Pellino1 regulates neuropathic pain as well as microglial activation through the regulation of MAPK/NF-κB signaling in the spinal cord. J Neuroinflammation. 2020;17(1):83.
- Chen Y, Chen X, Yu J, et al. JAB1 is involved in neuropathic pain by regulating jnk and nf-κb activation after chronic constriction injury. Neurochem Res. 2016;41(5):1119–1129.
- Fu ES, Zhang YP, Sagen J, et al. Transgenic inhibition of glial NF-kappa B reduces pain behavior and inflammation after peripheral nerve injury. Pain. 2010;148(3):509–518.
- Cuadrado A, Rojo AI, Wells G, et al. Therapeutic targeting of the NRF2 and KEAP1 partnership in chronic diseases. Nat Rev Drug Discov. 2019;18:295–317.
- Rojo AI, Mcbean G, Cindric M, et al. Redox control of microglial function: molecular mechanisms and functional significance. Antioxid Redox Signal. 2014;21(12):1766–1801.
- Innamorato NG, Rojo AI, Garcia-Yague AJ, et al. The transcription factor Nrf2 is a therapeutic target against brain inflammation. J Immunol. 2008;181(1):680–689.
- Hammer P, Banck MS, Amberg R, et al. mRNA-seq with agnostic splice site discovery for nervous system transcriptomics tested in chronic pain. Genome Res. 2010;20(6):847–860.
- Lood C, Blanco LP, Purmalek MM, et al. Neutrophil extracellular traps enriched in oxidized mitochondrial DNA are interferogenic and contribute to lupus-like disease. Nat Med. 2016;22(2):146–153.
- Lu Y, Jiang BC, Cao DL, et al. TRAF6 upregulation in spinal astrocytes maintains neuropathic pain by integrating TNF-α and IL-1β signaling. Pain. 2014;155(12):2618–2629.
- Liu F, Wang Z, Qiu Y, et al. Suppression of MyD88-dependent signaling alleviates neuropathic pain induced by peripheral nerve injury in the rat. J Neuroinflammation. 2017;14(1):70.
- Ge Y, Jiao Y, Li P, et al. Coregulation of endoplasmic reticulum stress and oxidative stress in neuropathic pain and disinhibition of the spinal nociceptive circuitry. Pain. 2018;159(5):894–906.
- Bittar A, Jun J, La JH, et al. Reactive oxygen species affect spinal cell type-specific synaptic plasticity in a model of neuropathic pain. Pain. 2017;158(11):2137–2146.
- Kawasaki Y, Xu ZZ, Wang X, et al. Distinct roles of matrix metalloproteases in the early- and late-phase development of neuropathic pain. Nat Med. 2008;14(3):331–336.
- Mizushima N, Yoshimori T, Levine B. Methods in mammalian autophagy research. Cell. 2010;140(3):313–326.
- Sarkar C, Zhao Z, Aungst S, et al. Impaired autophagy flux is associated with neuronal cell death after traumatic brain injury. Autophagy. 2014;10(12):2208–2222.
- Imai S, Ikegami D, Yamashita A, et al. Epigenetic transcriptional activation of monocyte chemotactic protein 3 contributes to long-lasting neuropathic pain. Brain. 2013;136(3):828–843.
- Clarke AJ, Simon AK. Autophagy in the renewal, differentiation and homeostasis of immune cells. Nat Rev Immunol. 2019;19(3):170–183.
- Liu X, Cao H, Li J, et al. Autophagy induced by DAMPs facilitates the inflammation response in lungs undergoing ischemia-reperfusion injury through promoting TRAF6 ubiquitination. Cell Death Differ. 2017;24(4):683–693.
- Hindi SM, Kumar A. TRAF6 regulates satellite stem cell self-renewal and function during regenerative myogenesis. J Clin Invest. 2016;126(1):151–168.
- Hu L, Xu J, Xie X, et al. Oligomerization-primed coiled-coil domain interaction with Ubc13 confers processivity to TRAF6 ubiquitin ligase activity. Nat Commun. 2017;8(1):814.
- Wu C, Su Z, Lin M, et al. NLRP11 attenuates toll-like receptor signalling by targeting TRAF6 for degradation via the ubiquitin ligase RNF19A. Nat Commun. 2017;8(1):1977.
- Xing Y, Zhang N, Zhang W, et al. bupivacaine indirectly potentiates glutamate-induced intracellular calcium signaling in rat hippocampal neurons by impairing mitochondrial function in cocultured astrocytes. Anesthesiology. 2018;128(3):539–554.
- Baxter PS, Bell KF, Hasel P, et al. Synaptic NMDA receptor activity is coupled to the transcriptional control of the glutathione system. Nat Commun. 2015;6(1):6761.
- Buendia I, Michalska P, Navarro E, et al. Nrf2-ARE pathway: an emerging target against oxidative stress and neuroinflammation in neurodegenerative diseases. Pharmacol Ther. 2016;157:84–104.
- Baird L, Swift S, Lleres D, et al. Monitoring Keap1-Nrf2 interactions in single live cells. Biotechnol Adv. 2014;32(6):1133–1144.
- Kumar H, Kim IS, More SV, et al. Natural product-derived pharmacological modulators of Nrf2/ARE pathway for chronic diseases. Nat Prod Rep. 2014;31:109–139.
- Lu MC, Ji JA, Jiang ZY, et al. The Keap1-Nrf2-ARE pathway as a potential preventive and therapeutic target: an update. Med Res Rev. 2016;36(5):924–963.
- Ichimura Y, Waguri S, Sou YS, et al. Phosphorylation of p62 activates the Keap1-Nrf2 pathway during selective autophagy. Mol Cell. 2013;51(5):618–631.
- Sun X, Ou Z, Chen R, et al. Activation of the p62-Keap1-NRF2 pathway protects against ferroptosis in hepatocellular carcinoma cells. Hepatology. 2016;63(1):173–184.
- Levine B, Kroemer G. Biological functions of autophagy genes: a disease perspective. 2019;176(1-2):11-42.
- Shi G, Shi J, Liu K, et al. Increased miR-195 aggravates neuropathic pain by inhibiting autophagy following peripheral nerve injury. Glia. 2013;61(4):504–512.
- Chen G, Park CK, Xie RG, et al. Connexin-43 induces chemokine release from spinal cord astrocytes to maintain late-phase neuropathic pain in mice. Brain. 2014;137(8):2193–2209.
- Kim SK, Hayashi H, Ishikawa T, et al. Cortical astrocytes rewire somatosensory cortical circuits for peripheral neuropathic pain. J Clin Invest. 2016;126(5):1983–1997.
- Pankaj B, Swalpa U, M I C. Pain and immunity: implications for host defence. Nat Rev Immunol. 2019;19(7):433–447.
- Cook AD, Christensen AD, Tewari D, et al. Immune cytokines and their receptors in inflammatory pain. Trends Immunol. 2018;39(3):240–255.
- Lacagnina MJ, Watkins LR, Grace PM. Toll-like receptors and their role in persistent pain. Pharmacol Ther. 2018;184:145–158.
- Han X, Sun S, Sun Y, et al. Small molecule-driven NLRP3 inflammation inhibition via interplay between ubiquitination and autophagy: implications for Parkinson disease. Autophagy. 2019;15(11):1860–1881.
- Houtman J, Freitag K, Gimber N, et al. Beclin 1-driven autophagy modulates the inflammatory response of microglia via NLRP3. Embo J. 2019;38(4):38.
- Motori E, Puyal J, Toni N, et al. Inflammation-induced alteration of astrocyte mitochondrial dynamics requires autophagy for mitochondrial network maintenance. Cell Metab. 2013;18(6):844–859.
- Kim H, Jang B, Park J, et al. A novel chalcone derivative as Nrf2 activator attenuates learning and memory impairment in a scopolamine-induced mouse model. Eur J Med Chem. 2020;185:111777.
- Singh MV, Kotla S, Le NT, et al. Senescent phenotype induced by p90RSK-NRF2 signaling sensitizes monocytes and macrophages to oxidative stress in HIV-Positive individuals. Circulation. 2019;139(9):1199–1216.
- Wang P, Geng J, Gao J, et al. Macrophage achieves self-protection against oxidative stress-induced ageing through the Mst-Nrf2 axis. Nat Commun. 2019;10(1):755.
- Min Y, Kim M, Lee S, et al. Inhibition of TRAF6 ubiquitin-ligase activity by PRDX1 leads to inhibition of NFKB activation and autophagy activation. Autophagy. 2018;14(8):1347–1358.
- Li T, Qin J, Yang X, et al. The Ubiquitin E3 Ligase TRAF6 exacerbates ischemic stroke by ubiquitinating and activating Rac1. J Neurosci. 2017;37(50):12123–12140.
- Li M, Zhang D, Ge X, et al. TRAF6-p38/JNK-ATF2 axis promotes microglial inflammatory activation. Exp Cell Res. 2019;376(2):133–148.
- Han J, Yin Q, Fang Y, et al. Atorvastatin protects BV‑2 mouse microglia and hippocampal neurons against oxygen‑glucose deprivation‑induced neuronal inflammatory injury by suppressing the TLR4/TRAF6/NF‑κB pathway. Mol Med Rep. 2018;18(1):1058–1066.
- Liu S, Sarkar C, Dinizo M, et al. Disrupted autophagy after spinal cord injury is associated with ER stress and neuronal cell death. Cell Death Dis. 2015;6(1):e1582.
- Lee JW, Nam H, Kim LE, et al. TLR4 (toll-like receptor 4) activation suppresses autophagy through inhibition of FOXO3 and impairs phagocytic capacity of microglia. Autophagy. 2019;15(5):753–770.
- Habas A, Hahn J, Wang X, et al. Neuronal activity regulates astrocytic Nrf2 signaling. Proc Natl Acad Sci U S A. 2013;110(45):18291–18296.