
ABSTRACT
Basal macroautophagy/autophagy has recently been found in anucleate platelets. Platelet autophagy is involved in platelet activation and thrombus formation. However, the mechanism underlying autophagy in anucleate platelets require further clarification. Our data revealed that LC3-II formation and SQSTM1/p62 degradation were noted in H2O2-activated human platelets, which could be blocked by 3-methyladenine and bafilomycin A1, indicating that platelet activation may cause platelet autophagy. AMPK phosphorylation and MTOR dephosphorylation were also detected, and block of AMPK activity by the AMPK inhibitor dorsomorphin reversed SQSTM1 degradation and LC3-II formation. Moreover, autophagosome formation was observed through transmission electron microscopy and deconvolution microscopy. These findings suggest that platelet autophagy was induced partly through the AMPK-MTOR pathway. In addition, increased LC3-II expression occurred only in H2O2-treated Atg5f/f platelets, but not in H2O2-treated atg5−/− platelets, suggesting that platelet autophagy occurs during platelet activation. atg5−/− platelets also exhibited a lower aggregation in response to agonists, and platelet-specific atg5−/− mice exhibited delayed thrombus formation in mesenteric microvessles and decreased mortality rate due to pulmonary thrombosis. Notably, metabolic analysis revealed that sphingolipid metabolism is involved in platelet activation, as evidenced by observed several altered metabolites, which could be reversed by dorsomorphin. Therefore, platelet autophagy and platelet activation are positively correlated, partly through the interconnected network of sphingolipid metabolism. In conclusion, this study for the first time demonstrated that AMPK-MTOR signaling could regulate platelet autophagy. A novel linkage between AMPK-MTOR and sphingolipid metabolism in anucleate platelet autophagy was also identified: platelet autophagy and platelet activation are positively correlated.
Abbreviations: 3-MA: 3-methyladenine; A.C.D.: citric acid/sod. citrate/glucose; ADP: adenosine diphosphate; AKT: AKT serine/threonine kinase; AMPK: AMP-activated protein kinase; ANOVA: analysis of variance; ATG: autophagy-related; B4GALT/LacCS: beta-1,4-galactosyltransferase; Baf-A1: bafilomycin A1; BECN1: beclin 1; BHT: butylate hydrooxytoluene; BSA: bovine serum albumin; DAG: diacylglycerol; ECL: enhanced chemiluminescence; EDTA: ethylenediamine tetraacetic acid; ELISA: enzyme-linked immunosorbent assay; GALC/GCDase: galactosylceramidase; GAPDH: glyceraldehyde-3-phosphate dehydrogenase; GBA/GluSDase: glucosylceramidase beta; GPI: glycosylphosphatidylinositol; H2O2: hydrogen peroxide; HMDB: human metabolome database; HRP: horseradish peroxidase; IF: immunofluorescence; IgG: immunoglobulin G; KEGG: Kyoto Encyclopedia of Genes and Genomes; LAMP1: lysosomal associated membrane protein 1; LC-MS/MS: liquid chromatography-tandem mass spectrometry; mAb: monoclonal antibody; MAP1LC3/LC3: microtubule associated protein 1 light chain 3; MPV: mean platelet volume; MTOR: mechanistic target of rapamycin kinase; ox-LDL: oxidized low-density lipoprotein; pAb: polyclonal antibody; PC: phosphatidylcholine; PCR: polymerase chain reaction; PI3K: phosphoinositide 3-kinase; PLS-DA: partial least-squares discriminant analysis; PRP: platelet-rich plasma; Q-TOF: quadrupole-time of flight; RBC: red blood cell; ROS: reactive oxygen species; RPS6KB/p70S6K: ribosomal protein S6 kinase B; SDS: sodium dodecyl sulfate; S.E.M.: standard error of the mean; SEM: scanning electron microscopy; SGMS: sphingomyelin synthase; SM: sphingomyelin; SMPD/SMase: sphingomyelin phosphodiesterase; SQSTM1/p62: sequestosome 1; TEM: transmission electron microscopy; UGT8/CGT: UDP glycosyltransferase 8; UGCG/GCS: UDP-glucose ceramide glucosyltransferase; ULK1: unc-51 like autophagy activating kinase 1; UPLC: ultra-performance liquid chromatography; PIK3C3/VPS34: phosphatidylinositol 3-kinase catalytic subunit type 3; PtdIns3P: phosphatidylinositol-3-phosphate; WBC: white blood cell; WT: wild type
Introduction
Platelets are the flowing first responders to a blood vessel injury and they assist in hemostasis. Compromised platelet function can induce bleeding diatheses. Moreover, incongruous platelet activation can lead to thrombosis that causes acute vascular obstruction, triggering strokes, heart attacks, and other ischemic conditions [Citation1,Citation2]. Platelets are produced from megakaryocytes under shear conditions as anucleate cellular fragments and remain in circulation for approximately 7 to 10 days in humans [Citation3,Citation4]. Because their function declines over time, mature platelets are removed by the liver and spleen [Citation5].
Autophagy, the cellular process that facilitates lysosomal degradation of long-lived cytoplasmic proteins, is initiated during passage of differentiation, nutrient starvation, or cellular stress, including oxidative stress, endoplasmic reticulum stress, and the gathering of protein aggregates [Citation6,Citation7]. Autophagy also occurs in anucleate platelets [Citation8–11]. Ouseph et al reported that basally active autophagy continuously proceeded in an unstimulated (resting) condition [Citation9]. Nutrient deprivation induces MAP1LC3/LC3 (microtubule associated protein 1 light chain 3)-II formation, SQSTM1/p62 (sequestosome 1) degradation, and double-membrane vesicle formation in platelets [Citation8]. By contrast, the LC3-II level can decrease by 1.5 to 2.5-fold in response to platelet agonists [Citation9]. This may be attributed to more rapid autolysosomal proteolysis, which could lead to a higher turnover of LC3-II in agonist-induced platelets than in starved platelets. In addition, platelet autophagy is involved in platelet activation [Citation8,Citation9]. Exposure to the pharmacological autophagy inhibitors 3-methyladenine (3-MA) and bafilomycin A1 (Baf-A1) and the deletion of genes (such as the platelet-specific atg5−/− and atg7−/− or Becn+/−) can impair platelet aggregation, hemostasis, and thrombosis [Citation8,Citation9,Citation11], suggesting that basal autophagy is essential to platelet function. By contrast, a substantial mitophagy induction (above the basal autophagy level) in diabetic platelets has been reported to protect against severe oxidative stress [Citation10]. Furthermore, hypoxic preconditioning has been reported to induce platelet mitophagy, which could reduce ischemia/reperfusion-induced heart injury [Citation11]. These findings indicate that platelet mitophagy may protect platelets from oxidative stress–induced damage, which can prevent platelet activation and thrombosis. Taken together, these findings suggest that basal platelet autophagy supports platelet activation and platelet mitophagy prevents pathological platelet activation. Notably, PIK3C3/VPS34 (phosphatidylinositol 3-kinase catalytic subunit type 3), a class-III phosphatidylinositol 3-kinase, has been reported to catalyze phosphatidylinositol phosphorylation to form phosphatidylinositol 3-phosphate (PtdIns3P). The PtdIns3P on autophagic membranes is essential for the expansion of phagophores and completion of autophagosomes [Citation12]. However, Liu et al reported that platelets that underwent deletion of Pik3c3 exhibits impaired platelet activation, but the absence of PIK3C3 does not significantly affect the agonist-induced reduction of the LC3-II level, suggesting that the inhibition of platelet function caused by pik3c3 deficiency may not be autophagy dependent [Citation13]. PIK3C3 was also reported to play a crucial role in platelet autophagy in patients with immune thrombocytopenia purpura/ITP, and enhancing platelet autophagy might alleviate platelet destruction by improving platelet viability [Citation14]. Based on these findings, the relationship between platelet activation and platelet autophagy should be clarified.
Reactive oxygen species (ROS), including hydrogen peroxide (H2O2), can induce autophagy in various cell types [Citation15–17]. In platelets, H2O2 can promote platelet activity and participate in platelet activation [Citation18,Citation19]. H2O2 can increase by as much as 50 to 100 µM in certain disease states or during chronic inflammation [Citation20–22]. Although relative high concentration of H2O2 (1 mM) was used to study platelet autophagy [Citation10], it may be detrimental to platelets. Therefore, a series of experiments were performed to determine the role of platelet autophagy, which potentially plays a role in the treatment of occlusive thrombotic diseases.
Results
Autophagy induction in H2O2-activated human platelets
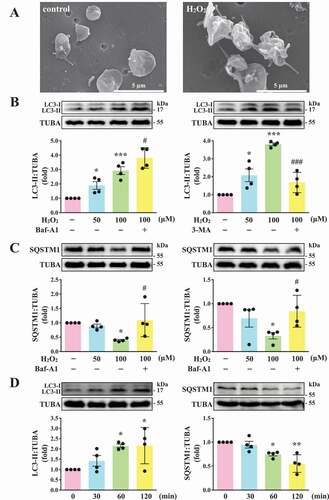
Before this study, we first observed its effect on platelet function. The data revealed that H2O2 at 1 mM, but not 100 µM, led to completely impaired platelet aggregation in response to collagen (data not shown), suggesting that H2O2 at high concentration (1 mM) may cause platelet damage. Therefore, 50 and 100 µM H2O2 was used to investigate the relationship between platelet activation and autophagy in the current study. As shown in , the scanning electron microscopy (SEM) images indicated apparent morphological changes in platelets with H2O2 (100 µM) treatment, revealing that H2O2 converts discoid platelets to rounded cells with extended pseudopods and irregular shape. This indicated that the concentration (100 µM) was sufficient to trigger platelet activation. Moreover, LC3-I to LC3-II conversion was observed in H2O2-activated platelets in a concentration-dependent manner (50–100 µM; ). SQSTM1 degradation was also observed in H2O2-activated platelets at 100 µM (), suggesting that platelet autophagy occurred in H2O2-activated human platelets. Thus, H2O2 at 100 µM was used as an agonist for platelet autophagy in subsequent experiments. In addition, H2O2-induced LC3-I to LC3-II conversion and SQSTM1 degradation occurred in a time-dependent manner, in which the effect was the maximum from 60 to 120 min (). The accumulation of LC3-II and SQSTM1 was observed after treatment with Baf-A1 (), which blocks the autophagic flux by inhibiting autolysosome acidification and autophagosome–lysosome fusion [Citation23,Citation24], suggesting that H2O2 stimulation increases the autophagic flux. In addition, 3-MA, the class-III phosphatidylinositol 3-kinase inhibitor that interferes with the early steps of autophagy, could reverse LC3-II formation and SQSTM1 degradation ().
Figure 1. LC3-II and SQSTM1/p62 expression and autophagic flux in H2O2-activated human platelets. (A) Representative scanning electron microscopy (SEM) images of platelets treated with or without 100 μM H2O2 for 60 min. Scale bars: 5 μm. (B and C) Washed platelets (1.2 × 10⁹/mL) treated with 50 and 100 μM H2O2 for 60 min in the presence or absence of Baf-A1 (200 nM) or 3-MA (3 mM). (D) Washed platelets treated with 100 μM H2O2 for the indicated time (0–120 min). LC3 and SQSTM1/p62 detected using specific antibodies through western blotting. Data (B-D) are presented as the means ± S.E.M. (n = 4). *P < 0.05, **P < 0.01, and ***P < 0.001, compared with the control group. #P < 0.05 and ###P < 0.001 with the H2O2-treated group
Three-dimensional deconvolution fluorescence microscopy of autophagosome–lysosome fusion in activated human platelets
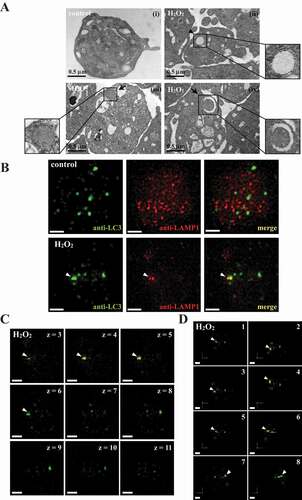
The formation of double-membrane autophagosomes is a critical characteristic of autophagy [Citation23,Citation25]. In this study, transmission electron microscopy (TEM) images revealed the presence of double-membrane autophagosomes (arrowhead) in H2O2-activated platelets but not in the resting control ( and ii). Moreover, the process of degradation of mitochondria by autolysosomes (mitophagy) was observed in activated platelets (arrows; , iii and iv). In addition, 3-dimensional autolysosomes (autophagosome-lysosome fusion) were clearly observed through deconvolution microscopy (3-dimensional; Video S1). LC3 (green fluorescence) and lysosome (red fluorescence) were labeled with anti-LC3 and anti-LAMP1 (lysosomal associated membrane protein 1) antibodies, respectively. Fluorescence images were captured from 2-dimensional (), z-axis (), and varying 3-dimensional angles (). LC3 and lysosome colocalization could also be found in activated platelets (, arrowhead). Moreover, z-section images revealed that the colocalization of LC3 and lysosomes only occurred between sections 4 and 6 but not above or below these sections (, white arrowheads), indicating that green and red signal colocalization was a specific event. The 3-dimensional reconstructed video, with rotation at different angles, also displayed that both red and green signals colocalized at the same spatial location, further supporting that the colocalization event was not a coincidence (Video S1). These data clearly demonstrated autophagy induction in activated platelets.
Figure 2. Autophagosome formation in H2O2-activated human platelets. (A) Representative transmission electron microscopic images of platelets treated (ii–iv) with or (I) without 100 μM H2O2 for 60 min. The arrowhead indicates the double-membrane autophagosome (ii) and the arrows indicate the early (iii) and late (iv) autophagosome enveloping mitochondria. Scale bar: 0.5 μm. (B) Washed platelets treated with or without 100 μM H2O2 for 60 min and then fixed. The LC3 and lysosomes were stained with anti-LC3 and anti-LAMP1 antibodies, respectively. These images were observed under a deconvolution microscope and were also captured from 2D (x-y axis). Three-dimensional (3D) autophagosome–lysosome fusion (i.e., autolysosome) was also provided in video form in Video S1. The green and red colors indicate LC3 and lysosomes, respectively. The white arrowhead indicates colocalization of LC3 and lysosome. Scale bar: 0.7 µm. (C) Different z-sections (z-axis) of the merged image of H2O2-treated platelets in (B). Scale bar: 0.7 µm. (D) Different angles (rotation) of the merged image of H2O2-treated platelets in (B). Scale bar: 0.7 µm. The profiles (A-D) are representative examples of 4 similar experiments
Regulatory role of AMPK-MTOR pathway on autophagy in human platelets
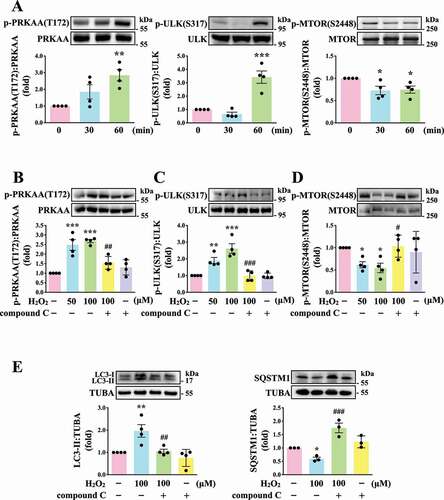
Previously, glucose deprivation has been reported to lead to ROS accumulation, which in turn activates AMP-activated protein kinase (AMPK) [Citation26–28]. AMPK can activate ULK1 (unc-51 like autophagy activating kinase 1), which plays a critical role in autophagy initiation, by directly phosphorylating ULK1 at Ser317 and Ser777 and by indirectly inactivating MTOR (mechanistic target of rapamycin kinase), which results in the dephosphorylation of ULK1 at Ser757 [Citation28]. Moreover, in response to cellular stress, the phosphorylation of MTOR at Ser2448 is reduced and the brake imposed on autophagy is released [Citation29]. Thus, the role of AMPK-MTOR in regulating platelet autophagy in H2O2-stimulated human platelets was investigated next. AMPK phosphorylation at PRKAA Thr172 and ULK1 phosphorylation at Ser317 occurred at 60 min in H2O2-treated human platelets, respectively; a reduction in MTOR phosphorylation at Ser2448 occurred at 30 and 60 min (). H2O2 (50–100 µM) significantly induced AMPK and ULK1 phosphorylation and attenuated MTOR phosphorylation which could be reversed by the AMPK inhibitor compound C (). Compound C also prevented LC3 accumulation and SQSTM1 degradation in H2O2-stimulated human platelets (). Another, other phospho-sites (Ser777 and Ser757) of ULK were detected. The data revealed that H2O2 could induce the phosphorylation and dephosphorylation of ULK1 at Ser777 and Ser757, respectively, which could be reversed by compound C, suggesting that the activation of ULK1 was regulated by AMPK and MTOR in response to H2O2 in platelets (Fig. S1). Taken together, these findings suggest that the AMPK-MTOR pathway is crucial in platelet autophagy.
Figure 3. Regulatory effects of the AMPK-MTOR pathway on platelet autophagy. (A) Washed platelets treated with 100 μM H2O2 for the indicated time (0–60 min). (B-D) Washed platelets treated with 50 and 100 μM H2O2 for 60 min in the presence or absence of compound C (10 μM). (E) Washed platelets treated with 100 μM H2O2 for 60 min in the presence or absence of compound C (10 μM). Specific antibodies were used to detect p-PRKAA (Thr172), p-ULK (Ser317), p-MTOR (Ser2448), LC3, and SQSTM1/p62 by western blotting. Data are presented as the means ± S.E.M. (n = 4; SQSTM1, n = 3). *P < 0.05, **P < 0.01, and ***P < 0.001, compared with the control platelets. #P < 0.05, ##P < 0.01, and ###P < 0.001 with the H2O2-treated group
Identification of the relationship between platelet activation and platelet autophagy in atg5−/− platelets
The ATG12–ATG5-ATG16L1 complex is essential for autophagosome formation [Citation30,Citation31]. The membrane binding of ATG5 is a critical step for the efficient promotion of LC3 lipidation and autophagosome closure [Citation30,Citation31], indicating that ATG5 plays a crucial role in the autophagic process. Thus, in this study, the relationship between platelet autophagy and platelet activation was carefully characterized in atg5−/− platelets. Platelet-specific atg5−/− mice were generated by crossing Atg5f/f mice with Pf4-Cre mice (). Polymerase chain reaction (PCR) was employed to genotype these mice (). The tissue-specific deficiency of Atg5 in platelets was further confirmed by western blotting. Deletion of Atg5 only occurred in platelets and not in other organs such as the spleen, liver, and kidneys (). Moreover, no differences were observed in the physical size of knockout mice (). Basic hematological parameters – including white blood cell (WBC), red blood cell (RBC), and platelet counts; hematocrit and hemoglobin levels; and mean platelet volume (MPV) – revealed no difference among wild type (WT), Atg5f/f, and atg5−/− mice (), indicating that atg5 knockout in platelets did not affect the phenotype and physiological parameters.
Figure 4. Effects of atg5 deficiency on LC3 expression and autophagy flux H2O2-activated atg5−/− platelets of mice. (A) Schematic for platelet-specific atg5−/− mice generation by using Cre-loxP recombination system. (B and C) Identification of platelet-specific atg5−/− mice by PCR (B) and western blotting (C). (D) Phenotype of the representative 8-week-old mice of WT, Atg5f/f, and platelet-specific atg5−/− mice. (E) Hematological parameters of WT, Atg5f/f, and platelet-specific atg5−/− mice analyzed using IDEXX Procyte Dx. Values are expressed as the means ± S.E.M. (n = 7). (F) Washed mouse Atg5f/f and atg5−/− platelets (1 × 10⁹/mL each) treated with or without 100 μM H2O2 for 60 min, and LC3 was then detected by western blotting. (G) Endogenous LC3 after 100 μM H2O2 treatment detected through immunofluorescence (IF) under a deconvolution microscope. The arrows indicate LC3 puncta. Scale bar: 1 μm. The profiles (C and G) are representative examples of 4 similar experiments. Data (F) are presented as the means ± S.E.M. (n = 4)
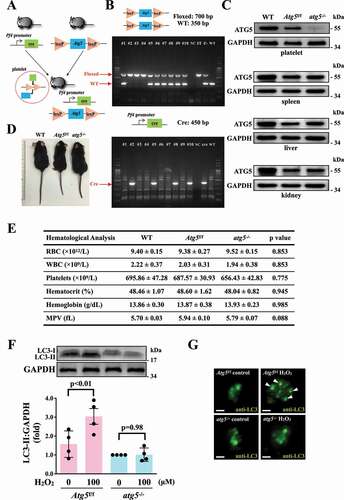
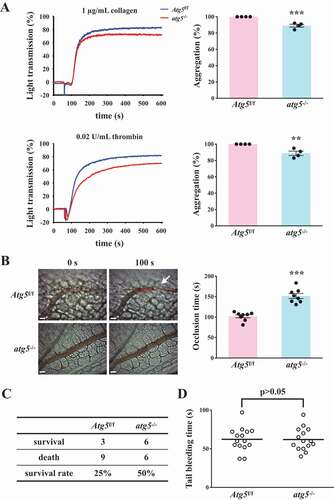
After H2O2 treatment, the LC3 expression level was determined in Atg5f/f and atg5−/− platelets. The western blotting data revealed that significant LC3-II expression was observed in Atg5f/f platelets but not in atg5−/− platelets on H2O2 stimulation (). also demonstrates a more pronounced increase in LC3 expression and puncta formation (arrowheads) in Atg5f/f platelets than in atg5−/− platelets. These findings further suggest H2O2 can cause platelet autophagy. Conversely, our data revealed that Atg5f/f platelets exhibited normal platelet function in collagen- or thrombin-induced platelet aggregation in vitro, whereas atg5−/− platelets exhibited a slight but significant defect in these aggregation processes (). Moreover, platelet activation markers, such as SELP/P-selectin and CD40LG (CD40 ligand), were determined through a flow cytometry. The data showed a significant reduction on thrombin-induced the expression of SELP and CD40LG in atg5−/- platelets, compared with Atg5f/f platelets (Fig. S2). These findings suggest that platelet autophagy may be involved in platelet activation, and a reciprocal interaction may exist between platelet activation and platelet autophagy.
Figure 5. Effects of platelet autophagy in platelet activation and thrombosis in platelet-specific atg5−/− mice. (A) Washed platelets from Atg5f/f or platelet-specific atg5−/− mice stimulated with 1 μg/mL collagen (top panel) or 0.02 U/mL α thrombin (bottom panel) to trigger platelet aggregation. Data are presented as the means ± S.E.M. (n = 4). **P < 0.01 and ***P < 0.001, compared with the Atg5f/f mice. (B) Atg5f/f or platelet-specific atg5−/− mice intravenously administered with sodium fluorescein. Mesenteric venules were subsequently irradiated to induce microthrombus formation that was continually recorded under a fluorescence microscope. The objective lens had a magnification of ×40. Scale bar: 200 µm. The arrow indicates thrombus. The occlusion time in the right panel is presented as the means ± S.E.M. (n = 8). ***P < 0.001, compared with the Atg5f/f mice. (C) Acute pulmonary thromboembolic death of mice determined after Atg5f/f and platelet-specific atg5−/− mice were injected with ADP (1.4 g/kg) through the tail vein (n = 12). (D) Bleeding induced by severing the tail of Atg5f/f and platelet-specific atg5−/− mice at 3 mm from the tail tip. The bleeding tail stump was immersed in saline. The bleeding time was continuously recorded until no sign of bleeding was observed for at least 10 s. Each point in the scatter plot graph represents a mouse (n = 15)
Effects of platelet autophagy on hemostasis and thrombosis
Two types of mouse thrombotic model were used to determine the role of platelet autophagy in thrombotic events. In the mouse model of fluorescein sodium-induced platelet thrombus formation in the mesenteric microvessels, vascular occlusion (, left panel, arrow) occurred at approximately 102.1 ± 3.7 s (n = 8) in Atg5f/f mice, but vascular occlusion did not occur in platelet-specific atg5−/− mice in the same time frame (, left panel). The occlusion time in platelet-specific atg5−/− mice was approximately 151.7 s ± 6.1 s (, right panel, n = 8). In the mouse model of adenosine diphosphate (ADP)-induced pulmonary thrombosis, acute pulmonary thromboembolic death could be prevented in platelet-specific atg5−/− mice, which displayed an increased survival rate of 25%, compared with platelet-specific Atg5f/f mice (, N = 12). Therefore, impaired platelet autophagy may cause defective thrombus formation. Moreover, the effect of platelet autophagy on hemostasis was determined using the tail bleeding time assay. The data revealed that the bleeding time of Atg5f/f mice was approximately 62.2 ± 4.0 s (n = 15). No significant difference was observed between Atg5f/f and platelet-specific atg5−/− mice (), implying that platelet autophagy mainly regulates thrombosis, but not hemostasis. Taken together, these findings suggest that platelet autophagy is involved in platelet activation and thrombosis without affecting hemostasis.
Novel linkage of AMPK-MTOR to sphingolipid metabolism in platelet autophagy
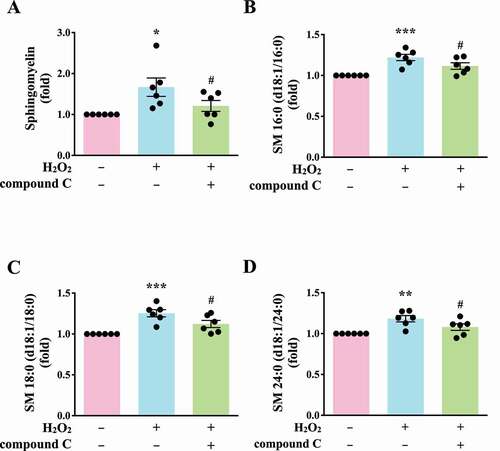
Autophagy can regulate cellular metabolic capability [Citation32–34]. However, whether autophagy-mediated metabolism regulates platelet function remains unclear. Hence, in this study, we determined metabolic changes between resting and H2O2-treated human platelets by performing a metabolic analysis (n = 7). Metabolites with significant changes (P < 0.05 and fold change > 1.5) were selected and subjected to pathway analysis. A partial least-squares discriminant analysis (PLS-DA) score plot revealed that the clustering significantly differed between control (resting) and H2O2-treated groups, suggesting that metabolic changes occurred in activated platelets (). The heat map (top 50) also presented differential patterns in the control and H2O2-treated groups (). These metabolites were subjected to pathway analysis by using MetaboAnalyst and the Kyoto Encyclopedia of Genes and Genomes (KEGG) metabolic pathways database. Human metabolome database (HMDB) numbers were subjected to MetaboAnalyst for a pathway analysis. This analysis revealed the top-5 pathways ranked by their p value () and the percentage of metabolite hits (): (1) sphingolipid metabolism, (2) glycerophospholipid metabolism, (3) glycerolipid metabolism, (4) linoleic acid metabolism, and (5) primary bile acid biosynthesis pathways. Among these pathways, sphingolipid metabolism had the highest score. The identified metabolites were imported into the KEGG database to identify their potential interactions. The data also revealed that one of the active networks was sphingolipid metabolism in which several metabolic changes, including an increase in sphingomyelin (SM), ceramide, phosphatidylcholine (PC), diacylglycerol (DAG), galactosylceramide, sulfatide, glucosylceramide, and lactosylceramide levels, were found in the H2O2-treated group (). Moreover, the increase in the SM level in H2O2-treated platelets could be prevented by the AMPK inhibitor compound C, as evidenced by enzyme-linked immunosorbent assay (ELISA) assay and liquid chromatography-tandem mass spectrometry (LC-MS/MS) analysis (). In addition, sphingomyelin (SM 16:0 and SM 18:0) could increase AMPK phosphorylation (Fig. S3A). Moreover, the SMPD3 (sphingomyelin phosphodiesterase 3) has been reported to be activated by H2O2 or by nutrient starvation, and in turn to induce autophagy [Citation35–37]. Thus, here, the SMPD3 inhibitor GW4869 was used to determine the role sphingolipid metabolism on autophagy in platelets. The data revealed that GW4869 inhibited H2O2-induced AMPK phosphorylation (Fig. S3B). Collectively, these findings strongly indicate a novel linkage of AMPK-MTOR to sphingolipid metabolism in anucleate platelet autophagy.
Figure 6. Metabolic pathway analysis in H2O2-activated human platelets. Platelets were treated with or without H2O2, and subjected to Q-TOF MS analysis (n = 7). Those metabolites with significant changes between groups (P < 0.05 and fold change > 1.5) were selected and subjected to pathway analysis. (A) PLS-DA score plot, presenting the clustering of control (orange) and H2O2-treated (green) platelets. (B) Heat map indicating top 50 potential metabolites. Red in the gradient presents the increases. Blue in gradient presented the decreases. (C) Bubble map showing the rank of pathways by P values. 1, sphingolipid metabolism; 2, glycerophospholipid metabolism; 3, glycerolipid metabolism; 4, linoleic acid metabolism; 5, primary bile acid biosynthesis. (D) Photograph depicting the top 5 metabolic pathways ranked by hit rate (hits/total metabolites). (E) Schematic of sphingolipid metabolism, in which the identified metabolites are involved, in the H2O2-treated group compared with the control group. The red solid box represents upregulation. PC: phosphatidylcholine; DAG: diacylglycerol; SGMS: sphingomyelin synthase; SMPD/SMase: sphingomyelin phosphodiesterase; UGT8/CGT: UDP glycosyltransferase 8; GALC/GCDase: galactosylceramidase; UGCG/GCS: UDP-glucose ceramide glucosyltransferase; GBA/GluSDase: glucosylceramidase beta; B4GALT/LacCS: beta-1,4-galactosyltransferase
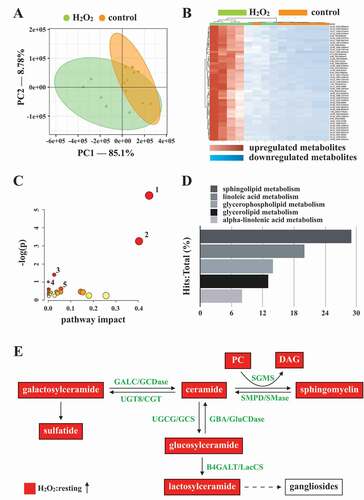
Figure 7. Validation of the linkage of AMPK-MTOR to Sphingolipid Metabolism in H2O2-activated human platelets. (A) Washed platelets (1 × 10⁷/mL) treated with 100 μM H2O2 for 60 min in the presence or absence of compound C (10 μM). After the reaction, sphingomyelin (SM) levels were determined by the ELISA assay. (B-D) Washed platelets (1 × 10⁶/mL) treated with 100 μM H2O2 for 60 min in the presence or absence of compound C (10 μM). After the reaction, the level of three sphingomyelins (B) SM 16:0 (d18:1/16:0); (C) SM 18:0 (d18:1/18:0); (D) SM 24:0 (d18:1/24:0) were quantified by the LC-MS/MS assay. Data (A-D) are presented as the means ± S.E.M. (n = 6). *P < 0.05, **P < 0.01, and ***P < 0.001, compared with the control group. #P < 0.05, compared with the H2O2-treated group
Discussion
Platelets contain the autophagy apparatus, and a basal autophagy in resting platelets is required for platelet activation [Citation8,Citation9]. Notably, starvation-mediated autophagy and agonist-mediated autophagy seem to play different roles in platelets. A study reported that the inhibition of platelet activation by prostaglandin E1 did not affect starvation-mediated autophagy, indicating that this autophagy type is independent of platelet activation [Citation8]. By contrast, several inhibitors of platelet activation have been shown to block agonist-mediated autophagy, suggesting that platelet activation signaling cascades, including PLC (phospholipase C) and PRKC (protein kinase C), are required for agonist-mediated autophagy [Citation9]. The present study also revealed that platelet activation can induce platelet autophagy. These observations indicate the complex regulation of autophagy in platelets. However, Ouseph et al reported that SQSTM1 was not affected during agonist-induced platelet autophagy and in atg7-deficient platelets, suggesting that alternative receptors other than SQSTM1 are utilized in agonist-induced platelet autophagy [Citation9]. By contrast, our study revealed that H2O2 could induce platelet autophagy (LC3-II formation) accompanied with SQSTM1 degradation. This suggests that SQSTM1 is used as a receptor in H2O2-mediated platelet autophagy in contrast to autophagy induced by platelet agonists, or that the level of platelet activation induced by H2O2 is weaker than that induced by other agonists; thus, SQSTM1 turnover could be observed in H2O2-treated platelets. Similarly, in this study, LC3-II accumulation was found in H2O2-treated platelets, whereas LC3-II loss was noted in agonist-treated platelets. These diverse results may be attributed to the rapid autophagic flux in agonist-treated platelets [Citation9]. By contrast, in diabetic platelets or under the hypoxic preconditioning condition, a substantial mitophagy has been reported to be induced to protect against severe oxidative stress and ischemia/reperfusion-induced heart injury [Citation10,Citation11]. These findings demonstrate that platelet mitophagy might serve as a protective mechanism under pathological conditions [Citation10,Citation11]. Thus, evidence suggests that platelet autophagy plays a critical role in protective mechanisms against oxidative stress and in physiological function, supporting platelet activation. Actually, we also found that H2O2 might induce mitopahgy in platelets (, iii and iv). Moreover, H2O2 led to mitochondrial depolarization, the decrease of ATP content, and the loss of mitochondrial mass in platelets (Figs. S4 and S5). In addition, we also found that H2O2 could cause the phosphorylation of ULK1 at Ser555 (Fig. S5C), which has been reported to translocate to mitochondria and mediate mitophagy [Citation27,Citation38,Citation39]. Collectively, these findings evidently support that H2O2 might concomitantly induce mitochondrial damage and platelet mitophagy, which themselves are responsible for pathological and physiological platelet activation, respectively [Citation10]. However, the detailed regulatory mechanisms of mitophagy in platelets need to be further clarified.
The relationship between platelet autophagy and platelet activation remains unclear. Our data revealed that AMPK-MTOR was involved in platelet autophagy in H2O2-activated human platelets. Wang et al. also reported that ROS promotes human platelet activation by upregulating autophagy through the PI3K-AKT-MTOR pathway [Citation40]. They observed that the MTOR inhibitor rapamycin could enhance oxidized low-density lipoprotein (ox-LDL)-mediated platelet aggregates and LC3-II formation. ox-LDL also reduced AKT and MTOR phosphorylation in human platelets [Citation40]. These observations suggest that MTOR inhibition activates platelet autophagy and promotes platelet activation under oxidative stress. By contrast, Aslan et al reported that the pharmacological inhibition of MTOR blocked RAC1 activation and subsequent platelet spreading on fibrinogen and considerably prevented collagen-induced platelet aggregation and platelet aggregate formation under the shear stress condition [Citation41]. However, the concentration of rapamycin (1 µM) used was relatively high for human platelets [Citation41]. We confirmed that rapamycin at a concentration of 1 µM, but not 200 nM, could inhibit collagen-induced human platelet aggregation (data not shown). Moreover, Liu et al reported that rapamycin (200 nM) did not affect mouse platelet aggregation [Citation13]. These observations possibly relate to the off-target effect of rapamycin at a high concentration of 1 µM on the inhibition of platelet activation. However, Yang et al reported that MTORC1 promoted aging-related venous thrombosis through the elevation of the MPV and through platelet activation [Citation42]. They reported that 2-month intragastric administration of rapamycin or deletion of Raptor could reduce mouse platelet aggregation and venous thrombosis. These findings suggest that MTOR activity is positively correlated with platelet activation in aging mouse platelets. They also reported that H2O2 (50 µM) induced the phosphorylation of RPS6KB/p70S6K (ribosomal protein S6 kinase B) and RPS6 (a downstream readout of MTORC1) in platelets from 4- and 16-month-old mice; thus, they proposed that ROS contribute to MTORC1-dependent platelet activation during aging [Citation42]. However, the present study revealed that H2O2 (50 and 100 µM) could reduce MTOR phosphorylation and promote autophagy and activation in human platelets. These inconsistent findings thus warrant further research.
PRKAA2/AMPKα2 may be involved in platelet signaling and thrombus stability [Citation43]. Moreover, the AMPK inhibitor compound C (10 μM) significantly attenuated platelet aggregation induced by thrombin [Citation43]. Platelets from prkaa1 knockout mice also exhibited decreased thrombin-induced aggregation, and PRKAA1/AMPKα1 was activated in platelets on thrombin or collagen stimulation [Citation44,Citation45]. In the present study, AMPK activation and LC3-II formation were found in H2O2-activated human platelets, which were significantly reversed by compound C. Therefore, AMPK may be involved in both platelet activation and platelet autophagy. By contrast, Liu et al reported that AMPK mediates the antiplatelet effects of thiazolidinediones, a class of antidiabetic drugs [Citation46]. They showed that compound C reduced rosiglitazone-attenuated platelet aggregation induced by collagen, but compound C alone did not affect collagen-induced platelet aggregation [Citation46]. However, similar to our results, Randriamboavonjy et al reported that compound C alone could inhibit platelet aggregation. This discrepancy requires further clarification [Citation43].
Notably, our study is the first to use metabolic analysis to investigate the relationship between platelet autophagy and metabolism. In H2O2-activated human platelets, the levels of several metabolites considerably increased, including sphingomyelin (SM), ceramide, phosphatidylcholine (PC), diacylglycerol (DAG), galactosylceramide/sulfatide, and glucosylceramide/lactosylceramide. Sphingomyelin, galactosylceramide/sulfatide, and glucosylceramide/lactosylceramide are originated from ceramide through conversion by SGMS (sphingomyelin synthase) [Citation47,Citation48], UGT8/CGT (UDP glycosyltransferase 8) [Citation49–51], and UGCG/GCS (UDP-glucose ceramide glucosyltransferase)-B4GALT/LacCS (beta-1,4-galactosyltransferase) [Citation52–54], respectively, By contrast, sphingomyelin (SM), galactosylceramide, and glucosylceramide can be converted into ceramide, increasing ceramide levels, through SMPD/SMase (sphingomyelin phosphodiesterase), GALC/GCDase (galactosylceramidase), and GBA/GluSDase (glucosylceramidase beta), respectively [Citation55]. Ceramide has been reported to be involved in autophagy [Citation56,Citation57], and our previous study demonstrated that ceramide participates in F2RL3/protease-activated receptor 4–mediated platelet activation [Citation58]. Moreover, sulfatides have been reported to serve as ligands of SELP, and they are involved in the activation of platelets and the formation of stable platelet aggregates [Citation59,Citation60]. Glucosylceramide was also reported to contribute to atherosclerotic plaque inflammation [Citation61]. The present data revealed an increase in the DAG level on H2O2 treatment. It can lead to PRKC activation in various cell types [Citation47,Citation48]. These observations suggest that sphingolipid metabolism is involved in platelet autophagy, platelet activation, and thrombus formation. Thus, the metabolic analysis in this study provides insights into the possible mechanism through which sphingolipid metabolism may regulate platelet autophagy. Moreover, in this study, compound C significantly reduced the SM level. SM (16:0 and 18:0) could induce AMPK phosphorylation. Moreover, the SMPD3 inhibitor GW4869 inhibited H2O2-induced AMPK phosphorylation, suggesting that H2O2-induced platelet autophagy is partly mediated by SMPD3. Previous studies have also reported that H2O2 can activate SMPD3, which induces autophagy during nutrient starvation [Citation35–37]. Therefore, these findings support that sphingolipid metabolism is involved in H2O2-induced autophagy activation and that sphingolipid metabolism may provide a linkage between platelet activation and platelet autophagy.
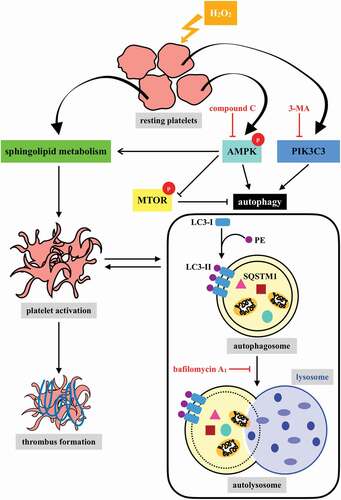
In conclusion, our findings indicate that platelet activation could lead to platelet autophagy through the AMPK-MTOR pathway (). We also confirmed the positive correlation between platelet autophagy and platelet activation and thrombus formation. Moreover, the most crucial finding of this study is the discovery of a novel linkage of AMPK-MTOR to sphingolipid metabolism in anucleate platelet autophagy.
Figure 8. Hypothetical scheme of H2O2-mediated platelet autophagy. A novel linkage between AMPK-MTOR and sphingolipid metabolism in anucleate platelet autophagy was identified: platelet autophagy and platelet activation are positively correlated
Materials and methods
Chemicals and reagents
H2O2 (31642), luciferase/luciferin (FLE250), fluorescein sodium (F6377), ADP (A2754), and anti-LC3B polyclonal antibodies (pAbs) (L7543) were purchased from Sigma Aldrich. 3-MA (13242) and Baf-A1 (11038) were purchased from Cayman Chemical. Dorsomorphin (compound C, HY-13418A) was purchased from MedChemExpress. COL1A/collagen type I (P/N 385) was purchased from Chrono-Log Corporation. Human F2/alpha thrombin (coagulation factor II, thrombin, HT 1002a) was purchased from Enzyme Research Laboratories. Anti-phospho-ULK1 (Ser317) (12753) and anti-phospho-PRKAA/AMPKα (Thr172) (2535) monoclonal antibodies (mAbs) and anti-phospho-MTOR (Ser2448) (2971) pAbs were purchased from Cell Signaling Technology. Anti-ULK1 (ab128859), anti-ATG5/APG5L (ab108327), anti-PRKAA1/AMPK alpha 1 (ab32047), and anti-SQSTM1/p62 (ab109012) mAbs and Sphingomyelin Assay Kit (ab138877) were purchased from Abcam. The anti-MTOR [C3] (GTX101557) and anti-GAPDH (glyceraldehyde-3-phosphate dehydrogenase) (GTX100118) pAbs were purchased from GeneTex. Anti-LC3 pAb (AP1802A) was purchased from Abgent. Mouse anti-LAMP1 mAb (H4A3) was obtained from DSHB. The TUBA/tubulin-α Ab-2 mAb (MS-581) was purchased from Thermo Fisher Scientific. Hybond-P polyvinylidene difluoride membrane (GE10600023), an enhanced chemiluminescence (ECL) western blotting detection reagent (GERPN2106), and the analysis system were purchased from GE Healthcare Life Sciences. The horseradish peroxidase (HRP)-conjugated goat anti-rabbit immunoglobulin G (IgG) (111–035-003) and anti-mouse IgG (115–035-003) were purchased from Jackson ImmunoResearch Laboratories. CFTM 405 M-conjugated goat anti-mouse (20180) and CFTM 488A-conjugated goat anti-rabbit secondary Abs (20012) were purchased from Biotium.
Human platelet preparation
This study was approved by the Institutional Review Board of Shin Kong Wu Ho-Su Memorial Hospital (Approval No. 20151203 R) and conformed to the principles outlined in the Declaration of Helsinki. All volunteers provided informed consent. Human platelet suspensions were prepared as described previously [Citation62]. In brief, blood was drawn from healthy volunteers who had taken no medication during the preceding 2 weeks and then mixed with an acid-citrate-dextrose (A.C.D.; 56 mM sodium citrate [J.T.Baker, 6132–04-3], 65 mM citric acid [J.T.Baker, 5949–29-1], and 14 mM glucose [Sigma Aldrich, P5767]) solution (9:1, v:v). After centrifugation (120 × g, 10 min), the supernatant (platelet-rich plasma, PRP) was supplemented with prostaglandin E1 (PGE1, 0.5 mM; Sigma Aldrich, P5515) and heparin (6.4 IU/mL; Sigma Aldrich, H3149), and then incubated for 10 min at 37°C. After centrifugation (500 × g for 10 min), the platelet pellets were suspended in Tyrode’s solution (pH 7.3; 137 mM NaCl [Bionovas, AS0480], 2.4 mM KCl [J.T.Baker, 7447–40-7], 1 mM MgCl2 [Sigma Aldrich, M2393], 0.2 mM Na2HPO4 [J.T.Baker, 7558–79-4], 12 mM NaHCO3 [Sigma Aldrich, S5761], 5.5 mM glucose, 3.5 mg/mL bovine serum albumin (BSA) [Bionovas, AA0530]), and then PGE1 (0.5 µM), and heparin (6.4 IU/ml) were added. The mixture was incubated for 10 min at 37°C. After centrifugation of the suspensions at 500 × g for 10 min, washed platelets were suspended in Tyrode’s solution (containing 1 mM Ca2+; J.T.Baker, 10035–04-8).
Immunoblotting study
Washed platelets (1.2 × 10⁹/mL) were preincubated with the inhibitors (3-MA, Baf-A1, or compound C), and H2O2 was added subsequently for the indicated times (30–120 min). The reaction was stopped, and the platelets were immediately resuspended in 200 μL of a lysis buffer. Lysates were centrifuged at 5000 × g for 5 min. Samples containing 80 μg of protein were separated through 8% to 14% sodium dodecylsulfate-polyacrylamide gel electrophoresis; proteins were electrotransferred through semidry transfer (Bio-Rad, Hercules, CA, USA). Blots were blocked with TBST (pH 7.6; 10 mM Tris-base [Bionovas, AT0890], 100 mM NaCl [Bionovas, AS0480], 0.01% Tween 20 [Sigma Aldrich, P1379]) containing 5% BSA for 1 h and then probed with various primary antibodies. The membranes were then incubated with the HRP-conjugated anti-mouse or anti-rabbit IgG (diluted 1:3000 in TBST) for 1 h. Immunoreactive bands were detected using the ECL system. The ratios of semiquantitative results obtained by scanning reactive bands and quantifying optical density by using videodensitometry (Bio-Profil; Biolight Windows Application V2000.01, Vilber Lourmat, France).
Electron microscopy analysis
Human platelets were poured on microscopy slides and fixed with 2% paraformaldehyde (Electron Microscopy Sciences, 19200) and 2.5% glutaraldehyde (Sigma Aldrich, 1.04239) in 0.1 M cacodylate (Sigma Aldrich, C0250) for 2 h. Samples were washed 3 times with 0.1 M cacodylate buffer. Platelets were postfixed with 1% osmium tetroxide (Sigma Aldrich, 75633) for 1 h. After being washed with 0.1 M cacodylate buffer, platelets were dehydrated with 70% to 100% alcohol (Supelco, 1.00983). After the platelets were embedded, they were visualized on a scanning electron microscope (S-2400; Hitachi, Tokyo, Japan) and a transmission electron microscope (HT7700; Hitachi).
Deconvolution microscopy
For autophagy image acquisition, cells were imaged with a wide-field DeltaVision deconvolution microscope (GE Healthcare Life Science, Pittsburgh, USA). Both the microscope and camera were controlled by SoftWorX application suite. Platelets (3 × 10⁷/mL), attached to a poly-L-Lysine (Sigma Aldrich, P8920)-coated coverslip, were treated with or without H2O2 (100 µM) for 1 h. After treatment, the platelets were fixed with 4% paraformaldehyde for 10 min and washed 3 times with PBS buffer (pH 7.4; 1.37 M NaCl, 27 mM KCl, 18 mM KH2PO4, and 100 mM Na2HPO4). The platelets were then permeabilized with 0.1% Triton X-100 (Sigma Aldrich, X100) for 10 min and blocked with 5% BSA for 1 h. The platelets were labeled with anti-LC3 pAbs or anti-LAMP1 mAbs. Stacks of fluorescence images were deconvolved using SoftWorX (Applied Precision) and analyzed on VoloCITY (PerkinElmer).
Platelet-specific atg5−/− mice
C57BL/6-Tg(Pf4-cre)Q3Rsko/J (JAX 008535) and C57BL/6 mice were obtained from BioLasco (Taipei, Taiwan). B6.129S-Atg5< tm1Myok> (Atg5flox/flox, RBRC02975) mice were obtained from RIKEN BioResource Center (Ibaraki, Japan). Mice were maintained in the Laboratory Animal Center at Taipei Medical University, Taipei, Taiwan. All procedures were approved by the Affidavit of Approval of Animal Use Protocol-Taipei Medical University (LAC-2016-0276) and -Shin Kong Wu Ho-Su Memorial Hospital (Approval No. Most1060006), and were in accordance with the Guide for the Care and Use of Laboratory Animals (8th edition, 2011). Platelet-specific atg5−/− mice were generated by crossing Atg5flox/flox (Atg5f/f) mice (B6. 129S) with Pf4-Cre mice (C57BL/6) [Citation63,Citation64]. PCR was employed to genotype the Pf4-Cre mice, and Atg5 deficiency in the platelets was further confirmed through western blotting. The following primers were used for PCR identification: Primer 1, 5′-GAA TAT GAA GGC ACA CCC CTG AAA TG-3′; Primer 2, 5′-GTA CTG CAT AAT GGT TTA ACT CTT GC-3′; Primer 3, 5′-ACA ACG TCG AGC ACA GCT GCG CAA GG-3′; Primer 4, 5′-CCC ATA CAG CAC ACC TTT TG-3′; and Primer 5, 5′-TGC ACA GTC AGC AGG TT-3′.
Mice hematology analysis
WT, Atg5f/f, and atg5−/− mice (25–30 g, 8–10 weeks old) were anesthetized using a mixture containing 75% air and 3% isoflurane (PANION & BF Biotech Inc., AttaneTM) maintained in 25% oxygen; 200 μL of blood was then drawn through cardiac puncture into heparinized capillary tubes containing ethylenediamine tetraacetic acid (EDTA, 10 mM; Sigma Aldrich, E5134). Blood parameters were analyzed with an IDEXX Procyte Dx (IDEXX Laboratories; Westbrook, ME, USA).
Washed mouse platelet preparation and aggregation study
Mouse blood was collected through cardiac puncture also into a tube containing 100 µL of sodium citrate, followed by gentle mixing. After centrifugation at 180 × g for 5 min, PRP was obtained and mixed with A.C.D. (9:1, v:v). The platelet pellet was obtained after centrifugation at 1300 × g for 15 min, and it was resuspended in Tyrode’s solution. A Lumi-Aggregometer (Payton Associates, Scarborough, ON, Canada) was used to measure platelet aggregation, as described previously [Citation62]. Platelet suspensions (3.6 × 10⁸/mL) were stimulated using collagen (1 µg/mL) or α thrombin (0.02 U/mL) for 10 min; the extent of aggregation is expressed in light transmission units.
Fluorescein sodium-induced platelet thrombus formation in mesenteric microvessels of mice
Thrombus formation was assessed as described previously [Citation65]. Mice were anesthetized and the external jugular vein was cannulated with a polyethylene-10 tube for intravenously administering the dye. Venules (30–40 mm) were selected for irradiation at a wavelength of <520 nm to produce a microthrombus. After the administration of sodium fluorescein (15 mg/kg), the time required to occlude the microvessel through thrombus formation (occlusion time) was recorded.
ADP-induced acute pulmonary thrombosis in mice
This experiment was performed as described previously [Citation66]. In brief, mice were injected with ADP (1.4 g/kg) through the tail vein to induce acute pulmonary thrombosis. In each group, the mouse survival rate was determined at 1 h after injection. Mice that survived were euthanized in a CO2 chamber.
Tail bleeding time
Mice were anesthetized and bleeding was induced by severing the tail 3 mm from the tail tip, and the bleeding tail stump was immersed in saline. Successively, the bleeding time was continuously recorded until no sign of bleeding was observed for at least 10 s.
Metabolomics
Sample preparation
Human platelets were extracted with 100 μL of methanol (Macron chemicals, 67–56-1):H2O (Sigma Aldrich, W4502) (7:3, v:v); 2 freeze–thaw steps were applied, and then the samples were vortexed. After centrifugation (12,000 × g, 15 min at 4°C) the supernatant was recovered, dried using a speed vacuum, and reconstituted in 50 μL of acetonitrile/H2O (1:1, v:v).
Chromatography
Chromatography analysis was performed on a Waters Acquity UPLC (ultra-performance liquid chromatography) system. A BEH Amide column (2.1 mm × 100 mm, 1.7 μm; WatersTM, 186004801) was used for compound separation. The column temperature was maintained at 45°C and elution was performed at a flow rate of 0.4 mL/min; the injection volume was 3.5 μL. The mobile phase consisted of (A) water with 0.1% formic acid (Honeywell, 56302) and (B) acetonitrile with 0.1% formic acid. The gradient profile used for positive ionization detection was as follows: 0 to 0.1 min, 99% B; 0.1 to 7 min, 99% to 30% B; 7 to 7.1 min, 30% to 99% B; 7.1 to 10 min, 99% B. The eluent was directly introduced to the mass spectrometer without a split.
Mass spectrometry
Mass spectrometry was performed on a SYNAPT G2 Q-TOF (Waters MS Technologies, Manchester, UK). The parameters of the mass spectrometer for positive ionization mode detection were as follows: desolvation gas, 900 L/h; desolvation temperature, 550°C; cone gas, 15 L/h; source temperature, 120°C; capillary voltage, 2.8 kV; cone voltage, 40 V and TOF MS scan range, 50 to 1000 m/z. The data acquisition rate was set to 1.2 s, with a 0.02-s interscan delay using Waters MSE acquisition mode, with full exact masses collected simultaneously by rapidly alternating between 2 functions. Function 1 acquired data with a low collision energy of 4 and 2 eV for trap and transfer collision cell, respectively, and function 2 acquired data with a transfer collision energy ramp of 15 to 25 eV. All analyses were acquired using the lockspray to ensure accuracy and reproducibility. Leucine-enkephalin (m/z 556.2771) was used as the lockmass at a concentration of 1 ng/μL and flow rate of 5 μL/min. Data were collected in continuum mode, and the lockspray frequency was set at 20 s. All data acquisition was controlled by Waters MassLynx (version 4.1).
Determination of sphingomyelin levels by ELISA kit and LC-MS/MS analysis
For the ELISA assay, the levels of sphingomyelin (SM) were determined by using a Sphingomyelin Assay Kit (Abcam, ab138877). Washed platelets were treated with H2O2 (100 µM) for 1 h in the absence or presence of compound C. After the reactions, the platelets were resuspended in 100 μL of a lysis buffer, and lysates were then centrifuged at 12,000 × g for 5 min to obtain the supernatant. The levels of SM in supernatants were measured according to the manufacturer’s recommended protocol. Fluorescence intensity was detected at Ex/Em = 540/590 nm using a Synergy H1 microplate reader (BioTek, Winooski, VT, USA).
For the LC-MS/MS analysis, samples were extracted by using a Bligh and Dyer method for lipid extraction with slightly modification [Citation67,Citation68]. Washed platelets (1 × 10⁶/mL) were treated with H2O2 (100 µM) for 1 h in the absence or presence of compound C. After the reactions, the platelets were resuspended in 80 μL of water, and then extracted with chloroform (Bionovas, AC0750)/methanol mixture (1:2, by volume; 300 μL) containing butylate hydrooxytoluene (BHT, 50 μg/Ml; Sigma Aldrich, B1378) and the internal standards (Ceramide C17; Avanti Polar Lipids, AV860517). After vortexing for 20 min, chloroform (100 μL) and water (100 μL) containing 0.9% NaCl were added. After mixing thoroughly, the samples were then centrifuged for 5 min at 2000 × g. At the end of the process, the organic (lower) phase was collected and dried under a stream of N2. The residues were re-dissolved in chloroform/methanol mixture (1:1, by volume; 200 μL). After mixing, the samples were transferred to glass vials for analyses.
The analyses of sphingomyelin (SM) were carried out on a Waters Acquity UPLC system coupled with a Waters Xevo TQ-XS triple quadrupole mass spectrometer. Chromatographic separation was achieved using an Acquity UPLC CSH C18 column (130 Å, 1.7 μm, 2.1 × 100 mm) with an Acquity UPLC CSH C18 VanGuard pre-column (130 Å, 1.7 μm, 2.1 × 5 mm) eluted at a flow rate of 400 μL/min. The mobile phase consisted of 30 mM ammonium formate and 0.1% formic acid in acetonitrile/water (60:40, v:v) as solvent A and 30 mM ammonium formate and 0.1% formic acid in 2-propanol/acetonitrile (90:10, v:v) as solvent B. The gradient profile was as follows: 0 to 1 min, 50% B; 1 to 4.5 min, 50% to 70% B; 4.5 to 8 min, 70% to 100% B; 8 to 8.1 min, 100% to 50% B; 8.1 to 10 min, 50% B. The total run time for analysis was 10 min, and the injection volume was 5 μL.
The mass spectrometer was operated in the positive ESI mode. The parameters were as follows: desolvation gas, 1000 L/h; desolvation temperature, 500°C; cone gas, 150 L/h; source temperature, 150°C; capillary voltage, 2.5 kV; cone voltage, 20 V for SM 16:0 (d18:1/16:0) and SM 18:0 (d18:1/18:0) and 30 V for SM 24:0 (d18:1/24:0). Data were acquired by Waters MassLynx (version 4.2). Precursor-to-product ion transitions of m/z 703.42 → 184.01 for SM 16:0 (d18:1/16:0), of m/z 731.44 to 184.01 for SM18:0 (d18:1/18:0), of m/z 815.53 to 184.01 for SM 24:0 (d18:1/24:0), and of m/z 552.60→264.28 for Ceramide C17 were used for multiple reaction monitoring. Concentrations of the calibration standards, quality controls, and unknowns were evaluated by Waters MassLynx software (version 4.2).
Data analysis
The experimental results are expressed as means ± standard error of the mean (S.E.M.) and are accompanied by the number of observations (n). Values of n refer to the number of experiments, each of which was conducted with different blood donors. All experimental results were assessed using analysis of variance (ANOVA). If ANOVA results indicated significant differences in the group means, each group was compared using the Newman–Keuls method. Student t test was performed to determine the significant differences between the data for each group in the in vivo experiments. Comparison results with a P value of < 0.05 were considered statistically significant.
Supplemental Material
Download Zip (6.6 MB)Acknowledgments
We thank Noboru Mizushima, from Graduate School of Medicine, the University of Tokyo for generously providing B6.129S-Atg5<tm1Myok> (Atg5flox/flox) mice. This manuscript was edited by Wallace Academic Editing.
Disclosure statement
No potential conflict of interest was reported by the authors.
Supplementary material
Supplemental data for this article can be accessed here.
Additional information
Funding
Related Research Data
References
- Nieswandt B, Pleines I, Bender M. Platelet adhesion and activation mechanisms in arterial thrombosis and ischaemic stroke. J Thromb Haemost. 2011;9(Suppl 1):92–104. PMID: 21781245.
- Koupenova M, Kehrel BE, Corkrey HA, et al. Thrombosis and platelets: an update. Eur Heart J. 2017;38:785–791. PMID: 28039338.
- George JN. Platelets. Lancet. 2000;355:1531–1539. PMID: 10801186.
- Van Der Meijden PEJ, Heemskerk JWM. Platelet biology and functions: new concepts and clinical perspectives. Nat Rev Cardiol. 2019;16:166–179. PMID: 30429532.
- Grozovsky R, Hoffmeister KM, Falet H. Novel clearance mechanisms of platelets. Curr Opin Hematol. 2010;17:585–589. PMID:PMC4303238.
- He C, Klionsky DJ. Regulation mechanisms and signaling pathways of autophagy. Annu Rev Genet. 2009;43:67–93. PMID:PMC2831538.
- Morishita H, Mizushima N. Diverse Cellular Roles of Autophagy. Annu Rev Cell Dev Biol. 2019;35:453–475. PMID: 31283377.
- Feng W, Chang C, Luo D, et al. Dissection of autophagy in human platelets. Autophagy. 2014;10:642–651. PMID:PMC4091151.
- Ouseph MM, Huang Y, Banerjee M, et al. Autophagy is induced upon platelet activation and is essential for hemostasis and thrombosis. Blood. 2015;126:1224–1233. PMID:PMC4559933.
- Lee SH, Du J, Stitham J, et al. Inducing mitophagy in diabetic platelets protects against severe oxidative stress. EMBO Mol Med. 2016;8:779–795. PMID:PMC4931291.
- Zhang W, Ren H, Xu C, et al. Hypoxic mitophagy regulates mitochondrial quality and platelet activation and determines severity of I/R heart injury. Elife. 2016;5. PMID:PMC5214169. DOI:https://doi.org/10.7554/eLife.21407.
- Li X, He S, Ma B. Autophagy and autophagy-related proteins in cancer. Mol Cancer. 2020;19:12. PMID:PMC6975070.
- Liu Y, Hu M, Luo D, et al. Class III PI3K positively regulates platelet activation and thrombosis via PI(3)P-directed function of NADPH oxidase. Arterioscler Thromb Vasc Biol. 2017;37:2075–2086. PMID: 28882875.
- Wang CY, Ma S, Bi SJ, et al. Enhancing autophagy protects platelets in immune thrombocytopenia patients. Ann Transl Med. 2019;7:134. PMID:PMC6511561.
- Garg AD, Dudek AM, Ferreira GB, et al. ROS-induced autophagy in cancer cells assists in evasion from determinants of immunogenic cell death. Autophagy. 2013;9:1292–1307. PMID: 23800749.
- Rao Y, Wan Q, Su H, et al. ROS-induced HSP70 promotes cytoplasmic translocation of high-mobility group box 1b and stimulates antiviral autophagy in grass carp kidney cells. J Biol Chem. 2018;293:17387–17401. PMID:PMC6231130.
- Chen Y, McMillan-Ward E, Kong J, et al. Oxidative stress induces autophagic cell death independent of apoptosis in transformed and cancer cells. Cell Death Differ. 2008;15:171–182. PMID: 17917680.
- Pignatelli P, Pulcinelli FM, Lenti L, et al. Hydrogen peroxide is involved in collagen-induced platelet activation. Blood. 1998;91:484–490. PMID: 9427701.
- Dayal S, Wilson KM, Motto DG, et al. Hydrogen peroxide promotes aging-related platelet hyperactivation and thrombosis. Circulation. 2013;127:1308–1316. PMID:PMC4447136.
- Forman HJ, Bernardo A, Davies KJ. What is the concentration of hydrogen peroxide in blood and plasma? Arch Biochem Biophys. 2016;603:48–53. PMID: 27173735.
- Droge W. Free radicals in the physiological control of cell function. Physiol Rev. 2002;82:47–95. PMID: 11773609.
- Halliwell B, Clement MV, Long LH. Hydrogen peroxide in the human body. FEBS Lett. 2000;486:10–13. PMID: 11108833.
- Klionsky DJ, Abdelmohsen K, Abe A, et al. Guidelines for the use and interpretation of assays for monitoring autophagy (3rd edition). Autophagy. 2016;12:1–222. PMID:PMC4835977.
- Mauvezin C, Neufeld TP. Bafilomycin A1 disrupts autophagic flux by inhibiting both V-ATPase-dependent acidification and Ca-P60A/SERCA-dependent autophagosome-lysosome fusion. Autophagy. 2015;11:1437–1438. PMID:PMC4590655.
- Hayashi-Nishino M, Fujita N, Noda T, et al. A subdomain of the endoplasmic reticulum forms a cradle for autophagosome formation. Nat Cell Biol. 2009;11:1433–1437. PMID: 19898463.
- Ren Y, Shen HM. Critical role of AMPK in redox regulation under glucose starvation. Redox Biol. 2019;25:101154. PMID:PMC6859544.
- Herzig S, Shaw RJ. AMPK: guardian of metabolism and mitochondrial homeostasis. Nat Rev Mol Cell Biol. 2018;19:121–135. PMID:PMC5780224.
- Zhao Y, Hu X, Liu Y, et al. ROS signaling under metabolic stress: cross-talk between AMPK and AKT pathway. Mol Cancer. 2017;16:79. PMID:PMC5390360.
- Hwang JY, Gertner M, Pontarelli F, et al. Global ischemia induces lysosomal-mediated degradation of mTOR and activation of autophagy in hippocampal neurons destined to die. Cell Death Differ. 2017;24:317–329. PMID:PMC5299717.
- Matsushita M, Suzuki NN, Obara K, et al. Structure of Atg5.Atg16, a complex essential for autophagy. J Biol Chem. 2007;282:6763–6772. PMID: 17192262.
- Romanov J, Walczak M, Ibiricu I, et al. Mechanism and functions of membrane binding by the Atg5-Atg12/Atg16 complex during autophagosome formation. Embo J. 2012;31:4304–4317. PMID:PMC3501226.
- Rabinowitz JD, White E. Autophagy and metabolism. Science. 2010;330:1344–1348. PMID:PMC3010857.
- Saito T, Kuma A, Sugiura Y, et al. Autophagy regulates lipid metabolism through selective turnover of NCoR1. Nat Commun. 2019;10:1567. PMID:PMC6450892.
- Ho TT, Warr MR, Adelman ER, et al. Autophagy maintains the metabolism and function of young and old stem cells. Nature. 2017;543:205–210. PMID:PMC5344718.
- Goldkorn T, Balaban N, Shannon M, et al. H2O2 acts on cellular membranes to generate ceramide signaling and initiate apoptosis in tracheobronchial epithelial cells. J Cell Sci. 1998;111(Pt 21):3209–3220. PMID: 9763515.
- Levy M, Khan E, Careaga M, et al. Neutral sphingomyelinase 2 is activated by cigarette smoke to augment ceramide-induced apoptosis in lung cell death. Am J Physiol Lung Cell Mol Physiol. 2009;297:L125–133. PMID:PMC2711801.
- Back MJ, Ha HC, Fu Z, et al. Activation of neutral sphingomyelinase 2 by starvation induces cell-protective autophagy via an increase in Golgi-localized ceramide. Cell Death Dis. 2018;9:670. PMID:PMC5986760.
- Laker RC, Drake JC, Wilson RJ, et al. Ampk phosphorylation of Ulk1 is required for targeting of mitochondria to lysosomes in exercise-induced mitophagy. Nat Commun. 2017;8:548. PMID:PMC5601463.
- Tian W, Li W, Chen Y, et al. Phosphorylation of ULK1 by AMPK regulates translocation of ULK1 to mitochondria and mitophagy. FEBS Lett. 2015;589:1847–1854. PMID: 25980607.
- Wang X, Fu YF, Liu X, et al. ROS Promote Ox-LDL-Induced Platelet Activation by Up-Regulating Autophagy Through the Inhibition of the PI3K/AKT/mTOR Pathway. Cell Physiol Biochem. 2018;50:1779–1793. PMID: 30384368.
- Aslan JE, Tormoen GW, Loren CP, et al. S6K1 and mTOR regulate Rac1-driven platelet activation and aggregation. Blood. 2011;118:3129–3136. PMID:PMC3175787.
- Yang J, Zhou X, Fan X, et al. mTORC1 promotes aging-related venous thrombosis in mice via elevation of platelet volume and activation. Blood. 2016;128:615–624. PMID:PMC5097363.
- Randriamboavonjy V, Isaak J, Fromel T, et al. AMPK alpha2 subunit is involved in platelet signaling, clot retraction, and thrombus stability. Blood. 2010;116:2134–2140. PMID: 20558612.
- Onselaer MB, Oury C, Hunter RW, et al. The Ca(2+)/calmodulin-dependent kinase kinase beta-AMP-activated protein kinase-alpha1 pathway regulates phosphorylation of cytoskeletal targets in thrombin-stimulated human platelets. J Thromb Haemost. 2014;12:973–986. PMID: 24655923.
- Lepropre S, Kautbally S, Octave M, et al. AMPK-ACC signaling modulates platelet phospholipids and potentiates thrombus formation. Blood. 2018;132:1180–1192. PMID:PMC6238154.
- Liu Y, Park JM, Chang KH, et al. AMP-activated protein kinase mediates the antiplatelet effects of the Thiazolidinediones Rosiglitazone and Pioglitazone. Mol Pharmacol. 2016;89:313–321. PMID: 26643379.
- Hampton RY, Morand OH. Sphingomyelin synthase and PKC activation. Science. 1989;246:1050. PMID: 2555921.
- Cerbon J, Del Carmen Lopez-sanchez R. Diacylglycerol generated during sphingomyelin synthesis is involved in protein kinase C activation and cell proliferation in Madin-Darby canine kidney cells. Biochem J. 2003;373:917–924. PMID:PMC1223524.
- Basu S, Schultz AM, Basu M, et al. Enzymatic synthesis of galactocerebroside by a galactosyltransferase from embryonic chicken brain. J Biol Chem. 1971;246:4272–4279. PMID: 5090043.
- Van Der Bijl P, Strous GJ, Lopes-Cardozo M, et al. Synthesis of non-hydroxy-galactosylceramides and galactosyldiglycerides by hydroxy-ceramide galactosyltransferase. Biochem J. 1996;317(Pt 2):589–597. PMID:PMC1217527.
- Honke K, Tsuda M, Hirahara Y, et al. Molecular cloning and expression of cDNA encoding human 3ʹ-phosphoadenylylsulfate: galactosylceramide3ʹ-sulfotransferase. J Biol Chem. 1997;272:4864–4868. PMID: 9030544.
- Liu YY, Han TY, Giuliano AE, et al. Expression of glucosylceramide synthase, converting ceramide to glucosylceramide, confers adriamycin resistance in human breast cancer cells. J Biol Chem. 1999;274:1140–1146. PMID: 9873062.
- Basu S, Kaufman B, Roseman S. Enzymatic synthesis of ceramide-glucose and ceramide-lactose by glycosyltransferases from embryonic chicken brain. J Biol Chem. 1968;243:5802–5804. PMID: 5699063.
- Takizawa M, Nomura T, Wakisaka E, et al. cDNA cloning and expression of human lactosylceramide synthase. Biochim Biophys Acta. 1999;1438:301–304. PMID: 10320813.
- Ogretmen B. Sphingolipid metabolism in cancer signalling and therapy. Nat Rev Cancer. 2018;18:33–50. PMID:PMC5818153.
- Jiang W, Ogretmen B. Autophagy paradox and ceramide. Biochim Biophys Acta. 2014;1841:783–792. PMID:PMC3960371.
- Pattingre S, Bauvy C, Levade T, et al. Ceramide-induced autophagy: to junk or to protect cells? Autophagy. 2009;5:558–560. PMID:PMC3501009.
- Chen WF, Lee JJ, Chang CC, et al. Platelet protease-activated receptor (PAR)4, but not PAR1, associated with neutral sphingomyelinase responsible for thrombin-stimulated ceramide-NF-kappaB signaling in human platelets. Haematologica. 2013;98:793–801. PMID:PMC3640127.
- Merten M, Thiagarajan P. Role for sulfatides in platelet aggregation. Circulation. 2001;104:2955–2960. PMID: 11739312.
- Merten M, Beythien C, Gutensohn K, et al. Sulfatides activate platelets through P-selectin and enhance platelet and platelet-leukocyte aggregation. Arterioscler Thromb Vasc Biol. 2005;25:258–263. PMID: 15528476.
- Edsfeldt A, Duner P, Stahlman M, et al. Sphingolipids contribute to human atherosclerotic plaque inflammation. Arterioscler Thromb Vasc Biol. 2016;36:1132–1140. PMID: 27055903.
- Lin KH, Hsiao G, Shih CM, et al. Mechanisms of resveratrol-induced platelet apoptosis. Cardiovasc Res. 2009;83:575–585. PMID: 19423619.
- Hara T, Nakamura K, Matsui M, et al. Suppression of basal autophagy in neural cells causes neurodegenerative disease in mice. Nature. 2006;441:885–889. PMID: 16625204.
- Tiedt R, Schomber T, Hao-Shen H, et al. Pf4-Cre transgenic mice allow the generation of lineage-restricted gene knockouts for studying megakaryocyte and platelet function in vivo. Blood. 2007;109:1503–1506. PMID: 17032923.
- Lin KH, Kuo JR, Lu WJ, et al. Hinokitiol inhibits platelet activation ex vivo and thrombus formation in vivo. Biochem Pharmacol. 2013;85:1478–1485. PMID: 23473801.
- Lu WJ, Lee JJ, Chou DS, et al. A novel role of andrographolide, an NF-kappa B inhibitor, on inhibition of platelet activation: the pivotal mechanisms of endothelial nitric oxide synthase/cyclic GMP. J Mol Med (Berl). 2011;89:1261–1273. PMID: 21822619.
- Bligh EG, Dyer WJ. A rapid method of total lipid extraction and purification. Can J Biochem Physiol. 1959;37:911–917. PMID: 13671378.
- Basit A, Piomelli D, Armirotti A. Rapid evaluation of 25 key sphingolipids and phosphosphingolipids in human plasma by LC-MS/MS. Anal Bioanal Chem. 2015;407:5189–5198. PMID:PMC4471391.