
ABSTRACT
Zinc oxide nanoparticles (ZnONPs) hold great promise for biomedical applications. Previous studies have revealed that ZnONPs exposure can induce toxicity in endothelial cells, but the underlying mechanisms have not been fully elucidated. In this study, we report that ZnONPs can induce ferroptosis of both HUVECs and EA.hy926 cells, as evidenced by the elevation of intracellular iron levels, lipid peroxidation and cell death in a dose- and time-dependent manner. In addition, both the lipid reactive oxygen species (ROS) scavenger ferrostatin-1 and the iron chelator deferiprone attenuated ZnONPs-induced cell death. Intriguingly, we found that ZnONPs-induced ferroptosis is macroautophagy/autophagy-dependent, because the inhibition of autophagy with a pharmacological inhibitor or by ATG5 gene knockout profoundly mitigated ZnONPs-induced ferroptosis. We further demonstrated that NCOA4 (nuclear receptor coactivator 4)-mediated ferritinophagy (autophagic degradation of the major intracellular iron storage protein ferritin) was required for the ferroptosis induced by ZnONPs, by showing that NCOA4 knockdown can reduce the intracellular iron level and lipid peroxidation, and subsequently alleviate ZnONPs-induced cell death. Furthermore, we showed that ROS originating from mitochondria (mtROS) probably activated the AMPK-ULK1 axis to trigger ferritinophagy. Most importantly, pulmonary ZnONPs exposure caused vascular inflammation and ferritinophagy in mice, and ferrostatin-1 supplementation significantly reversed the vascular injury induced by pulmonary ZnONPs exposure. Overall, our study indicates that ferroptosis is a novel mechanism for ZnONPs-induced endothelial cytotoxicity, and that NCOA4-mediated ferritinophagy is required for ZnONPs-induced ferroptotic cell death.
Abbreviations: 3-MA: 3-methyladenine; ACTB: Actin beta; AMPK: AMP-activated protein kinase; ATG: Autophagy-related; BafA1: Bafilomycin A1; CQ: Choloroquine; DFP: Deferiprone; FACS: Fluorescence-activated cell sorting; Fer-1: Ferrostatin-1; FTH1: Ferritin heavy chain 1; GPX4: Glutathione peroxidase 4; GSH: Glutathione; IREB2/IRP2: Iron responsive element binding protein 2; LIP: Labile iron pool; MAP1LC3B/LC3B: Microtubule associated protein 1 light chain 3 beta; MTOR: Mechanistic target of rapamycin kinase; NCOA4: Nuclear receptor coactivator 4; NFE2L2/NRF2: Nuclear factor, erythroid 2 like 2; PGSK: Phen Green™ SK; ROS: Reactive oxygen species; siRNA: Small interfering RNA; SQSTM1/p62: Sequestosome 1; TEM: Transmission electron microscopy; ULK1: Unc-51 like autophagy activating kinase 1; ZnONPs: Zinc oxide nanoparticles.
Introduction
Zinc oxide nanoparticles (ZnONPs) have been widely applied to the production of cosmetic materials, rubber, coatings, and pigments because of their unique semiconducting, optical, and piezoelectric properties. ZnONPs have also exhibited promising biomedical applications because of their anticancer, antibacterial, antidiabetic, anti–inflammatory, drug delivery and bioimaging activities [Citation1]. Although the potent mechanisms for ZnONPs induced toxicity have been considered to be associated with zinc ions release, reactive oxygen species (ROS) production and genotoxicity [Citation2-5], the detailed toxicological profile and/or the mechanism of the cytotoxicity induced by ZnONPs have bot been fully elucidated [Citation6,Citation7].
Vascular endothelial cells form a one cell-thick walled layer (also called the vascular endothelium), which covers the luminal surface of blood vessels and functions as an autocrine and paracrine organ regulating vascular wall function. Vascular endothelial cell injury can lead to pathological changes in the cardiovascular system [Citation8]. Miller et al. [Citation9] reported that inhaled nanoparticles can translocate into the systemic circulation and accumulate at sites of vascular inflammation. Therefore, it is plausible that ZnONPs might enter vascular endothelial cells upon occupational or accidental inhalation exposure. Additionally, ZnONPs that directly contact vascular endothelial cells can act as drug-carrier or bioimaging reagents [Citation7]. ZnONPs exposure can cause toxic effects in vascular endothelial cells and might subsequently induce or aggravate vascular-related diseases. However, the underlying mechanisms of ZnONPs-induced endothelial dysfunction have yet to be elucidated.
Ferroptosis is a recently defined iron-dependent and non-apoptotic cell death that occurs as a consequence of lethal levels of lipid peroxidation [Citation10]. GPX4 (glutathione peroxidase 4), ACSL4 and SLC7A11 are critical regulators of ferroptotic cell death [Citation11]. Ferroptosis is tightly regulated by iron metabolism. Ferritin is the major intracellular iron storage protein complex, that comprises FTL (ferritin light chain) and FTH1 (ferritin heavy chain 1). Autophagy activation can degrade ferritin to increase intracellular iron levels, and subsequently result in oxidative injury by the Fenton reaction. NCOA4 (nuclear receptor coactivator 4) is a selective cargo receptor for the autophagic turnover of ferritin in lysosomes; this recycling process is termed ferritinophagy [Citation12].
Ferroptosis was first observed in cancer cells with oncogenic Ras mutations [Citation10]. In addition to neoplastic diseases [Citation13], ferroptosis has been shown to be involved in the pathological process of chemotherapy- and ischemia/reperfusion-induced cardiomyopathy [Citation14], acute renal failure [Citation15] and several neurologic diseases [Citation16]. Results from previous studies highlight the importance of ferroptosis in the pathogenesis of multiple diseases. In our previous study [Citation3], we found that ZnONPs induced-lung epithelial cell death is oxidative stress-dependent and non-apoptotic, and the features were similar to those of ferroptosis; moreover, it has been shown that the ferroptosis can be triggered by ultrasmall poly (ethylene glycol)-coated silica nanoparticles (<10 nm in diameter), which might have therapeutic potential [Citation17]. Hence, we hypothesized that ferroptosis is involved in ZnONPs-induced toxicity in vascular endothelial cells.
In the current study, we detected the toxic effects of ZnONPs in the HUVECs and EA.hy926 vascular endothelial cell line. We observed that ZnONPs triggered the ferroptosis of endothelial cells. Additionally, we revealed that ZnONPs-induced autophagy was essential for NCOA4-dependent ferritin degradation, which was directly linked to the ZnONPs-induced ferroptosis of endothelial cells. Furthermore, we found that the mtROS-AMPK-ULK1 signaling pathway is probably involved in regulating the ZnONPs-induced ferroptosis of endothelial cells. Our in vivo data also indicated that pulmonary exposure can induce vascular injury and ferritinophagy in mice, and supplementation with ferrostatin-1 remarkably reversed ZnONPs-induced vascular injury. Hence, our study provides novel insight into the toxicity of ZnONPs in vascular injuries.
Results
ZnONPs induce the ferroptosis of endothelial cells
Ferroptosis is a newly described form of regulated cell death characterized by intracellular iron overload and lipid peroxidation, and specific cell type might be sensitive or resistant to ferroptosis [Citation10,Citation18]. In this study, we sought to determine whether HUVECs are ferroptosis-sensitive or ferroptosis-resistant cells. Our results showed that erastin (a well-known ferroptosis inducer) [Citation19] induced cell death (Figure S1A), and decreased both intracellular antioxidant glutathione (GSH) levels (Figure S1B) and GPX4 (a protein that protects cells from lipid peroxidation) expression (Figure S1C-D) in a dose-dependent manner, suggesting that HUVECs are ferroptosis-sensitive cell.
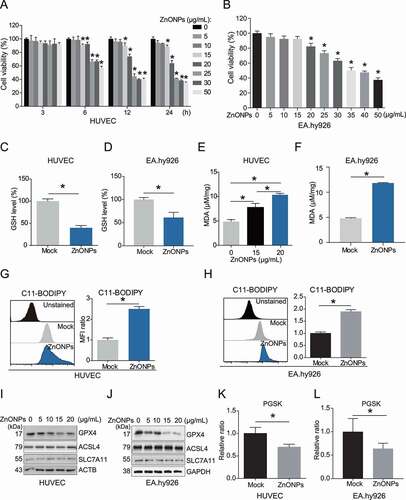
To determine whether ZnONPs can induce the ferroptosis of vascular endothelial cells, we detected cell viability after treatment with 0, 5, 10, 15, 20, 25, 30 or 50 μg/mL ZnONPs. The MTS results showed that ZnONPs can induce the death of HUVECs in a dose- and time-dependent manner (). Our data also showed that ZnONPs can induce the death of another endothelial cell line, EA.hy926 cells (). In particular, HUVECs and EA.hy926 cells displayed a significant decrease in cell viability after treatment with 20 or 25 μg/mL ZnONPs. Therefore, we chose 20 and/or 25 μg/mL ZnONPs for use in further experiments. Morphological observation showed that ZnONPs exposure can cause HUVECs rounding, shrinkage and plasma membrane rupture (Fig. S2A). A FACS (fluorescence-activated cell sorting) assay after staining with calcein-AM, a cell-permeant fluorescent probe that labels living cells, further confirmed that ZnONPs can induce HUVEC cell death (Fig. S2B). Subsequently, we showed that ZnONPs treatment decreased GSH levels (,D) and increased one of the final products of lipid peroxidation MDA (,F), or the intensity of lipid peroxidation sensor C11-BODIPY in HUVECs and EA.hy926 cells (,H). We also measured the levels of GPX4, ACSL4 and SLC7A11, which are related to lipid peroxidation. The western blot analysis results revealed that ZnONPs treatment downregulated GPX4 but did not affect ACSL4 or SLC7A11 protein levels (,J). Intracellular chelatable iron levels were also determined using the fluorescent indicator PGSK (Phen Green™ SK), the fluorescence of which is quenched by iron [Citation20]. ZnONPs exposure induced a decrease in the intensity of PGSK in HUVECs and EA.hy926 cells (,L). Moreover, we observed increases in cytosolic labile iron pool (LIP) in ZnONPs-treated HUVECs (Fig. S2C). IREB2/IRP2 (iron responsive element binding protein 2), a central posttranscriptional regulator of cellular and systemic iron metabolism [Citation21], was also increased in response to ZnONPs treatment (Fig. S2D-E). The mRNA expression levels of PTGS2 (a marker of ferroptosis) [Citation19] were increased upon ZnONPs treatment of the cells (Fig. S2F-G). In addition, the pan-caspase apoptosis inhibitor Z-VAD-FMK was unable to reverse ZnONPs-induced HUVEC cell death, suggesting that ZnONPs-induced cell death is non-apoptotic (Fig. S3). Collectively, these results indicate that ZnONPs can induce ferroptosis in HUVECs. Additionally, we also measured that the death of other cells induced by ZnONPs, including primary rat vascular smooth muscle cells (RVSMCs) (Fig. S4A), MRC-5 fibroblast cells (Fig. S4B) and monocyte THP-1 cell lines (Fig. S4C). Our results indicated that endothelial cell might be more susceptible to ZnONPs treatment than monocytes, smooth muscle cells or fibroblast.
Figure 1. ZnONPs induced ferroptosis in vascular endothelial cells. (A) MTS analysis of HUVECs treated with 0, 5, 10, 15, 20, 25, 30 and 50 μg/mL ZnONPs for 0, 3, 6, 12 and 24 h. (B) MTS analysis of EA.hy926 cells treated with 0, 5, 10, 15, 20, 25, 30 and 50 μg/mL ZnONPs for 24 h. (C,D) Relative GSH levels in (C) HUVECs or (D) EA.hy926 cells following ZnONPs (20 or 25 μg/mL) treatment for 24 h were determined. (E-F) MDA content in (E) HUVECs or (F) EA.hy926 cells following ZnONPs (15, 20 or 25 μg/mL) treatment for 24 h were determined. (G,H) Representative FACS data for C11-BODIPY labeling of (G) HUVECs or (H) EA.hy926 cells following ZnONPs (20 or 25 μg/mL) treatment for 24 h. Unstained, C11-BODIPY was not added. Statistical analysis of mean fluorescence intensity (MFI) of C11-BODIPY was shown. (I,J) Western blotting analysis of GPX4, ACSL4 and SLC7A11 expression in (I) HUVECs or (J) EA.hy926 cells treated with 0, 5, 10, 15 and 20 μg/mL ZnONPs for 24 h. (K,L) Representative FACS data for PGSK labeling of (K) HUVECs or (L) EA.hy926 cells following ZnONPs (20 or 25 μg/mL) treatment for 24 h. Unstained, PGSK was not added. Statistical analysis of MFI of PGSK was shown. All data are representative of at least three experiments, and the values are expressed as the mean± S.D. *P < 0.05 compared with the mock group
Inhibition of ferroptosis prevents the ZnONPs-induced endothelial cell death
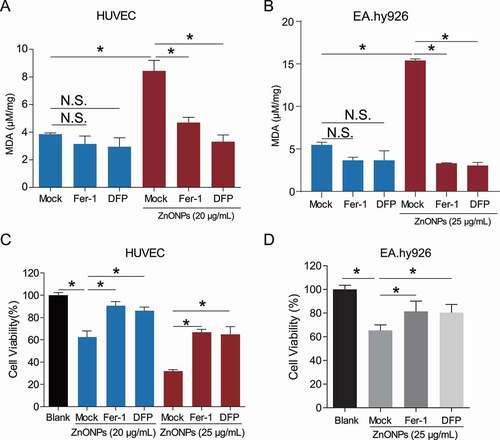
We next investigated whether inhibition of ferroptosis can prevent the endothelial cell death induced by ZnONPs. Ferrostatin-1 (Fer-1) was identified as the most potent inhibitor of the erastin-induced ferroptosis in HT-1080 cells (EC50 = 60 nM) [Citation10]; it inhibited lipid peroxidation but did not affect mitochondrial reactive oxygen species (ROS) formation or lysosomal membrane permeability [Citation22]. Deferiprone (DFP) is a hydroxypyrid-4-one compound utilized as a specific chelator of iron in biological systems and has been investigated for clinical use in diseases of systemic iron overload [Citation23]. MDA assays showed that both Fer-1 and DFP can inhibit MDA upregulation in ZnONPs-treated HUVECs () or EA.hy926 cells (). The MTS assays revealed that Fer-1 and DFP pretreatment significantly alleviated ZnONPs-induced death of HUVECs () or EA.hy926 cells (), indicating that ferroptosis was an important form of endothelial cell death induced by ZnONPs.
Figure 2. Ferroptosis inhibitors protected from ZnONPs induced vascular endothelial cell death. (A,B) MDA contents in (A) HUVECs or (B) EA.hy926 cells following ZnONPs (20 or 25 μg/mL) treatment with either Fer-1 (1 μM) or DFP (100 μM) for 24 h were measured. (C,D) MTS analysis of cell viability in (C) HUVECs or (D) EA.hy926 cells following ZnONPs (20 or 25 μg/mL) treatment with either Fer-1 (1 μM) or DFP (100 μM) for 24 h. The data are representative of three experiments, and the values are expressed as the mean± S.D. *P < 0.05 compared with the indicated groups, N.S., not significant
ZnONPs trigger autophagy in endothelial cells
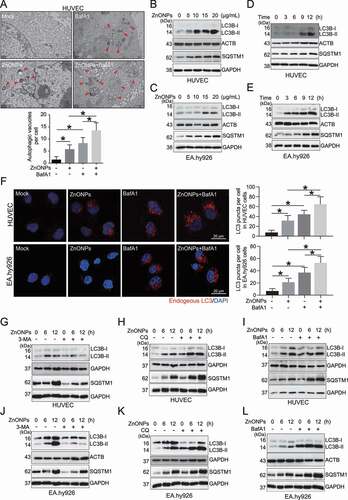
Ferroptosis is currently considered an autophagy-dependent cell death [Citation24,Citation25]. Thus, we investigated whether autophagy is activated during the ZnONPs-induced ferroptosis of endothelial cells. The TEM results showed that ZnONPs treatment increased the number of autophagic vacuoles (autophagosomes) in HUVECs (). The western blot analysis results showed that ZnONPs treatment also upregulated the protein level of LC3B-II (a marker of autophagy) in a dose-dependent (,C) and time-dependent (,E) manner. As the accumulation of LC3B-II may indicate autophagy activation or the impairment of lysosomal degradation, the LC3B-II protein level was detected with and without autophagy inhibitors. The immunofluorescence analysis showed that bafilomycin A1 (BafA1) pretreatment further increased the number of endogenous LC3 puncta in the ZnONPs-treated cells (). In addition, the western blot analysis results showed that pretreatment with 3-methyladenine (3-MA) (,J) decreased LC3B-II protein level, while chloroquine (CQ) (,K) and BafA1 (,L) further increased the LC3B-II protein level in ZnONPs-treated HUVECs and EA.hy926 cells, suggesting that ZnONPs exposure activates autophagy in endothelial cells. Notably, the autophagic substrate SQSTM1/p62 was increased in a dose- and time-dependent manner in cells treated with ZnONPs (–E); however, when the cells were cotreated with autophagosomes and lysosomes fusion inhibitors CQ or BafA1, a further increase in SQSTM1 was observed. The autophagosome formation inhibitor 3-MA caused a decrease in SQSTM1 (–L), suggesting that SQSTM1 underwent autophagy degradation, at least to some extent. We provide plausible explanations for the increase of SQSTM1 in the Discussion section.
Figure 3. ZnONPs induced autophagy activation in vascular endothelial cells. (A) Representative TEM images of autophagic vacuole in HUVECs following ZnONPs (20 μg/mL) treatment with or without BafA1 (100 nM) for 24 h. Red arrows indicate autophagic vacuole and the autophagic vacuoles per cell was calculated. Scale bar: 1 μm. (B-C) Western blotting analysis LC3B-I/II and SQSTM1 expression levels in (B) HUVECs (C) EA.hy926 cells treated with 0, 5, 10, 15 and 20 μg/mL ZnONPs for 24 h. (D-E) Western blotting analysis LC3B-I/II expression in (D) HUVECs (E) EA.hy926 cells treated with 20 μg/mL ZnONPs for 0, 3, 6 and 12 h. (F) HUVECs or EA.hy926 cells were treated either with BafA1 (100 nM), ZnONPs (20 μg/mL), or BafA1 plus with ZnONPs for 24 h. Confocal images were obtained after formalin fixation of cells (scale bar: 10 μm). Red signal indicated endogenous LC3, nuclei were counterstained with DAPI (blue). Images are representative of three independent experiments. The LC3 puncta per cell in indicated conditions were calculated. (G,J) Western blotting analysis LC3B-I/II and SQSTM1 expression levels in (G) HUVECs or (J) EA.hy926 cells following ZnONPs (20 μg/mL) treatment with or without 3-MA (5 mM) for 0, 6 or 12 h. (H,K) Western blotting analysis LC3B-I/II and SQSTM1 expression levels in (H) HUVECs or (K) EA.hy926 cells following ZnONPs (20 μg/mL) treatment with or without CQ (5 μM) for 0, 6 or 12 h. (I,L) Western blotting analysis LC3B-I/II and SQSTM1 expression levels in (I) HUVECs or (L) EA.hy926 cells following ZnONPs (20 μg/mL) treatment with or without BafA1 (100 nM) for 0, 6 or 12 h. The data are representative of three experiments and the values are expressed as the mean± S.D. *P < 0.05 compared with the indicated groups
Autophagy activation is required for the ferroptosis of endothelial cells induced by ZnONPs
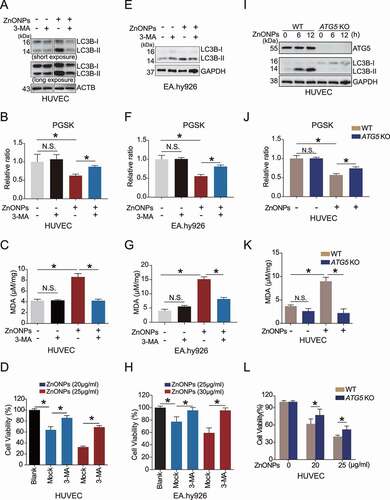
To clarify the relationship between autophagy and ZnONPs-induced ferroptosis, the pharmacological inhibitor 3-MA was applied to inhibit autophagy in HUVECs () and EA.hy926 cells (). FACS assays revealed that 3-MA pretreatment alleviated ZnONPs-induced iron overload in the HUVECs ( and Fig. S5A) and EA.hy926 cells (). MDA assays showed that 3-MA can inhibit MDA upregulation induced by ZnONPs exposure of HUVECs () and EA.hy926 cells (). MTS assays demonstrated that 3-MA reduced ZnONPs-induced cell death induced in HUVECs () and EA.hy926 cells (). Moreover, we showed that knockout of ATG5 (which plays a vital role in autophagy regulation) significantly decreased the elevation of LC3B-II/I (), and alleviated ZnONPs-induced iron overload ( and Fig. S5B) and MDA accumulation in HUVECs (). Further, the MTS assays revealed that knocking out ATG5 attenuated the ZnONPs-induced HUVEC cell death (). These data indicate that autophagy activation is required for the ZnONPs-induced ferroptosis of endothelial cells.
Figure 4. Inhibition of autophagy ameliorated ZnONPs-induced ferroptosis in vascular endothelial cells. (A,E) Western blotting analysis of LC3B-I/II expression in (A) HUVECs or (E) EA.hy926 cells following ZnONPs (20 μg/mL) treatment with or without 3-MA (5 mM) for 24 h. (B,F) Relative ratio of PGSK in (B) HUVECs or (F) EA.hy926 cells following ZnONPs (20 or 25 μg/mL) treatment with or without 3-MA (5 mM) for 24 h were determined. (C,G) Relative MDA content in (C) HUVECs or (G) EA.hy926 cells following ZnONPs (20 or 25 μg/mL) treatment with or without 3-MA (5 mM) for 24 h were measured. (D,H) MTS analysis of cell viability in (D) HUVECs or (H) EA.hy926 cells following ZnONPs (20 or 25 μg/mL) treatment with or without 3-MA (5 mM) for 24 h. (I) Western blotting analysis ATG5 and LC3B-I/II expression in wild-type (WT) or ATG5 knockout (KO) HUVECs treated with mock or ZnONPs (20 μg/mL). (J) Relative ratio of PGSK in WT or ATG5 KO HUVECs treated with mock or ZnONPs were determined. (K) MDA content in WT or ATG5 KO HUVECs treated with mock or ZnONPs for 24 h were measured. (L) MTS analysis of WT or ATG5 KO HUVECs treated with mock or ZnONPs for 24 h were measured. The data are representative of three experiments, and the values are expressed as the mean± S.D. *p < 0.05 compared with the indicated groups, N.S., not significant
NCOA4-mediated degradation of ferritin is essential for the ferroptosis of endothelial cells induced by ZnONPs
It has been demonstrated that the autophagic degradation of ferritin (also known as ferritinophagy) can promote ferroptosis, and NCOA4 is a selective cargo receptor that mediates ferritin degradation in lysosomes [Citation12,Citation26,Citation27]. Herein, we investigated whether the NCOA4-mediated degradation of ferritin is associated with the ZnONPs-induced ferroptosis of endothelial cells. The western blot analysis results revealed that ZnONPs exposure induced decrease in FTH1, but an increasing tendency followed by decreased expression of NCOA4 in HUVECs (,B) and EA.hy926 cells (,D). The decrease in FTH1 was not due to the decrease in FTH1 mRNA expression levels in response to ZnONPs treatment (Fig. S6A-B). Inhibition of autophagy with 3-MA (,H), BafA1 (,I) or CQ (,J) significantly increased the expression levels of FTH1 and NCOA4. The immunofluorescence analysis showed that treatment with BafA1 increased colocalization of endogenous FTH1 and LC3 (). The immunoprecipitation analysis also showed that BafA1 caused increase of the amount of FTH1 bound with NCOA4 (). Moreover, we found that ATG5 KO led to the elevation of FTH1 and SQSTM1 in response to ZnONPs espouse (), suggesting autophagic turnover of FTH1 during ZnONPs exposure. Furthermore, NCOA4 knockdown inhibited ZnONPs-induced ferritin degradation in HUVECs () and EA.hy926 cells (). Additionally, we found that NCOA4 knockdown alleviated ZnONPs-induced MDA upregulation (,E) and cell death (,F). Taken together, these results indicated that ZnONPs induced NCOA4-mediated autophagic-dependent degradation of FTH1, which was critical for the ZnONPs-induced ferroptotic death of endothelial cells.
Figure 5. ZnONPs exposure led to ferritinophagy in vascular endothelial cells. (A,C) Western blotting analysis NCOA4 and FTH1 expression in (A) HUVECs or (C) EA.hy926 cells treated with 0, 5, 10, 15 and 20 μg/mL ZnONPs for 24 h. (B,D) Western blotting analysis NCOA4 and FTH1 expression in (B) HUVECs or (D) EA.hy926 cells treated with 20 μg/mL ZnONPs for 0, 3, 6, 9 or 12 h. (E,H) Western blotting analysis of FTH1 and NCOA4 expression levels in (E) HUVECs or (H) EA.hy926 cells following ZnONPs (20 μg/mL) treatment with or without 3-MA (5 mM) for 0, 6, or 12 h. (F,I) Western blotting analysis of FTH1 and NCOA4 expression levels in (F) HUVECs or (I) EA.hy926 cells following ZnONPs (20 μg/mL) treatment with or without BafA1 (100 nM) for 0, 6, or 12 h. (G,J) Western blotting analysis of FTH1 and NCOA4 expression levels in (G) HUVECs or (J) EA.hy926 cells following ZnONPs (20 μg/mL) treatment with or without CQ (5 μM) for 0, 6, or 12 h. (K) Colocalization of endogenous FTH1 (green signal) and LC3 (red signal) in HUVECs following ZnONPs (20 μg/mL) treatment with or without BafA1 (100 nM) for 24 h were determined by immunofluorescence analysis. Nuclei were counterstained with DAPI (blue signal). Images are representative of three independent experiments. Note that the white arrows indicated possible colocalization of FTH1 and LC3. (L) Immunoprecipitation analysis of NCOA4-FTH1 formation in NCOA4-MYC overexpression HUVECs following ZnONPs (20 μg/mL) treatment with or without BafA1 (100 nM) for 24 h. (M) FTH1 and SQSTM1 expression levels in WT or ATG5 KO HUVECs following ZnONPs (20 μg/mL) treatment for 0, 6 or 12 h were determined. The data are representative of three experiments
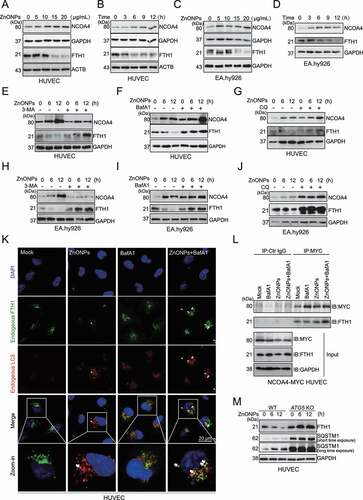
Figure 6. NCOA4 knockdown rescued ferroptosis induced by ZnONPs in vascular endothelial cells. HUVECs or EA.hy926 cells were transfected with 75 nM negative control siRNA (si-NC) or specific NCOA4 siRNA (si-NCOA4) for 48 h before ZnONPs (20 or 25 μg/mL) exposure. (A,D) Western blotting analysis NCOA4 and FTH1 expression was performed in (A) HUVECs or (D) EA.hy926 cells treated with ZnONPs for 24 h. (B,E) MDA contents were measured in (B) HUVECs or (E) EA.hy926 cells treated with ZnONPs for 24 h. (C,F) MTS analysis was performed in (C) HUVECs or (F) EA.hy926 cells treated with ZnONPs for 24 h. The data are representative of three experiments, and the values are expressed as the mean± S.D. *P < 0.05 compared with the indicated groups, N.S., not significant
The PRKAA/AMPK-ULK1 axis is associated with ferritinophagy activation induced by ZnONPs in endothelial cells
We next wanted to identity the regulator of ferritinophagy activation in response to ZnONPs exposure of endothelial cells. AMP-activated protein kinase (AMPK) and MTOR (mechanistic target of rapamycin kinase) are key regulators of autophagy activation through modulating ULK1 (unc-51 like autophagy activating kinase 1) [Citation28]. The western blot analysis results showed that ZnONPs exposure induced robust elevation of p-PRKAA (Thr172) and p-ULK1 (Ser555). We also determined the levels of downstream signaling regulators of autophagy induction following AMPK activation. Our results indicated that RB1CC1/FIP200, ATG7, ATG5 and BECN1/Beclin-1 were upregulated upon ZnONPs treatment of HUVECs (Fig. S7A) and EA.hy926 cells (Fig. S7B); in addition, a slight increase in p-MTOR (Ser2448) was observed in the HUVECs () and EA.hy926 cells (). The phosphorylation of downstream factors of the MTOR signaling pathway, such as p-ULK1 (Ser757), p-EIF4EBP1 (Thr37/46) and p-RPS6KB1/p70 S6 kinase (Thr389) were determined. Consistent with the result of p-MTOR (Ser2448) observation, these factors showed a tendency to increase (Fig. S7C-D). It is plausible that zinc ions caused the upregulation of p-AKT (Ser473) and were critical for the elevation of p-MTOR (Ser2448) and its downstream factors (Fig. S7C-D). However, the MTOR-dependent and MTOR-independent autophagy inducers rapamycin and lithium chloride (LiCl) had minimal influences on the cell death induced by ZnONPs exposure (Fig. S8), suggesting that MTOR signaling might not be the major contributor to ZnONPs-induced endothelial cell death. Nevertheless, the role and mechanism of MTOR signaling in endothelial cell death induced by ZnONPs should be further investigated.
Figure 7. AMPK-ULK1 axis was probably involved in ZnONPs-induced ferritinophagy. (A-B) Western blotting analysis of p-MTOR, MTOR, p-PRKAA, PRKAA, p-ULK1 and ULK1 expression in (A) HUVECs or (B) EA.hy926 cells treated with 0, 5, 10, 15 and 20 μg/mL ZnONPs for 24 h. (C-D) The knockdown efficacy of siRNA against (C) AMPK or (D) ULK1 in HUVECs was determined by western blot analysis. (E,F) The levels of (E) C11-BODIPY or (F) PGSK in negative control knockdown, AMPK knockdown or ULK1 knockdown HUVECs following ZnONPs (20 μg/mL) treatment for 24 h were determined by FACS analysis. The values of MFI of C11-BODIPY and PGSK in each group were presented. (G) FTH1 and LC3B-I/II expression level in negative control knockdown, AMPK knockdown or ULK1 knockdown HUVECs following ZnONPs (20 μg/mL) treatment for 24 h were determined by western blot analysis. (H) MTS analysis of negative control knockdown (si-NC), AMPK knockdown or ULK1 knockdown HUVECs following ZnONPs (20 μg/mL) treatment for 24 h. (I) NCOA4 expression level in shRNA-control or shRNA-mediated NCOA4 stable knockdown HUVECs were determined. (J) MTS analysis of negative control knockdown, AMPK knockdown or ULK1 knockdown in shRNA-control or shNCOA4 HUVECs following ZnONPs (20 μg/mL) treatment for 24 h. The data are representative of three experiments, and the values are expressed as the mean± S.D. *P < 0.05 compared with the indicated groups, N.S., not significant
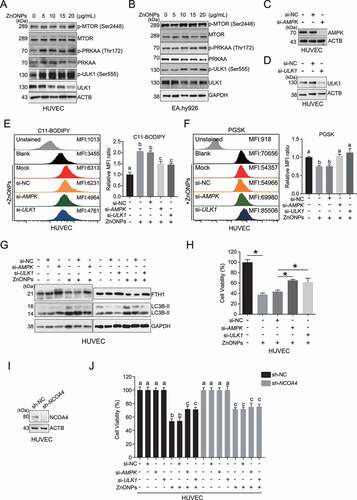
To verify whether the upregulation of AMPK and activation of ferritinophagy and ferroptosis are causally linked, we performed siRNA-mediated AMPK and ULK1 knockdown in HUVECs (,D). AMPK and ULK1 knockdown significantly decreased lipid peroxidation () and iron overload (), reversed the degradation of FTH1 (), and attenuated the cell death induced by ZnONPs (). More importantly, our results indicated that the effect of AMPK-ULK1 axis-mediated ferroptotic cell death might be mediated mainly through NCOA4, since the viability of HUVECs with stable NCOA4 knockdown was not profoundly changed with or without PRKAA/AMPK or ULK1 knockdown in response to ZnONPs (,J). Collectively, our results indicate that the AMPK-ULK1 axis is probably associated with the ferritinophagy activation induced by ZnONPs in endothelial cells.
Mitochondrial damage and oxidative stress might be upstream regulators of AMPK-ULK1 axis activation
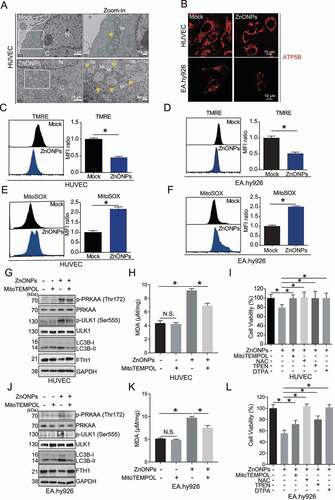
Then, we tried to explore the underlying mechanism for the activation of the AMPK-ULK1 axis induced by ZnONPs. Since ferroptosis is a type of ROS-dependent regulated cell death and mitochondria are generally considered as the primary sources of ROS production, we investigated whether mitochondria were damaged upon ZnONPs treatment. TEM observations revealed that ZnONPs treatment caused swollen mitochondria characterized by severely disrupted cristae (). After staining for the mitochondrial matrix protein maker ATP5B (ATP synthase F1 subunit beta), we found that the shape of mitochondria changed from tubular to donut or blob forms in response ZnONPs exposure of endothelial cells (), indicating that mitochondrial dysfunction was induced by ZnONPs [Citation29]. We also found that ZnONPs exposure caused significant mitochondrial depolarization in HUVECs () and EA.hy926 cells (), as detected by TMRE, a fluorescent indicator of mitochondrial membrane potential. FACS results showed that ZnONPs exposure increased mtROS production in HUVECs () and EA.hy926 cells (), as detected by MitoSOX, a fluorescent indicator of mitochondrial superoxide anion radical (O2−) production. The ROS scavengers MitoTEMPOL and NAC decreased p-AMPK, p-ULK1 and LC3B-II/I, however led to the elevation of FTH1 in HUVECs ( and Fig. S9A) and EA.hy926 cells ( and Fig. S9B). Furthermore, MitoTEMPOL and NAC decreased the lipid peroxidation () and cell death () upon exposure to ZnONPs. These results suggest that mtROS is plausible upstream regulator of AMPK-ULK1 axis activation. Notably, the zinc ions chelators TPEN and DTPA were able to attenuate cell death induced ZnONPs exposure (), indicating that ZnONPs-induced cell death is zinc ion-dependent.
Figure 8. Mitochondrial oxidative stress triggered ZnONPs-induced ferroptosis in vascular endothelial cells. (A) Representative TEM images of mitochondria in HUVECs treated with mock or ZnONPs (20 or 25 μg/mL) for 24 h. Yellow arrows indicated either normal mitochondria (upper panel) or aberrant mitochondria (bottom panel). C, cytoplasm; N, nucleus. Scale bar: 1 μm in left panel and scale bar: 200 nm in right panel. (B) Confocal microscopy analysis of ATP5B in HUVECs or EA.hy926 cells treated with mock or ZnONPs (20 μg/mL) for 24 h. Scale bar: 20 μm. (C,D) Representative FACS data for TMRE labeling of (C) HUVECs or (D) EA.hy926 cells treated with mock or 20 μg/mL ZnONPs for 24 h. (E-F) Representative FACS data for MitoSOX labeling of (E) HUVECs or (F) EA.hy926 cells treated with mock or 20 μg/mL ZnONPs for 24 h. (G,J) p-PRKAA, PRKAA, p-ULK1 (Ser555), ULK1, LC3B-I/II and FTH1 expression levels in (G) HUVECs or (J) EA.hy926 cells following ZnONPs (20 μg/mL) treatment with or without MitoTEMPOL (20 μM) for 24 h were determined. (H,K) MDA content levels in (H) HUVECs or (K) EA.hy926 cells following ZnONPs (20 μg/mL) treatment with or without MitoTEMPOL (20 μM) for 24 h were determined. (I,L) MTS analysis of (I) HUVECs or (L) EA.hy926 cells following ZnONPs (20 μg/mL) treatment with or without MitoTEMPOL (20 μM), NAC (10 mM), TPEN (1 μM) or DTPA (1 mM) for 24 h. *P < 0.05. The data are representative of three experiments, and the values are expressed as the mean± S.D. *P < 0.05 compared with indicated groups
Ferritinophagy and ferroptosis are involved in the vascular injury caused by pulmonary exposure to ZnONPs
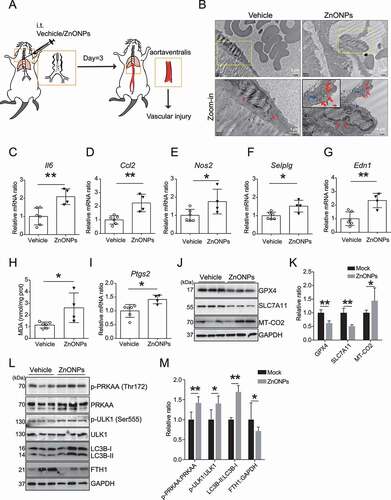
In our previous study, we established a pulmonary ZnONPs-exposed mice model [Citation30]. A suspension of 12 μg of ZnONPs was instilled into mouse lung, and the tissues of aortaventralis were obtained 3 days after ZnONPs administration (). The TEM images revealed an increase in aberrant mitochondrial (red arrows) and autophagic vacuoles (blue arrows) in ZnONPs-treated vascular endothelial cells (). Pulmonary ZnONPs exposure induced remarkable vascular inflammation, as evidenced by the elevation of mRNA expression levels of Il6 (), Ccl2 (), Nos2 (), Selplg () and Edn1 (). In addition, pulmonary ZnONPs exposure induced an elevation in the lipid peroxidation () and mRNA expression level of Ptgs2 (). The western blot analysis results showed that ZnONPs treatment caused the downregulation of GPX4 and SLC7A11 and upregulation of MT-CO2 (the protein encoded by the Ptgs2 gene) (,K). We found that pulmonary ZnONPs exposure induced the elevation of p-PRKAA, p-ULK1 and LC3B-II/I levels, and a decrease in FTH1 level (,M). We also found that the mRNA expression levels were not significantly changed with or without ZnONPs exposure (Fig. S10). These results indicated that ferroptosis and ferritinophagy are involved in ZnONPs-induced vascular injury in mice.
Figure 9. ZnONPs pulmonary exposure-induced vascular injury in mice was likely associated with ferritinophagy-mediated ferroptosis activation. (A) The experimental design of in vivo study. The detailed information was described in the Materials and Methods section. (B) Representative TEM images of mice vascular endothelial cells treated with vehicle or ZnONPs (12 μg/mice) for 3 d. Note that red arrows indicated either normal mitochondria (left panel) or aberrant mitochondria (right panel), blue arrows indicated autophagic vacuoles. Scale bar: 2 μm in the upper panel and scale bar: 1 μm in the bottom panel. (C–G) Relative mRNA expression levels of indicated cytokines in the blood vessels of mice treated with or without ZnONPs were determined. (H) The MDA contents in the vein of mice were determined. (I) Relative mRNA expression level of Ptgs2 in the vein of mice was determined. (J) The expression levels of GPX4, SLC7A11 and MT-CO2/COX2 in the blood vessels of mice were determined and the relative expression ratios were calculated in (K). (L) The expression levels of p-PRKAA, PRKAA, p-ULK1, ULK1, LC3B and FTH1 in the blood vessels of mice were determined and the relative expression ratios were calculated in (M). The data are representative of three experiments, and the values are expressed as the mean± S.D. *P < 0.05 and **P < 0.01
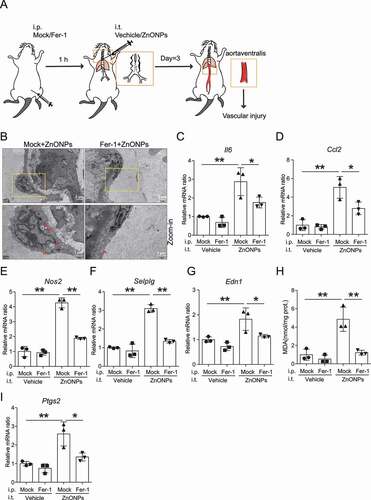
We further determined whether inhibition of ferroptosis with Fer-1 can reverse the pulmonary ZnONPs exposure-induced vascular injury in mice (). TEM images showed a decrease in aberrant mitochondria in Fer-1-treated mouse blood vessels (). The indicators of vascular inflammation, Il6 (), Ccl2 (), Nos2 (), Selplg () and Edn1 (), were downregulated in the Fer-1-treated mouse blood vessels. Moreover, Fer-1 decreased the lipid peroxidation () and the mRNA expression level of Ptgs2 (). In summary, our results indicate that the inhibition of ferroptosis is able to reverse the vascular injury induced by pulmonary ZnONPs exposure.
Figure 10. Inhibition of ferroptosis with Fer-1 ameliorated vascular injury induced by pulmonary ZnONPs exposure. (A) The experimental design of in vivo rescue study. The detailed information was described in the Materials and Methods section. (B) Representative TEM images of vascular endothelial cells in mice following with pulmonary ZnONPs exposure (12 μg/mice) with or without Fer-1 (10 mg/kg) for 3 d. Note that red arrows indicated either aberrant mitochondria (left panel) or normal mitochondria (right panel). Scale bar: 2 μm in the upper panel and scale bar: 1 μm in the bottom panel. (C–G) Relative mRNA expression levels of indicated cytokines in the blood vessels of mice following with pulmonary ZnONPs exposure (12 μg/mice) with or without Fer-1 (10 mg/kg) for 3 d were determined. (H) The MDA contents in the blood vessels of mice following with pulmonary ZnONPs exposure (12 μg/mice) with or without Fer-1 (10 mg/kg) for 3 d were determined. (I) Relative mRNA expression level of Ptgs2 in the blood vessels of mice following with pulmonary ZnONPs exposure (12 μg/mice) with or without Fer-1 (10 mg/kg) for 3 d was determined. The data are representative of three experiments, and the values are expressed as the mean± S.D. *P < 0.05 and **P < 0.01
Discussion
We previously reported that ZnONPs exposure can trigger autophagy-dependent alveolar epithelial cell death [Citation3] and induce acute lung injury in mice [Citation30]. The increased permeability of alveolar endothelial and epithelial barriers is the central pathophysiologic event in acute lung injury [Citation31]; hence, the dysfunction of endothelial cells is critical for the pathogenesis of acute lung injury. In addition, endothelial cells also play pivotal roles in the regulation of blood vessel tone, thrombogenicity, homeostasis, monocyte recruitment, and hormone transport, and dysfunction of endothelial cells has been implicated in the development of cardiovascular diseases [Citation8]. Therefore, elucidation of the mechanism of endothelial cell dysfunction upon nanoparticles exposure will help us attain greater insights into nanoparicles-induced acute lung injury and cardiovasuclar disease.
Herein, we have demonstrated that ferroptosis is a novel mechanism of endothelial dysfunction induced by ZnONPs exposure. Ferroptosis is a non-apoptotic cell death, that was first observed in oncogenic RAS-selective lethal compound erastin-treated cancer cells that did not display classic features of apoptosis, such as mitochondrial CYCS (cytochrome c, somatic) release, caspase activation, or chromatin fragmentation [Citation10]. It is reasonable to assume that the zinc ions released from ZnONPs can inhibit apoptosis in both in vitro and in vivo models via diverse mechanisms (e.g. inhibition of a Ca2+- and/or Mg2+-dependent endonuclease or activation of the AKT pathway) [Citation3,Citation32]. In the current study, we showed that caspase-dependent apoptosis was not the primary cause of ZnONPs-induced HUVECs death, since the pan-apoptotic inhibitor Z-VAD-FMK failed to reverse cell death induced by ZnONPs (Fig. S3). However, we detected increase in lipid peroxidation and cytosolic LIP (two classic marker of ferroptosis) in ZnONPs-treated HUVECs and EA.hy926 cells (). We also found that both ferrostatin-1 (an inhibitor of erastin-induced ferroptosis) and deferiprone (a specific chelator of iron) obviously alleviated ZnONPs-induced HUVECs and EA.hy926 cell death (), suggesting that ferroptosis is an important contributor to ZnONPs-induced endothelial cell death. It is must be mentioned that the biological effects of ZnONPs are complex, that at least including ROS generation, DNA damage, cell cycle arrest and so on [Citation33,Citation34]. Even though ferritinophagy was inhibited, the dissolution of ZnONPs may continue and lead to the release of free zinc ions, and together with the remnant particle form of ZnO, they might cause damage of mitochondria, DNA damage, cell cycle arresting and apoptosis to some extent. Moreover, the major analysis method used to determine the cell viability is based on the MTS assay (an improved method of the MTT assay, that is widely used in assessing cell viability), which measures the mitochondrial metabolic rate and indirectly reflects the viable cell numbers [Citation35], therefore mitochondrial damage can directly influence the results of the MTS assay, only a partial rescue effect was observed in the cells treated with Fer-1 and DFP or in which autophagy was inhibited.
Recent studies have suggested that autophagy is involved in ferroptosis regulation [Citation15,Citation24,Citation36]. Our results showed that ZnONPs induced autophagy activation (), and that ferroptosis is a form of autophagic cell death because inhibition of autophagy with 3-MA or ATG5 knockout both resulted in a decrease in cytosolic LIP, lipid peroxidation and cell death upon ZnONPs exposure (). We also provided evidence that ferritinophagy is required for the ZnONPs-induced ferroptosis of HUVECs, since NCOA4 knockdown exhibited similar effects as 3-MA supplementation and ATG5 knockout ( and ). Although NCOA4-mediated ferritinophagy was first reported in 2014 [Citation12], many roles of ferritinophagy in various pathophysiological processes have been illuminated. For example, it has been demonstrated that ferritinophagy is required for erythropoiesis [Citation37] and ferroptosis-mediated inhibition of hepatic fibrosis [Citation38,Citation39], and promotes ferroptotic cancer cell death in response to dihydroartemisinin [Citation40,Citation41]. Our study extends the list of ferritinophagy roles to participation in naonparticles-induced endothelial cell dysfunction.
SQSTM1 is a multifunctional protein, that can be degraded through autophagy or the proteosome pathway. As a stress-inducible gene, SQSTM1 is generally tightly regulated by the NFE2L2/NRF2 (nuclear factor, erythroid 2 like 2) signaling pathway at the transcriptional level [Citation42]. We considered the possible reasons why SQSTM1 levels were increased when cells were treated with ZnONPs: 1) NFE2L2-dependent activation at transcriptional level, because we found that NFE2L2 had been activated and the mRNA expression level of SQSTM1 was increased (data not shown); 2) impaired autophagic flux due to the release of zinc ions at the late stage of exposure of ZnONPs, since we reported previously that zinc ions release resulted in the damage of lysosomes [Citation3]; 3) ZnONPs treatment caused aberrant accumulation of ubiquitin (data not shown), indicating that the proteosome-ubiquitin system was dampened, which would further lead to the accumulation of SQSTM1.
Furthermore, we explored the possible mechanisms for the activation of ferritinophagy. Intriguingly, we found that AMPK was activated (). AMPK can be phosphorylated at Thr172 to induce the phosphorylation of ULK1 at Ser555, which is a key modulator of the autophagy process [Citation28]. Our results demonstrated that activation of the AMPK-ULK1 axis is causally linked to the ferritinophagy and ferroptosis of endothelial cells induced by ZnONPs, since knockdown of AMPK and ULK1 can lead to upregulated FTH1 and enhanced cell viability in response to ZnONPs treatment (). Our results also showed that the downstream factors of AMPK signaling, such as RB1CC1, ATG7, ATG5 and BECN1, were also increased following ZnONPs treatment (). We found that ATG5 KO remarkably increased FTH1 expression () and inhibited the ferroptosis (-L) induced by ZnONPs treatment, suggesting that ZnONPs-induced ferritinophagy is an AMPK-ULK1 axis-mediated, ATG5-dependent process. The roles of RB1CC1, ATG7 and BECN1 in ZnONPs-induced ferroptosis need further investigations.
Notably, AMPK also promotes ferroptosis via the inhibition of system Xc− activity, which is iron-independent. Song and colleagues found that BECN1 could bind to core component of system Xc− SLC7A11, then blocking system Xc− activity and causing ferroptosis. Phosphorylation of BECN1 at S90/93/96 by AMPK contributed to BECN1-SLC7A11 complex formation and subsequent the lipid peroxidation increase during the ferroptosis in of HCT116, CX-1 and PANC1 cell lines induced by erastin [Citation43]. However, we failed to detect any significant change in p-BECN1 (Ser93) in HUVECs with or without ZnONPs treatment (data not shown), indicating that AMPK might not exert its function through the phosphorylation of BECN1. Moreover, several other mechanisms involved in ferroptosis could not be excluded. It was reported that mitochondrial DNA stress induced by zalcitabine can trigger the autophagy-dependent ferroptotic death of pancreatic cancer cell through the STING1/TMEM173-mediated DNA sensing pathway [Citation44]. As mitochondrial damage is prevalent in ZnONPs-treated endothelial cell lines, the role of mitochondrial DNA should be investigated in ongoing study. “Clockophagy,” the selective degradation of the core circadian clock protein ARNTL by autophagy, has been demonstrated to be critical for ferroptosis [Citation45]. Intriguingly, lipophagy, the autophagic degradation of intracellular lipid droplets, facilitates ferroptotic hepatocyte cell death cause by RSL3, highlighting the impact of lipid droplets on ferroptosis and indicating that the lipophagy pathway can be targeted to inhibit ferroptosis [Citation46]. The degradation system regulates ferroptosis; in particular, autophagy modulators (e.g. BECN1, STING1/TMEM173, CTSB, HMGB1, PEBP1, MTOR, AMPK, and DUSP1) determine the ferroptotic response in a context-dependent manner [Citation47]. AMPK-mediated, autophagy-dependent degradation of FTH1 during ZnONPs exposure is just the tip of the iceberg.
The mitochondrial respiratory chain is the major source of ROS, and mitochondrial membrane potential (Δψ) is among the factors modulating mitochondrial oxidant generation [Citation48]. Our data indicated that the Δψ was sharply decreased and the mtROS levels were profoundly increased in ZnONPs-treated HUVECs and EA.hy926 cells (). Rabinovitch et al. [Citation49] reported that mtROS are physiological activators of AMPK, and AMPK plays crucial functions in sensing and resolving mtROS for stress resistance and maintaining cellular metabolic balance. Mackenzie et al. [Citation50] showed that elevated mtROS production increased AMPK activation in the endothelium of patients with coronary artery disease and type 2 diabetes mellitus, while the mtROS scavenger mitoQ significantly reduced AMPK activity in human saphenous vein endothelial cells obtained from patients with coronary artery disease and type 2 diabetes mellitus. Considering that the correlation between mtROS and AMPK activation has been established, we speculated that mtROS might be the driver of AMPK activation. As expected, the mtROS scavenger MitoTEMPOL and NAC significantly reversed ferritinophagy and ferroptosis of the HUVECs and EA.hy926 cells induced by ZnONPs (). Our results indicated that mtROS-driven ferritinophagy is the upstream event of ZnONPs-induced ferroptosis, which is consistent with a recent study reporting that mitochondria play a crucial and proactive roles in cysteine deprivation-induced ferroptosis, since the depletion of mitochondria sufficiently repressed ferroptosis [Citation51]. It is well known that AMPK is activated by increases in ADP and AMP. It is only activated when phosphorylated at T172 on the catalytic PRKAA/α subunit by upstream kinases such as STK11/LKB1 (serine/threonine kinase 11), and binding of ADP and AMP to the PRKAG/γ-subunit causes conformational changes that inhibit T172 dephosphorylation and cause further allosteric activation [Citation52]. Notably, although our results indicate that mtROS is involved in the activation of AMPK, the possible role of STK11 or a change in the ratio of AMP:ATP or ADP:ATP should not be excluded. Nevertheless, further investigations are needed to obtain greater insight into the mtROS-AMPK-ULK1-ferritinophagy axis in the ZnONPs-induced ferroptosis of vascular endothelial cells.
Our in vivo data further verify that ferritinophagy and ferroptosis are involved in ZnONPs-induced vascular injury. Pulmonary ZnONPs exposure induced vascular inflammation accompanied by the elevation of indicators of ferritinophagy and ferroptosis (). Interestingly, inhibition of ferroptosis with Fer-1 significantly decreased vascular injury induced by pulmonary ZnONPs exposure (), suggesting a crucial role for ferroptosis in ZnONPs-induced vascular endothelial dysfunction.
The cytotoxicity of ZnONPs is zinc ion dependent. We think that free zinc ions are important factors that lead to mitochondrial damage, which is followed by increased mitochondria-originated oxidative stress. As described in our study, mtROS triggered AMPK-ULK1-mediated ferritinophagy, which led to an increase in intracellular iron and the ferroptosis rate. Therefore, we propose a model of ZnONPs-induced toxicity in vascular endothelial cells is likely that ZnONPs enter late endosomes/lysosomes, where they release free zinc ions. The free zinc ions cause mitochondrial damage and increase mtROS, which induces ferritinophagy and increased intracellular iron, ultimately causing ferroptosis.
In summary, we reported that ZnONPs induced the ferroptosis of endothelial cells in a dose- and time-dependent manner, which was closely associated with autophagy activation, and autophagy played a pro-death role in the cell death process. In particular, ferritinophagy, the autophagic degradation of ferritin, contributed to iron overload, excessive lipid peroxidation and eventually ferroptosis in response to ZnONPs exposure. The current study provides novel insight into the cytotoxicity induced by ZnONPs in vascular endothelial cells, contributing to an in-depth understanding of ZnONPs-associated toxicity and the improved application of ZnONPs for biomedical applications.
Nanoparticle-induced necrosis, apoptosis and autophagy have been recognized as the mechanistic basis of nanomaterial interactions with the cellular machinery that govern cell fate and activity [Citation53]. We extend this concept and suggest that ferritinophagy-mediated ferroptosis is a novel form of cell death induced by nanoparticles in vitro and in vivo.
Materials and methods
Materials and reagents
Zinc oxide nanoparticles used in this study were obtained from Sigma-Aldrich (677,450). The particle size of ZnONPs was smaller than 50 nm (BET data provided by Sigma-Aldrich), which was confirmed by the supplier using X-ray diffraction. The detailed physicochemical characterizations and preparation of ZnONPs were described in our previous studies [Citation3,Citation30]. Tetramethylrhodamine ethyl ester perchlorate (TMRE; 87,917), Ferrostatin-1 (Fer-1; SML0583), Erastin (E7781), 3-methyladenine (3-MA; M9281), chloroquine diphosphate salt (CQ; C6628), N-acetyl-L-cysteine (NAC; a9165) MitoTEMPOL (SML0737), diethylenetriaminepentaacetic acid (DTPA; D6518) and N,N,N′,N′-tetrakis (2-pyridylmethyl)ethylenediamine (TPEN; P4413), were obtained from Sigma-Aldrich; BODIPY™ 581/591 C11 (Lipid Peroxidation Sensor; D3861) and iron florescent probe Phen Green™ SK (PGSK; P14313) were obtained from Thermo Fisher Scientific. calcein-AM (sc-203,865), deferiprone (DFP; sc-211,220) and bafilomycin A1 (BafA1; sc-201,550) were obtained from Santa Cruz Biotechnology. Z-VAD-FMK (S7023) was purchased from Selleck.
Cell lines
The human umbilical vein endothelial cell line HUVEC (CRL-1730), EA.hy926 (CRL-2922), MRC-5 (CCL-171) and THP-1 (TIB-202) cells were purchased from the American Type Culture Collection. Primary rat vascular smooth muscle cells (RVSMC) were obtained from thoracic aortas of two-month-old male Sprague-Dawley rats and cultured in DMEM (Dulbecco’s Modified Eagle Medium) with 10% FBS (fetal bovine serum). Immunofluorescence staining for ACTA2/α-smooth muscle actin (Cell Signaling Technology, 19,245) was used to analyze the purity of RVSMC.
The ATG5 knockout (ATG5 KO) stale overexpression HUVECs were generated as previously described [Citation54,Citation55]. Briefly, HUVECs were infected with lentiCRISPv2 lentivirus targeting human ATG5 and selected with puromycin. LentiCRISPv2 was a gift from Dr. Feng Zhang (Addgene, 52961). Lentiviruses were packaged in HEK293T cells. To generate stably transfected cell lines, HUVECs were infected with virus for 48 h and then selected using puromycin.
The PCR-amplified NCOA4 with a MYC/c-myc tag was subcloned into the pCDH expression lentivectors (System Biosciences, CD510B-1). The recombinant pCDH-NCOA4-MYC plasmid was co-transfected with pMD2G (Addgene, 12260; from Dr. Didier Trono) and psPAX2 (Addgene, 12259; from Dr. Didier Trono) into HEK293T cells for lentiviral packaging. The HUVECs were infected with lentivirus for 48 h and then selected with puromycin.
The sequence for the sh-RNA targeting NCOA4 was 5′-GACCTTATTTATCAG CTTA-3′. The sequence for the sh-RNA targeting negative control was 5′-TTCTCCGAACGTGTCACGT-3′. The indicated sequences were subcloned into the lentiviral plasmid LV3-H1/GFP&Puro. Lentiviruses were packaged in HEK293T cells. To generate stably transfected cell lines, HUVECs were infected with virus for 48 h and then selected using puromycin (Beyotime, ST551).
All Cells were cultured in Dulbecco’s modified Eagle’s medium (Thermo Fisher Scientific, 11965) supplemented with 10% fetal bovine serum (Gibco, 10099141) and antibiotics (100 μg/mL penicillin and 100 U/ml streptomycin, Beyotime, C0222) at 37°C in the presence of 5% CO2.
Cell viability assays
Cell viability was determined by the MTS assay (Promega, G3581) as described previously [Citation3]. In the rescue experiments, 3-MA (5 mM), CQ (5 μM), BafA1 (100 nM), Fer-1 (1 μM) and DFP (100 μΜ) were added in cells 1 h before ZnONPs treatment. In the siRNA knockdown experiment, HUVECs were transfected with siRNA for 48 h, and the MTS assay was performed at 24 h after treatment with ZnONPs.
Fluorescence-activated cell sorting (FACS) assays
FACS assays were performed as previously described [Citation3]. TMRE (10 nM) was used to measure mitochondrial membrane potential; C11-BODIPY (50 μM) was applied to detect lipid ROS; PGSK (20 μM) was used to detect intracellular iron; Calcein-AM (50 nM) was used to determine cell viability; Cytosolic LIP was measured according to the methods described previously [Citation56]. Briefly, cells were trypsinized, washed twice with 0.5 ml of PBS (Beyotime, C0221A), and then stained with calcein-AM (50 nM) for 15 min at 37°C. After washing twice with PBS, one-half of the stained HUVECs were incubated with DFP (100 μM) for 1 h at 37°C. Calcein was excited at 488 nm, and fluorescence was measured at 525 nm. The difference in the mean fluorescence with and without DFP incubation reflects the amount of cytosolic LIP. All FACS experiments were performed on BD Influx Cell Sorter (BD Biosciences, San Jose, CA, USA) and results were analyzed using the BD FACS Software (San Jose, CA, USA).
Measurement of GSH
Total glutathione in cell lysates or tissue lysates were measured with GSH detection kit (Beyotime, S0052) according to the manufacturer’s instruction.
Measurement of MDA
The cell lysates or tissue lysates were measured with MDA detection kit (Beyotime, S0131) according to the manufacturer’s instruction.
Western blotting assays
For western blotting, HUVECs were washed twice with cold PBS and then treated with ice-cold RIPA lysis buffer (Abcam, ab156034) containing PMSF (Sigma-Aldrich, 10837091001) and protease inhibitors (Thermo Fisher Scientific, 78430). The protein concentrations of cell lysates were determined by the BCA Assay Kit (Thermo Fisher, 23225). Proteins were separated via SDS-PAGE and transferred onto polyvinylidene fluoride (PVDF) membrane (BIO-RAD Laboratories, 1620177). The membranes were blocked with 5% nonfat milk (BD Biosciences, 232100) and then probed separately with the corresponding primary and secondary antibodies. The primary antibodies used in this study were listed below: GPX4 (ab125066; 1:1,000), ACSL4 (ab155282; 1:1,500), SLC7A11 (ab175186), LC3B (ab192890), ATG5 (ab109490; 1:1,000), MTOR (phospho S2448; ab109268; 1:3,000) and ATG7 (ab52472; 1:2,500) were obtained from Abcam; IREB2/IRP2 (37135; 1:200), PRKAA/AMPK (5832; 1:2,000), MTOR (2983; 1:1,000), phospho-EIF4EBP1 (Thr37/46; 2855; 1:1,000), phospho-RPS6KB/p70 S6 kinase (Thr389; 9234; 1:1,000), phospho-PRKAA/AMPK (Thr172) (2535, 1:1,500), phospho-ULK1 (Ser555; 5869; 1:750), phospho-ULK1 (Ser757; 14202; 1:1,000), RB1CC1/FIP200 (12436; 1:500) and BECN1 (3495; 1:1,000) were purchased from Cell Signaling Technology; MT-CO2/COX2 (12375-1-AP; 1:200), MYC-Tag (16286-1-AP; 1:20,000) and GAPDH (60004-1-Ig; 1:10,000) were purchased from Proteintech. NCOA4 (sc-373739; 1:300) and FTH1 (sc-376594; 1:300) were purchased from Santa Cruz Biotechnology; AKT (A5031; 1:1,000), phospho-AKT (Ser473; A5031; 1:1,000) and ULK1 (A5149; 1:1,000) antibody were purchased form BIMAKE. ACTB/β-actin (bs-0061 R; 1:5,000) was obtained from Bioss.
Transmission electron microscopy (TEM) assays
TEM assays were performed as previously described [Citation54]. Briefly, HUVECs were centrifuged at 225 x g for 5 min after trypsinization and fixed with 4% glutaraldehyde for 2 h at 4°C. Then, cells or mice vein were fixed with 1% osmium tetroxide for 1 h at 4°C. Subsequently, cells were dehydrated in a graded series of alcohol and acetone, followed by embedment in Epon 816 (Electron Microscopy Sciences, Hatfield, PA, USA). Ultrathin sections were obtained by using a Leica ultramicrotome (Leica Microsystems, Buffalo Grove, IL, USA) and stained with uranyl acetate and lead citrate. TEM images were captured under a JEM-1400Plus transmission electron microscope (JEOL Ltd. Tokyo, Japan).
Real-time quantitative PCR analysis
Total RNA was extracted from HUVECs or mice vein using Eastep Super Total RNA Extraction Kit (Promega, LS1040), cDNA was synthesized from 1.5 μg of total RNA with GoScript Reverse Transcription Kit (Promega, A5001) according to the standard protocol provided by the manufacturer. PCR amplification assays were performed with GoTaq Real-time Quantitative PCR Master Mix (Promega, A6002) on CFX96 Touch Real-Time PCR Detection System (Bio-Rad, Hercules, CA, USA). The relative gene expression levels were calculated using the CT value and normalized to the expression of the TATA-binding protein (TBP) or ACTB reference genes. The specific primers were synthesized by Sangon (Shanghai, China) and the detailed sequences were as follows:
Human PTGS2 forward, 5′-GGTGATGAGCAGTTGTTC-3′;
Human PTGS2 reverse, 5′-AATTCAGCAGCAATACGATT-3′;
Human FTH1 forward, 5′-GAACTACCACCAGGACTC-3′;
Human FTH1 reverse, 5′-TTCTTCAAAGCCACATCATC-3′;
Human GAPDH forward, 5′-AGGGCTGCTTTTAACTCTGGT-3′;
Human GAPDH reverse, 5′-CCCCACTTGATTTTGGAGGGA-3′.
Mouse PTGS2 forward, 5′-CAGTATCAGAACCGCATTG-3′;
Mouse PTGS2 reverse, 5′-CAGGAGGATGGAGTTGTT-3′;
Mouse FTH1 forward, 5′-AGTTGTATGCCTCCTACG-3′;
Mouse FTH1 reverse, 5′-ATCACGGTCTGGTTTCTT-3′;
Mouse Il6 forward, 5′-CATCCAGTTGCCTTCTTG-3′;
Mouse Il6 reverse, 5′-ATTAAGCCTCCGACTTGT-3′;
Mouse Ccl2 forward, 5′-ATGAGATCAGAACCTACAACT-3′;
Mouse Ccl2 reverse, 5′-TCCTACAGAAGTGCTTGAG-3′;
Mouse Nos2 forward, 5′-AACGCTTCACTTCCAATG-3′;
Mouse Nos2 reverse, 5′-GGCTCTGTTGAGGTCTAA-3′;
Mouse Selplg forward, 5′-CACAGAACCTACCACCAT −3′;
Mouse Selplg reverse, 5′-TGAGGATAATCAGCAGACAT-3′;
Mouse Edn1 forward, 5′-TGTTCCTGTTCTTCCTTGA-3′;
Mouse Edn1 reverse, 5′-ATCTAACTGCCTGGTCTG −3′;
Mouse Actb forward, 5′-AGCCATGTACGTAGCCATCC-3′;
Mouse Actb reverse, 5′-GCTGTGGTGGTGAAGCTGTA-3′.
Immunoprecipitation analysis
NCOA4-MYC stable overexpression HUVECs were lysed at 4°C in ice-cold lysis buffer containing PMSF and protease inhibitors. Immunoprecipitation was performed using MYC-tag antibody or control IgG antibody, and the protein complexes were captured with Protein A/G Magnetic Beads (MedChemExpress, HY-K0202,). Then the beads bound proteins were eluted by boiling in SDS sample buffer and subjected to polyacrylamide gel electrophoresis and analyzed by western blot analysis.
Immunofluorescence staining
Immunofluorescence staining was performed as previously described [Citation54]. HUVECs or EA.hy926 cells were seeded on coverslips were fixed with cold methanol for 15 min at room temperature and subsequently permeabilized with 0.1% Triton X-100 (Sigma-Aldrich, X100) and blocking buffer (3% BSA [Sigma-Aldrich, B2064] and 22.52 mg/ml glycine [Sigma-Aldrich, G8898] in PBS) for 1 h at room temperature. Then, cells were incubated with primary antibodies diluted in blocking buffer overnight at 4°C. After three washes with PBS, the cells were incubated with secondary antibodies and DAPI (Thermo Fisher, 62248) diluted in blocking solution for 1 h at room temperature. Cells were then washed three times with PBS, and the coverslips were sealed with nail polish. Fluorescence images were acquired using a Nikon A1R+/A1 Confocal Microscope (Nikon, Tokyo, Japan). The primary antibodies used in this study targeted endogenous LC3B (1:200; Cell Signaling Technology, 83506), FTH1(1:100, Abcam, ab75973) and ATP5B (1:100, Santa Cruz Biotechnology, sc-166462). The secondary antibodies were Donkey anti-Mouse IgG (H + L) Alexa Fluor 594 (1:1,000; Molecular Probes, A-21203) and Goat anti-Rabbit IgG (H + L) Highly Cross-Adsorbed Alexa Fluor Plus 488 (1:1,000; Molecular Probes, A-32731).
siRNA transfection
Before siRNA transfection, HUVECs were seeded in 12-well plates. After 18 h, cells were transfected with siRNA duplexes (75 nM) with Lipofectamine RNAiMAX reagent (Thermo Fisher, LMRNA015) diluted in Opti-MEM (Thermo Fisher, 31985062) according to the manufacturer’s instructions. Next, at 48 h after siRNA transfection, the efficiency of knockdown was determined by western blotting. siRNAs used in this study were synthesized by GenePharma (Shanghai, China). The siRNA sequences were:
si-NCOA4: 5′-GACCUUAUUUAUCAGCUUAtt-3′ [Citation12];
si-PRKAA/AMPK: 5′-AAAUUCACCAUCUGACAUCAU-3′; (including PRKAA1/AMPKα1 and PRKAA2/AMPKα2)
si-ULK1: 5′-GGUACCUCCAGAGCAACAUtt-3′;
Negative control siRNA (si-NC): 5′-UUCUCCGAACGUGUCACGUtt–3′.
Animal treatment
Specific pathogen free (SPF) male C57BL/6 J mice (8–10 weeks, body weight: 22 ~ 24 g) were obtained from the Experimental Animal Center of Chongqing Medical University (Chongqing, China, license numbers: SCXK(Yu)2012-001). All mice were kept in polypropylene cages with sawdust and housed in a controlled environmental condition with a temperature of 23 ± 1°C, humidity of 55 ± 10% and 12-hlight/dark cycle. The animals were allowed ad libitum access to food and water. All protocols were approved by the Institutional Animal Care and Use Committee of Chongqing Medical University. All the treatments were performed gently and all efforts were made to minimize animal suffering.
To minimize agglomeration, ZnONPs were suspended in 2% heat-inactivated sibling mouse serum in MilliQ water [Citation57] and was prepared freshly each time and sonicated with an ultrasonic cleaner set at 20% of the maximum amplitude (SB-5200DT; Ningbo Scientz Biotechnology Co., Ltd, Ningbo, China) for 20 min in an ice water bath to ensure their homogeneity. Vehicle solution was also prepared by sonication of 2% heat-inactivated sibling mouse serum in MilliQ water in the same conditions. After 7-day adaption, animals were intratracheally instilled with a single dose of 12 μg/animal ZnONPs in 50 μL solution. Mice were then sacrificed 3 d after treatment according to our previously published study [Citation30]. In the rescue experiments, Fer-1 (10 mg/kg) dissolved in 100 μL solution (2% DMSO [Sigma-Aldrich, D2650]+50% PEG300 [Sigma-Aldrich, 90878]+5% Tween 80 [Sigma-Aldrich, P4780]+ddH2O) or only solution was i.p. administrated 1 h before ZnONPs exposure [Citation14].
Statistical analysis
Comparisons between two groups were made by unpaired Student’s t-test. One-way analysis of variance (ANOVA) followed by least significant difference (LSD) t-test or Kruskal-Wallis test were used to compare the significant differences among groups. The data are shown as the mean± standard deviation (S.D.). All statistical tests were conducted using Prism 8.0 software (GraphPad Software, San Diego, CA, USA). *P < 0.05 was considered as significant, **P < 0.01 was considered as higher significant and N.S. indicates not significant.
Supplemental Material
Download MS Word (1.9 MB)Acknowledgments
Z.Z. represent all authors to thank the efforts from all the members in Dongsheng Lab.
Disclosure statement
The authors declare that they have no competing financial interests.
Supplemental material
Supplemental data for this article can be accessed here.
Additional information
Funding
References
- Xiong HM. ZnO nanoparticles applied to bioimaging and drug delivery. Adv Mater. 2013;25(37):5329–5335.
- Xia T, Kovochich M, Liong M, et al. Comparison of the mechanism of toxicity of zinc oxide and cerium oxide nanoparticles based on dissolution and oxidative stress properties. ACS Nano. 2008;2(10):2121–2134.
- Zhang J, Qin X, Wang B, et al. Zinc oxide nanoparticles harness autophagy to induce cell death in lung epithelial cells. Cell Death Dis. 2017;8(7):e2954.
- Kao YY, Chen YC, Cheng TJ, et al. Zinc oxide nanoparticles interfere with zinc ion homeostasis to cause cytotoxicity. Toxicol Sci. 2012;125(2):462–472.
- Heim J, Felder E, Tahir MN, et al. Genotoxic effects of zinc oxide nanoparticles. Nanoscale. 2015;7(19):8931–8938.
- Zhang Y, Nayak TR, Hong H, et al. Biomedical applications of zinc oxide nanomaterials. Curr Mol Med. 2013;13(10):1633–1645.
- Mishra PK, Mishra H, Ekielski A, et al. Zinc oxide nanoparticles: a promising nanomaterial for biomedical applications. Drug Discov Today. 2017;22(12):1825–1834.
- Cao Y, Gong Y, Liu L, et al. The use of human umbilical vein endothelial cells (HUVECs) as an in vitro model to assess the toxicity of nanoparticles to endothelium: a review. J Appl Toxicol. 2017;37(12):1359–1369.
- Miller MR, Raftis JB, Langrish JP, et al. Inhaled nanoparticles accumulate at sites of vascular disease. ACS Nano. 2017;11(5):4542–4552.
- Dixon SJ, Lemberg KM, Lamprecht MR, et al. Ferroptosis: an iron-dependent form of nonapoptotic cell death. Cell. 2012;149(5):1060–1072.
- Yang WS, SriRamaratnam R, Welsch ME, et al. Regulation of ferroptotic cancer cell death by GPX4. Cell. 2014;156(1–2):317–331.
- Mancias JD, Wang X, Gygi SP, et al. Quantitative proteomics identifies NCOA4 as the cargo receptor mediating ferritinophagy. Nature. 2014;509(7498):105–109.
- Jiang L, Kon N, Li T, et al. Ferroptosis as a p53-mediated activity during tumour suppression. Nature. 2015;520(7545):57–62.
- Fang X, Wang H, Han D, et al. Ferroptosis as a target for protection against cardiomyopathy. Proc Natl Acad Sci U S A. 2019;116(7):2672–2680.
- Friedmann Angeli JP, Schneider M, Proneth B, et al. Inactivation of the ferroptosis regulator Gpx4 triggers acute renal failure in mice. Nat Cell Biol. 2014;16(12):1180–1191.
- Weiland A, Wang Y, Wu W, et al. Ferroptosis and its role in diverse brain diseases. Mol Neurobiol. 2018;56(7):4880–4893.
- Kim SE, Zhang L, Ma K, et al. Ultrasmall nanoparticles induce ferroptosis in nutrient-deprived cancer cells and suppress tumour growth. Nat Nanotechnol. 2016;11(11):977–985.
- Yuan H, Li X, Zhang X, et al. Identification of ACSL4 as a biomarker and contributor of ferroptosis. Biochem Biophys Res Commun. 2016;478(3):1338–1343.
- Xie Y, Hou W, Song X, et al. Ferroptosis: process and function. Cell Death Differ. 2016;23(3):369–379.
- Hirayama T, Nagasawa H. Chemical tools for detecting Fe ions. J Clin Biochem Nutr. 2017;60(1):39–48.
- Wang J, Chen G, Muckenthaler M, et al. Iron-mediated degradation of IRP2, an unexpected pathway involving a 2-oxoglutarate-dependent oxygenase activity. Mol Cell Biol. 2004;24(3):954–965.
- Skouta R, Dixon SJ, Wang J, et al. Ferrostatins inhibit oxidative lipid damage and cell death in diverse disease models. J Am Chem Soc. 2014;136(12):4551–4556.
- Kwiatkowski JL. Current recommendations for chelation for transfusion-dependent thalassemia. Ann N Y Acad Sci. 2016;1368(1):107–114.
- Hou W, Xie Y, Song X, et al. Autophagy promotes ferroptosis by degradation of ferritin. Autophagy. 2016;12(8):1425–1428.
- Gao M, Monian P, Pan Q, et al. Ferroptosis is an autophagic cell death process. Cell Res. 2016;26(9):1021–1032.
- Dowdle WE, Nyfeler B, Nagel J, et al. Selective VPS34 inhibitor blocks autophagy and uncovers a role for NCOA4 in ferritin degradation and iron homeostasis in vivo. Nat Cell Biol. 2014;16(11):1069–1079.
- Bellelli R, Federico G, Matte A, et al. NCOA4 deficiency impairs systemic iron homeostasis. Cell Rep. 2016;14(3):411–421.
- Kim J, Kundu M, Viollet B, et al. AMPK and mTOR regulate autophagy through direct phosphorylation of Ulk1. Nat Cell Biol. 2011;13(2):132–141.
- Ahmad T, Aggarwal K, Pattnaik B, et al. Computational classification of mitochondrial shapes reflects stress and redox state. Cell Death Dis. 2013;4:e461.
- Jiang X, Tang Q, Zhang J, et al. Autophagy-dependent release of zinc ions is critical for acute lung injury triggered by zinc oxide nanoparticles. Nanotoxicology. 2018;12(9):1068–1091.
- Matthay MA, Ware LB, Zimmerman GA. The acute respiratory distress syndrome. J Clin Invest. 2012;122(8):2731–2740.
- Eron SJ, MacPherson DJ, Dagbay KB, et al. Multiple mechanisms of zinc-mediated inhibition for the apoptotic caspases-3, −6, −7, and −8. ACS Chem Biol. 2018;13(5):1279–1290. .
- Saptarshi SR, Duschl A, Lopata AL. Biological reactivity of zinc oxide nanoparticles with mammalian test systems: an overview. Nanomedicine (Lond). 2015;10(13):2075–2092.
- Pati R, Das I, Mehta RK, et al. Zinc-oxide nanoparticles exhibit genotoxic, clastogenic, cytotoxic and actin depolymerization effects by inducing oxidative stress responses in macrophages and adult mice. Toxicol Sci. 2016;150(2):454–472.
- Rai Y, Pathak R, Kumari N, et al. Mitochondrial biogenesis and metabolic hyperactivation limits the application of MTT assay in the estimation of radiation induced growth inhibition. Sci Rep. 2018;8(1):1531.
- Zhou B, Liu J, Kang R, et al. Ferroptosis is a type of autophagy-dependent cell death. Semin Cancer Biol. 2019;66:89–100.
- Mancias JD, Pontano Vaites L, Nissim S, et al. Ferritinophagy via NCOA4 is required for erythropoiesis and is regulated by iron dependent HERC2-mediated proteolysis. eLife. 2015;4. DOI:https://doi.org/10.7554/eLife.10308.
- Zhang Z, Yao Z, Wang L, et al. Activation of ferritinophagy is required for the RNA-binding protein ELAVL1/HuR to regulate ferroptosis in hepatic stellate cells. Autophagy. 2018;14(12):2083–2103.
- Kong Z, Liu R, Cheng Y. Artesunate alleviates liver fibrosis by regulating ferroptosis signaling pathway. Biomed Pharmacothe. 2019;109:2043–2053.
- Du J, Wang T, Li Y, et al. DHA inhibits proliferation and induces ferroptosis of leukemia cells through autophagy dependent degradation of ferritin. Free Radic Biol Med. 2019;131:356–369.
- Lin R, Zhang Z, Chen L, et al. Dihydroartemisinin (DHA) induces ferroptosis and causes cell cycle arrest in head and neck carcinoma cells. Cancer Lett. 2016;381(1):165–175.
- Sanchez-Martin P, Komatsu M. p62/SQSTM1 - steering the cell through health and disease. J Cell Sci. 2018;131:21.
- Song X, Zhu S, Chen P, et al. AMPK-mediated BECN1 phosphorylation promotes ferroptosis by directly blocking system Xc(–) activity. Curr Biol. 2018;28(15):2388–2399 e5.
- Li C, Zhang Y, Liu J, et al. Mitochondrial DNA stress triggers autophagy-dependent ferroptotic death. Autophagy. 2020:1–13. DOI:https://doi.org/10.1080/15548627.2020.1739447.
- Yang M, Chen P, Liu J, et al. Clockophagy is a novel selective autophagy process favoring ferroptosis. Sci Adv. 2019;5(7):eaaw2238.
- Bai Y, Meng L, Han L, et al. Lipid storage and lipophagy regulates ferroptosis. Biochem Biophys Res Commun. 2019;508(4):997–1003.
- Chen X, Yu C, Kang R, et al. Cellular degradation systems in ferroptosis. Cell Death Differ. 2021. DOI:https://doi.org/10.1038/s41418-020-00728-1.
- Zhang DX, Gutterman DD. Mitochondrial reactive oxygen species-mediated signaling in endothelial cells. Am J Physiol Heart Circ Physiol. 2007;292(5):H2023–31.
- Rabinovitch RC, Samborska B, Faubert B, et al. AMPK maintains cellular metabolic homeostasis through regulation of mitochondrial reactive oxygen species. Cell Rep. 2017;21(1):1–9.
- Mackenzie RM, Salt IP, Miller WH, et al. Mitochondrial reactive oxygen species enhance AMP–activated protein kinase activation in the endothelium of patients with coronary artery disease and diabetes. Clin Sci (Lond). 2013;124(6):403–411.
- Gao M, Yi J, Zhu J, et al. Role of mitochondria in ferroptosis. Mol Cell. 2019;73(2):354–363 e3.
- Hardie DG. AMP-activated/SNF1 protein kinases: conserved guardians of cellular energy. Nat Rev Mol Cell Biol. 2007;8(10):774–785.
- Mohammadinejad R, Moosavi MA, Tavakol S, et al. Necrotic, apoptotic and autophagic cell fates triggered by nanoparticles. Autophagy. 2019;15(1):4–33.
- Zhang J, Wang B, Wang H, et al. Disruption of the superoxide anions-mitophagy regulation axis mediates copper oxide nanoparticles-induced vascular endothelial cell death. Free Radic Biol Med. 2018;129:268–278.
- Zhang J, Zou Z, Wang B, et al. Lysosomal deposition of copper oxide nanoparticles triggers HUVEC cells death. Biomaterials. 2018;161:228–239.
- Prus E, Fibach E. Flow cytometry measurement of the labile iron pool in human hematopoietic cells. Cytometry A. 2008;73(1):22–27.
- Jacobsen NR, Stoeger T, Van Den Brule S, et al. Acute and subacute pulmonary toxicity and mortality in mice after intratracheal instillation of ZnO nanoparticles in three laboratories. Food Chem Toxicol. 2015;85:84–95.