
 ?Mathematical formulae have been encoded as MathML and are displayed in this HTML version using MathJax in order to improve their display. Uncheck the box to turn MathJax off. This feature requires Javascript. Click on a formula to zoom.
ABSTRACT
Initiation of PINK1- and PRKN-dependent mitophagy is a highly regulated process involving the activity of the AAA-ATPase VCP/p97, a cofactor-guided multifunctional protein central to handling ubiquitinated client proteins. Removal of ubiquitinated substrates such as the mitofusin MFN2 from the outer mitochondrial membrane by VCP is critical for PRKN accumulation on mitochondria, which drives mitophagy. Here we characterize the role of the UBA and UBX-domain containing VCP cofactor UBXN1/SAKS1 during mitophagy. Following mitochondrial depolarization and depending on PRKN, UBXN1 translocated alongside VCP to mitochondria. Prior to mitophagy, loss of UBXN1 led to mitochondrial fragmentation, diminished ATP production, and impaired ER-mitochondrial apposition. When mitophagy was induced in cells lacking UBXN1, mitochondrial translocation of VCP and PRKN was impaired, diminishing mitophagic flux. In addition, UBXN1 physically interacted with PRKN in a UBX-domain depending manner. Interestingly, ectopic expression of the pro-mitophagic VCP cofactor UBXN6/UBXD1 fully reversed impaired PRKN recruitment in UBXN1-/- cells. Mechanistically, UBXN1 acted downstream of PINK1 by facilitating MFN2 removal from mitochondria. In UBXN1-/- cells exposed to mitochondrial stress, MFN2 formed para-mitochondrial blobs likely representing blocked intermediates of the MFN2 removal process partly reversible by expression of UBXN6. Presence of these MFN2 blobs strongly correlated with impaired PRKN translocation to depolarized mitochondria. Our observations connect the VCP cofactor UBXN1 to the initiation and maintenance phase of PRKN-dependent mitophagy, and indicate that, upon mitochondrial stress induction, MFN2 removal from mitochondria occurs through a specialized process.
Introduction
Clearance of damaged mitochondria through mitophagy, a targeted macroautophagic/autophagic process, is critical for maintaining mitochondrial fidelity and preventing neurodegenerative and age-related disorders [Citation1,Citation2] such as Parkinson [Citation3], Alzheimer [Citation4], and Huntington [Citation5] diseases as well as amyotrophic lateral sclerosis [Citation6]. Extensive damage to mitochondria resulting in impaired protein import due to failing mitochondrial membrane potential activates the ubiquitin kinase PINK1 (PTEN induced kinase 1). This causes recruitment and activation of the ubiquitin ligase PRKN/Parkin in turn marking mitochondria for degradation [Citation7–9].
The ATPase associated with diverse cellular activities (AAA-ATPase) VCP/p97 (valosin containing protein) [Citation10], a major chaperone for ubiquitinated client proteins, plays a critical role during mitochondrial quality control [Citation11,Citation12]. Constituting up to 1% of total cellular protein, VCP is involved in a plethora of processes including cell cycle regulation, protein retrotranslocation during endoplasmic reticulum associated degradation (ERAD), degradation of aggregated proteins, NFKB/NF-κB signaling, and also modulates transcription factor-chromatin interactions [Citation13,Citation14]. Mutations in VCP cause inclusion body myopathy with early-onset Paget disease and frontotemporal dementia [Citation15] and amyotrophic lateral sclerosis [Citation16], underlining the importance of this multi-purpose chaperone. On mitochondria, VCP is involved in outer mitochondrial membrane (OMM)-associated degradation (OMMAD) [Citation17,Citation18] as well as mitophagy [Citation19]. Through OMMAD, VCP counteracts oxidative stress by eliminating oxidatively damaged proteins [Citation17] and regulates apoptosis by modulating mitochondrial MCL1 levels [Citation12]. Early during mitophagy, VCP promotes the removal of the large GTPase MFN2 (mitofusin 2) from the OMM [Citation19]. Upon its PINK1- and PRKN-dependent phosphoubiquitination, MFN2 is among the first mitochondrial proteins destined for proteasomal degradation [Citation20]. As MFN2 is not only a mitochondrial fusion protein, but also forms ER-mitochondria tethers [Citation21], VCP-mediated removal of MFN2 promotes mitophagy in two ways. First, blocking mitochondrial fusion supports the generation of small mitochondrial subunits, and second, ER-mitochondrial contacts are severed; both processes prepare mitochondria for efficient uptake into autolysosomes. In fact, reversal of ER-mitochondrial contact following degradation of MFN2 is an important driver for mitophagy [Citation20].
The involvement of VCP in such a multitude of processes suggests tight temporal as well as spatial control of this protein [Citation22]. Indeed, a host of cofactors containing protein-protein interaction domains regulates VCP activity by governing access to ubiquitinated client proteins. Signature interaction domains of VCP cofactors include the ubiquitin regulatory X (UBX) and the ubiquitin associated (UBA) domain [Citation10] with the UBX domain generally contacting VCP and the UBA domain interacting with moieties on client proteins. Among these cofactors, UBXN6 was recently shown by us to act in a pro-mitophagic manner by increasing mitochondrial recruitment of VCP and PRKN [Citation23].
Another VCP cofactor is UBA and UBX domain-containing UBXN1/SAKS1 [Citation24]. UBXN1 colocalizes with ubiquitin and is involved in ubiquitin-proteasome functions [Citation25] through binding ubiquitin and VCP via its UBA and UBX domains, respectively [Citation24]. UBXN1 and VCP are co-immunoprecipitating, suggesting that UBXN1 might direct VCP to polyubiquitinated proteins [Citation26]. In addition, UBXN1 selectively inhibits the degradation of ERAD substrates [Citation26]. Moreover, UBXN1 modulates VCP-mediated protein degradation by protecting polyubiquitin chains from deubiquitination [Citation27]. Interestingly, VCP-UBXN1 interaction is critical for proteasomal targeting of ubiquitinated proteins prior to ER translocation via the BAG6/BCL2-associated athanogene 6 chaperone complex [Citation28].
Here, we connect UBXN1 to the maintenance of mitochondrial fidelity. Loss of UBXN1 had negative impact on mitochondrial morphology, ATP generation and ER-mitochondrial contact. We found UBXN1 to translocate to depolarized mitochondria in a PRKN-dependent manner. In cells lacking UBXN1, PRKN translocation to depolarized mitochondria was disturbed which, along with diminished mitophagic flux, strongly suggests a pro-mitophagic role for this VCP cofactor. This notion is further supported by our observation that UBXN1 loss blocked MFN2 removal, leading to the formation of hitherto unrecognized para-mitochondrial blob-like MFN2 accumulations.
Results
UBXN1 translocates to depolarized mitochondria in a PRKN-dependent manner
To identify cofactors of VCP with a potential role during mitophagy, mitochondrial translocation of twelve UBX domain-containing proteins was assessed in HeLa cells under mitophagic conditions (Fig. S1) defined as the presence of exogenous PRKN and 25 µM of the protonophore carbonyl cyanide 3-chlorophenyl hydrazone (CCCP). Using this approach, we identified UBXN1 as a VCP cofactor potentially involved in mitophagy. While UBXN1 localized to non-mitochondrial puncta in control cells (), mitochondrial depolarization in the presence of YFP-PRKN caused redistribution of FLAG-UBXN1 and colocalization with mitochondria-targeted DsRed (mitoDsRed).
Figure 1. UBXN1 translocates to mitochondria under mitophagic conditions. (A) HeLa cells transfected with expression constructs for FLAG-UBXN1, mitoDsRed and YFP-PRKN were treated with 25 µM CCCP for 6 h, fixed and stained using mouse anti-FLAG antibodies and imaged by confocal microscopy. Shown are representative images from three independent experiments. Scale bar: 20 µm. (B) Distribution of FLAG-UBXN1 and YFP-PRKN staining was measured by line drawing and Pearson’s correlation was calculated for 10 lines per cell. Shown are boxplots of Pearson’s correlations of three independent experiments with at least 15 cells per condition and experiment. Statistical significance was assessed by Student’s t-test. *** denotes p < 0.001. (C) HeLa cells expressing FLAG-UBXN1 together with mitoYFP-T2A-MYC-PRKN were treated with 25 µM CCCP for the indicated times, fixed and stained using mouse anti-FLAG antibodies and imaged by confocal microscopy. The boxplot represents the quantitative analysis of the mitochondrial:cytosolic UBXN1 ratio from three independent experiments (26 to 97 cells per time point). Statistical significance was tested as above.
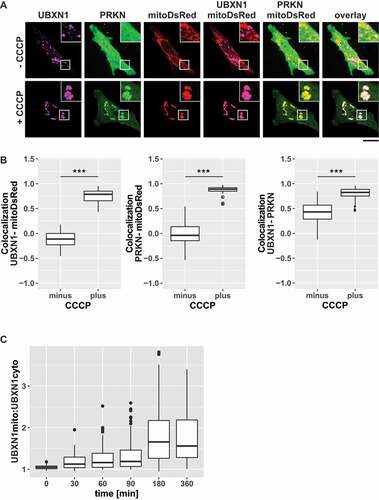
To quantify UBXN1 redistribution, Pearson’s correlation coefficient (0: no correlation/co-localization, 1: complete correlation/co-localization, −1: complete anti-correlation/localization) between ectopic FLAG-UBXN1 and mitoDsRed or YFP-PRKN was determined (; see Fig. S2A for extent of FLAG-UBXN1 overproduction). This quantitative analysis revealed a significant increase in Pearson’s correlation at 360 min of CCCP treatment between FLAG-UBXN1 and mitoDsRed (no CCCP: −0.11 ± 0.17; plus CCCP: 0.78 ± 0.12), YFP-PRKN and mitoDsRed (no CCCP: −0.04 ± 0.2; plus CCCP: 0.89 ± 0.05) and as well as FLAG-UBXN1 and YFP-PRKN (no CCCP: 0.43 ± 0.21; plus CCCP: 0.83 ± 0.1) compared to untreated controls. The lack of significant endogenous PRKN expression in HeLa cells (Fig. S2B) necessitated ectopic transient expression of PRKN leading to varying PRKN levels in the cell population. To take this into account, cells with extremely high or especially low ectopic PRKN levels were excluded from analysis.
To better understand the timing of UBXN1 translocation to mitochondria, we determined the ratio of mitochondrial to cytosolic UBXN1 following 0, 30, 60, 90, 180 and 360 min of CCCP treatment (). While no colocalization of UBXN1 was apparent prior to CCCP addition (: 1.04 ± 0.05), mitochondrial UBXN1 started to become detectable already at 30 min of CCCP treatment. With prolonged CCCP treatment, mitochondrial UBXN1 further increased and reached a plateau at 180 min (
– 30 min: 1.13 ± 0.16 (p = 0.24); 60 min: 1.16 ± 0.19 (p = 0.053); 90 min: 1.19 ± 0.22 (p = 0.01); 180 min: 1.66 ± 0.66 (p < 0.001); 360 min: 1.56 ± 0.51 (p < 0.001)).
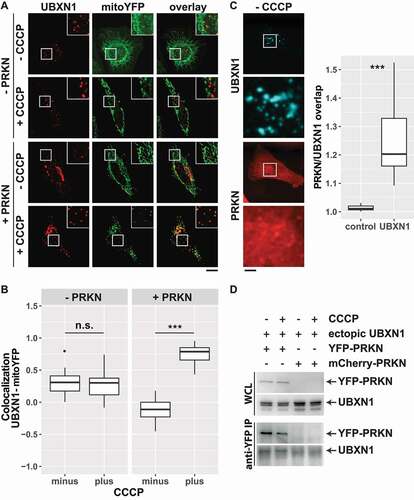
To assess the PRKN dependency of the observed mitochondrial translocation of FLAG-UBXN1, HeLa cells transfected with expression plasmids for FLAG-UBXN1, YFP targeted to mitochondria (mitoYFP) or mitoYFP-T2A-MYC-PRKN were treated with CCCP or left untreated. HeLa cells are reported to express little to no endogenous PRKN [Citation29] (Fig. S2B). Analysis by confocal microscopy revealed co-localization between FLAG-UBXN1 and mitoYFP only in CCCP-treated cells expressing PRKN. In contrast, no mitochondrial translocation of FLAG-UBXN1 was observed in cells lacking PRKN (). Quantitative image analysis () showed significant co-localization of FLAG-UBXN1 and mitoYFP in PRKN-expressing cells treated with CCCP (no CCCP: −0.11 ± 0.17; plus CCCP: 0.79 ± 0.12) compared to control cells without exogenous PRKN (no CCCP: 0.31 ± 0.17; plus CCCP: 0.30 ± 0.14). Interestingly, in the absence of CCCP-induced mitochondrial damage, overlap of UBXN1 signal with mitoYFP was decreased in PRKN-expressing cells (minus CCCP groups in ). This suggests a potential interaction between UBXN1 and PRKN before mitophagic induction. When assessing the overlap between cytosolic PRKN and FLAG-UBXN1, a slight, but significant enrichment of PRKN in cytosolic UBXN1 dots was observed (). This prompted us to investigate a potential physical interaction between UBXN1 and PRKN. And indeed, UBXN1 co-purified with YFP-PRKN following anti-GFP immunoprecipitation irrespective of CCCP treatment ().
Figure 2. UBXN1 depends on PRKN for mitochondrial translocation, colocalizes and physically interacts with PRKN. (A) Hela cells transfected with expression plasmids for FLAG-UBXN1 and mitoYFP-T2A-MYC-PRKN or mitoYFP and treated with 25 µM CCCP for 6 h or left untreated as control. Cells were fixed and stained using mouse anti-FLAG antibodies and analyzed by confocal microscopy. Shown are representative images of three independent experiments. Scale bar: 20 µm. (B) Pearson’s correlation between FLAG-UBXN1 and mitoYFP was calculated. Box-plots show results of three independent experiments with at least 20 cells per condition. Statistical significance was evaluated using Student’s t-test. n.s. and *** denote p > 0.05 and p < 0.001, respectively. (C) Cells were transfected with expression plasmid for FLAG-UBXN1 and mCherry-PRKN, fixed and stained using anti-FLAG antibodies. The box plot depicts the ratio PRKNUBXN1:PRKNcytosolic of 28 cells from two independent experiments. Determination of the ratio PRKNUBXN1adjacent:PRKNcytosolic (UBXN1 adjacent: 10 pixel left or right and up or down) served as control. Statistical significance was evaluated using Student’s t-test with *** denoting p < 0.001. (D) HeLa cells were transfected with expression plasmids for YFP-PRKN or mCherry-PRKN and untagged UBXN1 and treated with 25 µM CCCP for 6 h or left untreated. Immunoprecipitation was performed using mouse anti-GFP antibodies. Whole cell lysates and precipitates were separated by SDS-PAGE and immunoblotted for PRKN and UBXN1 using rabbit anti-GFP and anti-UBXN1 antibodies, respectively.
To characterize further the PRKN-dependency of UBXN1 recruitment to mitochondria, HeLa cells without exogenous PRKN were treated with deferiprone (DFP), an iron-chelating agent shown to induce PRKN-independent mitophagy [Citation19,Citation29]. Treatment of cells with 1 mM DFP for 24 h did neither lead to a redistribution of UBXN1 from cytosolic puncta (Fig. S3A) nor to a significant UBXN1 redistribution to mitochondria (Fig. S3B; Pearson’s correlation UBXN1-mitoYFP – no DFP: 0.31 ± 0.17; plus DFP: 0.22 ± 0.17). Similarly, DFP treatment of PRKN-expressing cells did not trigger translocation of UBXN1 to mitochondria (Fig. S3C: Pearson’s correlation UBXN1-mitoYFO – no DFP: 0.24 ± 0.1; plus DFP: 0.22 ± 0.17). Collectively, these findings further support the PRKN-dependency of UBXN1 translocation to damaged mitochondria.
Loss of UBXN1 impacts mitochondrial morphology and function
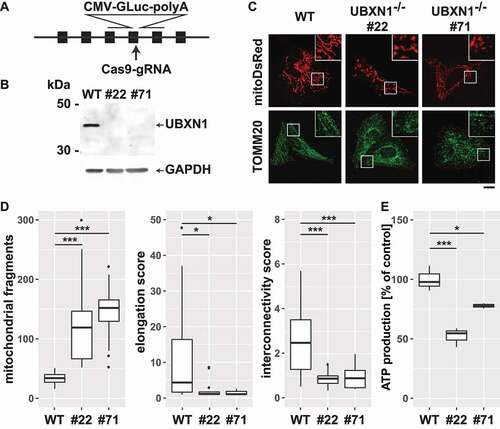
Next, we generated HeLa cells lacking UBXN1 using CRISPR-Cas9-mediated knockout (). Two independent HeLa UBXN1-/- clones (#22 and #71; ) lacking UBXN1 expression were obtained and studied side-by-side. To characterize the effects of UBXN1 deletion on mitochondrial physiology in the absence of mitophagic induction, mitochondrial morphology was analyzed. To this end, wild-type and HeLa UBXN1-/- cells were transfected with expression plasmid for mitoDsRed, fixed and stained for the OMM marker TOMM20, before mitochondrial morphology was analyzed by confocal microscopy. While wild-type HeLa cells displayed an interconnected mitochondrial network, lack of UBXN1 caused mitochondrial fragmentation (). Quantitative image analysis confirmed significantly increased number of individual mitochondria (wild-type: 34 ± 10.4; UBXN1-/- #22: 119 ± 65.2; UBXN1-/- #71: 152 ± 34.1 counts per cell), significantly diminished interconnectivity (wild-type: 2.49 ± 1.94; UBXN1-/- #22: 0.9 ± 0.64; UBXN1-/- #71: 0.88 ± 0.26 interconnectivity score) as well as significantly decreased mitochondrial length (wild-type: 4.36 ± 4.9; UBXN1-/- #22: 1.16 ± 0.25; UBXN1-/- #71: 1.1 ± 0.14 elongation score) when comparing cells lacking UBXN1 to wild-type controls (). Interestingly, ectopic expression of UBXN1 had no significant influence on mitochondrial morphology (Fig. S4A). To further characterize the role of UBXN1 in maintaining mitochondrial function, we measured cellular ATP generation and observed that UBXN1 loss caused a significantly decreased cellular capacity for ATP production ( – wild-type: 100 ± 10.5%; UBXN1-/- #22: 52.2 ± 8.1%; UBXN1-/- #71: 77.8 ± 2.2%). Collectively, these data demonstrate that UBXN1 is a significant regulator of mitochondrial morphology and bioenergetic function.
Figure 3. Loss of UBXN1 results in mitochondrial fragmentation and impaired ATP production. (A) HeLa cells were transfected with expression construct for SpCas9 carrying a specific sgRNA targeting the exon 4 of UBXN1 and a repair template for homologous recombination carrying 800 bp left and right homology to UBXN1 as well as secreted Gaussia luciferase (GLuc) under control of the CMV promoter. Following single cell cloning, potential UBXN1 deletion clones were identified by measuring luciferase activity in their cell culture supernatant. (B) Whole cell lysates of wild-type HeLa (WT) and HeLa UBXN1-/- clones 22 (#22) and 71 (#71) were analyzed by western blotting using polyclonal rabbit anti-UBXN1 and mouse anti-GAPDH antibodies. UBXN1 has a molecular weight of about 35 kDa. Please note the complete absence of UBXN1 in clones #22 and #71. (C) HeLa, HeLa UBXN1-/- clone 22 and HeLa UBXN1-/- clone 71 cells were transfected with expression plasmid for mitoDsRed or stained against TOMM20 and analyzed by confocal microscopy. Shown are representative images of three independent experiments. Scale bar: 20 µm. (D) Confocal images of panel C were analyzed to quantify mitochondrial fragment number per cell as well as elongation and interconnectivity of mitochondria in wild-type and UBXN1-/- HeLa cells. Boxplots represent three independent experiments with at least 10 cells per condition. (E) ATP content of wild-type and UBXN1-/- HeLa cells was measured using the ATPGlow assay (Promega) according to manufacturer’ instructions.
ER-mitochondrial apposition is diminished following loss of UBXN1
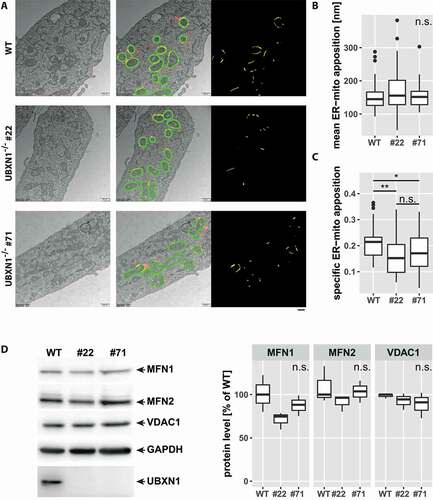
Previously, a role for UBXN1 in maintaining ER function through ERAD was reported [Citation27]. As the ER has great influence on mitochondrial morphology and function [Citation30], we analyzed the impact of UBXN1 loss on ER-mitochondrial apposition in electron microscopy images (). When determining the overlap between the ER and a 100 nm contact zone around mitochondria ([Citation20] – green masks in middle panels of ), we did not find a significant difference in the length of individual ER-mitochondrial appositions ( & yellow masks in rightmost panels of ). However, we found a significant decrease in the number of ER-mitochondrial appositions in UBXN1-/- cells compared to controls (length of ER inside contact zone:perimeter of mitochondria – WT: 0.21 ± 0.05; UBXN1-/- #22: 0.15 ± 0.08; UBXN1-/- #71: 0.17 ± 0.08 – ). This finding suggests an involvement of UBXN1 in maintaining ER-mitochondrial contact under non-mitophagic conditions. To further explore this finding, we quantified the levels of ER-mitochondrial tethers MFN1 and MFN2 and of VDAC1 (voltage-dependent anion channel 1). As shown in , levels of these ER-mitochondrial contact site proteins were not significantly changed between wild-type and UBXN1-/- cells.
Figure 4. Altered ER-mitochondrial apposition following loss of UBXN1. (A) HeLa (WT), HeLa UBXN1-/- clone 22 (#22) and HeLa UBXN1-/- clone 71 (#71) cells were imaged by transmission electron microscopy. Mitochondria as well as mitochondria-adjacent ER structures (red or yellow) were masked and overlap (yellow) of mitochondrial and ER mask in a 100 nm contact zone (green) was analyzed. ER-mitochondrial apposition is shown in the right most panel (yellow). Scale bar: 500 nm. (B) The boxplot represents the median length of ER-mitochondrial appositions in nm or (C) specific ER-mitochondria apposition from 32 to 41 images (10.8 ± 2.4 mitochondria per image) per condition from two independent experiments. Statistical significance was asserted using non-parametric Kruskal-Wallis followed by Wilcoxon rank sum testing. * p < 0.05, ** p < 0.01, n.s. p > 0.05. (D) Western blotting was used to quantitatively compare MFN1, MFN2, and VDAC1 protein levels between wild-type and UBXN1-/- cells (clone 22 and clone 71). Detection of GAPDH and UBXN1 served as controls. Boxplots represent three biological with two technical replicates each. One-way ANOVA analysis did not reveal statistically significant differences for MFN1, MFN2, or VDAC1 levels between wild-type and UBXN1-/- cells.
Lack of UBXN1 impacts mitochondrial recruitment of VCP
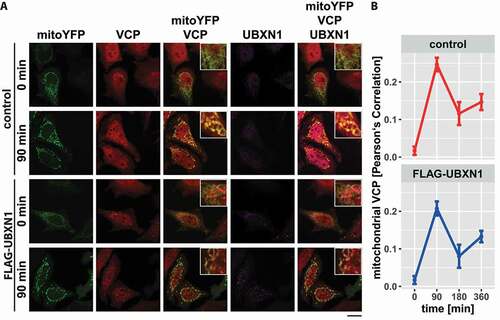
Mitochondrial translocation of VCP is an early event during mitophagy [Citation19]. Thus, we investigated the effect of ectopic UBXN1 expression on the dynamic of mitochondrial accumulation of VCP before and after CCCP treatment (). Image analysis of HeLa cells expressing mitoYFP-T2A-MYC-PRKN either alone or in combination with FLAG-UBXN1 did not reveal any changes in the dynamic of VCP accumulation. Irrespective of ectopic UBXN1 expression, mitochondrial accumulation of VCP peaked around 90 min with a drop of mitochondrial VCP apparent at 180 and 360 min of CCCP treatment (: control – 0 min: 0.017 ± 0.011, 90 min: 0.247 ± 0.018, 180 min: 0.116 ± 0.031, 360 min: 0.147 ± 0.021; FLAG-UBXN1 – 0 min: 0.017 ± 0.011, 90 min: 0.208 ± 0.019, 180 min: 0.08 ± 0.031, 360 min: 0.133 ± 0.015). Using two-way ANOVA, no significant difference between control and FLAG-UBXN1-expressing cells was detectable.
Figure 5. Mitochondrial recruitment of VCP is not influenced by ectopic UBXN1 expression. (A) HeLa cells transfected with expression plasmid for FLAG-UBXN1 or control vector and mitoYFP-T2A-MYC-PRKN, treated with 25 µM CCCP for 90, 180, 360 min or left untreated, were fixed, stained using rabbit anti-FLAG and mouse anti-VCP antibodies and imaged by confocal microscopy. Shown are representative images from three independent experiments after 90 min of CCCP treatment. Scale bar: 20 µm. (B) Mitochondrial translocation of VCP was quantified using line drawings across mitochondria. The plot presents the mean Pearson’s correlation of 73 to 137 cells from three independent experiments. Statistical significance was tested using unbalanced one-way ANOVA.
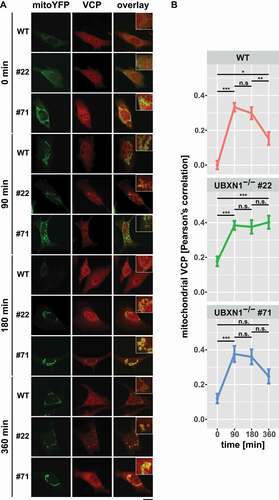
Next, we comparatively measured mitochondrial accumulation of VCP in UBXN1-/- cells versus wild-type controls. To this end, HeLa cells and HeLa cells lacking UBXN1 and expressing mitoYFP-T2A-MYC-PRKN were treated with 25 µM CCCP for 0, 90, 180, and 360 min prior to fixation and staining of endogenous VCP (). When measuring Pearson’s correlation between mitochondrial and VCP signal (), a role for UBXN1 in regulating the dynamics of VCP mitochondrial translocation became apparent. In wild-type cells, a sharp increase in mitochondrial VCP was detectable at 90 min after CCCP treatment (0 min: 0.000 ± 0.024; 90 min: 0.333 ± 0.025). While VCP translocation was also detected in UBXN1-/- cells, a significant mitochondrial buildup of VCP was already present at baseline (clone #22 – 0 min: 0.178 ± 0.028, 90 min: 0.385 ± 0.026; clone #71 – 0 min: 0.120 ± 0.027, 90 min: 0.376 ± 0.046). After peaking between 90 to 180 min of CCCP treatment, mitochondrial VCP significantly declined in wild-type cells (180 min: 0.298 ± 0.034, 360 min: 0.153 ± 0.037). In contrast, cells lacking UBXN1 displayed an altered dynamics of VCP retrotranslocation. In cells of UBXN1-/- clone 22, mitochondrial VCP stayed at peak levels for up to 360 min of CCCP treatment (180 min: 0.376 ± 0.039, 360 min: 0.402 ± 0.038). In cells of UBXN1-/- clone 71, mitochondrial VCP diminished to some extend (180 min: 0.359 ± 0.043, 360 min: 0.247 ± 0.041), but not as pronounced as in wild-type cells (borderline significance of p = 0.07 for comparison 180 to 360 min).
Figure 6. Loss of UBXN1 impacts mitochondrial recruitment of VCP. (A) HeLa (WT), HeLa UBXN1-/- clone 22 (#22) and clone 71 (#71) cells transfected with an expression plasmid for mitoYFP-T2A-MYC-PRKN, treated with 25 µM CCCP for 90, 180, 360 min or left untreated, were fixed, stained using mouse anti-VCP antibodies and imaged by confocal microscopy. Shown are representative images from two independent experiments after 90, 180, and 360 min of CCCP treatment. Scale bar: 20 µm. (B) Mitochondrial translocation of VCP in HeLa was quantified by line drawings across mitochondria of wild-type and UBXN1-/- clone #22 and #71 cells. Shown is the mean Pearson’s correlation between VCP and mitoYFP of 28 to 125 cells per condition from two independent experiments. Statistical significance was tested using unbalanced two-way ANOVA followed by Student’s t-test with “fdr” adjustment for multiple testing.
UBXN1 UBX domain mediates UBXN1-PRKN interaction and mitochondrial translocation
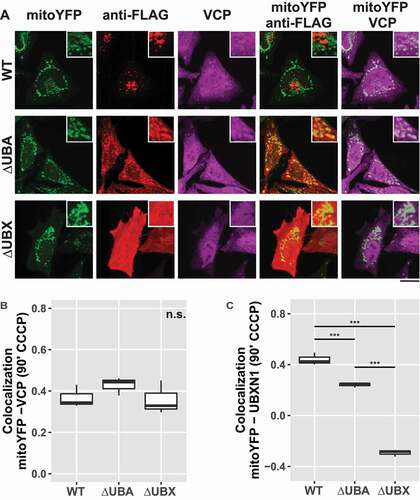
UBXN1 contains a central coiled-coil domain flanked by an N-terminal UBA and a C-terminal UBX domain. To gain further insight into UBXN1 activity, we generated UBXN1 mutants lacking either UBA or UBX domain (). First, we assessed whether ectopic expression of these truncated UBXN1 variants interfered with mitochondrial translocation of PRKN in CCCP treated cells. As shown in and quantified in , no significant difference in PRKN translocation was apparent between full-length and truncated UBXN1 expressing cells (PRKN-mitoDsRed in FLAG-UBXN1: 0.89 ± 0.05; FLAG-UBXN1ΔUBA: 0.93 ± 0.04; FLAG-UBXN1ΔUBX: 0.91 ± 0.04). We also noted a distinct difference in the appearance of FLAG-UBXN1ΔUBX and FLAG-UBXN1ΔUBA. While FLAG-UBXN1ΔUBX was more uniformly distributed, FLAG-UBXN1ΔUBA displayed a more granular appearance. In comparison to full-length UBXN1, however, truncation of either UBX or UBA domains led to the loss of cytosolic UBXN1 puncta observed in the absence of CCCP (see ). As full-length UBXN1 copurified with PRKN (see ), we investigated how the absence of either UBA or UBX domain impacted this interaction. To this end, we co-expressed YFP-PRKN or mCherry-PRKN together with FLAG-UBXN1ΔUBX or FLAG-UBXN1ΔUBA and performed co-immunoprecipitation using anti-GFP antibodies. As shown in , specific interaction between YFP-PRKN and FLAG-UBXN1ΔUBA but not between YFP-PRKN and FLAG-UBXN1ΔUBX was detectable suggesting that the UBX domain of UBXN1 is necessary for the observed direct or indirect interaction between UBXN1 and PRKN. As loss of UBXN1 had impact on mitochondrial recruitment of VCP (see ), we studied the effect of expressing truncation mutants of UBXN1 on this process. Therefore, we treated PRKN-expressing HeLa cells with CCCP for 90 min as we had observed maximum VCP recruitment at this time point. As shown in and quantified in , we did not find a significant difference in mitochondrial VCP between FLAG-UBXN1 and FLAG-UBXN1ΔUBA or FLAG-UBXN1ΔUBX-expressing cells although expression of FLAG-UBXN1ΔUBA seemed to slightly increase VCP recruitment (Pearson’s correlation VCP-mitoYFP at 90 min CCCP ─ FLAG-UBXN1: 0.34 ± 0.02; FLAG-UBXN1ΔUBA: 0.44 ± 0.03; FLAG-UBXN1ΔUBX: 0.32 ± 0.05). When analyzing mitochondrial localization (), FLAG-UBXN1 and to a somewhat lower extent FLAG-UBXN1ΔUBA overlapped with mitochondria while lack of the UBX domain prevented mitochondrial translocation of FLAG-UBXN1ΔUBX (Pearson’s correlation at 90 min CCCP – FLAG-UBXN1-mitoYFP: 0.42 ± 0.03; FLAG-UBXN1ΔUBA-mitoYFP: 0.25 ± 0.002; FLAG-UBXN1ΔUBX-mitoYFP: −0.28 ± 0.02).
Figure 7. UBX domain of UBXN1 mediates interaction with PRKN. (A) Schematic depicting the domain organization of UBXN1 and mutants of UBXN1 used in this study. (B) HeLa cells transfected with expression plasmids for mitoDsRed, YFP-PRKN and FLAG-UBXN1 (not shown) FLAG-UBXN1ΔUBX or FLAG-UBXN1ΔUBA were treated with 25 µM CCCP for 6 h or left untreated as control. Cells were fixed, stained using mouse anti-FLAG antibodies and analyzed by confocal microscopy. Representative images obtained from three independent experiments are displayed. Scale bar: 20 µm. (C) Mitochondrial translocation of YFP-PRKN was assessed by correlating PRKN and mitoDsRed distribution (Pearson’s correlation) in confocal images from B. Boxplots represent three independent experiments with at least 30 cells per condition. No statistical significant difference between treatment groups was found by unbalanced one-way ANOVA. (D) Immunoprecipitation using anti-GFP antibodies were performed on whole cell lysates (WCL) of HeLa cells transfected with expression plasmids for either YFP-PRKN or mCherry-PRKN and FLAG-UBXN1ΔUBX or FLAG-UBXN1ΔUBA. WCLs, immunopurified and co-purifying proteins were analyzed by western blotting using anti-GFP and anti-UBXN1 antibodies respectively. Due to their size difference, western blots of 9% and 12% SDS-PAGE for analysis of FLAG-UBXN1ΔUBX or FLAG-UBXN1ΔUBA co-purification are shown.
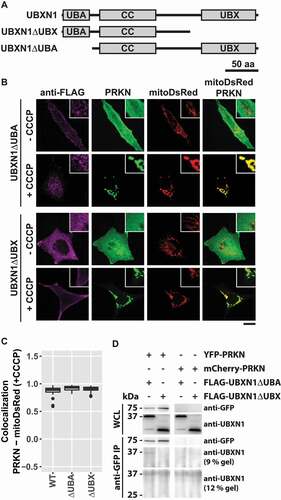
Figure 8. Mitochondrial recruitment of VCP depends on the UBA and UBX domain of UBXN1. (A) HeLa cells transfected with expression plasmids for mitoYFP-T2A-MYC-PRKN, FLAG-UBXN1 (not shown), FLAG-UBXN1ΔUBX or FLAG-UBXN1ΔUBA and treated with 25 µM CCCP for 90 min were fixed and stained using mouse anti-VCP and rabbit anti-FLAG antibodies. Shown are representative experiments of three independent experiments. Scale bar: 20 µm. (B) Colocalization of mitoYFP and VCP or (C) mitoYFP and FLAG-UBXN1, FLAG-UBXN1ΔUBX or FLAG-UBXN1ΔUBA was quantified by Pearson’s correlation in confocal images of A. The boxplots represent three independent experiments with at least 30 cells per condition and experiment. Statistical significance was assessed by one-way ANOVA followed by Student’s t-test with “fdr” adjustment for multiple testing. n.s. – p > 0.05; *** – p < 0.001.
Loss of UBXN1 impacts mitophagy
Accumulation of MAP1LC3B foci following mitochondrial depolarization under conditions of blocked lysosomal degradation is a measure of mitophagic flux. To assess the impact of ectopic expression of UBXN1 on the induction of mitophagy, the cell area covered by MAP1LC3B foci after combined treatment with CCCP and lysosomal maturation inhibitor bafilomycin A1 was quantified. Treatment with CCCP alone as well as transfection with empty vector served as control. As shown in Fig. S4B, ectopic UBXN1 expression did not induce a significant difference in MAP1LC3B foci formation when compared to control cells treated for 18 h either with CCCP alone or with CCCP in combination with bafilomycin A1. This observation indicates that the amount of UBXN1 per se is not a limiting factor during induction of mitophagy.
To investigate the consequences of UBXN1 loss on mitophagy, wild-type and UBXN1-/- HeLa cells transfected with expression plasmid for YFP-PRKN and mCherry-MAP1LC3B were treated with CCCP for 0, 6 or 24 h and analyzed by confocal microscopy (). Upon CCCP treatment, mitophagic induction was accompanied by a decline in relative mitochondrial mass in both, wild-type and UBXN1-/- cells ( – 0 h CCCP – wild-type: 0.142 ± 0.028, UBXN1-/- #22: 0.098 ± 0.023, UBXN1-/- #71: 0.133 ± 0.032; 6 h CCCP – wild-type: 0.068 ± 0.015, UBXN1-/- #22: 0.049 ± 0.016, UBXN1-/- #71: 0.06 ± 0.014; 24 h CCCP – wild-type: 0.031 ± 0.017, UBXN1-/- #22: 0.037 ± 0.021, UBXN1-/- #71: 0.042 ± 0.017). While in wild-type cells mitochondrial mass declined to 21.8% of initial amount, in UBXN1-/- cells, however, mitochondrial mass fell only to 31.6 (clone #22) and 36.7% (clone #71), respectively. Two-way ANOVA analysis revealed a significant difference between genotypes (p < 1.8x10⁻⁹) and between genotypes over time (p < 2x10⁻⁴), indicating that UBXN1 is important for maintaining mitophagic activity.
Figure 9. Loss of UBXN1 negatively impacts mitophagic flux. (A) HeLa cells (WT) and HeLa UBXN1-/- clone 22 (#22) and clone 71 (#71) cells transfected with expression plasmids for mCherry-MAP1LC3B and YFP-PRKN and treated with 25 µM CCCP for 6 h were fixed and stained using mouse anti-CYCS antibodies and imaged by confocal microscopy. Shown are representative images from three independent experiments. Scale bar: 20 µm. (B) Loss of mitochondrial mass was determined in images of panel A. Shown is the mean mitochondrial area from 32 to 51 cells per condition from three independent experiments. (C) Overlap between CYCS and MAP1LC3B as determined in images of panel A. Shown are mean percent mitochondrial area overlapping with MAP1LC3B from 32 to 51 cells per condition from three independent experiments. (D) HeLa cells (WT) and cells of HeLa UBXN1-/- clone 22 (#22) and HeLa UBXN1-/- clone 71 (#71) were transfected with expression plasmids for GFP-MAP1LC3B and mCherry-PRKN, treated with 25 µM CCCP or 25 µM CCCP plus 100 nM bafilomycin A1 for 18 h. After fixation, cells were and imaged by confocal microscopy. Scale bar: 20 µm. (E) Using image analysis on confocal images of panel D, the density of GFP-MAP1LC3B dots as measure of autolysosome area per cell was determined. The boxplot represents data from 28 to 40 cells per condition.
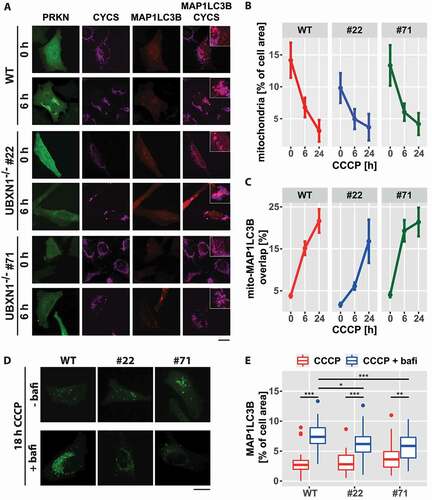
Analyzing the overlap between mitochondria and mCherry-MAP1LC3B upon CCCP treatment showed increased formation of mitochondria-containing autolysosomes ( ─ percent of mitochondrial marker overlapping with MAP1LC3B: 0 h CCCP – WT: 3.8 ± 0.41, UBXN1-/- #22: 1.7 ± 0.47, UBXN1-/- #71: 4 ± 0.56; 6 h CCCP – WT: 15.1 ± 1.6, UBXN1-/- #22: 6.1 ± 0.9, UBXN1-/- #71: 19.3 ± 2.56; 24 h CCCP – WT: 21.6 ± 2.8, UBXN1-/- #22: 16.8 ± 5.2, UBXN1-/- #71: 21.4 ± 3.4). Although mitochondrial autolysosome formation in UBXN1-/- #22 cells seemed to be somewhat lower, two-way ANOVA revealed no difference between the three cell lines. These observations suggest that upon mitochondrial depolarization, mitophagosome formation is not significantly influenced by loss of UBXN1 in PRKN-expressing cells.
To resolve the apparent difference between mitophagosome formation and loss of mitochondrial mass in UBXN1-/- cells, we quantified overall formation of autolysosomes upon CCCP treatment under conditions of inhibited lysosomal acidification/degradation. As shown in , loss of UBXN1 did indeed negatively impact autolysosome formation when lysosomal acidification/degradation was blocked by bafilomycin A1. Whereas, compared to CCCP-only treated cells, the amount of MAP1LC3B foci was higher in bafilomycin A1 and CCCP-treated wild-type cells, accumulation of MAP1LC3B foci was less pronounced in UBXN1-/- cells under these treatment conditions (; wild-type – CCCP: 2.7 ± 1.2%, CCCP+bafilomycin A1: 7.4 ± 2.1%; UBXN1-/- #22 – CCCP: 2.8 ± 1.5%, CCCP+bafilomycin A1: 6.2 ± 2%; UBXN1-/- #71 – CCCP: 3.6 ± 1.9%, CCCP-bafilomycin A1: 5.9 ± 2.8%). Two-way ANOVA revealed a significant difference for the effect of CCCP or CCCP and bafilomycin A1 on wild-type and UBXN1-/- cells (p < 7.4x10⁻⁴). Together, these data are consistent with a moderate impact of UBXN1 loss on the autophagic degradation of mitochondria.
UBXN1 modulates the dynamics of PRKN translocation to mitochondria
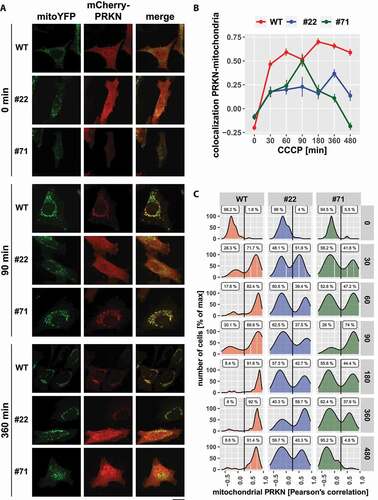
The moderately diminished mitophagic flux in UBXN1-/- cells promoted us to investigate initiation of mitophagy following mitochondrial depolarization. First, PRKN recruitment was quantified in cells ectopically expressing FLAG-UBXN1 together with mitoYFP and mCherry-PRKN following mitochondrial depolarization for up to 6 h. We found that ectopic expression of FLAG-UBXN1 did not significantly influence PRKN translocation over time compared to control cells (Fig. S5A and B). Next, we investigated the impact of UBXN1 loss on PRKN recruitment. As shown in , addition of CCCP triggered widespread PRKN translocation to mitochondria in wild-type cells as early as 30 min after mitochondrial depolarization, and robust mitochondrial PRKN was observed up to 480 min after onset of treatment. In contrast, PRKN translocation in UBXN1-/- cells was less pronounced and not sustained compared to wild-type controls (). When comparing PRKN translocation at the levels of individual cells (), two distinct cell populations were apparent in UBXN1-/- cells compared to wild-type controls. While at various time points between 60 and 95% of cells completely lack PRKN recruitment to mitochondria, the remainder of cells displayed PRKN recruitment comparable to wild-type cells. Whereas prolonged mitochondrial depolarization in wild-type cells led to the accumulation of cells with translocated PRKN, PRKN remained cytosolic in the majority of UBXN1-/- cells under these conditions. As the population with cytosolic PRKN increased over time in UBXN1-/- cells, this might hint toward a role for UBXN1 in stabilizing PRKN on mitochondria. This potential role for UBXN1 in stabilizing PRKN recruitment was further confirmed by ectopically expressing FLAG-UBXN1 in UBXN1-/- cells. Re-introduction of UBXN1 into these cells restored PRKN translocation to wild-type levels (Fig. S6A and B), confirming that UBXN1 is required for PRKN translocation.
Figure 10. Loss of UBXN1 alters the dynamic of PRKN translocation to mitochondria. (A) HeLa cells and cells of HeLa UBXN1-/- clone 22 (#22) and clone 71 (#71) were transfected with expression plasmids for mitoYFP and mCherry-PRKN and treated with 25 µM CCCP for 30, 60, 90, 180, 360 and 480 min or left untreated, fixed and imaged by confocal microscopy. Shown are representative images from three independent experiments for untreated cells, or cells after 90 and 360 min of CCCP treatment. Scale bar: 20 µm. (B) Colocalization of mitoYFP and mCherry-PRKN was measured by line drawing. Shown are the mean Pearson’s correlations of three independent experiments with 53 to 115 cells per condition from three independent experiments. Statistical significance was determined using unbalanced two-way ANOVA followed by Student’s t-test with “fdr” to account for multiple testing. (C) Translocation of PRKN to mitochondria was analyzed as in B. Shown are density plots scaled to 100%. A gate was set at 0.25 to distinguish cytosolic from mitochondrial PRKN. The gate labels correspond to the percentage of cells contained in each gate.
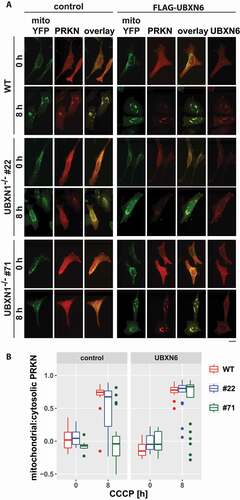
We previously reported a role for the VCP cofactor UBXN6 in PRKN recruitment during mitophagy [Citation23]. To investigate a potential interplay between UBXN6 and UBXN1, we quantified PRKN recruitment following mitophagic induction in wild-type and UBXN1-/- cells under conditions of ectopic UBXN6 expression. Interestingly, UBXN6 expression in UBXN1-/- cells restored PRKN translocation to control levels (). This finding suggests a strong interplay between or redundant activity of these two VCP cofactors during mitochondrial PRKN translocation and the initiation phase of mitophagy.
Figure 11. Ectopic expression of the mitochondrial VCP cofactor UBXN6 promotes PRKN translocation in cells lacking UBXN1. (A) HeLa cells (WT) and cells of HeLa UBXN1-/- clone 22 (#22) and clone 71 (#71) were transfected with expression plasmids for FLAG-UBXN6 or control vector, mitoYFP and mCherry-PRKN, treated with 25 µM CCCP for 8 h, fixed, stained using rabbit anti-FLAG antibodies and imaged by confocal microscopy. Shown are representative images from two independent experiments. The overlay panel displays mitoYFP and mCherry-PRKN. Scale bar: 20 µm. (B) Distribution of mitoYPF and mCherry-PRKN staining was measured by line drawing. Shown are boxplots of Pearson’s correlations of two independent experiments with 18 to 33 cells per condition. Statistical significance was assessed by unbalanced two-way ANOVA with Student’s t-test applying “fdr” correction to account for multiple testing.
UBXN1 impacts removal of MFN2 during mitophagic initiation downstream of PINK1
PRKN recruitment to mitochondria critically depends on mitochondrial accumulation of the ubiquitin-kinase PINK1 [Citation31]. Therefore, we addressed the question of whether UBXN1 might not only be epistatic to mitochondrial recruitment of PRKN but also PINK1. To this end, we comparatively analyzed the stabilization and accumulation of full-length PINK1 in wild-type versus UBXN1-/- cells. In untreated cells, full-length PINK1 was not detectable by western blotting (). After the addition of CCCP, PINK1 became apparent in wild-type as well as in UBXN1-/- cells. Thus, loss of UBXN1 did not interfere with PINK1 stabilization, positioning UBXN1 downstream of PINK1 activation during mitophagy.
Figure 12. Loss of UBXN1 leads to para-mitochondrial accumulation of MFN2 interfering with PRKN translocation. (A) wild-type (WT) and UBXN1-/- HeLa cells (#22 and #71) without ectopic PRKN expression were treated with 25 µM CCCP for 6 h. Whole cell lysates were analyzed by western blotting using anti-PINK1, anti-UBXN1 and anti-GAPDH antibodies. (B) wild-type (WT) and HeLa UBXN1-/- clone 22 (#22) and clone 71 (#71) cells were transfected with an expression plasmid for mCherry-PRKN or control vector, fixed, stained using rabbit anti-MFN2 antibodies and mouse anti-CYCS antibodies and imaged by confocal microscopy. Shown are representative images from three independent experiments. Scale bar: 20 µm. (C) Percentage of cells with MFN2 blobs in mCherry-PRKN or control transfected wild-type, HeLa UBXN1-/- clone 22 and clone 71 cells. The bar graph shows data from three independent experiments with 28 to 68 cells per condition. Statistical significance was tested by unbalanced two-way ANOVA followed by Student’s t-test with “fdr” adjustment for multiple testing. (D) HeLa cells and cells of HeLa UBXN1-/- clone 22 (#22) and clone 71 (#71) were transfected with expression plasmid for mCherry-PRKN and treated for 60 min with 25 µM CCCP, fixed, stained using rabbit anti-MFN2 antibodies and mouse anti-CYCS antibodies and imaged by confocal microscopy. Shown are representative images from three independent experiments. Scale bar: 20 µm. (E) Dot blot to depict correlation between MFN2 blob formation and PRKN translocation to depolarized mitochondria in cells of panel D. Data shown are derived from three independent experiments with 81 to 116 cell per condition. Statistical significance was ascertained using the chi-squared test.
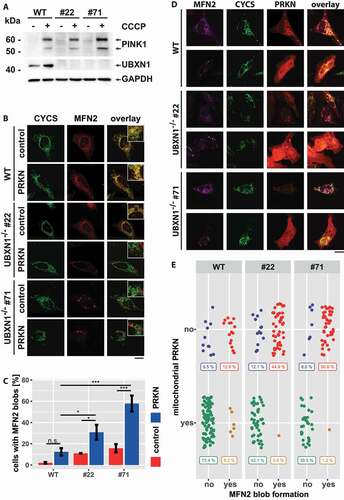
In addition to PINK1 activation, removal of the mitofusin MFN2 from the OMM is critical for robust accumulation of PRKN on mitochondria. To test whether UBXN1 might be involved in mitofusin handling during mitophagic initiation, we stained MFN2 in wild-type and UBXN1-/- cells transfected with expression plasmid for PRKN or empty vector control. Whereas we found MFN2 localized to mitochondria in wild-type cells (, upper panel), a different localization was apparent in UBXN1-/- cells (, lower panels). Especially in PRKN-expressing cells, MFN2 seemed to coalesce into large mitochondria-adjacent blobs. Quantitative analysis confirmed the PRKN and UBXN1 dependency of MFN2 blob formation. Only 2.1 ± 0.7% or 12.4 ± 3.5% (p = 0.19) of wild-type cells displayed MFN2 blobs following transfection with control or PRKN plasmid, respectively. In UBXN1-/- cells, PRKN expression significantly increased the number of cells with MFN2 blobs compared to control transfected cells ( – control-UBXN1-/- #22: 11 ± 0.3%, UBXN1-/- #71: 15.8 ± 3.9%; PRKN-UBXN1-/- #22: 30.8 ± 7%, UBXN1-/- #71: 57.9 ± 7.6%). The appearance of MFN2 blobs in a small number of wild-type cells prompted us to assess whether MFN2 blob formation might be a consequence of cell stress triggered by the transfection procedure, given that lipid-based transfection reagents such as the ones used in our study were previously shown to trigger mitophagy [Citation32]. Indeed, no MFN2 blob formation was found in untransfected wild-type and, most significantly, UBXN1-/- cells (data not shown). In addition, ectopic expression of FLAG-UBXN1 in UBXN1-/- cell was able to reverse MFN2 blob formation by about 50% compared to control transfected cells (Fig. S7A). Interestingly, also ectopic expression of UBXN6 partially reversed MFN2 blob formation (Fig. S7B). Confocal microscopy analysis suggested a para-mitochondrial localization of MFN2 blobs, as judged by staining against CYCS (cytochrome c, somatic), which localized to the mitochondrial intermembrane space. Staining against OMM-localized TOMM20 confirmed the para-mitochondrial localization of MFN2 blobs (Fig. S7C) as TOMM20 staining was not found to surround MFN2 blobs.
As MFN2 removal is critical for mitophagic initiation and as loss of UBXN1 impacts PRKN accumulation on mitochondria, we correlated the presence of MFN2 blobs with mitochondrial PRKN translocation. As demonstrated in , PRKN was found to be cytosolic in cells with MFN2 blobs, while it was mitochondrially localized in cells lacking MFN2 blob structures. In UBXN1-/-, but not in wild-type cells, a positive correlation between MFN2 blobs and cytosolic PRKN localization was found. These data strongly argue for a role of UBXN1 in handling MFN2 during the initiation phase of mitophagy.
Discussion
Once activated, PINK1- and PRKN-dependent mitophagy efficiently eliminates dysfunctional mitochondrial subunits, safeguarding cellular function from runaway production of reactive oxygen species [Citation33]. While efficient, the removal of entire mitochondria is an energetically expensive process. Along with damaged mitochondria, a large amount of likely still functional mitochondrial components is also disposed. Thus, the decision to move from salvaging a low fidelity mitochondrium e.g. through OMMAD [Citation11] to complete lysosomal digestion is highly regulated. Our work now identified the VCP cofactor UBXN1, previously associated with ERAD [Citation27], as novel regulator of mitophagic initiation. Upon mitochondrial depolarization, UBXN1 translocated alongside VCP to mitochondria. Once on depolarized mitochondria, UBXN1 acted in a pro-mitophagic manner as evidenced by a diminished mitophagic flux in cells lacking UBXN1. This decrease of mitophagic flux in UBXN1-deficient cells was likely caused by impaired mitochondrial recruitment of VCP as well as of PRKN.
The effect of UBXN1 loss on PRKN translocation is noteworthy. Early during CCCP treatment, a large proportion of UBXN1-/- cells did not show any mitochondrial PRKN, while in the remaining fraction of cells PRKN translocation proceeded comparable to control cells. Thus, UBXN1 seems to be involved in an early step of PRKN translocation, before wholesale PRKN recruitment ensues. Interestingly, however, UBXN1 also impacted stability of mitochondrial PRKN at a later stage. While in wild-type cells PRKN was robustly found on mitochondria after 8 h of CCCP, PRKN seemed to redistribute from mitochondria toward the cytosol in UBXN1-/- cells following prolonged mitochondrial depolarization. This behavior of PRKN was not due to accelerated mitophagy in UBXN1-/- cells as degradation of mitochondria in these cells was less pronounced compared to wild-type cells. Thus, while not essential for PRKN translocation, UBXN1 modulated the dynamics of interaction between PRKN and mitochondria. As loss of UBXN1 favors cytosolic PRKN, UBXN1 likely acts as a factor stabilizing PRKN on mitochondria.
The physical interaction between UBXN1 and PRKN further supports this notion. It is conceivable that UBXN1 stabilizes PRKN interaction with mitochondria after depolarization, e.g via its polyubiquitin-binding UBA domain. The lack of interaction between UBXN1ΔUBX and PRKN is noteworthy. As the UBXN1 UBX domain makes direct contact with the VCP N terminus [Citation27], the observed UBXN1-PRKN interaction might be part of a larger regulatory complex. However, we want to stress that the observed interaction was only detectable following ectopic expression of PRKN and UBXN1. The need for overexpression might also explain interaction between these two proteins independent of mitophagic induction.
Besides its mitophagic role, UBXN1 might also be involved in non-mitophagic mitochondrial maintenance as its loss was accompanied by mitochondrial fragmentation and diminished ATP production. Whether there is a direct action of UBXN1 during e.g. OMMAD, however, remains unclear. As UBXN1 is involved in maintaining the endoplasmic reticulum with loss of UBXN1 influencing ER structure and ER-mitochondria apposition, the observed diminished fidelity of the mitochondrial network might originate from disturbed ER function. In fact, the impact on mitochondrial morphology seen in UBXN1-/- cells might be a direct consequence of disturbed ER-mitochondria contact, given that these contacts are major regulatory hubs for maintaining mitochondrial morphology [Citation34].
Next to the canonical VCP adaptor complex NPLOC4/Npl4-UFD1 [Citation35] and UBXN6 [Citation23], UBXN1 is the fourth VCP cofactor with a described mitochondrial function. As VCP serves as hub and enzymatic component for its cofactors, interplay and potentially overlapping or redundant activity between cofactors might be expected. Indeed, we observed ectopic expression of UBXN6 to reverse the effect of UBXN1 loss on PRKN translocation to mitochondria. Thus, it is highly likely that UBXN6 and UBXN1 together regulate VCP activity during mitophagy.
Ubiquitination of mitochondrial proteins by ubiquitin ligases such as MARCHF5/MARCH5 [Citation36,Citation37] and PRKN sets in motion a two-part program. First, initial VCP-mediated proteasomal degradation of K48-ubiquitinated regulators such as MFN2 [Citation19,Citation20] and Miro [Citation38] breaks tethering to the ER, affecting mitochondrial size and motility. These adjustments prepare mitochondrial subunits for autolyosomal uptake and critically allow for PRKN translocation. Second, PRKN-mediated wholesale ubiquitination forms a platform for the recruitment of the autophagosomal machinery.
We now find loss of UBXN1 to interfere with the removal of MFN2 from mitochondria by causing the formation of para-mitochondrial MFN2 blobs, structures that to our knowledge were previously unknown. Interestingly, these blobs were not observed in untreated/untransfected UBXN1-/- cells. However, cellular stress e.g. following mock-transfection triggered MFN2 blob formation. Nota bene, liposome-mediated transfection can be sufficient to trigger mitophagy [Citation32]. Interestingly, transfection with PRKN increased MFN2 blob formation even in the absence of additional mitochondrial damage. Most significantly, MFN2 blobs were also found in wild-type cells post-transfection, albeit in a very low fraction of cells. The strongly increased MFN2 blobs formation in UBXN1-/- cells suggests a mechanism of MFN2 degradation whereby MFN2 coalesces to specific sites on the OMM. From there, MFN2 is likely removed from mitochondria by VCP with the help of its cofactor UBXN1 for proteasomal degradation. Blocking removal through loss of UBXN1 likely hinders downstream processing, thereby leading to the accumulation of MFN2 in the observed structures. Interestingly, ectopic expression of UBXN6 was partially able to reverse MFN2 blob formation further supporting a close interplay or redundancy between the two mitochondrial VCP cofactors. The precise localization of these MFN2 blobs is of further interest. In our hands, MFN2 blobs did not overlap with the marker of the mitochondrial intermembrane space CYCS and, the OMM marker TOMM20 did not seem to circumscribe these structures. Nevertheless, MFN2 blobs were always found in close contact with mitochondria. We use the term para-mitochondrial to describe this localization. However, it is currently unclear whether MFN2 sequestered in these blobs indeed is already retrotranslocated out of the OMM, or whether the sheer amount of MFN2 simply displaced TOMM20 from these parts of the OMM. As loss of UBXN1 might conceivably affect VCP protein retrotranslocation activity, we favor the second possibility. Furthermore, the inhibition of PRKN translocation in the presence of MFN2 blobs might support this notion. As removal of MFN2 from mitochondria is critical for PRKN translocation, this argues against the idea of MFN2 blobs being accumulations of retrotranslocated MFN2 aggregating next to mitochondria. In fact, failure to process MFN2 arriving at the blob location might cause a protein trafficking backup in the OMM blocking the removal of MFN2 and other proteins preventing PRKN translocation. While our studies were performed in HeLa cells and relied on ectopic PRKN expression with the associated caveat of non-physiological levels of PRKN, it will be interesting to see the effect of UBXN1 in other cellular models with endogenous PRKN expression.
The newly discovered mechanism for removal of MFN2 and potentially other proteins from the OMM further connects VCP and its cofactors to mitophagic initiation. Prior to mitophagy, VCP and its mitochondrial cofactors might be critical for the cellular decision making to consign damaged mitochondrial subunits to lysosomal degradation.
Material and methods
Cell culture
HeLa cells were cultured in Dulbecco’s Modified Eagle’s Medium high glucose (Sigma-Aldrich, D5671), supplemented with 2 mM L-glutamine (Sigma-Aldrich, GT7513), 1 mM sodium pyruvate (Sigma-Aldrich, S8636) and 10% v:v fetal bovine serum (Sigma-Aldrich, F7524), at 37°C and 5% CO2. HeLa cells were transfected with plasmid DNA using either FuGENE 6 (Promega, E2691) or polyethylenimine PEI Max 40,000 (PolySciences Inc., 24,765–1) transfection reagent according to the manufacturer’s recommendation. Cells were treated with 25 µM of the protonophore carbonyl cyanide m-chlorophenyl hydrazone (Sigma-Aldrich, C2759) for indicated duration to induce mitochondrial depolarization or 24 h with 1 mM deferiprone (Sigma-Aldrich, 379,409) to induce PRKN-independent mitophagy. To block lysosomal degradation, cells were treated with 100 nM bafilomycin A1 (Sigma-Aldrich, SML-1661).
Generation of polyclonal rabbit anti-UBXN1 antibodies
N-terminally Cys2His6-tagged full-length UBXN1 was expressed in and purified from E. coli BL21 (DE3). Rabbits were immunized (BioGenes, GmbH) and polyclonal anti-UBXN1 serum was obtained. After reduction using dithiothreitol, purified Cys2His6-UBXN1 was coupled onto SulfoLink resin (Thermo Fisher Scientific, 44,995) according to manufacturer’s recommendation. Polyclonal rabbit anti-UBXN1 antibodies were affinity-purified using immobilized Cys2His6-UBXN1 and tested using whole cell lysates from HeLa cells transfected with FLAG-UBXN1 or vector control. One (endogenous UBXN1) or two bands (endogenous and FLAG-UBXN1) of expected size were detected (data not shown).
Immunofluorescence and confocal microscopy
HeLa cells cultured for 24 h on top of glass cover slips in six well plates containing two ml of media were transfected with the indicated expression plasmids using FuGENE 6 (Promega, E2691). Cells were fixed with 4% formaldehyde (Thermo Fisher Scientific, 28,908) in PBS (Thermo Fisher Scientific, 70,011,044) for 20 min at RT, washed with 1 ml PBS and permeabilized with 0.15% Triton X-100 (Sigma-Aldrich, 93443) in PBS for 15 min at RT and blocked with 10% BSA (Carl Roth, CP84.2) in PBS for 1 h at RT. Cells were incubated with primary antibodies for 2 h at RT or overnight at 4°C, washed with 10% BSA-PBS, incubated with secondary antibodies for 1 h at RT and washed with PBS. Primary antibodies used were mouse monoclonal anti-FLAG (F1804, Sigma-Aldrich), rabbit polyclonal anti-FLAG (Thermo Fisher Scientific, PA1-984B), mouse monoclonal anti-VCP (Thermo Fisher Scientific, MA3-004), rabbit monoclonal anti-MFN2 (Abcam, ab205236), mouse monoclonal anti-CYCS/cytochrome c (BD Bioscience, 556432), and mouse monoclonal anti-TOMM20 (Abcam, ab56783). As secondary antibodies, goat anti-mouse and goat anti-rabbit labeled with either Alexa Fluor 405, Alexa Fluor 488, Alexa Fluor 546, or Alexa Fluor 647 (Thermo Fisher Scientific, A31533, A11001, A11003, A11010, A21245) were used. Cells were mounted using VectaShield mounting medium (Vector Laboratories, H-1000). Confocal images were acquired on a Visitron CSU-W1 spinning disk confocal microscope with a 60x oil immersion objective (Visitron Systems GmbH).
Transmission electron microscopy
About 5 × 10⁶ HeLa or Hela UBXN1-/- cells were fixed at room temperature in a fixative solution composed by 4% paraformaldehyde (Electron Microscopy Sciences, 15710) and 5% glutaraldehyde (Electron Microscopy Sciences, 16310) in 0.1 M PIPES buffer (Sigma-Aldrich, P6757). After 20 min, cells were harvested in 2% paraformaldehyde and 2.5% glutaraldehyde in 0.1 M PIPES buffer using a cell scraper and pelleted for 5 min at 300x g into a 15-ml falcon tube. After pelleting, the fixative solution was replaced, the pellet dislocated with a pointed spatula and fixed for other 45 min at 4°C. Subsequently, the pellet was washed three times in cold 0.1 M PIPES, embedded in low melting point agarose (Sigma-Aldrich, A2576) and transferred to an ice bath until the agarose solidifies. The solid agarose plug containing the cells was trimmed into 1–2 mm3 cubes using a sharp razor blade and the cubes transferred into a small vial containing several milliliters of PBS buffer for 10 min. After two additional changes of buffer, samples were post-fixed in 1% buffered osmium tetroxide (Electron Microscopy Sciences, 19100) for 1 h at 4°C, rinsed in distilled water and en block stained with aqueous uranyl acetate (Electron Microscopy Sciences, 22400) for 1 h at 4°C in the dark. Cubes were then dehydrated in an ethanol series (30, 50, 75, 95, 100%). After three changes of absolute ethanol, samples were washed in acetone (Electron Microscopy Sciences, 15056) and finally embedded in a mixture of resin in acetone first and then in pure Epon 812 resin (Electron Microscopy Sciences, 14120). Embedding was carried out into a 60°C oven for 48 h until the epoxy resin was completely hardened and ready to section. Semi-thin sections were cut from blocks with a glass knife and the blocks were selected for thinning. Thin sections were cut with diamond knives, placed on copper grids, impregnated with uranyl acetate and lead citrate. Sections were observed into a FEI Tecnai T12 Transmission Electron Microscope operating at 80 kV. Images were recorded using a CCD Veleta digital camera.
Colocalization analysis
Pearson’s correlation (0: no correlation/co-localization, 1: complete correlation/co-localization, −1: complete anti-correlation/localization) of the fluorescence distribution of two proteins was used to assess mitochondrial translocation of proteins. To this end, two color channel (e.g. mitoYFP and FLAG-UBXN1) confocal images were processed using Fiji and Ilastik software [Citation39,Citation40]. For each cell, lines were drawn across mitochondria and fluorescence intensity along these lines for two color channels was determined. For each pair of fluorescence intensities distributions, Pearson’s correlation was calculated using the cor() function of the R stats package [Citation41].
Western blot analysis
To prepare whole cell lysates, cells were harvested and lysed in RIPA buffer (Thermo Fisher Scientific, 89900) supplemented with protease inhibitor (Roche, 05892791001). Protein concentrations were quantified by BCA protein assay (Thermo Fisher Scientific, 23225) using BSA as standard. To prepare samples for SDS-PAGE, whole cell lysates were mixed 1:1 with 2x Laemmli sample buffer and incubated 5 min at 95°C [Citation42]. For each condition, 20–40 µg of total proteins were separated by SDS-PAGE gel electrophoresis and transferred onto 0.45 µm nitrocellulose membrane (Sigma-Aldrich, GE10600003). Nonspecific binding was blocked using 3% SureBlock (LubioScience, SB232010) in PBS with 0.1% Tween-20 (Sigma-Aldrich, P1379), followed by incubation with primary antibodies overnight at 4°C and secondary antibodies for 2 h at RT. Primary antibodies used were rabbit polyclonal anti-GFP (Cell Signaling Technology, 2555), mouse monoclonal anti-GAPDH (Santa Cruz Biotechnology, sc-32233), rabbit monoclonal anti-PINK1 (Cell Signaling Technology, 6946), rabbit anti-MFN1 (Cell Signaling Technology, 14739), rabbit monoclonal anti-MFN2 (Abcam, ab205236), mouse anti-VDAC1 (Abcam, ab14734) and rabbit polyclonal anti-UBXN1 (this work). Secondary antibodies used were horseradish peroxidase coupled goat anti-rabbit (Thermo Fisher Scientific, A16104) or goat anti-mouse antibodies (Thermo Fisher Scientific, A16072). Blots were developed using ECL or ELC plus reagent (Thermo Fisher Scientific, 32109 or 32134) using a chemiluminescence imager (BioRad).
Immunoprecipitation
Protein lysates were prepared as described above. YFP-PRKN was immunopurified from 1.5 mg total protein using 1.5 µl of mouse monoclonal anti-GFP antibodies (Roche, 11814460001) and 50 µl of protein A + G sepharose beads (Santa Cruz Biotechnology, sc-2003).
Generation of UBXN1 knock out cell lines
HeLa cells were transfected with a plasmid for the expression of SpCas9 based on pX459 [Citation43] and a guideRNA assembled from oligo nucleotides CACCGAGACCTGGCTGCTAACTCCT and AAACAGGAGTTAGCAGCCAGGTCTC targeting UBXN1. Additionally, a plasmid containing a repair template with 800 bp homology to the UBXN1 genomic region upstream as well as downstream of the guideRNA binding site flanking a CMV-based expression cassette for secreted Gaussia luciferase was transfected. Cells were single cloned by limiting dilution, visually inspected for single colony formation and cell culture supernatant was assayed for the presence of secreted luciferase according to manufacturer’s recommendation (Thermo Fisher Scientific, 16161). Luciferase-positive clones were expanded and analyzed by PCR and western blot using rabbit anti-UBXN1 antibodies.
Statistical analysis
Statistical analyses were performed using R [Citation41]. Graphs were prepared using the R package ggplot2 [Citation44]. Boxplots were drawn using R library ggplot2 with default settings. The band marks the median, while the lower and upper hinges correspond to the 25th and 75th percentile, respectively. The upper whisker extends from the hinge to the largest value no further than 1.5 times the interquartile range from the hinge, while the lower whisker extends from the hinge to the smallest value at most 1.5 times the interquartile range. Data points outside the range represented by the whiskers are depicted with points. Statistical significance was assessed using chi-square test for count data. For continuous response variables, statistical significance was tested using non-parametric Kruskal-Wallis followed by Wilcoxon rank sum testing or unbalanced one or two-way ANOVA followed by Student’s t-test with false discovery rate (fdr) p-value adjustment to account for multiple testing when appropriate. For all tests, differences with p < 0.05 were considered significant. On figures, p values > 0.05 are labeled with n.s., p < 0.05 with *, p < 0.01 with ** and p < 0.001 with ***.
Supplemental Material
Download MS Word (16.9 KB)Acknowledgments
The authors want to thank the microscopy facility of the Department of Biomedicine (University Hospital Basel, University of Basel, Basel, Switzerland) for their help and support. We would like to thank Dr. Cinzia Tiberi Schmidt (BioEM lab, Biozentrum, University of Basel, Switzerland) for her kind assistance with transmission electron microscopy. This work was supported by a grant of the Swiss National Science Foundation (31003A_165824) to AN.
Disclosure statement
The authors declare neither financial nor non-financial conflict of interest.
Supplementary material
Supplemental data for this article can be accessed here
Additional information
Funding
References
- Karbowski M, Neutzner A. Neurodegeneration as a consequence of failed mitochondrial maintenance. Acta Neuropathol. 2012;123(2):157–171.
- Sun N, Youle RJ, Finkel T. The mitochondrial basis of aging. Mol Cell. 2016;61(5):654–666.
- Pickrell AM, Youle RJ. The roles of PINK1, parkin, and mitochondrial fidelity in Parkinson’s disease. Neuron. 2015;85(2):257–273.
- Xie C, Aman Y, Adriaanse BA, et al. Culprit or bystander: defective mitophagy in Alzheimer’s disease. Front Cell Dev Biol. 2019;7:391.
- Franco-Iborra S, Plaza-Zabala A, et al. Mutant HTT (huntingtin) impairs mitophagy in a cellular model of Huntington disease. Autophagy. 2021;17(3):672-689.
- Evans CS, Holzbaur ELF. Autophagy and mitophagy in ALS. Neurobiol Dis. 2019;122:35–40.
- Narendra DP, Jin SM, Tanaka A, et al. PINK1 is selectively stabilized on impaired mitochondria to activate Parkin. PLoS Biol. 2010;8(1):e1000298. .
- Matsuda N, Sato S, Shiba K, et al. PINK1 stabilized by mitochondrial depolarization recruits Parkin to damaged mitochondria and activates latent Parkin for mitophagy. J Cell Biol. 2010;189(2):211–221.
- Gladkova C, Maslen SL, Skehel JM, et al. Mechanism of parkin activation by PINK1. Nature. 2018;559(7714):410–414.
- Stach L, Freemont PS. The AAA+ ATPase p97, a cellular multitool. Biochem J. 2017;474(17):2953–2976.
- Fang L, Hemion C, Pinho Ferreira Bento AC, et al. Mitochondrial function in neuronal cells depends on p97/VCP/Cdc48-mediated quality control. Front Cell Neurosci. 2015;9:16.
- Karbowski M, Youle RJ. Regulating mitochondrial outer membrane proteins by ubiquitination and proteasomal degradation. Curr Opin Cell Biol. 2011;23(4):476–482.
- Wu X, Rapoport TA. Mechanistic insights into ER-associated protein degradation. Curr Opin Cell Biol. 2018;53:22–28.
- Franz A, Ackermann L, Hoppe T. Ring of change: CDC48/p97 drives protein dynamics at chromatin. Front Genet. 2016;7:73.
- Watts GD, Wymer J, Kovach MJ, et al. Inclusion body myopathy associated with Paget disease of bone and frontotemporal dementia is caused by mutant valosin-containing protein. Nat Genet. 2004;36(4):377–381.
- Abramzon Y, Johnson JO, Scholz SW, et al. Valosin-containing protein (VCP) mutations in sporadic amyotrophic lateral sclerosis. Neurobiol Aging. 2012;33(9):2231 e1–2231 e6.
- Hemion C, Flammer J, Neutzner A. Quality control of oxidatively damaged mitochondrial proteins is mediated by p97 and the proteasome. Free Radic Biol Med. 2014;75:121–128.
- Xu S, Peng G, Wang Y, et al. The AAA-ATPase p97 is essential for outer mitochondrial membrane protein turnover. Mol Biol Cell. 2011;22(3):291–300.
- Tanaka A, Cleland MM, Xu S, et al. Proteasome and p97 mediate mitophagy and degradation of mitofusins induced by Parkin. J Cell Biol. 2010;191(7):1367–1380.
- McLelland GL, Goiran T, Yi W, et al. Mfn2 ubiquitination by PINK1/parkin gates the p97-dependent release of ER from mitochondria to drive mitophagy. Elife. 2018;7. DOI:https://doi.org/10.7554/eLife.32866.
- De Brito OM, Scorrano L. Mitofusin 2 tethers endoplasmic reticulum to mitochondria. Nature. 2008;456(7222):605–610.
- Van Den Boom J, Meyer H. VCP/p97-mediated unfolding as a principle in protein homeostasis and signaling. Mol Cell. 2018;69(2):182–194.
- Bento AC, Bippes CC, Kohler C, et al. UBXD1 is a mitochondrial recruitment factor for p97/VCP and promotes mitophagy. Sci Rep. 2018;8(1):12415.
- McNeill H, Knebel A, Arthur J, et al. A novel UBA and UBX domain protein that binds polyubiquitin and VCP and is a substrate for SAPKs. Biochem J. 2004;384(Pt 2):391–400.
- Ishibashi T, Ogawa S, Hashiguchi Y, et al. A novel protein specifically interacting with Homer2 regulates ubiquitin-proteasome systems. J Biochem. 2005;137(5):617–623.
- Park ES, Yoo YJ, Elangovan M. The opposite role of two UBA-UBX containing proteins, p47 and SAKS1 in the degradation of a single ERAD substrate, alpha-TCR. Mol Cell Biochem. 2017;425(1–2):37–45.
- LaLonde DP, Bretscher A. The UBX protein SAKS1 negatively regulates endoplasmic reticulum-associated degradation and p97-dependent degradation. J Biol Chem. 2011;286(6):4892–4901.
- Ganji R, Mukkavalli S, Somanji F, et al. The VCP-UBXN1 complex mediates triage of ubiquitylated cytosolic proteins bound to the BAG6 complex. Mol Cell Biol. 2018;38(13). DOI:https://doi.org/10.1128/MCB.00154-18.
- Denison SR, Wang F, Becker NA, et al. Alterations in the common fragile site gene Parkin in ovarian and other cancers. Oncogene. 2003;22(51):8370–8378.
- Csordas G, Weaver D, Hajnoczky G. Endoplasmic reticulum-mitochondrial contactology: structure and signaling functions. Trends Cell Biol. 2018;28(7):523–540.
- Wang N, Zhu P, Huang R, et al. PINK1: the guard of mitochondria. Life Sci. 2020;259:118247.
- Napoli E, Liu S, Marsilio I, et al. Lipid-based DNA/siRNA transfection agents disrupt neuronal bioenergetics and mitophagy. Biochem J. 2017;474(23):3887–3902.
- Pickles S, Vigie P, Youle RJ. Mitophagy and quality control mechanisms in mitochondrial maintenance. Curr Biol. 2018;28(4):R170–R185.
- Abrisch RG, Gumbin SC, et al. Fission and fusion machineries converge at ER contact sites to regulate mitochondrial morphology. J Cell Biol. 2020;219(4):e201911122.
- Kim NC, Tresse E, Kolaitis R-M, et al. VCP is essential for mitochondrial quality control by PINK1/Parkin and this function is impaired by VCP mutations. Neuron. 2013;78(1):65–80.
- Karbowski M, Neutzner A, Youle RJ. The mitochondrial E3 ubiquitin ligase MARCH5 is required for Drp1 dependent mitochondrial division. J Cell Biol. 2007;178(1):71–84.
- Chen Z, Siraj S, Liu L, et al. MARCH5-FUNDC1 axis fine-tunes hypoxia-induced mitophagy. Autophagy. 2017;13(7):1244–1245.
- Shlevkov E, Kramer T, Schapansky J, et al. Miro phosphorylation sites regulate Parkin recruitment and mitochondrial motility. Proc Natl Acad Sci U S A. 2016;113(41):E6097–E6106. E6097-E6106.
- Schindelin J, Arganda-Carreras I, Frise E, et al. Fiji: an open-source platform for biological-image analysis. Nat Methods. 2012;9(7):676–682.
- Berg S, Kutra D, Kroeger T, et al. ilastik: interactive machine learning for (bio)image analysis. Nat Methods. 2019;16(12):1226–1232.
- R Development Core Team. R: a language and environment for statistical computing. R Foundation for Statistical Computing, Vienna, Austria; 2020.
- Laemmli UK. Cleavage of structural proteins during the assembly of the head of bacteriophage T4. Nature. 1970;227(5259):680–685.
- Ran FA, Hsu PD, Wright J, et al. Genome engineering using the CRISPR-Cas9 system. Nat Protoc. 2013;8(11):2281–2308.
- Wickham H. ggplot2: elegant graphics for data analysis. Springer-Verlag, New York, USA; 2016.