
ABSTRACT
Preputial glands are large lipid and hormone secreting sebaceous organs of mice, and present a convenient model for the investigation of biological processes in sebocytes. Suppression of ATG7-dependent macroautophagy/autophagy in epithelial cells of murine skin causes enlargement of hair follicle-associated sebaceous glands and alters the lipid profile of sebum. We have now extended these studies to the preputial glands and find that autophagy significantly delays the onset of age-related ductal ectasia, influences lipid droplet morphology and contributes to the complete dissolution of the mature sebocytes during holocrine secretion. Single cell RNA sequencing showed that many genes involved in lipid metabolism and oxidative stress response were downregulated in immature and mature epithelial cells of ATG7-deficient glands. When analyzing the lipid composition of control and mutant glands, we found that levels of all phospholipid classes, except choline plasmalogen, were decreased in the mutant glands, with a concomitant accumulation of diacyl glycerides. Mass spectrometric imaging (MSI) demonstrated that phospholipid species, specifically the dominant phosphatidylcholine (PC 34:1), were decreased in immature and mature sebocytes. In addition, we found a strong reduction in the amounts of the pheromone, palmityl acetate. Thus, autophagy in the preputial gland is not only important for homeostasis of the gland as a whole and an orderly breakdown of cells during holocrine secretion, but also regulates phospholipid and fatty acid metabolism, as well as pheromone production.
Abbreviations
ATG7: autophagy related 7; BODIPY: boron dipyrromethene; DAG: diacyl glycerides; DBI: diazepam binding inhibitor; GFP: green fluorescent protein; KRT14: keratin 14; HPLC-MS: high performance liquid chromatography-mass spectrometry; LD: lipid droplet; MAP1LC3/LC3: microtubule-associated protein 1 light chain 3; MSI: mass spectrometric imaging; ORO: Oil Red O; PC: phosphatidylcholine; PE: phosphatidylethanolamine; PG: preputial gland; PLIN2: perilipin 2; PtdIns: phosphatidylinositol; PL: phospholipids; POPC: 1-palmitoyl-2-oleoyl-PC; PS: phosphatidylserine; qRT-PCR: quantitative reverse transcribed PCR; SG: sebaceous gland; scRNAseq: single-cell RNA sequencing; TAG: triacylglycerides; TLC: thin layer chromatography.
Introduction
Sebaceous glands (SG) are specialized skin appendages associated with hair follicles. They secrete sebum, which is thought to be important for thermal insulation, water loss regulation, anti-microbial defense and hormone production [Citation1,Citation2]. Rodents, including the mouse, have another type of sebaceous gland, the preputial gland (PG), which lacks association with hair follicles and is situated subcutaneously on both sides of the penis. The whole gland is enclosed by a connective tissue capsule, the immature sebocytes being organized into acini, but as they mature and produce lipids, they migrate toward lateral ducts, into which the cellular contents are discharged by holocrine secretion, i.e. the disintegration of the cells. The lateral ducts and the large central duct with which they are contiguous are all lined by squamous epithelia, which have a tendency to keratinize in aged animals. A proportion of PGs in older animals exhibit ductal ectasia [Citation3]. Similar to the SG in skin, the PG produce mainly lipids, which progressively fill the cells as they mature, and are finally released into the ducts when the cells disintegrate. As in adipose tissue, lipid droplets (LDs) in sebaceous glands become coated by a complex mixture of phospholipids (PL) and proteins, including members of the perilipin family [Citation4,Citation5], the detection of which by immunohistochemistry offers a convenient method for gaging the state of differentiation of the cells. PGs are also an important source of pheromones, which regulate sexual attractiveness and submissive-dominant behavior (see [Citation6] and references therein). Since murine PGs are large, provide an enriched source of sebocytes, and exhibit obvious similarities to other sebaceous type glands, they are used as models for SG biology [Citation7–10].
Macroautophagy/autophagy is a lysosomal based, intracellular recycling mechanism whereby damaged macromolecules, protein aggregates and organelles are broken down and reused. It is induced under conditions of nutrient deprivation, where the breakdown products are made available to the cell for re-synthesis, or under conditions of metabolic stress, where it functions as a quality control mechanism (see for instance [Citation11,Citation12]). In particular, autophagy plays an important role in lipid trafficking to and from LDs [Citation13], as well as in the secretion of lipids by Harderian glands, situated near the eyes in the mouse [Citation14,Citation15].
Skin SG of mice in which the Krt14 (keratin 14) promoter driven Cre-LoxP system deletes a floxed exon of the essential autophagy gene, Atg7 (atg7ΔKC, mutant mice), were able to release copious amounts of lipids. However, the proper degradation of sebocyte components during holocrine secretion was compromised, and the sebum lipid composition was altered compared to that of control mice (Atg7F/F) [Citation10,Citation16]. These findings suggested that autophagy contributes to both degradation of intracellular components during sebocyte lysis, and to their lipid metabolism, but not to holocrine secretion per se. Autophagy-incompetent PG, however, display a more severe derangement of cell dissolution. In contrast to skin atg7ΔKC sebocytes, whose appearance is unchanged until they are about to lyse, PG sebocyte nuclei are degraded prematurely, the anucleate cells are extensively retained, and they become extremely eosinophilic, with thickened cell borders [Citation7,Citation17,Citation18].
We thus deemed it necessary to examine the role of autophagy in the function of mouse PG in more detail. We show here that in addition to its contribution to the orderly breakdown of sebocytes, as was the case for skin SG, autophagy is important to the maintenance of both ductal and LD morphology within the whole PG. Importantly, suppression of autophagy in PGs markedly reduces the levels of the major phospholipids and of the pheromone, palmityl acetate (hexadecyl acetate).
Results
atg7ΔKC PG atrophy prematurely and show signs of compromised holocrine secretion and aberrant lipid droplet morphology
ATG7 dependent autophagy takes place constitutively in the PG, because both MAP1LC3/LC3 (microtubule-associated protein 1 light chain 3)-I [Citation19], and the autophagic cargo transporter, SQSTM1/p62 (sequestosome 1) [Citation20], accumulate in PGs in which Atg7 has been inactivated [Citation10]. We have now investigated the consequences of autophagy deficiency in PG in detail.
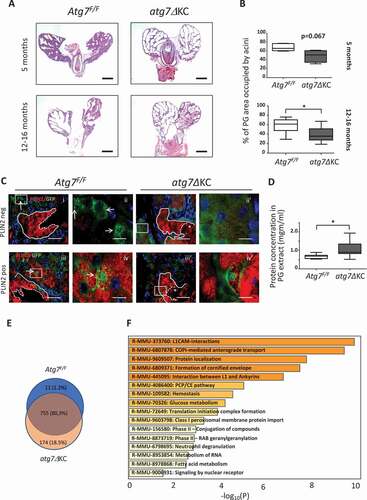
In atg7ΔKC animals, PG atrophied at an early age, displaying reduced acinar tissue and ductal ectasia (, upper panels), an organ architecture normally seen only in PGs of older mice [Citation3]. In fact, PG in young atg7ΔKC resembled atrophied PG of old Atg7F/F mice (, lower panels). In mice older than 12 months, only three of eight PG from Atg7F/F mice showed some degree of atrophy, whereas seven of nine of atg7ΔKC were distinctly atrophic (quantified in ), with two of the latter undergoing complete disintegration (not shown).
Figure 1. Atrophy occurs prematurely in autophagy-deficient PG, and holocrine secretion is impaired. (A) H&E stain of sections from formalin fixed, paraffin embedded PG were analyzed. Upper panels: In 5-months-old Atg7F/F mice, 0/9 PG were atrophied, compared to 5/7 in atg7ΔKC mice. Lower panels: In 14- to 15-months-old mice, 3/8 PG glands from Atg7F/F were atrophied to some extent, and the rest were normal. Shown is a partially atrophied gland. In atg7ΔKC mice, 5/9 PG displayed severe ectasia, in additional 2 the PG were completely disintegrated, and only in two of the nine mutant mice the PG remained intact. Bar: 2 mm. (B) Quantification of acini areas: N = 4–6 young mice, and 8 old mice for each genotype. Mann-Whitney test, median ± maximum/minimum. (C) Autophagosomes, visualized as GFP positive puncta, localize to the cytoplasm of PLIN2 negative cells in PG acini of GFP-LC3 transgenic Atg7F/F mice (C (i), (ii)). No puncta can be seen in the corresponding areas of GFP-LC3 transgenic atg7ΔKC mice (C (i)’, (ii)’). In contrast, GFP positive puncta localize to the nuclei and peri-nuclear regions of PLIN2 positive cells in PG of GFP-LC3 transgenic Atg7F/F mice (C (iii), (iv)). No puncta can be seen in the corresponding areas of GFP-LC3 transgenic atg7ΔKC mice (C (iii)’, (iv)’). The accumulation of GFP in the nuclei of atg7ΔKC PG was a rare event, while the green staining of sebocyte membranes was observed in both groups of mice. Arrows point to cells containing GFP positive puncta. Asterisk: PLIN2 positive remnants are seen in atg7ΔKC, but not in control Atg7F/F ducts. N = 4 mice, aged 5–6 months, per group. Bar: 50 and 10 μm for originals and insets, respectively. (D) Quantification of protein concentrations in PG secretions. N = 7–10 mice, per group, Unpaired t-test, median ± maximum/minimum. *p < 0.05. (E) Venn diagram for quantitative comparison of peptides found in 4 pooled PG secretions of Atg7F/F and atg7ΔKC mice. Nearly 20% of proteins (more than 2 peptides long) are found only in secretions from atg7ΔKC PG. (F) Pathway analysis for significantly enriched reactome pathways (R-MMU) associated with peptides exclusively found in PG secretions from mutant mice.
We next asked where in the PG autophagy was most active. To this end, PG from reporter mice bearing the green fluorescent protein (GFP)-LC3 transgene on the Atg7F/F background, with and without the KRT14-cre construct [Citation16,Citation21] were analyzed. Immunostaining of formalin-fixed PG sections for GFP to identify mature autophagosomes [Citation22] showed GFP-positive puncta, i.e. autophagosomes, in Atg7F/F but not atg7ΔKC sebocytes, (, Fig. S1). Double staining with an anti-PLIN2 antibody, to detect intracellular LDs [Citation4,Citation5], revealed that the distribution of autophagosomes varied from randomly cytoplasmic in PLIN2-negative immature sebocytes (, i, ii), to increasingly cell-membrane associated, in areas where PLIN2-positive lipid droplets were just discernible (not shown). In sebocytes with increased PLIN2 expression, autophagosomes were situated at the nucleus, as well (, iii, iv). In ductal cells, autophagosomes were only sporadically detectable (not shown). No autophagosomes were seen in any areas of atg7ΔKC PG ( i’-iv’, Fig. S1).
Staining for PLIN2 showed circular structures in differentiating sebocytes of both groups of animals (, Fig. S1). However, as the mature sebocytes approached the lysis zone, PLIN2 appeared as irregular, oblong formations in the atg7ΔKC mice (Fig. S1, boxed Area c), but not in control mice (not shown). Closer examination of LD morphology by H&E and Oil Red O (ORO) staining revealed that the LDs in the sebocytes near the basal acinar cells of control PG were tightly packed and of similar size, while those in the atg7ΔKC glands were irregular in shape and size, and were more sparsely distributed in the cells (Fig. S2A i, i’). As the nuclei became pyknotic in the lysis zone, the borders of the LDs in the Atg7F/F sebocytes became more indistinct. In contrast, those in the atg7ΔKC glands remained separate, but became grouped in untidy, oblong arrangements, a pattern visible in Oil Red O (ORO) stainings as well (Fig. S2A ii, ii’), and corresponding to the PLIN2 staining pattern noted previously.
In both groups of mice, the secreted lipids only became accessible to the boron-dipyrromethene (BODIPY) dye after PLIN2 was degraded (Fig. S2B). PLIN2 disappeared completely together with the disintegration of nuclei in control Atg7F/F PG (). In contrast, although the bulk of PLIN2 was also degraded together with the nuclei in atg7ΔKC glands, sizable amounts of PLIN2 positive fragments persisted in the ducts (, Fig. S1, boxed Area d, arrow), dispersed amongst the BODIPY stained, liberated lipids (Fig. S2B, arrowheads). Examination of H&E-stained PG sections regularly revealed large amounts of cell remnants and amorphous material present in the ducts of the atg7ΔKC glands, (Fig. S3) and the protein content of PG secretions was significantly higher (). Proteomics analysis revealed that secretions of the mutant PG contained 174 proteins that were not found in control animals (18% of all 940 detectable proteins). Amongst these, PLIN2 was detected exclusively in the secretions of mutant animals (Table S1), corroborating the immunostaining data (, Figs. S1 and S2B). Sixteen protein reactome terms were found related to the 174 proteins present only in the mutant secretions (and are arranged in in descending order according to their significance). Most prominent are terms involving structural proteins such as adhesion molecule interactions (R-MMU-373760, R-MMU-445095), the formation of the cornified envelope (R-MMU-6809371) and intracellular transport along membranes (R-MMU-6807878, R-MMU-9603798, R-MMU-8873719).
Single cell RNA sequencing reveals regulation of lipid metabolism related genes in autophagy-deficient PG cells
Age related changes observed in autophagy deficient PG are much more severe than those of autophagy deficient skin SG [Citation10]. Since the accumulation of SQSTM1/p62 (sequestosome 1) in autophagy deficient cells [Citation10,Citation20] can stabilize the antioxidant response regulator gene, Nfe2l2/Nrf2 (nuclear factor, erythroid derived 2, like 2; reviewed in [Citation23]), we hypothesized that an impaired stress response might be a reason for the premature atrophy of autophagy-deficient PG. We thus initially used qRT-PCR to examine the expression of Nfe2l2/Nrf2 target genes involved in the oxidative stress response that had been shown to be regulated in autophagy deficient keratinocytes and melanocytes [Citation24,Citation25]. However, Srxn1 (sulfiredoxin 1 homolog (S. cerevisiae)), Nqo1 (NAD(P)H dehydrogenase, quinone 1) and Gclc (glutamate-cysteine ligase, catalytic subunit) showed no significant difference in expression between the two mouse strains, and expression of glutamate-cysteine ligase modifier subunit (Gclm) was reduced by a factor of 3 in atg7ΔKC PG. By contrast, another Nfe2l2/Nrf2 target gene, Slpi (secretory leukocyte peptidase inhibitor) [Citation26] was upregulated (Table S2).
To obtain broader insight into which molecular mechanisms might be causing this variability in the expression of stress response genes, we performed single-cell RNA sequencing (scRNAseq) (). Uniform Manifold Approximation and Projection (UMAP) clustering revealed comparable cell populations (), identified by cell-type specific markers (), in both mouse strains. As expected, the main populations consisted of cells of epithelial origin, expressing either keratins or Scd1 (stearyl-Coenzyme A desaturase 1), an important enzyme in fatty acid metabolism, also expressed in skin SG [Citation27] (). The Scd1-expressing cells thus correspond to mature, lipid synthesizing sebocytes. A subset of the keratin expressing cells, also expresses the Krtdap (keratinocyte differentiation associated protein) [Citation28], and therefore this cluster likely represents the differentiated epithelial cells lining the ducts. This was confirmed by our findings that two other keratinocyte differentiation-associated genes, Flg (filaggrin) and Sprr2h (small proline-rich protein 2H), an Nfe2l2/Nrf2 target, are also expressed solely by ductal cells, and the respective proteins are detectable only in ducts of mutant PG by immunostaining. Both genes and their proteins were more highly expressed in the mutant epithelia (Fig. S4). Epithelial cells that express both Mki67/Ki67 (antigen identified by monoclonal antibody Ki 67) and Krt14 represent basal acinar cells and basal ductal cells, as confirmed by immunostaining (not shown). Finally, a population of Krt14 expressing cells also expressed Pparg (peroxisome proliferator activated receptor gamma), but not Krtdap or Scd1 (). This nuclear transcription factor has been implicated (among many other metabolic regulatory functions) in the regulation of differentiation of and lipid synthesis by cultured meibomian sebocytes [Citation29], in sebum production in cultured human sebocytes [Citation30], and reportedly localizes to immature sebocytes of human sebaceous glands [Citation31]. We thus infer that this Pparg expressing cluster corresponds to immature sebocytes. Non-epithelial cell populations comprised fibroblasts, endothelial cells, smooth muscle cells, monocytes and T cells, expressing Fbln1 (fibulin 1), Pecam1/Cd31 (platelet/endothelial cell adhesion molecule 1), Acta2 (actin alpha 2, smooth muscle, aorta), Cd14 and Cd3d respectively ().
Figure 2. scRNA sequencing of mouse PG reveals the presence of a similar complement of cell types in both Atg7F/F and atg7ΔKC mice. (A) Feature plots of cell populations in PG from Atg7F/F and atg7ΔKC mice. Cell types are conserved in the PG between the two genotypes. (B) Feature plots with cluster marker genes which define cluster identity.
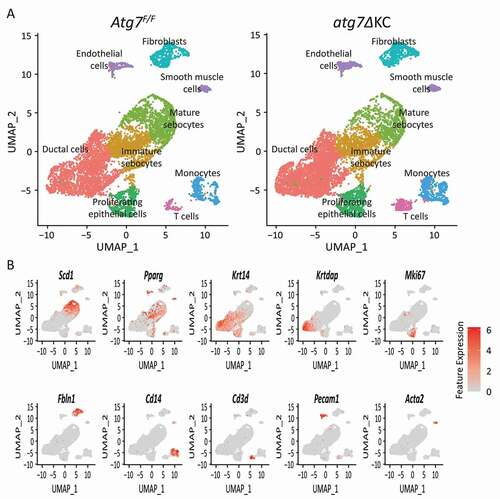
Figure 3. Lipid metabolic processes are downregulated in both immature and mature mutant PG sebocytes. (A) Bar plot of significantly (adjusted p-value <0.05) enriched Gene Ontology (GO) terms for biological processes affected by downregulated genes in immature sebocytes of atg7ΔKC mice. (B) GO Network of significantly affected biological processes in immature sebocytes of atg7ΔKC mice. GO-groups were colored for function according to group overview terms (bold letters). (C) Bar plot of significantly (adjusted p-value <0.05) enriched GO terms for biological processes affected by down-regulated genes in mature sebocytes of atg7ΔKC mice. (D) GO network of significant biological processes in mature sebocytes of atg7ΔKC mice. GO-groups were colored for function according to group overview terms (in bold letters). (E) Examples of genes involved in fatty acid metabolic processes differentially regulated in mature PG sebocytes. Violin plots were generated for the sebocyte cell population from 3 pooled mice/group. Horizontal lines represent mean expression, shape of each violin represents all results, and width of each violin represents frequency of respective expression level. (F) Differential expression of genes involved in lipid metabolism that are important for skin SG biology as assessed by scRNAseq and (G) by qRT-PCR. Box plots are representative of one group (N = 5–6 Atg7F/F and 7 atg7ΔKC mice, aged 12–14 months) of 3 mRNA isolates, each with a different group of mice. Similar results were obtained when values were related to the house keeping gene, Hprt (hypoxanthine guanine phosphoribosyl transferase). The box plots show the 25th and 75th percentile, and the median, with whiskers extending to the maximum and minimum values. n.s.: non-significant, *p < 0.05, **p < 0.01. Abbreviations: Acta2 (actin alpha 2, smooth muscle, aorta), Aldh3a2 (aldehyde dehydrogenase family 3, subfamily A2), Cd3d (CD3 antigen, delta polypeptide), Cd14 (CD14 antigen), Dbi (diazepam binding inhibitor), Elovl6 (ELOVL family member 6, elongation of long chain fatty acids (yeast)), Fads1 (fatty acid desaturase 1), Fbln1 (fibulin 1), Hacd2 (3-hydroxyacyl-CoA dehydratase 2), Krt14 (keratin 14), Krtdap (keratinocyte differentiation associated protein), Mki67 (antigen identified by monoclonal antibody Ki67), Olah (oleoyl-ACP hydrolase), Plin2 (perilipin 2), Pparg (peroxisome proliferator activated receptor gamma), Pecam1 (platelet/endothelial cell adhesion molecule 1), Selenoi (selenoprotein I), Slc27a4 (solute carrier family 27 (fatty acid transporter), member 4), Scd1 (stearyl-Coenzyme A desaturase 1).
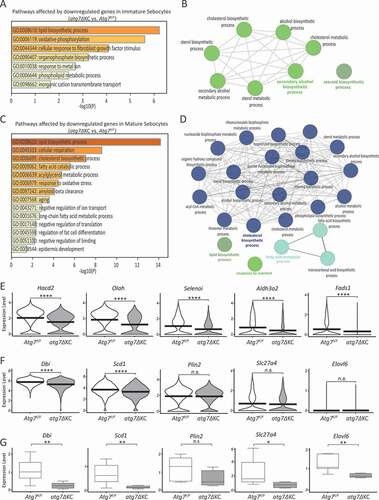
The transcriptional profile differed strongly between mutant and normal PG (Fig. S5A). Because of our observation that holocrine secretion in mutant glands was impaired, we focused our analysis on the sebocyte population. In both immature and mature PG sebocytes of mutant mice the numbers of downregulated genes greatly exceeded the up-regulated ones (Fig. S5A). GO term analysis of differentially regulated genes in the ductal and proliferating epithelial cell populations are listed in Fig. S5B and C. Due to the low number of up-regulated genes in the sebocyte populations, GO term calculation was only feasible for down-regulated genes (). Although, GO terms did include “response to oxidative stress”, only one gene belonging to these categories was found amongst the top 50 downregulated genes of immature sebocytes, and three in mature sebocytes (Table S3). By contrast, in both ductal cells and proliferating PG epithelial cells, perturbation of response to oxidative stress pathways was among the GO terms most significantly affected by both up and downregulated genes in mutant PG (Fig. S5B and C).
In immature, and even more so in mature PG sebocytes of mutant mice, pathways involved in lipid metabolism were strongly downregulated (). These findings were supported by GO-Network visualizations of affected pathways, where immature sebocytes contained the terms “steroid biosynthetic process” and “secondary alcohol biosynthetic process” (), while terms such as “cholesterol biosynthetic process”, “lipid biosynthetic process” and “fatty acid metabolic process” were characteristic for mature sebocytes (). In addition, as listed in Table S3, twenty out of the fifty most downregulated genes in mature sebocytes were directly or indirectly associated with lipid metabolism. Violin plots for selected genes are shown in . Specifically, Hacd2 (3-hydroxyacyl-CoA dehydratase 2), Olah (oleoyl-ACP hydrolase), and Selenoi (selenoprotein I), all highly expressed in normal PG sebocytes, were all amongst the top downregulated genes in autophagy-deficient mature sebocytes (). These enzymes are important for fatty acid elongation, for regulation of fatty acid availability, and for the synthesis of phosphatidylethanolamine (PE), respectively. Since PG sebocytes are considered a model for skin SG sebocytes, we specifically analyzed the lipid metabolism associated genes which are important for skin SG biology, namely Dbi/acyl CoA binding protein (diazepam binding inhibitor) [Citation32], Elovl6 (ELOVL family member 6, elongation of long chain fatty acids (yeast), Scd1 [Citation27] and Slc27a4/Fatp4 (solute carrier family 27 (fatty acid transporter), member 4) [Citation33]. Of these, only Dbi and Scd1 were significantly downregulated in the scRNAseq analysis (). By contrast, qRT-PCR analysis showed that expression of all four genes was significantly reduced in mutant PG (). Together, these data demonstrate that the inactivation of autophagy in PG sebocytes primarily and strongly affects the expression of genes associated with lipid metabolism.
The levels of phospholipids, as well as of the pheromone, palmityl acetate, are significantly reduced in atg7ΔKC PG
To determine what effect the reduced expression of lipid metabolism genes in atg7ΔKC PG could have on their lipid composition, we extracted lipids from whole glands and subjected them to thin layer chromatography (TLC). Use of hexane/di-ethyl ether, (95:5, v:v) as solvent system revealed a lipid profile very similar to that published [Citation34], and showed that the major neutral lipids did not differ proportionately between the two groups of mice (Fig. S6). However, a weak band with an identical Rf value to that of the palmityl acetate (PA) standard appeared distinctly weaker in the atg7ΔKC mice. We thus repeated the separation with a higher lipid load and a different solvent system (hexane/benzene (55:45, v:v) [Citation35]) for better visualization of the bands (). Spot density quantification of plates run with both methods confirmed that this species was significantly reduced in extracts from atg7ΔKC PG. Because of the identical Rf value to the commercial standard, and by comparison to published PG lipid profiles [Citation34,Citation36,Citation37] we suggest that this lipid species is in fact PA, and that the atg7ΔKC PG show a severe deficit in this pheromone.
Figure 4. The pheromone palmityl acetate is strongly reduced in lipids from PG of atg7ΔKC mice. (A) Thin layer chromatography separation of lipid extracts from whole preputial glands from mice aged 12–14 months shows a reduced intensity of the palmityl acetate bands in atg7ΔKC mice. Lipids from known amounts of PG were extracted and taken up as 10 mgm tissue equivalent/10 μl chloroform. The identities of the lipids without corresponding standards are inferred by analogy to the Rf observed using the running solvent which separates these fractions well [Citation10]. TAG: triacylglycerides; C: cholesterol; PL: phospholipids; Plas/GEDE: plasmalogens/glyceryl ether diesters; WE: wax esters; CE: cholesterol esters; PA: palmityl acetate; FAME: fatty acid methyl esters; Squ: squalene; chol. lin.: cholesterol linoleate. (B) The graph depicts the charring of the palmityl acetate band as a percentage of total charring. N = 4 mice/genotype. Mann Whitney test, median ± maximum/minimum *p < 0.05.
![Figure 4. The pheromone palmityl acetate is strongly reduced in lipids from PG of atg7ΔKC mice. (A) Thin layer chromatography separation of lipid extracts from whole preputial glands from mice aged 12–14 months shows a reduced intensity of the palmityl acetate bands in atg7ΔKC mice. Lipids from known amounts of PG were extracted and taken up as 10 mgm tissue equivalent/10 μl chloroform. The identities of the lipids without corresponding standards are inferred by analogy to the Rf observed using the running solvent which separates these fractions well [Citation10]. TAG: triacylglycerides; C: cholesterol; PL: phospholipids; Plas/GEDE: plasmalogens/glyceryl ether diesters; WE: wax esters; CE: cholesterol esters; PA: palmityl acetate; FAME: fatty acid methyl esters; Squ: squalene; chol. lin.: cholesterol linoleate. (B) The graph depicts the charring of the palmityl acetate band as a percentage of total charring. N = 4 mice/genotype. Mann Whitney test, median ± maximum/minimum *p < 0.05.](/cms/asset/03225a90-de92-4618-9900-9bc970638973/kaup_a_1966716_f0004_b.gif)
Next, we performed targeted high performance liquid chromatography-mass spectrometry (HPLC-MS) lipidomics of PG lipid extracts and determined the abundance of selected major and minor lipid classes, normalized to the total protein amount of the PG extracts. Whereas triacyl glycerides (TAG), sterol esters, ceramides and sphingomyelin were unchanged in the mutant mice, we observed a significant decrease in all of the phospholipid classes investigated, except choline plasmalogens, while the diacylglycerols (DAG) were elevated (, Table S4A). PA was not detectable in this analytic mode (most likely because of inappropriate ionization characteristics). Since few data exist on the PL composition of murine PG [Citation38], our subsequent HPLC-MS analysis focused mainly on these lipids.
Figure 5. The abundance of PG phospholipids is decreased and that of diacyl glycerides is increased in atg7ΔKC compared to control mice. (A) HPLC-MS analysis shows a decrease in both PL and lyso-PL and an increase in DAG in lipids derived from atg7ΔKC PG compared to controls. The less common lipids are depicted in a separate graph because of the large difference in concentration compared to the common lipids. The abundances (nmol/mgm) represent the sum of the nmol/mgm PG tissue of all the fatty acyl chain lengths for each lipid class as identified by the HPLC-MS analysis. N = 4 Atg7F/F and 6 atg7ΔKC mice, aged 9–15 months. Mann Whitney test, median ± maximum/minimum. *p < 0.05. TAG: triacylglycerides; CE: cholesterol esters; PL: phospholipids; DAG: diacyl glycerides; lyso-PL: lyso-phospholipids; pl.: plasmalogens; cer: ceramides; SM: sphingomyelin. (B): HPLC-MS analysis shows a decrease in all classes of major PLs, as well as the 3/4 classes of minor PLs, in atg7ΔKC mice compared to controls. The abundances (nmol/mgm) represent the sum of the nmol/mgm PG tissue of all the fatty acyl chain lengths for each phospholipid class as identified by the HPLC-MS analysis. N = 4 Atg7F/F and 6 atg7ΔKC mice. Mann Whitney test, median ± maximum/minimum. *p < 0.05, **p < 0.01. PC: phosphatidylcholine; PE: phosphatidylethanolamine; PtdIns: phosphatidylinositol; PS: phosphatidylserine; PC-O: choline plasmalogen; PE-O: ethanolamine plasmalogen; LPC: lyso-phosphatidylcholine; LPE: lyso-phosphatidylethanolamine.
Lack of autophagy in PG causes accumulation of specific polyunsaturated diacyl glyceride molecular species and a decrease of phospholipid molecular species
A detailed analysis of selected molecular species of lipids in these classes showed that the increase of DAG in the atg7ΔKC mice was mainly due to accumulation of the DAG (36:4) molecular species (). Phosphatidylcholines were the most abundant PL class in the PG extracts in both genotypes (, Table S4B), with species containing mono-unsaturated fatty acids dominating (). Molecular species with a total of four or more double bonds in their FA moieties were more common among the other phospholipid classes (PE, PtdIns, PS and PE-O, ). The vast majority of the molecular species of PL investigated was or had the tendency to be reduced in atg7ΔKC PG extracts at the molar level normalized to protein content. Whereas among the PC, especially the PC (32:1, 34:1 and 34:2) species were decreased in the atg7ΔKC glands, among the PE the species PE (34:1 and 38:4) were decreased, as were the untypical species with uneven numbers of carbon atoms in their FA chains (33:1 and 37:4). Among the PtdIns, the species PtdIns (36:3, 36:4 and 38:4) were significantly reduced, and among the PS the species, PS (34:1, 36:1) as well as the atypical species PS (41:6 and 41:7) were decreased in the knockouts. Among the alkyl-PEs, the species PE-O (36:5) was significantly decreased ().
Figure 6. The changes in abundance of the mutant DAG and PL as a whole are reflected in the changed abundance of fatty acyl species. (A) Absolute amounts (expressed as nmol/mg of PG tissue) of the most common DAG species (36:4) are higher in atg7ΔKC PG lipids. (B–F) Absolute amounts (expressed as nmol/mg of PG tissue) of the most common fatty acyl moieties in PL from atg7ΔKC PG are lower than the corresponding species from control mice. (B) PC. (C) PE. (D) PtdIns. (E) PS. (F) PE-O. Lipids from whole PG were extracted and subjected to HPLC-MS as described in Goyal et al. White columns: Atg7F/F, gray columns: atg7ΔKC. N = 4 Atg7F/F and 6 atg7ΔKC mice. Two-way ANOVA with Bonferroni posthoc test, mean ± standard deviation. *p < 0,05, **p < 0.01, ***p < 0.001 for differences between the respective fatty acyl species in Atg7F/F and atg7ΔKC PG extracts. DAG: diacyl glycerides; PC: phosphatidylcholine; PE: phosphatidylethanolamine; PE-O: ethanolamine plasmalogen; PS: phosphatidylserine; PtdIns: phosphatidylinositol.
In an attempt to physically pinpoint these lipid composition changes within the PG tissue, we applied a new mass spectrometry imaging method [Citation39], which had been successfully used to localize phospholipid species in skin [Citation40]. First, H&E stained cryosections from control and mutant PG () were used to identify areas of immature and mature sebocytes. Serial sections were then scanned using TissueFAXS, and areas containing immature (green line) or mature (red line) cells (, Fig. S7A and B) were identified. After scanning, the sections were subjected to matrix-assisted laser desorption/ionization Fourier transform ion cyclotron resonance mass spectrometry imaging (MALDI-FTICR-MSI) in the positive mode. Mass spectra with 10-µm spatial resolution were thus recorded, enabling the generation of images of the ion distributions in the analyzed tissue areas. The regions of interest (ROI), defined above as areas containing immature or mature sebocytes (, Fig. S7A and B), were compared pairwise in control versus mutant tissues with a Receiver Operating Characteristic (ROC) analysis. ROC analysis is a standard statistical procedure in similar MSI analyses to find m/z that discriminate between two ROI [Citation41–43].
Figure 7. Mass spectrometric imaging confirms reduced presence of PC 34:1 (POPC) in atg7ΔKC PG and localizes it to areas of immature and mature sebocyte. (A and B) H&E staining of cryosections from Atg7F/F (A) and atg7ΔKC (B) PG sections were used to identify sebocyte areas in the auto-fluorescence (488 nm) scans of the serial sections (C and D) that were used for MSI. Regions of interest (ROI) are marked green (immature sebocytes) or red (mature sebocytes). (E and F) MALDI-FTICR-MSI ion images showing the distribution of m/z 760.58448 (molecular formula C42H83NO8P; tentatively identified as PC 34:1) at 10 µm lateral resolution in the positive mode. This ion was identified by receiver operator characteristic (ROC) analysis as discriminating between the immature, as well as the mature sebocyte ROIs of Atg7F/F (E) and atg7ΔKC (F) PG, and is also the most abundant PG phosphatidylcholine species (compare Fig. 6B). Color scheme bars in (E and F) indicate the total ion count (TIC) normalized relative intensity distribution for each ion from 0% (black) to 100% (yellow). Bars: 200 μm. MALDI-FTICR-MSI: matrix-assisted laser desorption/ionization Fourier transform ion cyclotron resonance mass spectrometry imaging.
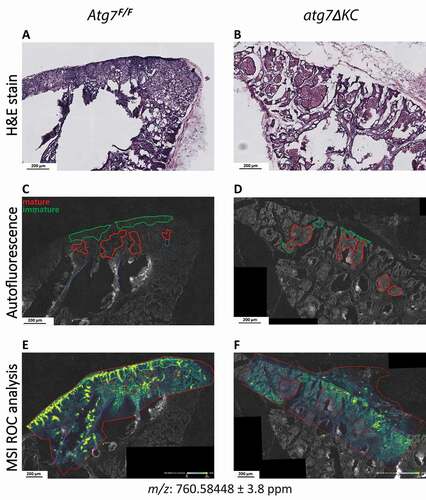
This method allowed us to obtain those m/z values that showed the highest area values under the curve for ROC (> 0.75 or < 0.25) and therefore discriminate best between the regions of immature and mature sebocytes of both genotypes (Table S5). Fig. S7 shows the two ions that were most upregulated (Fig. S7C, I and II) or most downregulated (Fig. S7D, III and IV) in mutant compared to control PG sections. Among the ions most abundant in wildtype areas of mature sebocytes (and strongly reduced in both mature and immature areas in the atg7ΔKC areas) was m/z 760.585 (), tentatively identified as PC 34:1 (1-palmitoyl-2-oleoyl-PC; POPC), the dominant PC species that we had also found significantly decreased in lipid extracts of the atg7ΔKC PG (). Furthermore, it was possible to identify ions that colocalized with m/z760.585, all of them tentatively identified as phosphatidylcholine species that had also been found downregulated in the atg7ΔKC PG (, Fig. S7E, Table S6).
Together these analyses demonstrate that inactivation of autophagy in murine PG does not affect TAG levels (including triolein, not shown) but results in a severe deficit in almost all PL, as well as in the pheromone, PA, and to an increase in DAG species, most prominently of DAG (36:4).
Discussion
Murine preputial glands share morphological, histological and functional features with sebaceous glands found at other body sites [Citation44], and because of their size and accessibility are often used as a model for SGs in general [Citation7–10]. During our studies on the role of autophagy in the function of skin SG [Citation10], we noticed a number of similarities as well as differences between autophagy incompetent skin SG and PG, prompting us to study the effects of the inactivation of autophagy in PG in more detail.
PG from older wild type mice undergo atrophy and ductal ectasia, a process which is clearly accelerated in the absence of autophagy, and occurs as early as at 5 months of age. The presence of large amounts of amorphous material in the mutant ducts, as well as their premature dilatation, was reminiscent of autophagy deficient skin SG, which also display widened sebaceous ducts filled with material [Citation10]. Since many structural proteins, such as certain keratins, ankyrin 1, proteins involved in the vesicle coating protein complex-mediated membrane trafficking, as well as PLIN2, were detected by proteomics analysis exclusively in mutant PG secretions (Table S1), we suggest that regular holocrine secretion is perturbed in the absence of autophagy. This notion is supported by the additional presence of whole groups of PLIN2 positive cell remnants in the mutant ducts (this study), as well as by the premature nuclear degradation described recently [Citation7]. In addition, our scRNA sequencing studies revealed that some of the most strongly downregulated genes in autophagy deficient PG are involved in organismal homeostasis and the response to oxidative and endoplasmic reticulum stress. We thus suggest that both the accumulation of material in the ducts, caused by impaired holocrine secretion, together with tissue damage caused by defective stress responses, combine to effect the observed premature morphological changes in mutant PG.
Autophagy has been shown to influence the composition of lipids in a number of different cell types and tissues [Citation10,Citation14,Citation24,Citation45–48]. For instance, ATG7 deficiency in adipocytes results in a decrease in triglyceride synthesis [Citation47], an increase in cholesterol levels in Harderian glands [Citation14] and a decrease of cholesterol and free fatty acids in skin sebum lipids [Citation10]. Similar to skin SG sebocytes, PG sebocytes produce a complex mixture of lipids and pheromones which are secreted into the preputial cavity. In contrast to the studies referred to above, lack of autophagy had no appreciable effect on the quantities of the main PG lipids, namely wax and cholesterol esters, and triacyl glycerides, (TAG) as shown by TLC, HPLC-MS and MALDI-FTICR-MSI. Instead, all classes of glyceroPL were decreased, with a concomitant increase in the PL precursor, DAG This change in PL profiles suggests that, in the absence of autophagy, the de novo synthesis of PL from DAG via the Kennedy pathway is blocked [Citation49]. Significantly, POPC, the major PC species, was decreased in areas of immature, as well as of mature sebocytes, demonstrating that PL synthesis was already impaired at an early timepoint of LD genesis in autophagy deficient PG.
A number of scenarios could explain the decreased abundance of almost all of the PL classes in ATG7-deficient PG. First, the formation of the autophagosome membranes under nutrient rich conditions requires de novo synthesis of PL [Citation50,Citation51]. Thus, in the absence of autophagosomes, such as after inactivation of atg7, feedback inhibition of de novo PL synthesis, could lead to an accumulation of DAG, from which all the glyceroPL are derived. Second, a lack of membrane turnover by autophagy, which would normally liberate free fatty acids and facilitate their integration into TAG [Citation52], could lead to abnormal accumulation of DAG. Changes in TAG levels were not however detected with our methods, probably because of the 100-fold excess of this lipid compared to DAG and PL. Third, our finding that the transcription of genes coding for enzymes involved in PE synthesis (Selenoi), or specific fatty acid metabolic processes, are downregulated, could contribute to the decreased abundance of PL. In particular, the decreased expression of DBI, which donates palmityl CoA to enzymes involved in PL synthesis [Citation53], could directly affect the levels of PL, as well as those of PA in lipids the mutant PG.
MSI analysis of PGs which, to the best of our knowledge, has not been reported previously, showed a massive decrease of POPC (m/z 760.585; PC 34:1), the major species of phosphatidylcholine, in both mature and immature sebocytes of mutant glands. This finding corroborates and extends the results from our HPLC-MS analyses of PG lipid extracts, because this novel method enables the identification and localization of m/z values in specific PG areas. Future studies, utilizing the negative imaging mode and possibly different matrices, will permit imaging of a more comprehensive set of lipids in these and other samples. The method is suited to uncover changes in nonpolar species, including triglycerides, and will help to extend insights into lipid metabolism in PG and other tissues.
The deficiency of POPC has a mechanistic implication because POPC is the main component of LD membranes [Citation54], and can determine LD size by preventing them from coalescing [Citation55]. In addition, since TAG levels are not affected by autophagy inactivation in the PG, a change in the PL/TAG ratio could affect the size and shape of the LDs [Citation56]. Finally, a tight cross-regulation of phagophore and LD membranes has recently been reported [Citation57]. This supports the hypothesis mentioned above that lack of autophagosome formation (and thus turnover of the main PL, PC), could lead to both feed-back inhibition of PC synthesis, and subsequent aberrant LD shape due to lack of PC, which is also the main PL in LD membranes.
Palmityl acetate is a hormone produced in male rodent preputial glands, and is mostly implicated in determining sexual attractiveness (see for instance [Citation6] and references therein), but its abundance has also been shown to be substantially enhanced in PG secretions of dominant mice after chronic encounters with other males [Citation58]. Breeding pairs in our colony were always set up with male cre-bearing atg7ΔKC mice and female Atg7F/F mice to avoid activation of the cre recombinase during zygotic genome activation in the oocyte genome. Thus the females had no choice, but produced pups at an average of 7 pups per litter, with intervals between births of about 31 days for any particular female, this being a normal frequency. On the other hand, aged atg7ΔKC mice, whose PG produce much reduced amounts of palmityl acetate, suffer from significant hair loss, either with or without signs of physical trauma (not shown) when housed with Atg7F/F littermates. Whether this indicates that they are subordinate to their control littermates, and lose their hair because of physical interactions or psychological stress [Citation59–61], would need to be determined by systematic behavioral studies and/or analysis of their stress hormone levels.
In summary, we have shown here that autophagy contributes significantly to the homeostasis of the mouse preputial gland, including the retention of its appropriate morphology during aging, to LD organization and to the proper degradation of the sebocyte components during holocrine secretion. Importantly, we show that lack of autophagy in murine PG results in a severe deficit in in the pheromone, PA, and in almost all PL, and to an increase in diacylglycerol species, most prominently of DAG (36:4), in both immature and mature PG sebocytes.
Materials and methods
Mice
The Atg7F/F mice, which served as controls, the atg7F/F Krt14-Cre (henceforth termed “atg7ΔKC”, or “mutant” test mice, in which Atg7 is inactivated, and the corresponding green fluorescent protein (GFP)-LC3 reporter strains have been described previously [Citation16,Citation17,Citation19,Citation62]. Animals were kept under standard housing conditions, with a maximum of 5 mice/cage, with access to food and water ad libitum, and 12-h light and dark cycles. They were killed by cervical dislocation according to the guidelines of the Ethics Review Committee for Animal Experimentation of the Medical University of Vienna, Austria. Genotyping from toe derived genomic DNA for the floxed Atg7, cre and GFP genes was performed exactly as before [Citation10,Citation16]. For PG morphology and histology studies, mice were sacrificed at the age of about 5 months since the control PG were still healthy at this age, but the atg7ΔKC glands were already atrophying. Older mice, aged 10–14 months, were used for the gene expression studies and lipid analyses, because only older atg7ΔKC mice developed an oily coat and significant hair loss [Citation10], suggesting an age-related perturbation of lipid metabolism. For lipid staining with oil red O (Sigma, O0625; ORO), mice were anaesthetized with diethyl ether (Acros Organics, 176820025) and perfused with 4% ice-cold paraformaldehyde (Sigma, 6148) [Citation63].
Histology and morphometrics
Antibodies for histology were as follows: mouse anti-KRT14/keratin 14, (Abcam, ab7800; 1:200), rabbit anti-GFP (Abcam, ab6556; 1:5000), rabbit anti-FLG/filaggrin (Biolegend/Covance, PRB-417P; 1:1000), monospecific, polyclonal rabbit anti-SPRR2, 1:500 (a kind gift from Dr. Daniel Hohl, Center hospitalier universitaire vaudois [CHUV], Lausanne) [Citation64] and guinea pig anti-PLIN2/perilipin 2 (antibodies-online, ABIN113458; 1:2000). The corresponding secondary fluorescently labeled antibodies were from Molecular Probes, (Alexa Fluor® 488 goat anti-mouse, A11001 and goat anti-rabbit, A11034; Alexa Fluor® 546 goat anti-rabbit, A11035, and Alexa Fluor® 594 goat anti-guinea pig, A11076), all used at 1:500 dilution. PG were excised, trimmed of fat, and immediately fixed in 7.5% buffered formalin (Morphisto, 18727.00500). They were washed in water and 50% ethanol (AnalaR NORMAPUR, 20821.310_1L) and stored in 70% ethanol before being passed through graded alcohols and embedded in paraffin (Histo-Comp, Sanova, ATS-200856) at 56°C. Alternatively, for ORO and BODIPY 493/503 (Molecular Probes, D3922) staining, the PG from the perfused mice were excised, post-fixed for 24 h in 4% paraformaldehyde at 4°C overnight, then incubated in 15% sucrose (Sigma, S9378) in PBS (Gibco, 14200-067) for 4 h at 4°C. Finally, the glands were placed in 30% sucrose in PBS overnight at 4°C, and embedded in Optimal Cutting Temperature (O.C.T.) medium, (Scigen, 23–730-625) [Citation65].
Paraffin-embedded tissue was cut at a thickness of 5 μm and either stained with H&E according to standard procedures, or, after antigen demasking (except for SPRR2 antibody, for which this is not necessary [Citation66]), were incubated overnight at 4°C with a mixture of the respective pairs of antibodies. The next day, the sections were washed and incubated with mixtures of the appropriate pairs of fluorescently labeled secondary antibodies, diluted 1:500, for 30 min at room temperature [Citation16]. ORO and BODIPY/PLIN2 staining of frozen 7 μm thick sections from the perfused mice was performed exactly as described [Citation67,Citation68], incubating with the antibody as described above, then with the BODIPY reagent. All sections treated with fluorescent reagents were counterstained with 2 μg/ml Hoechst-33258 (Molecular Probes, H1398) to visualize the nuclei and mounted in Permafluor (Thermo Scientific, TA-030-FM) for immunofluorescence [Citation16], or 75% PBS buffered glycerol (Sigma, G-5516) for the ORO and BODIPY stainings. Images of sections of whole H&E-stained PG were captured at 9x magnification with a Leica MZ16 A stereomicroscope, equipped with a Leica IC 3D digital camera and Leica CLS 150 X light source. For higher magnifications, an Olympus AX70 microscope with a Visitron Camera, Model 25.4 2 Mp slider was used. Where necessary, all fluorescence images were equally enhanced digitally using Metamorph version 6.1 software (Meta imaging Series, Molecular Devices). Calculation of areas was performed either with Meta Imaging Series 7.7 () or with ImageJ Plugin (3D Manager) software ().
Protein quantification and western blotting
To estimate the protein content of PG secretions, PG were carefully removed from the mice, placed directly into a microcentrifuge tube, and lacerated with an injection needle. Solid tissue was then removed, leaving a variable amount of fluid, ideally 20–50 μl, which was then subjected to protein analysis using the Micro BCA (bicinchoninic acid) protein kit (Thermo Scientific, 23235). For western blotting, trimmed fresh PG were cut into small pieces, and about 40 mg (half a gland) was placed into tubes containing ceramic beads (Prescellys®; Bertin Technologies, KTO3961-1-003.2) and 300 μl of SDS-PAGE loading buffer with protease inhibitor cocktail (Sigma, P8340), snap frozen and stored at −80°C until use. On thawing, samples were homogenized on a Precellys®24 homogenizer as described [Citation16], and protein was estimated as above. Western blotting was performed essentially as before, with 30 μg of protein loaded per lane [Citation16,Citation69], except that vertical gradient gels (4–20% criterion-tgx-precast gelTM; Bio-Rad, 5671093) were used. Equal loading was confirmed by staining with Ponceau solution after transfer to nitrocellulose membranes (Trans-Blot®TurboTM; Bio-Rad 1704159). Antibodies as above used for western blotting were anti-mouse FLG (1:1000), and SPRR2 (1:2000). After incubation with the HRP-labeled goat anti-rabbit immunoglobulin secondary antibody (Bio-Rad, 170-6515; 1:10,000), bands were visualized with the ClarityTM Western ECL substrate kit (Bio-Rad, 10026384 RevA), and multiple exposures of the developing membranes were taken with the Bio-Rad Imaging system (Bio-Rad Chemi DocTM XRS+). Quantification of the spot intensity was done on a photograph in the linear range of color development, using the Image LabTM software integrated in the imaging system.
RNA isolation and quantitative RT-PCR
Tissue destined for quantitative reverse transcribed PCR (qRT-PCR) analysis was placed into RNAlater (Invitrogen, AM7020) and stored at −80°C until homogenization in a Prescellys® homogenizer as above. RNA was extracted from about 40 mg tissue (half a gland) with TriFast (VWR International, 30-2010), and reverse transcribed into cDNA with the IscriptTM kit (Bio-Rad, 170-8891) according to the manufacturers’ instructions. The cDNA was subsequently amplified semi-quantitatively using Light Cycler® 480 technology (ThermoFisher Scientific, LC480) with the Light Cycler® 480 SYBR Green I Master Kit (ThermoFisher, 04887352001) [Citation70], using the same standardized PCR conditions for all the primers [Citation71]. Table S2 lists the primer sequences. The correct size and identity of all primer products was confirmed by gel electrophoresis and sequencing respectively. Expression of the target genes relative to the house-keeping gene, Β2m (beta-2 microglobulin), was calculated using the mathematical model of Pfaffl [Citation72].
Proteomics
Preputial gland secretions from four each Atg7F/F and atg7ΔKC mice were collected, the genotypes pooled, and forwarded to the Proteomics Core Facility at the Medical University of Vienna for analysis of protein composition in the two groups. Briefly, for mass spectrometric detection and MS/MS analysis, the Q-Exactive Orbitrap BioPharma (ThermoFisher, Bremen, Germany) was used. Peptides were introduced into the nano electrospray source, and the ionization was performed using a steel needle with 20 μm inner diameter and 10 μm tip. Needle voltage was set to 2 kV in positive mode and the top 10 ions were selected for MS/MS analysis. Resolution was set to 70.000 for full MS scans, ions with single charge were excluded from MS/MS analysis and fragmented ions were excluded for 60 seconds from further fragmentation. Generated raw files were converted into MGF by applying MS Convert (http://proteowizard.sourceforge.net/tools.shtml). Database search was performed by submitting the MGF files to MASCOT v. 2.6.0 (Matrix Science, London, UK) through ProteinScape (Bruker, Bremen, Germany) using the following parameters: Taxonomy: Mus musculus; Modifications: carbamidomethyl on C as fixed, deamidation on N and Q, carboxymethylation on M and phosphorylation S and T as variable; Peptide tolerance was set to 20 ppm and the MS/MS tolerance to 0.05 Da.
scRNA-sequencing
To obtain a single cell suspension, preputial glands from four each Atg7F/F and atg7ΔKC mice were collected and pooled according to genotype. A protocol similar to the one previously described by Vorstandlechner and colleagues [Citation73] was followed. In brief, samples were enzymatically digested for 2.5 h with the GentleMACS Human Whole Skin dissociation kit (Miltenyi Biotec, Bergisch-Gladbach, Germany) and then transferred to the GentleMACS OctoDissociator (Miltenyi) for further separation. The resulting cell suspensions were passed through a 100- and then a 40-µm cell strainer, and washed twice in PBS containing 0.04% bovine serum albumin (Merck Group, 9048-46-8). Both pooled samples were stained for viability and counted with the LUNA cell counter (Logos Biosystems, South Korea), where they displayed a viability in excess of 90%. The concentration was then adjusted to 1 × 10⁶ cells/ml prior to further processing.
Single-cell RNA-seq was performed using the 10X Genomics Chromium Single Cell Controller with the Chromium Single Cell 3′ V3 Kit (10X Genomics, 1000121) following the manufacturer’s instructions. After quality control, RNA sequencing was performed by the Biomedical Sequencing Core Facility of the Center for Molecular Medicine (Center for Molecular Medicine, Vienna, Austria) on an Illumina HiSeq 3000/4000 (Illumina, San Diego, CA, USA). Clusters were well matched in total cell number between the strains. A total of 10,431 cells were sequenced from the Atg7F/F pool compared to 10,322 cells from the atg7ΔKC pool. We analyzed proliferating epithelial cells (716 in atg7ΔKC vs 575 in Atg7F/F), immature sebocytes (1233 in atg7ΔKC vs 1600 in Atg7F/F), ductal cells (3628 in atg7ΔKC vs 2598 in Atg7F/F), mature sebocytes (891 in atg7ΔKC vs 1421 in Atg7F/F), fibroblasts (643 in atg7ΔKC vs 591 in Atg7F/F), endothelial cells and smooth muscle cells (429 in atg7ΔKC vs 385 in Atg7F/F), monocytes (637 in atg7ΔKC vs 404 in Atg7F/F) and T cells (331 in atg7ΔKC vs 119 in Atg7F/F). Raw sequencing data were then processed with the Cell Ranger v3.0.2 software (10X Genomics) for demultiplexing and alignment to a reference genome (mm10).
Secondary data analysis was performed in R Studio in R (The R Foundation, Vienna, Austria) using the R software package “Seurat” (Seurat v.4.0.0, Satija Lab, New York, NY, USA). To remove unwanted variations in the scRNAseq data, cells were first analyzed for their unique molecular identifiers (UMI) – and mitochondrial gene counts. Cells with UMI counts below 200 or above 2500 and more than 10% of mitochondrial genes were excluded from the data set. We then followed the recommended standard workflow for integration of single cell RNA sequencing data sets [Citation74] to combine our two samples. Data were scaled and principal component analysis (PCA) was run. Statistically significant principal components (PCs) were identified by visual inspection. Using the Louvain algorithm at a resolution of 0.15 we identified a total of 9 communities. Clusters were annotated based on the expression of well-established cell-type defining marker genes. We used UMAP-plots, feature plots and violin plots to visualize differences between the cell groups. For calculation of differentially expressed genes (DEGs) normalized count numbers were used. We applied the FindMarkers argument, adhering to the default settings, to calculate DEGs for clusters of interest between the groups. DEGs between conditions were then sorted based on avgLog2FC expression and forwarded to the Metascape [Citation75] online software package to identify significantly enriched pathways (-log10(p-value) > 2). Additionally, the same gene sets were forwarded to the Cytoscape plug-in ClueGO [Citation76,Citation77] to visualize significantly enriched biological processes between the two mouse groups.
Lipidomics
For an initial analysis of PG lipids by thin layer chromatography, glands trimmed of exogenous fat were frozen in liquid nitrogen, pulverized, and lipids were extracted with chloroform:methanol (2:1, v:v) (Fisher Scientific, M/4000/17; Merck, 1.02447.0500, respectively) [Citation78]. The dried lipid extracts from one half a PG were taken up in 140 μl chloroform, and 4 μl/lane were loaded onto 20 cm × 20 cm glass silica gel 60 TLC plates (Sigma, 1.05721.0001), and separated with a mixture of hexane:benzene (55:45, v:v, Sigma, 319953; Merck, 1.04367.1000 respectively) [Citation35], or hexane:diethyl ether (Acros Organics, 176820025; 95:5, v:v [Citation34]) until the front reached about 15 cm. The analytes were subsequently visualized, identified and quantified by spot density measurements using the ImageLab software [Citation10]. The first solvent mixture does not separate the major PG lipids well, but causes the pheromone, PA, to run as a discrete band, independently of the other lipids. This makes its accurate identification (with the help of the appropriate standard (Sigma, PHR1 166), and comparison with published PG lipid profiles [Citation34,Citation37]), and quantification possible. Calculation of the proportion of PA of the total lipids as judged by charring on the plates [Citation79] was performed on undiluted and 1:10 diluted samples. The second solvent system yielded diffuse bands for palmityl acetate, and was thus only used to verify the published lipid profiles. For HPLC-MS, PG lipids were extracted and analyzed exactly as described [Citation80].
MALDI imaging mass spectrometry
A scimaX® 7T Fourier-transform ion cyclotron resonance (FTICR) mass spectrometer (Bruker, Bremen, Germany) equipped with a MALDI source was used to image the samples. Single spectra mass spectrometry images were collected with a SmartBeam II laser with the following parameters: operating frequency 1000 Hz, number of laser shots per pixel: 50, laser focus: minimum, and 10 µm lateral resolution. Samples were analyzed in positive ion, broadband mode using a 4 megaword time domain spanning a 100–1000 m/z range. 1,5-Diaminonaphthalene (98% from Sigma-Aldrich) was used as matrix and applied via sublimation according to [Citation39].
MSI data analysis
Data analysis was performed using SCiLS Lab (version 2021b, SCiLs, Bremen, Germany). RAW MSI data was imported and normalized to the matrix signal (1,5 DAN m/z 317.176073). Microscopic images were used to manually outline ROIs (i.e. immature and mature cells). These ROIs were used for class selection in the ROC algorithm.
Statistics
The quantitative differences between the mouse groups were tested for significance by application of the unpaired Student’s ttest or by the Mann-Whitney test, depending on the number of mice per group (more or less than 6 respectively). For testing for significant differences between the Atg7F/F and atg7ΔKC fatty acyl chain lengths, the two-way ANOVA followed by Bonferroni’s post-hoc test was used. The box plots show the 25th and 75th percentile, and the median, with whiskers extending to the maximum and minimum values. The column plots depict the mean, with its standard error. All above tests are available in the Graph Pad Prism software program, Version 5.03.
Supplemental Material
Download Zip (31.8 MB)Acknowledgments
The authors gratefully acknowledge the following facilities: Proteomics and Metabolomics, and Biomedical Sequencing Facilities, Research Center for Molecular Medicine (CeMM), Vienna, Austria, for the proteomics, lipidomics and scRNA sequencing; the Core Facilities of the Medical University of Vienna, for the Laser Microscopy, and the Center for Biomedical Research, Medical University of Vienna, Vienna, Austria for the care of the mice. MM was funded by the Aposcience AG, Vienna, Austria.
Disclosure statement
No potential conflict of interest was reported by the author(s).
Supplementary material
Supplemental data for this article can be accessed here
Related Research Data
References
- Niemann C, Horsley V. Development and homeostasis of the sebaceous gland. Semin Cell Dev Biol. 2012;23(8):928–936.
- Smith KR, Thiboutot DM. Thematic review series: skin lipids. Sebaceous gland lipids: friend or foe? J Lipid Res. 2008;49(2):271–281.
- Knoblaugh SE, True L, Tretiakova M, et al. Male reproductive system. In: Treuting PM, Dintzis SM, Montine KS, editors. Comparative Anatomy and Histology. Second Edition. San Diego (CA): Academic Press. 2018. pp. 335–363.
- Dahlhoff M, Camera E, Picardo M, et al. PLIN2, the major perilipin regulated during sebocyte differentiation, controls sebaceous lipid accumulation in vitro and sebaceous gland size in vivo. Biochim Biophys Acta. 2013;1830(10):4642–4649.
- Sztalryd C, Brasaemle DL. The perilipin family of lipid droplet proteins: gatekeepers of intracellular lipolysis. Biochim Biophys Acta Mol Cell Biol Lipids. 2017;1862(10):1221–1232.
- Zhang J-X, Liu Y, Zhang J-H, et al. Dual role of preputial gland secretion and its major components in sex recognition of mice. Physiol Behav. 2008;95(3):388–394.
- Fischer H, Fumicz J, Rossiter H, et al. Holocrine secretion of sebum is a unique DNase2-dependent mode of programmed cell death. J Invest Dermatol. 2017;137(3):587–594.
- Laurent SJ, Mednieks MI, Rosenfield RL. Growth of sebaceous cells in monolayer culture. Vitro Cell Dev Biol. 1992;28(2):83–89.
- Rosenfield RL, Kentsis A, Deplewski D, et al. Rat preputial sebocyte differentiation involves peroxisome proliferator-activated receptors. J Invest Dermatol. 1999;112(2):226–232.
- Rossiter H, Stubiger G, Groger M, et al. Inactivation of autophagy leads to changes in sebaceous gland morphology and function. Exp Dermatol. 2018;27(10):1142–1151.
- Parzych KR, Klionsky DJ. An overview of autophagy: morphology, mechanism, and regulation. Antioxid Redox Signal. 2014;20(3):460–473.
- Yu L, Chen Y, Tooze SA. Autophagy pathway: cellular and molecular mechanisms. Autophagy. 2018;14(2):207–215.
- Zhang X, Evans TD, Jeong S-J, et al. Classical and alternative roles for autophagy in lipid metabolism. Curr Opin Lipidol. 2018;29(3):203–211.
- Koenig U, Fobker M, Lengauer B, et al. Autophagy facilitates secretion and protects against degeneration of the Harderian gland. Autophagy. 2015;11(2):298–313.
- Vega-Naredo I, Caballero B, Sierra V, et al. Sexual dimorphism of autophagy in Syrian hamster Harderian gland culminates in a holocrine secretion in female glands. Autophagy. 2009;5(7):1004–1017.
- Rossiter H, Konig U, Barresi C, et al. Epidermal keratinocytes form a functional skin barrier in the absence of Atg7 dependent autophagy. J Dermatol Sci. 2013;71(1):67–75.
- Sukseree S, Mildner M, Rossiter H, et al. Autophagy in the thymic epithelium is dispensable for the development of self-tolerance in a novel mouse model. PLoS One. 2012;7(6):e38933.
- Sukseree S, Rossiter H, Mildner M, et al. Targeted deletion of Atg5 reveals differential roles of autophagy in keratin K5-expressing epithelia. Biochem Biophys Res Commun. 2013;430(2):689–694.
- Komatsu M, Waguri S, Ueno T, et al. Impairment of starvation-induced and constitutive autophagy in Atg7-deficient mice. J Cell Biol. 2005;169(3):425–434.
- Komatsu M, Waguri S, Koike M, et al. Homeostatic levels of p62 control cytoplasmic inclusion body formation in autophagy-deficient mice. Cell. 2007;131(6):1149–1163.
- Mizushima N, Yamamoto A, Matsui M, et al. In vivo analysis of autophagy in response to nutrient starvation using transgenic mice expressing a fluorescent autophagosome marker. Mol Biol Cell. 2004;15(3):1101–1111.
- Kabeya Y, Mizushima N, Ueno T, et al. LC3, a mammalian homologue of yeast Apg8p, is localized in autophagosome membranes after processing. EMBO J. 2000;19(21):5720–5728.
- Jiang T, Harder B, Rojo de la Vega M, et al. p62 links autophagy and Nrf2 signaling. Free Radic Biol Med. 2015;88:199–204.
- Zhao Y, Zhang C-F, Rossiter H, et al. Autophagy is induced by UVA and promotes removal of oxidized phospholipids and protein aggregates in epidermal keratinocytes. J Invest Dermatol. 2013;133(6):1629–1637.
- Zhang C-F, Gruber F, Ni C, et al. Suppression of autophagy dysregulates the antioxidant response and causes premature senescence of melanocytes. J Invest Dermatol. 2015;135(5):1348–1357.
- Iizuka T, Ishii Y, Itoh K, et al. Nrf2-deficient mice are highly susceptible to cigarette smoke-induced emphysema. Genes Cells. 2005;10(12):1113–1125.
- Zheng Y, Eilertsen KJ, Ge L, et al. Scd1 is expressed in sebaceous glands and is disrupted in the asebia mouse. Nat Genet. 1999;23(3):268–270.
- Oomizu S, Sahuc F, Asahina K, et al. Kdap, a novel gene associated with the stratification of the epithelium. Gene. 2000;256(1–2):19–27.
- Kim SW, Xie Y, Nguyen PQ, et al. PPARγ regulates meibocyte differentiation and lipid synthesis of cultured human meibomian gland epithelial cells (hMGEC). Ocul Surf. 2018;16(4):463–469.
- Trivedi NR, Cong Z, Nelson AM, et al. Peroxisome proliferator-activated receptors increase human sebum production. J Invest Dermatol. 2006;126(9):2002–2009.
- Furue M, Takemura M, Nishio K, et al. Immunohistological Localization of Peroxisome Proliferator-Activated Receptor alpha and gamma in Human Sebaceous Glands. Fukuoka Igaku Zasshi. 2016;107:199–203.
- Bloksgaard M, Bek S, Marcher A-B, et al. The acyl-CoA binding protein is required for normal epidermal barrier function in mice. J Lipid Res. 2012;53(10):2162–2174.
- Zheng M, Lee S, Tsuzuki S, et al. Immunohistochemical localization of fatty acid transporters and MCT1 in the sebaceous glands of mouse skin . Biomed Res. 2016;37(4):265–270.
- Sansone G, Hamilton JG. Glyceryl ether, wax ester and triglyceride composition of the mouse preputial gland. Lipids. 1969;4(6):435–440.
- Chen W, Kelly MA, Opitz-Araya X, et al. Exocrine gland dysfunction in MC5-R-deficient mice: evidence for coordinated regulation of exocrine gland function by melanocortin peptides. Cell. 1997;91(6):789–798.
- Sansone-Bazzano G, Bazzano G, Reisner RM, et al. The hormonal induction of alkyl glycerol, wax and alkyl acetate synthesis in the preputial gland of the mouse. Biochim Biophys Acta. 1972;260(1):35–40.
- Spener F, Mangold HK, Sansone G, et al. Long-chain alkyl acetates in the preputial gland of the mouse. Biochim Biophys Acta. 1969;192(3):516–521.
- Snyder F, Blank ML. Relationships of chain lengths and double bond locations in O-alkyl, O-alk-1-enyl, acyl, and fatty alcohol moieties in preputial glands of mice. Arch Biochem Biophys. 1969;130:101–110.
- Holzlechner M, Bonta M, Lohninger H, et al. Multisensor Imaging—from sample preparation to integrated multimodal Interpretation of LA-ICPMS and MALDI MS imaging data. Anal Chem. 2018;90(15):8831–8837.
- Narzt M-S, Pils V, Kremslehner C, et al. Epilipidomics of senescent dermal fibroblasts identify lysophosphatidylcholines as pleiotropic senescence-associated secretory phenotype (SASP) factors. J Invest Dermatol. 2021;141(4):993–1006 e1015.
- Cazares LH, Troyer D, Mendrinos S, et al. Imaging mass spectrometry of a specific fragment of mitogen-activated protein kinase/extracellular signal-regulated kinase kinase kinase 2 discriminates cancer from uninvolved prostate tissue. Clin Cancer Res. 2009;15(17):5541–5551.
- Klein O, Strohschein K, Nebrich G, et al. MALDI imaging mass spectrometry: discrimination of pathophysiological regions in traumatized skeletal muscle by characteristic peptide signatures. Proteomics. 2014;14(20):2249–2260.
- Rauser S, Marquardt C, Balluff B, et al. Classification of HER2 receptor status in breast cancer tissues by MALDI imaging mass spectrometry. J Proteome Res. 2010;9(4):1854–1863.
- Thody AJ, Shuster S. Control and function of sebaceous glands. Physiol Rev. 1989;69(2):383–416.
- Ni C, Narzt M-S, Nagelreiter I-M, et al. Autophagy deficient melanocytes display a senescence associated secretory phenotype that includes oxidized lipid mediators. Int J Biochem Cell Biol. 2016;81:375–382.
- Singh R, Kaushik S, Wang Y, et al. Autophagy regulates lipid metabolism. Nature. 2009;458(7242):1131–1135.
- Singh R, Xiang Y, Wang Y, et al. Autophagy regulates adipose mass and differentiation in mice. J Clin Invest. 2009;119:3329–3339.
- Song X, Narzt MS, Nagelreiter IM, et al. Autophagy deficient keratinocytes display increased DNA damage, senescence and aberrant lipid composition after oxidative stress in vitro and in vivo. Redox Biol. 2017;11:219–230.
- Gibellini F, Smith TK. The Kennedy pathway-De novo synthesis of phosphatidylethanolamine and phosphatidylcholine. IUBMB Life. 2010;62(6):414–428.
- Andrejeva G, Gowan S, Lin G, et al. De novo phosphatidylcholine synthesis is required for autophagosome membrane formation and maintenance during autophagy. Autophagy. 2020;16(6):1044–1060.
- Schutter M, Giavalisco P, Brodesser S, et al. Local fatty acid channeling into phospholipid synthesis drives phagophore expansion during autophagy. Cell. 2020;180(1):135–149 e114.
- Nguyen TB, Louie SM, Daniele JR, et al. DGAT1-dependent lipid droplet biogenesis protects mitochondrial function during starvation-induced autophagy. Dev Cell. 2017;42(1):9–21 e25.
- Augoff K, Kolondra A, Chorzalska A, et al. Expression, purification and functional characterization of recombinant human acyl-CoA-binding protein (ACBP) from erythroid cells. Acta Biochim Pol. 2010;57(4):533–540.
- Tauchi-Sato K, Ozeki S, Houjou T, et al. The surface of lipid droplets is a phospholipid monolayer with a unique Fatty Acid composition. J Biol Chem. 2002;277(46):44507–44512.
- Krahmer N, Guo Y, Wilfling F, et al. Phosphatidylcholine synthesis for lipid droplet expansion is mediated by localized activation of CTP: phosphocholinecytidylyltransferase. Cell Metab. 2011;14(4):504–515.
- Penno A, Hackenbroich G, Thiele C. Phospholipids and lipid droplets. Biochim Biophys Acta. 2013;1831(3):589–594.
- Ogasawara Y, Cheng J, Tatematsu T, et al. Long-term autophagy is sustained by activation of CCTβ3 on lipid droplets. Nat Commun. 2020;11(1):4480.
- Fang Q, Zhang YH, Shi YL, et al. Individuality and transgenerational inheritance of social dominance and sex pheromones in isogenic male mice. J Exp Zool B Mol Dev Evol. 2016;326(4):225–236.
- Arck PC, Handjiski B, Peters EM, et al. Stress inhibits hair growth in mice by induction of premature catagen development and deleterious perifollicular inflammatory events via neuropeptide substance P-dependent pathways. Am J Pathol. 2003;162(3):803–814.
- Liu N, Wang L-H, Guo -L-L, et al. Chronic restraint stress inhibits hair growth via substance P mediated by reactive oxygen species in mice. PLoS One. 2013;8(4):e61574.
- Peters EM, Arck PC, Paus R. Hair growth inhibition by psychoemotional stress: a mouse model for neural mechanisms in hair growth control. Exp Dermatol. 2006;15(1):1–13.
- Mizushima N, Kuma A. Autophagosomes in GFP-LC3 transgenic mice. Methods Mol Biol. 2008;445:119–124.
- Gage GJ, Kipke DR, Shain W. 2012. Whole animal perfusion fixation for rodents. J Vis Exp. 65. DOI: https://doi.org/10.3791/3564.
- Hohl D, De Viragh PA, Amiguet-Barras F, et al. The small proline-rich proteins constitute a multigene family of differentially regulated cornified cell envelope precursor proteins. J Invest Dermatol. 1995;104(6):902–909.
- Koenig U, Robenek H, Barresi C, et al. Cell death induced autophagy contributes to terminal differentiation of skin and skin appendages. Autophagy. 2019;1–14.2020;16(5):932–945.
- De Heller-Milev M, Huber M, Panizzon R, et al. Expression of small proline rich proteins in neoplastic and inflammatory skin diseases. Br J Dermatol. 2000;143(4):733–740.
- Goodpaster BH, Theriault R, Watkins SC, et al. Intramuscular lipid content is increased in obesity and decreased by weight loss. Metabolism. 2000;49(4):467–472.
- Listenberger LL, Brown DA. Fluorescent detection of lipid droplets and associated proteins. Curr Protoc Cell Biol. 2007;35(1). Chapter 24:Unit 24 22. DOI:https://doi.org/10.1002/0471143030.cb2402s35.
- Rendl M, Ban J, Mrass P, et al. Caspase-14 expression by epidermal keratinocytes is regulated by retinoids in a differentiation-associated manner. J Invest Dermatol. 2002;119(5):1150–1155.
- Mlitz V, Gendronneau G, Berlin I, et al. The expression of the endogenous mTORC1 inhibitor sestrin 2 is induced by UVB and balanced with the expression level of sestrin 1. PLoS One. 2016;11(11):e0166832.
- Mildner M, Mlitz V, Gruber F, et al. Hepatocyte growth factor establishes autocrine and paracrine feedback loops for the protection of skin cells after UV irradiation. J Invest Dermatol. 2007;127(11):2637–2644.
- Pfaffl MW. A new mathematical model for relative quantification in real-time RT-PCR. Nucleic Acids Res. 2001;29(9):e45.
- Vorstandlechner V, Laggner M, Kalinina P, et al. Deciphering the functional heterogeneity of skin fibroblasts using single-cell RNA sequencing. FASEB J. 2020;34(3):3677–3692.
- Stuart T, Butler A, Hoffman P, et al. Comprehensive integration of single-cell data. Cell. 2019;177(7):1888–1902 e1821.
- Zhou Y, Zhou B, Pache L, et al. Metascape provides a biologist-oriented resource for the analysis of systems-level datasets. Nat Commun. 2019;10(1):1523.
- Bindea G, Mlecnik B, Hackl H, et al. ClueGO: a Cytoscape plug-in to decipher functionally grouped gene ontology and pathway annotation networks. Bioinformatics. 2009;25(8):1091–1093.
- Merico D, Isserlin R, Bader GD. Visualizing gene-set enrichment results using the Cytoscape plug-in enrichment map. Methods Mol Biol. 2011;781:257–277.
- Folch J, Lees M, Sloane Stanley GH. A simple method for the isolation and purification of total lipides from animal tissues. J Biol Chem. 1957;226(1):497–509.
- Marsh JB, Weinstein DB. Simple charring method for determination of lipids. J Lipid Res. 1966;7(4):574–576.
- Goyal G, Zheng J, Adam E, et al. Sphingolipid-dependent Dscam sorting regulates axon segregation. Nat Commun. 2019;10(1):813.