
ABSTRACT
Glycophagy is the autophagic degradation of glycogen via the lysosomal enzyme GAA/alpha-acid glucosidase. Glycophagy is considered a housekeeping process to degrade poorly branched glycogen particles, but the regulation and role of glycophagy in skeletal muscle metabolism remains enigmatic. Herein, prior muscle contraction promoted glycogen supercompensation 24 and 48 h post contraction, an effect associated with reduced glycophagy. Moreover, NOTCH or cAMP signaling promoted glycophagy, whereas acute glycophagy deficiency rewired cell metabolism by reducing glycolysis and enhancing AMPK and PPAR signaling and fatty acid and glutamine metabolism. These metabolic adaptations were associated with reduced inflammation and triglyceride content but enhanced phosphoinositide 3-kinase (PI3K)-AKT/protein kinase B signaling and insulin action, the latter of which was abolished by exogenous oxidative stress. Collectively, these data suggest glycophagy is dynamically regulated, while the function of glycophagy can be extended beyond a housekeeping process to having an additional role in regulating energy metabolism and insulin action.
Abbreviations: AMPK, AMP-activated protein kinase; ASM, acid soluble metabolites; cAMP, cyclic adenosine monophosphate; EPS, electrical pulse stimulation; FCCP, carbonyl cyanide-p-trifluoromethoxyphenylhydrazone; GAA, glucosidase, alpha, acid; mTOR, mechanistic target of rapamycin kinase; NAD, nicotinamide adenine dinucleotide; PARP, poly (ADP-ribose) polymerase family; PI3K, phosphoinositide 3-kinase; PPAR, peroxisome proliferator activated receptor ; PYGM, muscle glycogen phosphorylase; STBD1, starch binding domain 1; TFEB, transcription factor EB.
Introduction
Glycogen is a polysaccharide that represents the primary storage form of glucose within cells [Citation1]. The breakdown of glycogen, or glycogenolysis, occurs through two primary routes – in the cytosol via the dual enzymatic action of glycogen phosphorylase and debranching enzyme, or within lysosomes via the enzymatic action of GAA (glucosidase, alpha, acid) in a process known as glycophagy [Citation1,Citation2]. Factors that modify glycogen phosphorylase levels and activity in skeletal muscle have been well described and include increased cyclic adenosine monophosphate (cAMP) signaling, increased adenosine monophosphate and inositol monophosphate levels, or increased calcium levels as a result of hypoxia, contraction, or low glucose availability [Citation3–5]. Factors that regulate glycophagy include TFEB (transcription factor EB), NOTCH1, or cAMP signaling [Citation6–9], but this regulation was observed in liver, heart, fibroblasts, or cancer cells. Factors that regulate glycophagy in skeletal muscle remain enigmatic.
In humans, prolonged loss of glycophagy results in glycogen storage disease type II (Pompe disease), in which the clinical manifestation is described as overaccumulation of glycogen within all tissues in the body, particularly in skeletal muscles [Citation10]. A current dogma in the field is that glycophagy exists as a housekeeping process responsible for degrading poorly branched glycogen particles that are weak substrates for glycogen phosphorylase and debranching enzyme [Citation2]. Recent evidence suggests that glucose liberated via glycogen phosphorylase is not only used for glycolysis but also directed toward the pentose phosphate pathway to generate nicotinamide adenine dinucleotide phosphate, which is used to reduce glutathione, a cellular antioxidant [Citation11]. Although chronic, prolonged loss of glycophagy modulates skeletal muscle fatty acid metabolism [Citation12–14], glucose metabolism [Citation15,Citation16], and mTOR (mechanistic target of rapamycin kinase) signaling [Citation17,Citation18], many of these effects are thought to be secondary and a pathological consequence of excessive accumulation of lysosomal glycogen and impaired autophagy due to long-term glycophagy deficiency. A comprehensive analysis detailing the regulation of glycophagy or impact of short-term loss of glycophagy, prior to pathological complications, on glucose or fatty acid metabolism has not been performed. Given this gap in knowledge about the regulation and role of glycophagy in skeletal muscle energy metabolism, the primary objective of this study was to determine factors that modulate glycophagy and its role in energy metabolism. We report that glycophagy is dynamically regulated and has wide-spread effects on cellular energetics, nutrient utilization, inflammation, and insulin signaling.
Results/discussion
Muscle contraction modulates glycophagy in a time dependent manner
GAA is localized to lysosomes where it degrades lysosomal glycogen [Citation19,Citation20], but factors that regulate GAA and glycophagy in skeletal muscle are enigmatic. Skeletal muscle contraction stimulates glycogen degradation and glycolysis [Citation21], but in the recovery period after contraction glycogen accumulates above baseline concentrations in a phenomenon known as glycogen supercompensation [Citation22]. The link between these processes and glycophagy in skeletal muscle is unclear as previous reports have yielded inconsistent results, likely due to the various species and models utilized [Citation22–24]. To provide more clarity, we first examined the impact of exercise training on glycophagy in human and mouse skeletal muscle. Quadricep muscle biopsy samples obtained from untrained and exercise trained humans or mice ~48 h after the most recent exercise session revealed exercise training increased skeletal muscle glycogen content compared to their untrained counterparts (i.e., glycogen supercompensation), and this was associated with lower GAA mRNA abundance in humans (Figure S1A) and lower activity in both humans and mice (). These data suggest that reduced skeletal muscle glycophagy could possibly contribute to glycogen supercompensation. However, given that skeletal muscle from human and mouse samples contains contaminating blood and immune cells, we turned to C2C12 myotubes to study the impact of muscle contraction on glycophagy. A time course experiment revealed that immediately after 1 h of high intensity electrical pulse stimulation (EPS), myotube glycogen content was reduced, an effect that was associated with an increase in GAA activity (). At 24 and 48 h after EPS, glycogen supercompensation emerged as myotube glycogen content was higher in EPS treated myotubes compared to control myotubes, and this was associated with reduced GAA activity (), which supports the human and mouse data and suggests that reduced glycophagy could contribute to glycogen supercompensation. Although GAA activity is informative, it does not provide information on dynamic changes in glycogen content within lysosomes. Thus, the lysosome immunoprecipitation (LysoIP) method described previously [Citation25,Citation26] was utilized, whereby a novel C2C12 cell line was generated that expresses Tmem192 (transmembrane protein 192) with three tandem HA epitopes, which allows for rapid and pure isolation of intact lysosomes from myotubes. Using this approach combined with downstream glycogen analyzes revealed that EPS reduced lysosomal and cytosolic glycogen content immediately after the EPS stimulus, while at 24 and 48 h after EPS both lysosomal and cytosolic glycogen content was greater compared to control myotubes (). Together, these data suggest that glycogen supercompensation is due to an increase in both lysosomal and cytosolic glycogen, with the former likely due to reduced GAA activity and glycophagy.
Figure 1. Glycophagy is dynamically regulated while its absence reduces glucose metabolism. (A) Glycogen content and GAA activity of vastus lateralis muscle biopsied from untrained or exercise trained humans (n = 6–13 per group). (B) Glycogen content and GAA activity of quadriceps muscle obtained from untrained or exercise trained mice (n = 6–10 per group). (C) Glycogen content and GAA activity of C2C12 myotubes subjected to 1 h of prior EPS stimulation (n = 3–8 per group). (D) Glycogen content of lysosomes or remaining cytosolic fraction isolated from C2C12 myotubes subjected to 1 h of prior EPS stimulation (n = 8 per group). (E) Glycogen content and GAA activity of C2C12 myotubes exposed to various stimuli (n = 6 per group). (F) Glycogen content and GAA activity of C2C12 myotubes each day during differentiation (n = 8–10 per group). (G) Relative Gaa mRNA abundance, GAA activity (fluorescence intensity/μg protein), whole cell glycogen, lysosomal glycogen, or cytosolic glycogen (μg glycogen/μg protein) in control (scrambled treated) and shGaa lentivirus-treated C2C12 myotubes (n = 4–6 per group). (H) Extracellular acidification rates (ECAR) during a glycolysis stress test in control and shGaa lentivirus-treated C2C12 myotubes (n = 15 per group).(I) Lactate production over 24 h in control and shGaa lentivirus treated C2C12 myotubes (n = 5 per group). (J) Western blot image showing the abundance of various proteins in control and shGaa lentivirus-treated C2C12 myotubes (n = 6 per group). (K) Heat map of RNA sequencing data showing change in select genes within the context of the intracellular environment in control and shGaa lentivirus-treated C2C12 myotubes (n = 3 per group). The data is expressed as Log10 fold change, with red indicating greater gene abundance and blue indicating lower gene abundance, compared to control (white). (L) [14C]-deoxy-d-glucose uptake in control and shGaa lentivirus-treated C2C12 myotubes, with or without 100 nM insulin (n = 6–11 per group). (M) [14C]-glucose oxidation, with or without 0.5 mM nicotinamide riboside (NR) present in the media, in control and shGaa lentivirus-treated C2C12 myotubes (n = 12–16 per group). Notes: Data are presented as mean ± S.E.M.
![Figure 1. Glycophagy is dynamically regulated while its absence reduces glucose metabolism. (A) Glycogen content and GAA activity of vastus lateralis muscle biopsied from untrained or exercise trained humans (n = 6–13 per group). (B) Glycogen content and GAA activity of quadriceps muscle obtained from untrained or exercise trained mice (n = 6–10 per group). (C) Glycogen content and GAA activity of C2C12 myotubes subjected to 1 h of prior EPS stimulation (n = 3–8 per group). (D) Glycogen content of lysosomes or remaining cytosolic fraction isolated from C2C12 myotubes subjected to 1 h of prior EPS stimulation (n = 8 per group). (E) Glycogen content and GAA activity of C2C12 myotubes exposed to various stimuli (n = 6 per group). (F) Glycogen content and GAA activity of C2C12 myotubes each day during differentiation (n = 8–10 per group). (G) Relative Gaa mRNA abundance, GAA activity (fluorescence intensity/μg protein), whole cell glycogen, lysosomal glycogen, or cytosolic glycogen (μg glycogen/μg protein) in control (scrambled treated) and shGaa lentivirus-treated C2C12 myotubes (n = 4–6 per group). (H) Extracellular acidification rates (ECAR) during a glycolysis stress test in control and shGaa lentivirus-treated C2C12 myotubes (n = 15 per group).(I) Lactate production over 24 h in control and shGaa lentivirus treated C2C12 myotubes (n = 5 per group). (J) Western blot image showing the abundance of various proteins in control and shGaa lentivirus-treated C2C12 myotubes (n = 6 per group). (K) Heat map of RNA sequencing data showing change in select genes within the context of the intracellular environment in control and shGaa lentivirus-treated C2C12 myotubes (n = 3 per group). The data is expressed as Log10 fold change, with red indicating greater gene abundance and blue indicating lower gene abundance, compared to control (white). (L) [14C]-deoxy-d-glucose uptake in control and shGaa lentivirus-treated C2C12 myotubes, with or without 100 nM insulin (n = 6–11 per group). (M) [14C]-glucose oxidation, with or without 0.5 mM nicotinamide riboside (NR) present in the media, in control and shGaa lentivirus-treated C2C12 myotubes (n = 12–16 per group). Notes: Data are presented as mean ± S.E.M.](/cms/asset/9f778c86-e646-4369-913c-5d70be4dc813/kaup_a_1969633_f0001_c.jpg)
Glucose availability, Notch signaling, and cAMP signaling modulate glycophagy
In hepatocytes glycogen is delivered to lysosomes via the chaperone protein STBD1 (starch binding domain containing protein 1) and is regulated via NOTCH1,TFEB, or cAMP signaling [Citation6–8]. However, in skeletal muscle glycogen delivery to lysosomes occurs independent of STBD1 [Citation27], and factors that regulate it are not known. In response to 24 h of glucose deprivation Gaa mRNA levels remained unchanged (Figure S1B), while glycogen content and GAA activity decreased (). Moreover, the mRNA abundance of Pygm (muscle glycogen phosphorylase) and Tfeb increased, while Notch1 mRNA abundance remained unchanged (Figure S1B). These data suggest that Pygm, and not glycophagy, is more active in C2C12 myotubes in response to glucose restriction. Although prior work has shown that TFEB is a transcriptional regulator of Gaa in human HeLa cells [Citation6], the data herein in mouse C2C12 myotubes suggests that changes in Tfeb mRNA abundance are not associated with changes in Gaa mRNA abundance, suggesting TFEB is not a transcriptional regulator of Gaa. This finding is supported by studies showing that skeletal muscle specific knock-in of TFEB increases glycogen content [Citation28].
Trehalose is a known autophagy activator [Citation29] and in human primary myotubes a 24 h treatment with 250 mM trehalose increased GAA activity (Figure S1C). In C2C12 myotubes trehalose did not modify Pygm mRNA abundance but increased Gaa mRNA abundance (Figure S1D) and GAA activity (), indicating that increasing autophagy increases glycophagy. Moreover, trehalose reduced glycogen content () and the mRNA abundance of Notch1, while Tfeb mRNA levels remained unchanged (Figure S1D). Increasing Notch1 signaling suppresses Gaa abundance in hepatocytes [Citation8], but increases Gaa abundance in fibroblasts (9), indicating that the regulation of Gaa by Notch1 signaling is complex and varies by tissue. Nevertheless, the reduced Notch1 mRNA abundance in conjunction with the increase in GAA activity with trehalose treatment herein suggest that NOTCH1 signaling, but not TFEB, may regulate glycophagy in skeletal muscle. To test this, NOTCH1 signaling was directly inhibited by exposing myotubes to the γ-secretase inhibitor N-(N-[3,5-difluorophenacetyl]-L-alanyl)-S-phenylglycine t-butyl ester (DAPT), a potent NOTCH1 inhibitor [Citation30], and this resulted in reduced GAA activity but unaltered glycogen content. Thus, although trehalose increased glycophagy and this was associated with reduced Notch1 mRNA abundance, the fact that inhibiting Notch signaling directly reduced GAA activity suggests that trehalose mediated stimulation of GAA activity likely involves mechanisms independent from NOTCH1 signaling, and that changes in Gaa mRNA abundance may not always correspond with changes in GAA activity. In addition to Notch signaling, cAMP signaling has been shown to increase glycophagy in hepatocytes [Citation7]. Likewise, exposing myotubes to 8-bromo-cyclic AMP, a cell permeable analog of cAMP, also increased GAA activity but did not alter glycogen content (). Previous reports also show that mTOR signaling decreases glycophagy in the heart [Citation7]. Insulin is a potent stimulus for mTOR signaling but in myotubes insulin did not impact GAA activity, although it did increase glycogen content (). After being exposed to differentiation media C2C12 myotube glycogen content decreased, but this was not associated with changes in GAA activity (), suggesting glycophagy is not modulated during differentiation.
Short-term glycophagy deficiency reduces NAD content and glucose oxidation
The metabolic fate of glucose liberated via glycophagy is unclear. Herein, a lentivirus was used to induce a short-term knockdown of Gaa in C2C12 cells, and then functional assays and RNA sequencing followed to characterize how short-term loss of glycophagy impacts energy metabolism. The lentivirus resulted in a reduction in Gaa mRNA, GAA activity, and cytosolic glycogen content, while whole myotube and lysosomal glycogen content increased (). Glycophagy deficiency reduced the extracellular acidification rate during the sequential addition of glucose and oligomycin during a glycolysis stress test (), as well as the appearance of lactate in the media over a 24-h period (), suggesting glycophagy deficiency reduces glycolytic capacity. This reduction in glycolytic capacity was not due to reduced glucose uptake, as SLC2A1/GLUT1 protein abundance ( and S1E) and [14C]-2-deoxyglucose uptake () increased with glycophagy deficiency, although the RNA sequencing analysis revealed the mRNA abundance of Slc2a1 and Slc2a6, genes for glucose transport protein 1 and 6, respectively, were reduced (). Nevertheless, the increase in glucose uptake is consistent with another study [Citation15] that showed mice with Pompe disease have increased skeletal muscle SLC2A4/GLUT4 abundance. Although the gene abundance of Pygm was reduced (), this was not associated with changes in label incorporation into glycogen (Figure S1F) even though the ratio of phosphorylated (p)-GSK3A (S21):GSK3A was elevated with glycophagy deficiency ( and S1E), an effect expected to increase glycogen synthesis. The mRNA abundance of the glycolytic gene Eno3 was reduced (), but it is likely that reduced glycolytic capacity was not due to reduced glycolytic gene abundance as the protein abundance of GAPDH (glyceraldehyde-3-phosphate dehydrogenase), the rate limiting enzyme in glycolysis, was not modified, while the protein abundance of H6PD (hexose-6-phosphate dehydrogenase (glucose 1-dehydrogenase)), the rate limiting enzyme in the pentose phosphate pathway, increased with glycophagy deficiency ( and S1E).
During the glycogen synthesis experiments higher radioactivity was measured in the supernatant, after ethanol was added to precipitate glycogen, in samples from glycophagy deficient myotubes (Figure S1G), indicating exogenous glucose taken up by glycophagy deficient myotubes is not stored as glycogen, but is incompletely metabolized. Indeed, in skeletal muscle from mice with Pompe disease and lacking Gaa from birth, HK (hexokinase) activity and glucose-6-phosphate levels are elevated [Citation16], and our data expands on this and suggests exogenous glucose oxidation is impaired which presumably leads to a buildup of some glycolytic intermediate, possibly glucose-6-phosphate. Curiously, short-term glycophagy deficiency increased the mRNA abundance of several members of the Parp (poly (ADP-ribose) polymerase family) (), which are enzymes that catalyze the transfer of adenosine diphosphate-ribose units from nicotinamide adenine dinucleotide (NAD) to target proteins involved in cellular stress responses, and activation of PARPs can lead to cellular NAD depletion [Citation31]. It is possible that glycophagy deficiency induces a cellular stress that activates PARPs which reduces NAD and glycolysis. Indeed, NAD concentrations in glycophagy deficient myotubes were modestly reduced (Figure S1H) and this was associated with reduced [14C]-glucose oxidation, but increasing NAD synthesis with 0.5 mM nicotinamide riboside (NAD precursor) supplementation nearly restored [14C] glucose oxidation to control values in glycophagy deficient myotubes (). Moreover, in human myotubes the glycophagy inhibitor acarbose reduced glucose oxidation and this impairment was rescued with 1 mM nicotinamide riboside supplementation (Figure S1I). Together, reduced NAD concentrations as a result of increased PARP activation may drive the impairment in exogenous glucose oxidation observed with glycophagy deficiency.
Short-term glycophagy deficiency increases glutamine utilization
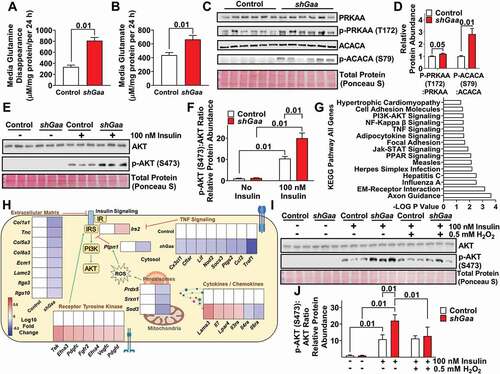
When glycolysis is reduced and pyruvate metabolism is limited, cells adapt by increasing glutamine catabolism which generates both oxaloacetate and acetyl-CoA to allow the tricarboxylic acid cycle to maintain optimal function [Citation32]. Consistent with this, glycophagy deficiency increased Slc38a7, a known glutamine transporter [Citation33], Ogdhl, a mitochondrial enzyme known to degrade glutamate, a metabolite of glutamine metabolism, and Pck2, which is a mitochondrial enzyme that catalyzes the conversion of oxaloacetate (generated from glutamine metabolism) to phosphoenolpyruvate (). These changes in mRNA abundance translated into functional changes as glycophagy deficiency increased glutamine utilization and glutamate generation (). Together, these data suggest that glycophagy deficiency and the subsequent reduction in glucose carbons for energy metabolism in myotubes is compensated for, at least in part, by increasing glutamine metabolism.
Figure 2. Short-term glycophagy deficiency increases glutamine metabolism and modulates AMPK activity, PI3K-AKT signaling, and insulin action. (A and B) Media glutamine disappearance (A) and media glutamate concentrations (B) in control and shGaa lentivirus treated C2C12 myotubes (n = 8 per group). (C) Western blot image showing abundance of various proteins in control and shGaa lentivirus treated C2C12 myotubes (n = 6 per group). (D) Densitometry quantification from image in C (n = 6 per group). (E) Western blot image showing total AKT (upper band) and p-AKT (S473) (lower band) protein abundance, under both non-insulin and insulin stimulated conditions, in control and shGaa lentivirus treated C2C12 myotubes (n = 3 per group). (F) Densitometry quantification from image in E (n = 3 per group). (G) KEGG Pathway analysis from RNA sequencing data highlighting pathways that were significantly modified with glycophagy deficiency in control and shGaa lentivirus treated C2C12 myotubes (n = 3 per group). Values are expressed as -LOG of the p value. (H) Heat map of RNA sequencing data showing change in select genes within the context of the intracellular environment in control and shGaa lentivirus treated C2C12 myotubes (n = 3 per group). The data are expressed as Log10 fold change, with red indicating greater gene abundance and blue indicating lower gene abundance, compared to control (white). (I) Western blot image showing total AKT (upper band) and p-AKT (S473) (lower band) protein abundance, under both non-insulin and insulin (100 nM) stimulated conditions with or without 0.5 mM exogenous hydrogen peroxide (H2O2), in control and shGaa lentivirus treated C2C12 myotubes (n = 3 per group). (J) Densitometry quantification from image in I (n = 3 per group). Notes: Data are presented as mean ± S.E.M.
Short-term glycophagy deficiency increases AMPK signaling and insulin action
Adenosine monophosphate-activated protein kinase (AMPK) is a cellular energy sensor which is typically upregulated during metabolic stress such as low glucose availability [Citation34]. Herein, glycophagy deficiency increased AMPK activity as indicated by an increase in the ratio of p-PRKAA/p-AMPKα (T172):total PRKAA/AMPKα protein abundance and a increase in the ratio of the AMPK target protein p-ACACA/p-ACC (acetyl-Coenzyme A carboxylase alpha) (S79):ACACA/ACC (). Similar to these data, prior reports have shown that long-term glycophagy deficiency in Pompe disease increases AMPK abundance in skeletal muscle [Citation17].
AMPK activity is linked with insulin action [Citation35]. Not surprisingly, glycophagy deficiency enhanced insulin action, as indicated by increased p-AKT (S473):AKT protein abundance in response to insulin stimulation (). Consistent with this, exposing C2C12 myotubes to the GAA inhibitor acarbose also increased p-AKT (S473):AKT protein abundance in response to insulin stimulation (Figure S2A,B). Previous data have shown that long-term glycophagy deficiency in Pompe disease increases AKT protein abundance in skeletal muscle [Citation17], although the mechanisms are unknown. Next, to gain better insight into factors that may modulate insulin action in glycophagy deficiency, Kyoto encyclopedia of genes and genomes (KEGG) pathway analysis was performed on all genes that were significantly modified () as well as separate analyses on up- (Figure S2C) and downregulated genes (Figure S2D) from the RNA sequencing data. The analysis revealed several pathways linked to insulin action, including PI3K-AKT (upregulated), NFKB (downregulated), extracellular matrix – receptor interaction (downregulated), and PPAR signaling (mix of up- and downregulated genes, ).
IRS2 is a key node in the PI3K-AKT signaling cascade and glycophagy deficiency increased Irs2 mRNA abundance (). Moreover, oxidative stress is one factor that can modify PI3K-AKT signaling and insulin action, and the RNA sequencing analysis revealed that Ptpn1, a known negative regulator of insulin signaling that is upregulated during oxidative stress [Citation36,Citation37], was reduced with glycophagy deficiency (). This was associated with reduced abundance of the antioxidant genes Prdx5, Srxn1, and Sod3 (), indicating that glycophagy deficiency may reduce oxidative stress, thereby lessening the requirement for antioxidant enzymes, and as a consequence this effect may improve insulin action. Therefore, next it was explored if exogenous oxidative stress would reverse the insulin sensitizing effect of glycophagy deficiency and indeed exogenous oxidative stress (H2O2) prevented the glycophagy deficiency induced increase in the ratio of p-AKT (S473):AKT protein abundance protein abundance during insulin stimulation (), suggesting the improvement in insulin action with glycophagy deficiency may be mediated through reduced oxidative stress.
In addition to oxidative stress, the RNA sequencing and KEGG pathway analysis identified that glycophagy deficiency altered the abundance of many other genes that would be expected to increase insulin action including those associated with the extracellular matrix [Citation38,Citation39], inflammation, and cytokines ( and Table S1). Overall, short-term glycophagy deficiency increases insulin action, and it appears this may be due to a plethora of upstream mechanisms including modified PI3K-AKT signaling and reduced oxidative stress, extracellular matrix remodeling, and inflammation.
Short-term glycophagy deficiency induces Ppara signaling and promotes fatty acid oxidation
The KEGG pathway analysis identified that glycophagy deficiency modified the peroxisome proliferator activated receptor pathway (). PPAR alpha is a transcriptional factor that initially was characterized to regulate genes involved in glucose and lipid metabolism while more recent work has shown it can also alter inflammation and protein degradation [Citation40]. In response to glycophagy deficiency Ppara mRNA abundance increased as well as its target genes including Ppargc1a, Cpt1c, and Acox3 (). Additionally, Pex26 (a marker of peroxisome biogenesis) and Slc27a3 (a fatty acid transporter) increased, Acot7 (involved in fatty acid deactivation) decreased, while other PPARa target genes involved in fatty acid metabolism including Angptl4, Acsbg1, Acsl4, Acsl6, Fabp3, and Fabp5 were all modified in a manner consistent with a metabolic transcriptional signature favoring fatty acid oxidation (). These changes in mRNA abundance corresponded to functional changes as short-term knockdown of glycophagy increased both complete and incomplete oxidation of [14C]-oleate and this coincided with an increase in [14C]-oleate uptake (). Consistent with these effects, prior studies have reported glycophagy deficiency enhances mitochondrial metabolism in skeletal muscle from Pompe patients [Citation12,Citation14]. The changes in fatty acid oxidation in our study were associated with an increase in maximal carbonyl cyanide-p-trifluoromethoxy phenylhydrazone (FCCP) stimulated oxygen consumption rates during a mitochondrial stress test (), suggesting that glycophagy deficiency increases mitochondrial content. Basal adenosine triphosphate production or proton leak were not modified, indicating that mitochondrial coupling was not altered (). Rather, this increase in maximal respiration was due to an increase in complex IV, but not complex II, mediated maximal respiration rates (). This functional increase in complex IV activity coincided with an increase in electron transport chain complex IV and complex I protein abundance, while complex V, III, and II protein abundance were not modified (), suggesting that only select components of mitochondrial content are elevated with glycophagy deficiency. Furthermore, the protein abundance of UCP2 or UCP3 were not modified with glycophagy deficiency (). These data are consistent with the lack of change in adenosine triphosphate production or proton leak () and indicate the increase in fatty acid oxidation was not due to increased energy expenditure as a result of reduced mitochondrial efficiency or uncoupling, but was due to a compensatory increase in flux of fatty acids toward oxidation for energy metabolism as a result of reduced glucose availability from glycophagy. Additionally, C2C12 myotubes exposed to the GAA inhibitor acarbose displayed greater FCCP stimulated oxygen consumption rates during a mitochondrial stress test (Figure S2E), further suggesting that short-term glycophagy deficiency per se increases mitochondrial content and fatty acid oxidation.
Figure 3. Short-term glycophagy deficiency increases Ppara signaling and fatty acid oxidation. (A) Heat map of RNA sequencing data showing change in select genes within the context of the intracellular environment in control and shGaa lentivirus treated C2C12 myotubes (n = 3 per group). The data are expressed as Log10 fold change, with red indicating greater gene abundance and blue indicating lower gene abundance, compared to control (white). (B) [14C]-oleate label in media CO2 (complete fatty acid oxidation), media acid soluble metabolites (ASM, incomplete fatty acid oxidation), or cell ASM (fatty acid uptake) in control and shGaa lentivirus treated C2C12 myotubes (n = 6 per group). (C) Oxygen consumption rates (OCR) during a Seahorse mitochondrial stress test in control and shGaa lentivirus treated C2C12 myotubes (n = 11–14 per group). (D) OCR showing ATP production, maximal respiration, and proton leak during a Seahorse mitochondrial stress test in control and shGaa lentivirus treated C2C12 myotubes (n = 11–14 per group). (E) Complex II and Complex IV mediated respiration rates in control or shGaa lentivirus treated C2C12 myotubes (n = 5 per group). (F) Western blot image and densitometry quantification showing protein abundance of Complex I–V of the electron transport chain, as well as UCP2 and UCP3 in control or shGaa lentivirus treated C2C12 myotubes (n = 6 per group). (G) Triglyceride content of control and shGaa lentivirus treated C2C12 myotubes (n = 5 per group). (H) [14C]-leucine incorporation into cellular protein in control and shGaa lentivirus treated C2C12 myotubes (n = 6 per group). (I) [14C]-leucine oxidation, transamination, or uptake in control or shGaa lentivirus treated C2C12 myotubes (n = 10–12 per group). (J) [14C]-leucine effluxed into the media during a pulse-chase experiment in control or shGaa lentivirus treated C2C12 myotubes (n = 6 per group). Notes: Data are presented as mean ± S.E.M. RNA sequencing data is presented in a heat map expressed as Log10 fold change.
![Figure 3. Short-term glycophagy deficiency increases Ppara signaling and fatty acid oxidation. (A) Heat map of RNA sequencing data showing change in select genes within the context of the intracellular environment in control and shGaa lentivirus treated C2C12 myotubes (n = 3 per group). The data are expressed as Log10 fold change, with red indicating greater gene abundance and blue indicating lower gene abundance, compared to control (white). (B) [14C]-oleate label in media CO2 (complete fatty acid oxidation), media acid soluble metabolites (ASM, incomplete fatty acid oxidation), or cell ASM (fatty acid uptake) in control and shGaa lentivirus treated C2C12 myotubes (n = 6 per group). (C) Oxygen consumption rates (OCR) during a Seahorse mitochondrial stress test in control and shGaa lentivirus treated C2C12 myotubes (n = 11–14 per group). (D) OCR showing ATP production, maximal respiration, and proton leak during a Seahorse mitochondrial stress test in control and shGaa lentivirus treated C2C12 myotubes (n = 11–14 per group). (E) Complex II and Complex IV mediated respiration rates in control or shGaa lentivirus treated C2C12 myotubes (n = 5 per group). (F) Western blot image and densitometry quantification showing protein abundance of Complex I–V of the electron transport chain, as well as UCP2 and UCP3 in control or shGaa lentivirus treated C2C12 myotubes (n = 6 per group). (G) Triglyceride content of control and shGaa lentivirus treated C2C12 myotubes (n = 5 per group). (H) [14C]-leucine incorporation into cellular protein in control and shGaa lentivirus treated C2C12 myotubes (n = 6 per group). (I) [14C]-leucine oxidation, transamination, or uptake in control or shGaa lentivirus treated C2C12 myotubes (n = 10–12 per group). (J) [14C]-leucine effluxed into the media during a pulse-chase experiment in control or shGaa lentivirus treated C2C12 myotubes (n = 6 per group). Notes: Data are presented as mean ± S.E.M. RNA sequencing data is presented in a heat map expressed as Log10 fold change.](/cms/asset/008476b5-d615-4db8-ad86-f08e7a6a53ef/kaup_a_1969633_f0003_c.jpg)
Short-term glycophagy deficiency reduces triglyceride and protein synthesis
PPARa activation and increased fatty acid oxidation are associated with reduced triglyceride synthesis [Citation41], and prior studies [Citation12,Citation14] have demonstrated long-term glycophagy deficiency in Pompe disease increases triglyceride content in skeletal muscle, which is likely a secondary pathological effect of prolonged glycophagy deficiency. On the contrary, herein short-term glycophagy deficiency reduced cell triglyceride content () and this was associated with reduced mRNA abundance of Scd2 and Dgat2, which are involved in triglyceride synthesis (). These effects are consistent with PPARa activation. Additionally, PPARa activation is associated with reduced inflammation, which is consistent with the reduced nuclear factor kappa β signaling and inflammation observed with glycophagy deficiency ( and Table S1).
Another aspect of metabolism identified in the RNA sequencing analysis that was impacted by glycophagy deficiency was protein homeostasis. Protein can be degraded either via autophagy or through the ubiquitin-proteasome system and PPARa activation has been shown to promote Ubc expression [Citation42]. Indeed, Ubc gene abundance increased in glycophagy deficient C2C12 myotubes, and this corresponded with an induction of the proteasome genes Rhobtb1, Klhl13, and Uba7 (). This translated into a functional difference as there was a reduction of [14C]-leucine incorporation into protein (i.e. reduced protein synthesis) () and a reduction in total protein levels in myotubes (Figure S2F), suggesting that glycophagy deficiency may drive protein degradation via the ubiquitin-proteasome system. These changes in protein metabolism were not due to alterations in differentiation, as indicated by no changes in various markers of differentiation including immunofluorescence staining for myosin heavy chain (Figure S2G), the protein abundance of CCND1 or MYH2 (Figure S2H), or the mRNA abundance of Myod1, Myog, Prdm2, or Prdm4 (Table S1). Nevertheless, prior studies have shown that long-term glycophagy deficiency in Pompe disease impairs mTOR signaling and protein synthesis while promoting muscle wasting [Citation17,Citation18], which is consistent with our observations. Future work should explore the signaling mechanisms linking glycophagy to ubiquitin-mediated proteolysis and the role of this process in muscle atrophy.
Given that glycophagy deficiency reduced leucine incorporation into protein, it was reasoned this might have been due to partitioning of leucine toward oxidation rather than protein synthesis. Surprisingly, glycophagy deficiency reduced [14C]-leucine oxidation and transamination, although label within the cells was not modified (). Next, a pulse chase experiment was performed to determine why whole cell label was not modified, despite [14C]-leucine oxidation and transamination being reduced. After a 3 h pulse, followed by a 1 h chase, media [14C] label was higher with glycophagy deficient C2C12 myotubes, suggesting that [14C]-leucine or its metabolites are effluxed out of the cell, thus, cellular [14C] label is not altered despite reduced leucine oxidation and transanimation (). This may be because of increased proteolysis and protein export induced by glycophagy deficiency. The mechanisms and functional relevance of reduced leucine oxidation in the setting of glycophagy deficiency warrants further investigation.
Conclusion
In summary, glycophagy is dynamically regulated in response to cellular and environmental cues. Moreover, short-term loss of glycophagy corresponded to a re-wiring of cell metabolism to reduce glucose metabolism and enhance fatty acid and glutamine metabolism. These metabolic alterations were associated with increased PPAR signaling, AMPK activity, PI3K-AKT signaling, and insulin action. Together, these data suggest that glycophagy is not just a housekeeping process to degrade poorly branched glycogen particles but is also an important player in the regulation of energy metabolism and insulin action.
Materials and methods
Human skeletal muscle biopsy
This study was approved by the University Institutional Review Board prior to initiation and all subjects provided written informed consent. Subjects self-reported participating in exercise training, or being untrained, by filling out a physical activity questionnaire. Skeletal muscle biopsy samples were obtained from the vastus lateralis muscle of the subjects through a Bergstrom needle. The muscle biopsy sample was immediately flash frozen in liquid nitrogen and stored a − 80°C until subsequent analysis.
Glycogen
Tissue samples were hydrolyzed in 1 M HCL at 95°C for ~1 h to degrade glycogen into glucose, and subsequently a glucose colorimetric kit (FUJIFILM/Wako Diagnostics, 997–03001) was used to measure glucose levels as a measure of glycogen content. For myotubes and isolated lysosomes and the remaining cytosolic fractions, where glycogen concentrations were expected to be low, a commercially available high sensitivity fluorometric Glycogen Assay Kit (Cayman Chemical, 700480) was utilized to measure glycogen.
RT-qPCR and RNA-seq
TRIzol reagent (ThermoFisher Scientific, 15596018) was used to isolate RNA from samples. For RT-qPCR, cDNA from isolated RNA was created using a SuperScript VILO cDNA Synthesis Kit (ThermoFisher Scientific, 11754050), while SYBR Green Master Mix (ThermoFisher Scientific, 4312704) was used for qPCR. For RNA sequencing samples, a RNeasy Mini Kit (QIAGEN LLC, 74104) was used to isolate highly pure RNA. Samples were submitted to the University of Minnesota Genomics Center, where 12 unique dual-indexed TruSeq Stranded mRNA libraries were created. All libraries were pooled and sequenced on a NextSeq Mid-output 2x75-bp run.
GAA activity assay
Samples were homogenized in CelLytic M Lysis Buffer (MilliporeSigma, C2978), and the sample homogenate was incubated with a reaction mixture consisting of 10 mM 4-methyl-umbelliferyl-α-d-glucoside substrate (MilliporeSigma, 69591) in buffer containing 0.1 M citric acid and 0.2 M disodium hydrogen phosphate (pH 4.5) for 1 h at 37°C on a glass bottom black 96-well plate (ThermoFisher Scientific, M33089). After 1 h, the reaction was stopped by adding a buffer containing 368 mM glycine and 445 mM anhydrous sodium carbonate (pH 10.5) to each well and subsequently the fluorescence was measured at excitation-emission 360–440 on a fluorescent plate reader.
Cell culture
C2C12, 293T, or human primary muscle cells (ThermoFisher Scientific, A12555) were proliferated in growth media (10% FBS [R&D Systems, S12450] 1% Pen-Strep [ThermoFisher Scientific, 15140122], 4.5 g/L glucose with L-glutamine DMEM [ThermoFisher Scientific, 11965–092]). At approximately 90% confluency, C2C12 or human primary muscle cells were differentiated into myotubes using differentiation media (2% horse serum [Corning, 35–030-CV], 1% Pen-Strep, 4.5 g/L glucose with L-glutamine DMEM).
Exercise training and electrical pulse stimulation experiments
Female C57Bl/6J mice underwent a 12-week, 4 d per week, exercise training program that consisted of interval training with a 2min high intensity interval (14 m/min, increase by 1 m/min every week) followed by a 2min low intensity interval (0.6 m/min), which was repeated for 1 h. Mice were sacrificed 48 h after the last exercise session. Myotubes were subjected to electrical pulse stimulation (EPS) using a IonOptix LLC C-Pace stimulator for 1 h. The EPS settings were 2 ms duration, 20 V, 0.50 HZ.
Lyso-IP
C2C12 cells stably expressing TMEM192 were generated as previously described by our lab based on original reports [Citation25]. Harvested cells were gently lysed by 30 strokes with a Teflon pestle (MilliporeSigma, P7734) and lysosomes were isolated by incubating with anti-HA magnetic beads (ThermoFisher Scientific, 88836) for 10 min [Citation25]. The remaining supernatant after lysosome isolation was kept as well and considered a cytosolic enriched fraction which was assayed for glycogen content using a commercially available kit, as described above. Immuno-captured lysosomes were disrupted using glycogen assay buffer containing added Triton X-100 detergent (0.5%; MilliporeSigma, X100) and the released glycogen was measured using a commercially available kit, as described above.
Gaa regulation experiments
Myotubes were exposed to media containing 0 mM glucose, 250 mM trehalose (ACROS Organics, 182550250), or 10 mM acarbose (ACROS Organics, 459080010) for 24 h, and immediately after each treatment cells were flash frozen in liquid nitrogen until analysis. In other experiments, 20 μM 8-bromo-cAMP (Santa Cruz Biotechnology, sc-217493A), 10 μM DAPT (AdipoGen Life Sciences, AG-CR1-0016-M005), or 100 nM insulin (MilliporeSigma, I5523) were added to the media for 3 h, and immediately after each incubation cells were flash frozen in liquid nitrogen until analysis.
Lentivirus
The lentiviral packaging plasmids psPAX2 (Addgene, 12260; depositing lab: Didier Trono) and envelope expressing plasmid pMD2.G (Addgene, 12259; depositing lab: Didier Trono) were used to construct a lentivirus. Briefly, 3 μg PAX2, 1 μg MD2.G, and 3 μg scrambled shRNA (Addgene, 1864, depositing lab: David Sabatini) or Gaa shRNA (Millipore Sigma, TRCN0000190906) were mixed with 500 μl OptiMEM (ThermoFisher Scientific, 31985062), 400 μl 0.15 M NaCl, and 200 μl of 0.1% polyethylenimine (Alfa Aesar, 43896). After 30 min at room temperature, this mix was added to the media of 293T cells for 48 h. Following this incubation, the media supernatant containing virus was removed from the 293T cells, polybrene was added to the viral media, and the viral/polybrene mix was added to C2C12 cells for 48 h to induce the Gaa knockdown. Next, the viral media was removed, and cells were incubated in growth media with puromycin for 72 h. After puromycin selection, new differentiation media was added daily until cells differentiated into myotubes, followed by experiments.
Western blotting
Total protein homogenates were extracted from samples, and total protein content was measured using a PierceTM BCA Protein Assay Kit (ThermoFisher Scientific, 23225). SDS-Page was performed to separate proteins, which were then transferred to Nitrocellulose blots, stained with Ponceau S to determine protein loading, and then incubated overnight with the primary antibody. The primary antibodies used included PRKAA/AMPK alpha (Cell Signaling Technology, 2532), p-PRKAA/AMPK alpha (T172; Cell Signaling Technology, 2535), AKT (Cell Signaling Technology, 9272S), p-AKT (S473; Cell Signaling Technology, 9271S), ACACA/ACC (Cell Signaling Technology, 3662S), p-ACACA/ACC (S79; Cell Signaling Technology, 3661), CCND1 (Cell Signaling Technology, 2978), GAPDH (Cell Signaling Technology, 5174), SLC2A1/GLUT1 (Cell Signaling Technology, 12939S), G6PD2/G6PD (Cell Signaling Technology, 12263S), MYH2/MHC2A (DSHB, SC-71), rodent total oxphos (abcam, ab110413), UCP2 (Cell Signaling Technology, 89326S), UCP3 (abcam, ab10985), p-GSK3A (S21; Cell Signaling Technology, 9316S), GSK3A (Cell Signaling Technology, 9338S). The following day, blots were incubated with the appropriate Li-COR secondary for 1 h, washed, and then imaged using a LI-COR Odyssey Fc imaging system. Pilot testing for antibodies consisted of loading varying amounts of the same sample and determining if there was a linear relationship between the amount of protein loaded and band intensity.
Insulin action experiments
Myotubes were serum starved for 3 h with or without 0.5 mM H2O2 and then were incubated with 100 nM insulin (MilliporeSigma, I5523), with or without 0.5 mM H2O2, for 10 min. Following the incubation, myotubes were quickly washed once with PBS and then the cell culture plate was placed directly in liquid nitrogen to snap freeze the myotubes.
Seahorse assays
A Seahorse XFe96 Analyzer was used to measure oxygen consumption rates and extracellular acidification rates during a Mitochondrial Stress Test (Agilent, 103015–100) or Glycolysis Stress Test. For the mitochondrial stress test, myotubes were incubated for ~1 h in Seahorse XF Base Medium (Agilent, 103334–100) supplemented with 10 mM glucose (Spectrum Chemical MFG Corp, 50–99-7), 2 mM glutamine (ThermoFisher Scientific, 25030164), and 1 mM pyruvate (MilliporeSigma, P5280) prior to performing the assay, which included subsequent injections of 2 μM oligomycin (Agilent, 103015–100), 1 μM FCCP (Agilent, 103015–100), and a 5 μM rotenone/antimycin A mix (Agilent, 103015–100). For the glycolysis stress test, myotubes were incubated for ~1 h in Seahorse XF Base Medium (Agilent, 103334–100) supplemented with 1 mM glutamine (ThermoFisher Scientific, 25030164) prior to performing the assay, which included subsequent injections of 10 mM glucose (Spectrum Chemical MFG Corp, 50–99-7), 2 μM oligomycin (Agilent, 103015–100), and 500 mM 2-deoxyglucose (MilliporeSigma, D6134).
Glucose and oleate oxidation assays
[1–14C]glucose (American Radiolabeled Chemicals, ARC 0120A) or [1–14C]oleate (Perkin Elmer, NEC317250UC) were used to measure glucose and fatty acid oxidation, respectively. For glucose oxidation, myotubes were serum starved for 3 h, and this was followed by a 3-h incubation in serum free media containing 0.5 μCi/ml glucose (and 10 mM cold glucose with or without 0.5 mM or 1 mM nicotinamide riboside (Cayman Chemical, 23132). Following the incubation, the media was collected, 1 M perchloric acid was added to the media to cause the release of [14C]CO2, and filter paper containing 1 M NaOH collected the released [14C]CO2, and the radioactivity was measured using scintillation counting to assess complete glucose oxidation. For oleate oxidation, myotubes were incubated in differentiation media containing 0.2 μCi/ml oleate (with 0.7% BSA (GeminiBio, 700–107P), 250 μM cold oleate (MilliporeSigma, O3880), 2 mM carnitine (MilliporeSigma, C0283) for 3 h. Following the incubation, the media was collected, 1 M perchloric acid was added to the media to cause the release of [14C]CO2, and filter paper containing 1 M NaOH collected the released [14C]CO2, and the radioactivity was measured using scintillation counting to assess complete fatty acid oxidation. Additionally, the radioactivity of the acid soluble metabolites within the media in which perchloric acid was added (incomplete fatty acid oxidation) was measured. To measure fatty acid uptake into myotubes, after collecting the media for measurement of fatty acid oxidation the myotubes were washed two times with ice cold PBS (Gibco, 10010–023), scraped from the plate in H2O, and added to a microcentrifuge tube containing 1 M perchloric acid, and the radioactivity of the acid soluble metabolites (ASM) within the myotubes was measured to assess fatty acid uptake.
Glycogen synthesis
Radiolabeled [1–14C]glucose was used to measure glycogen synthesis. After a 3 h incubation with serum free media, 0.2 µCi/ml of [1–14C]glucose was added to the cells, with or without 100 nM insulin in serum free media, for 2 h. After the 2 h incubation, the media was aspirated, the cells were washed two times with ice cold PBS and then lysed in ice cold 0.05% SDS (Fisher Scientific, BP166). Next, 2 mg of carrier glycogen was added to the cell extracts, and subsequently the samples were heated at 95°C for 1 h. After heating, 100% ethanol was added to the sample to precipitate glycogen overnight at 4°C. Glycogen was pelleted by spinning at 11,000 g for 30 min, the supernatant was removed, and the glycogen pellet was resuspended in distilled water and liquid scintillation counting was used to measure the radioactivity in glycogen. The radioactivity of the ethanol soluble precipitate was measured as well.
Glucose uptake
Radiolabeled 2-[1-14C]deoxy-d-glucose (Perkin Elmer, NEC495A050UC) was used to measure glucose uptake. After a ~ 3 h incubation with serum free media, 0.2 µCi/ml of 2-[1-14C]deoxy-d-glucose was added to the cells, with or without 100 nM insulin in serum free media for 30 min. After the incubation, the media was aspirated, the cells were washed two times with ice cold PBS, lysed in ice cold 0.05% SDS, and liquid scintillation counting was used to measure the radioactivity of lysed cell samples as a measure of glucose uptake.
Protein synthesis and leucine oxidation
Radiolabeled L-[14C(U)]-leucine (Perkin Elmer, NEC279E250UC) was used to measure protein synthesis and leucine oxidation, transamination, uptake, and efflux. For protein synthesis, myotubes were incubated in serum free media containing 0.2 µCi/ml L-[14C(U)]-leucine for 2 h. Following the incubation, cells were washed twice with ice cold PBS and then 100% w:v trichloroacetic acid was added and the cells were scraped from the plate. After a 30 min incubation at 4°C, samples were spun at 12,000 g to pellet protein, which was subsequently used in liquid scintillation counting to measure radioactivity. For leucine oxidation, myotubes were incubated in serum free media containing 0.2 µCi/ml L-[14C(U)]-leucine for 2 h. Following the incubation, the media was collected, 1 M perchloric acid was added to the media to cause the release of [14C]CO2, and filter paper containing 1 M NaOH collected the released [14C]CO2, and the radioactivity was measured using scintillation counting. Immediately after this, for leucine transamination, 30% hydrogen peroxide was added to the remaining media ASM where 14C α-keto-isocaproate (keto acid of leucine) remained [Citation43]. The hydrogen peroxide added decarboxylates branched chain keto acids, and the 14CO2 released was trapped in filter paper containing 1 M NaOH and measured using liquid scintillation counting [Citation43]. For leucine uptake, myotubes were incubated in serum-free media containing 0.2 µCi/ml L-[14C(U)]-leucine for 2 h. Following the incubation, cells were washed twice with ice cold PBS and then added to liquid scintillation for counting of radioactivity. For the pulse-chase experiment, myotubes were pulsed in serum free media containing 0.2 µCi/ml L-[14C(U)]-leucine for 3 h, and then fresh, non-labeled media was added for the 60 min chase period and collected for radioactivity measurement.
Lipid extraction and triglyceride measurement
Myotubes were washed with ice cold PBS and then the plate was flash frozen in liquid nitrogen and stored at −80°C until analysis. For lipid extraction, myotubes were thawed on ice, 500 μl water was added to each well, and then cells were scraped and placed in a microcentrifuge tube, vortexed, and then the sample was added to 5 ml of chloroform: methanol 2:1. After an overnight incubation, tubes were vortexed, centrifuged at 2000 x g at 4°C, and then the lower chloroform phase was transferred to a new tube. Samples were then dried down under nitrogen, and lipids were resuspended in isopropanol with 1% Triton X-100. A StanbioTM Triglyceride Kit (2100–430) was used to measure triglyceride levels.
Media glutamine, glutamate, and lactate levels
For media glutamine/glutamate and lactate concentrations, the cells were plated at the same density, and an exact amount of media was added for 24 h. After the incubation, media was collected and immediately frozen until analysis. A Glutamine/Glutamate-Glo Assay (Promega, J8021) was used for determination of media glutamine and glutamate concentrations. A Lactate Reagent Set (Pointe Scientific, L759650) was used to measure media lactate concentrations.
Respiration in frozen samples (RIFS)
Complex II- and complex IV-mediated respiration was measured in frozen control or shGaa myotubes based on protocols previously described [Citation44], with minor modifications. Briefly, frozen myotubes were thawed and then homogenized with a Teflon pestle (Cole-Parmer, UX-44468-06) in ice cold Buffer Z (105 mM K-MES, 30 mM KCl, 10 mM K2HPO4, 5 mM MgCl2.6H2O, 0.5 mg/ml BSA, 1 mM EGTA, pH 7.4). After homogenization, samples were spun at 1,000 g for 10 min to pellet cell debris, and the supernatant was collected and used in respiration experiments. Next, the sample was added to the OROBOROS Oxygraph-2k chamber containing 2 ml of Buffer Z with added cytochrome c (10 μM; MilliporeSigma, 9007–43-6), and respiration experiments ensued and included the sequential addition of succinate (10 mM; Spectrum Chemical MFG Corp, S1686), rotenone (5 μM; MilliporeSigma, R8875), malonate (5 mM; Alfa Aesar, A1152622), ascorbate (2 mM; Spectrum Chemical MFG Corp, S1439)-TMPD (100 μM; TCI Chemicals, T0151), and sodium azide (2 M; MilliporeSigma, S2002) to assess complex II and complex IV mediated respiration.
NAD concentrations
The total cellular NAD concentrations were measured using a commercially available kit (Cayman Chemical, 600480).
Immunofluorescence staining
Control or shGaa myoblasts were plated on an μ-Slide 8 well high (ibidi, 80806) and then differentiated prior to imaging. Differentiated myotubes were fixed with 4% paraformaldehyde at room temperature for 1 h. Following this, myotubes were washed three times with PBS (Gibco, 10010–023) and then permeabilized with 0.5% Triton X-100 (dissolved in PBS) at room temperature for 1 h. After washing three times with PBS, myotubes were blocked with 5% BSA (dissolved in PBS) at room temperature for 1 h, and this was followed by incubation with myosin heavy chain primary antibody with Alexa Fluor 488 conjugated to it (Santa Cruz Biotechnology, sc-376157; AF488) at 4°C overnight. The next day, myotubes were washed three times with PBS, stained with NucBlue reagent (Invitrogen, R37606) at room temperature for 20 min, washed three more times with PBS, and then mounting media (ibidi, 50001) was applied to the cell prior to imaging on a fluorescence microscope.
Statistical analysis
GraphPad Prism 8 was used to generate all figures and perform most statistical analyses. Either independent sample t-tests, one-way, or two-way ANOVA with appropriate post hoc testing was used to test for statistical significance between groups. Differential expression analysis of the RNA sequencing data was performed using EdgeR software. Statistical significance was set as a fold-change > 1.5 and FDR > 5%, with at least one group having a mean of 10 for expression values. Genes that were found to be significantly modified using EdgeR software were inputted into the online DAVID Bioinformatics database 6.8 for KEGG pathway mapping.
Supplemental Material
Download Zip (7.2 MB)Acknowledgments
We thank the University of Minnesota Genomics Center for running the RNA sequencing analysis and the University of Minnesota Imaging Center for providing the microscope for immunofluorescence imaging.
Data availability statement
Data supporting the findings of this study are available from the corresponding author, T.D.H., upon reasonable request.
Disclosure statement
No potential conflict of interest was reported by the author(s).
Supplementary material
Supplemental data for this article can be accessed here
Additional information
Funding
Related Research Data
References
- Prats C, Graham TE, Shearer J. The dynamic life of the glycogen granule. J Biol Chem. 2018;293:7089–7098.
- Jiang S, Wells CD, Roach PJ. Starch-binding domain-containing protein 1 (Stbd1) and glycogen metabolism: identification of the Atg8 family interacting motif (AIM) in Stbd1 required for interaction with GABARAPL1. Biochem Biophys Res Commun. 2011;413:420–425.
- Goldfarb AH, Bruno JF, Buckenmeyer PJ. Intensity and duration of exercise effects on skeletal muscle cAMP, phosphorylase, and glycogen. J Appl Physiol. 1989;66:190–194.
- Jensen TE, Richter EA. Regulation of glucose and glycogen metabolism during and after exercise. J Physiol. 2012;590:1069–1076.
- Parolin ML, Spriet LL, Hultman E, et al. Regulation of glycogen phosphorylase and PDH during exercise in human skeletal muscle during hypoxia. Am J Physiol Endocrinol Metab. 2000;278:E522–34.
- Sardiello M, Palmieri M, di Ronza A, et al. A gene network regulating lysosomal biogenesis and function. Science. 2009;325:473–477.
- Kondomerkos DJ, Kalamidas SA, Kotoulas OB, et al. Glycogen autophagy in the liver and heart of newborn rats. The effects of glucagon, adrenalin or rapamycin. Histol Histopathol. 2005;20:689–696.
- Yan B, Raben N, Plotz P. The human acid alpha-glucosidase gene is a novel target of the Notch-1/Hes-1 signaling pathway. J Biol Chem. 2002;277:29760–29764.
- Yan B, Raben N, Plotz PH. Hes-1, a known transcriptional repressor, acts as a transcriptional activator for the human acid alpha-glucosidase gene in human fibroblast cells. Biochem Biophys Res Commun. 2002;291:582–587.
- Dasouki M, Jawdat O, Almadhoun O, et al. Pompe disease: literature review and case series. Neurol Clin. 2014;32:751–76, ix.
- Gusarov I, Pani B, Gautier L, et al. Glycogen controls Caenorhabditis elegans lifespan and resistance to oxidative stress. Nat Commun. 2017;8:15868.
- Sarnat HB, Roth SI, Carroll JE, et al. Lipid storage myopathy in infantile Pompe’s disease. Arch Neurol. 1982;39:180–183.
- Selak MA, De Chadarevian JP, Melvin JJ, et al. Mitochondrial activity in Pompe’s disease. Pediatr Neurol. 2000;23:54–57.
- Verity MA. Infantile Pompe’s disease, lipid storage, and partial carnitine deficiency. Muscle Nerve. 1991;14:435–440.
- Douillard-Guilloux G, Raben N, Takikita S, et al. Restoration of muscle functionality by genetic suppression of glycogen synthesis in a murine model of Pompe disease. Hum Mol Genet. 2010;19:684–696.
- Taylor KM, Meyers E, Phipps M, et al. Dysregulation of multiple facets of glycogen metabolism in a murine model of Pompe disease. PLoS One. 2013;8:e56181.
- Lim JA, Li L, Shirihai OS, et al. Modulation of mTOR signaling as a strategy for the treatment of Pompe disease. EMBO Mol Med. 2017;9:353–370.
- Shemesh A, Wang Y, Yang Y, et al. Suppression of mTORC1 activation in acid-alpha-glucosidase-deficient cells and mice is ameliorated by leucine supplementation. Am J Physiol Regul Integr Comp Physiol. 2014;307:R1251–9.
- Wisselaar HA, Kroos MA, Hermans MM, et al. Structural and functional changes of lysosomal acid alpha-glucosidase during intracellular transport and maturation. J Biol Chem. 1993;268:2223–2231.
- Reuser AJ, Kroos M, Oude Elferink RP, et al. Defects in synthesis, phosphorylation, and maturation of acid alpha-glucosidase in glycogenosis type II. J Biol Chem. 1985;260:8336–8341.
- Conley KE, Blei ML, Richards TL, et al. Activation of glycolysis in human muscle in vivo. Am J Physiol. 1997;273:C306–15.
- Hingst JR, Bruhn L, Hansen MB, et al. Exercise-induced molecular mechanisms promoting glycogen supercompensation in human skeletal muscle. Mol Metab. 2018;16:24–34.
- Dickinson JM, D’Lugos AC, Naymik MA, et al. Transcriptome response of human skeletal muscle to divergent exercise stimuli. J Appl Physiol. 2018;124:1529–1540.
- Sandstrom ME, Abbate F, Andersson DC, et al. Insulin-independent glycogen supercompensation in isolated mouse skeletal muscle: role of phosphorylase inactivation. Pflugers Arch. 2004;448:533–538.
- Abu-Remaileh M, Wyant GA, Kim C, et al. Lysosomal metabolomics reveals V-ATPase- and mTOR-dependent regulation of amino acid efflux from lysosomes. Science. 2017;358:807–813.
- Cui W, Sathyanarayan A, Lopresti M, et al. Lipophagy-derived fatty acids undergo extracellular efflux via lysosomal exocytosis. Autophagy. 2020:7;1–16.
- Yi H, Fredrickson KB, Das S, et al. Stbd1 is highly elevated in skeletal muscle of Pompe disease mice but suppression of its expression does not affect lysosomal glycogen accumulation. Mol Genet Metab. 2013;109:312–314.
- Mansueto G, Armani A, Viscomi C, et al. Transcription factor EB controls metabolic flexibility during exercise. Cell Metab. 2017;25:182–196.
- DeBosch BJ, Heitmeier MR, Mayer AL, et al. Trehalose inhibits solute carrier 2A (SLC2A) proteins to induce autophagy and prevent hepatic steatosis. Sci Signal. 2016;9:ra21.
- Kitzmann M, Bonnieu A, Duret C, et al. Inhibition of Notch signaling induces myotube hypertrophy by recruiting a subpopulation of reserve cells. J Cell Physiol. 2006;208:538–548.
- Hurtado-Bages S, Knobloch G, Ladurner AG, et al. The taming of PARP1 and its impact on NAD(+) metabolism. Mol Metab. 2020;38:100950.
- Yang C, Ko B, Hensley CT, et al. Glutamine oxidation maintains the TCA cycle and cell survival during impaired mitochondrial pyruvate transport. Mol Cell. 2014;56:414–424.
- Hagglund MG, Sreedharan S, Nilsson VC, et al. Identification of SLC38A7 (SNAT7) protein as a glutamine transporter expressed in neurons. J Biol Chem. 2011;286:20500–20511.
- Ren Y, Shen HM. Critical role of AMPK in redox regulation under glucose starvation. Redox Biol. 2019;25:101154.
- Chopra I, Li HF, Wang H, et al. Phosphorylation of the insulin receptor by AMP-activated protein kinase (AMPK) promotes ligand-independent activation of the insulin signalling pathway in rodent muscle. Diabetologia. 2012;55:783–794.
- Panzhinskiy E, Ren J, Nair S. Protein tyrosine phosphatase 1B and insulin resistance: role of endoplasmic reticulum stress/reactive oxygen species/nuclear factor kappa B axis. PLoS One. 2013;8:e77228.
- Panzhinskiy E, Hua Y, Culver B, et al. Endoplasmic reticulum stress upregulates protein tyrosine phosphatase 1B and impairs glucose uptake in cultured myotubes. Diabetologia. 2013;56:598–607.
- Tam CS, Covington JD, Bajpeyi S, et al. Weight gain reveals dramatic increases in skeletal muscle extracellular matrix remodeling. J Clin Endocrinol Metab. 2014;99:1749–1757.
- Kang L, Ayala JE, Lee-Young RS, et al. Diet-induced muscle insulin resistance is associated with extracellular matrix remodeling and interaction with integrin alpha2beta1 in mice. Diabetes. 2011;60:416–426.
- Genini D, Carbone GM, Catapano CV. Multiple interactions between peroxisome proliferators-activated receptors and the ubiquitin-proteasome system and implicati]ons for cancer pathogenesis. PPAR Res. 2008;2008:195065.
- Muoio DM, Way JM, Tanner CJ, et al. Peroxisome proliferator-activated receptor-alpha regulates fatty acid utilization in primary human skeletal muscle cells. Diabetes. 2002;51:901–909.
- Paukkeri EL, Leppanen T, Sareila O, et al. PPARalpha agonists inhibit nitric oxide production by enhancing iNOS degradation in LPS-treated macrophages. Br J Pharmacol. 2007;152:1081–1091.
- Pardridge WM, Casanello-Ertl D, Duducgian-Vartavarian L. Branched chain amino acid oxidation in cultured rat skeletal muscle cells. Selective inhibition by clofibric acid. J Clin Invest. 1980;66:88–93.
- Acin-Perez R, Benador IY, Petcherski A, et al. A novel approach to measure mitochondrial respiration in frozen biological samples. EMBO J. 2020;39:e104073.