
ABSTRACT
We describe the utility of a tandem-tagged autophagy reporter mouse model (CAG-RFP-EGFP-MAP1LC3B) in investigating basal macroautophagic/autophagic flux in the neural retina. Western blot, in situ hybridization, immunohistochemistry, and confocal microscopy showed that CAG promoter-driven expression of RFP-EGFP-MAP1LC3B increased “cytosolic” RFP-EGFP-LC3B-I levels, whereas RFP-EGFP-LC3B-II decorates true phagosomes. We verified that the electroretinographic (ERG) responses of tandem-tagged LC3B mice were comparable to those of age-matched controls. Optimized microscope settings detected lipofuscin autofluorescence in retinas of abca4−/- mice. The majority of retinal phagosomes in the reporter mice exhibited only RFP (not EGFP) fluorescence, suggesting rapid maturation of phagosomes. Only ~1.5% of the total phagosome population was EGFP-labeled; RFP-labeled (mature) phagosomes colocalized with lysosomal markers LAMP2 and CTSD. In the outer retina, phagosome sizes were as follows (in µm2, ave ± SEM): RPE, 0.309 ± 0.015; photoreceptor inner segment-myoid, 0.544 ± 0.031; and outer nuclear layer, 0.429 ± 0.011. Detection of RPE phagosomes by fluorescence microscopy is challenging, due to the presence of melanin. Increased lipofuscin autofluorescence, such as observed in the abca4−/- mouse model of Stargardt disease, is a strong confounding factor when attempting to study autophagy in the RPE. In addition to RPE and photoreceptor cells, phagosomes were detected in inner retinal cell types, microglia, astrocytes, and endothelial cells. We conclude that the tandem-tagged LC3B mouse model serves as a useful system for studying autophagy in the retina. This utility, however, is dependent upon several technical and biological factors, including microscope settings, transgene expression, choice of fluorophores, and lipofuscin autofluorescence.
Abbreviations: ACTB: actin, beta; AIF1: allograft inflammatory factor 1; ATG: autophagy related; CTSD: cathepsin D; DAPI: (4’,6-diamido-2-phenylindole); DIC: differential interference contrast; EGFP: enhanced green fluorescent protein; ELM: external limiting membrane; ERG: electroretinography; GCL: ganglion cell layer; GLUL: glutamine-ammonia ligase (glutamine synthetase); INL: inner nuclear layer; IS-E/M: inner segment – ellipsoid/myoid; ISH: in situ hybridization; LAMP2: lysosomal-associated membrane protein 2; L.I.: laser Intensity; MAP1LC3B: microtubule-associated protein 1 light chain 3 beta; MTOR: mechanistic target of rapamycin kinase; O.C.T.: optimal cutting temperature; OS: outer segment; ONL: outer nuclear layer; PE: phosphatidylethanolamine; RFP: red fluorescent protein; R.O.I.: region of interest; RPE: retinal pigment epithelium
Introduction
Macroautophagy/autophagy is a catabolic process involving delivery of cellular and organelle-derived debris to lysosomes in the form of membrane-encapsulated cargo (phagosomes) for bulk degradation. It also is an important MTOR (mechanistic target of rapamycin kinase)-regulated starvation response mechanism that meets cellular nutritional requirements by coupling catabolic and anabolic pathways [Citation1,Citation2]. The autophagic machinery constitutes the degradative pathway in “professional” phagocytes (e.g., circulating macrophages, retinal pigment epithelial (RPE) cells, etc.) for either pathogen clearance or tissue homeostasis. Mutations in autophagy-related genes have been reported in rare human and canine genetic disorders involving neurodegenerative vacuolar storage pathology, and ataxia [Citation3–5]. Aberrant autophagy also has been reported in several age-related degenerative disorders affecting post-mitotic cells, such as neurons, cardiomyocytes, and various retinal cell types [Citation6,Citation7].
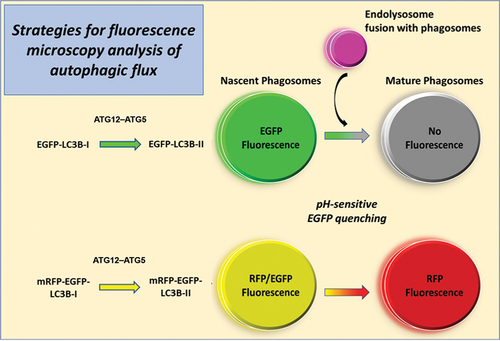
Phagosome genesis is initiated at endoplasmic reticulum (ER)-mitochondria contact sites and/or the ER-Golgi intermediate complex [Citation8–10]. The nascent phagophore undergoes membrane expansion upon adduction of MAP1LC3B/LC3B (microtubule-associated protein 1 light chain 3 beta)-I with phosphatidylethanolamine (PE) to form phagophore-membrane-bound LC3B-II (PE-conjugated LC3B-I) [Citation11]. The PE conjugation of LC3B-I is catalyzed by an E1/2/3-ubiquitin ligase-like enzyme system: ATG7, ATG10 and ATG12–ATG5 [Citation12]. Because LC3B-II strongly colocalizes to phagophore, phagosome and phagolysosome/autolysosome membranes, fluor-conjugated LC3B serves as a reliable marker to visualize phagosomes using fluorescence microscopy. Distinguishing immature phagosomes and autolysosomes by transmission electron microscopy is technically challenging, time-consuming, and subjective [Citation13,Citation14]. Two murine transgenic fluorescent reporter models are currently available to study autophagic flux in vivo: 1) MAP1LC3B with an N-terminal enhanced green fluorescent protein (EGFP) tag (or EGFP-LC3) [Citation15,Citation16], and 2) MAP1LC3B tandem-tagged with N-terminal red fluorescent protein mRFP-EGFP (or RFP-EGFP-LC3) [Citation17]. The transgene in both animal models is driven by the CAG (cytomegalovirus early enhancer, chicken ACTB [actin beta] promoter, rabbit beta globin splice acceptor) promoter. EGFP, due to its low pKa value, exhibits fluorescence quenching in acidic environments [Citation18] (such as in lysosomes or endosomes), which presents a limitation for monitoring acidified autolysosomes using the more conventional EGFP-LC3 probe strategy [Citation15,Citation16,Citation19]. On the other hand, RFP fluorescence is not acidic pH-sensitive, a fact that has been utilized to advantage with the tandem-tagged RFP-EGFP-LC3 strategy, wherein phagophores and nascent phagosomes exhibit both RFP and EGFP fluorescence, while mature phagosomes exhibit only acid-insensitive RFP fluorescence [Citation17,Citation20]. A simple, graphic demonstration differentiating the two strategies is provided in . In the current study, we elucidate. several technical factors that must be taken into consideration for reliable in vivo identification and quantification of steady-state levels of immature vs. mature phagosomes, and in drawing reliable conclusions from fluorescence microscopy observations.
Figure 1. A schematic representation of the reporter mouse models (single-tagged EGFP-LC3, and tandem-tagged mRFP-EGFP-LC3) currently available for in vivo monitoring of autophagy. The transgene is driven by a CAG promoter in both models. The transgenic LC3 undergoes ATG5-mediated lipidation (with PE), and subsequently phagosome membrane-bound. EGFP exhibits acid-sensitive fluorescence quenching. Hence, only immature phagosomes generate fluorescence signal in the EGFP-LC3 model, while acidified autolysosomes (mature phagosomes) exhibits no fluorescence. RFP fluorescence is acid-insensitive; therefore, immature phagosomes exhibit RFP and EGFP fluorescence, while mature phagosomes exhibit RFP fluorescence only.
Neural retina and RPE cells are post-mitotic; hence, autophagy-dependent organelle homeostasis is necessary for cell survival and tissue health [Citation21–23]. Electron microscopic detection of autophagosomes in retinal photoreceptors (rods and cones) of several vertebrate species (cats, rats, mice and ground squirrels) has revealed these degradative organelles in the myoid region of the photoreceptor inner segment, as well as in the perinuclear region [Citation24–27]. Genetic deletion of Atg (autophagy related) genes causes pathology in all cell types in the retina [Citation25,Citation26,Citation28–30]. Rod-specific homozygous deletion of Atg5 driven by the rod-specific Tg(Rho-icre)1Ck/iCre-75 promoter leads to rod dystrophy over a period of 44 postnatal (PN) weeks [Citation25,Citation31]. Animal models of various human retinal pathologies also exhibit active autophagy in the photoreceptor layer [Citation6]. Several lines of evidence suggest active autophagic flux in resident cell types in the inner nuclear layer (INL) [Citation32,Citation33]. Immunohistochemical analysis has demonstrated the expression in the INL of several proteins involved in autophagy, including ATG9, LC3B and BECN1 [Citation23,Citation31]. Furthermore, SQSTM1/p62 accumulates in the INL of aged human eyes [Citation34]. The requirement of autophagy for axonal regeneration and ganglion cell survival following axotomy has been proposed [Citation35]. Defective phagosome maturation in Tenon’s fibroblasts is a pathologic feature in patients afflicted with exfoliation glaucoma [Citation7,Citation36]. These independent observations suggest the requirement of autophagy in all retinal cell types. It is therefore desirable to have a reliable method of assessing autophagy in the neural retina, to facilitate studies on the role of autophagy in normal retinal physiology and pathology.
Studies aimed at demonstrating detection of phagosomes in the whole retina as well as in photoreceptors have utilized either fluorescence microscopy analysis of a CAG-GFP-LC3 transgenic model, or transmission electron microscopy (TEM) analysis. However, as alluded to above and as discussed in further detail below, the CAG-GFP-LC3 strategy poses several technical limitations, thereby limiting the detection of the total phagosome population at steady state (without the requirement of lysosomal alkalization). The present study demonstrates the utility of the tandem-tagged CAG-RFP-EGFP-LC3B transgenic mouse line for monitoring basal autophagy in the neural retina. Furthermore, we discuss technical and biological factors that need to be considered in designing experiments to investigate autophagy in the retina, especially in pigmented animals.
Results
Retinal expression of mRFP-EGFP-LC3B and functional consequences
Western blot analysis of retinas from CAG-mRFP-EGFP-LC3 vs. C57BL/6J control mice (n = 3 each, harvested 6 h after light onset), utilizing an anti-LC3 antibody (), suggested a significant (3-fold, p < 0.05) increase in the ratio of cytosolic/phagosome membrane-bound forms of transgenic LC3B in the reporter mouse line, compared to endogenous LC3B (). Furthermore, CAG-driven overexpression of LC3B did not lead to alteration in endogenous ATG12–ATG5 levels (). We speculate that the increased cytosolic RFP-EGFP-LC3B content may be due to limiting ATG12–ATG5 levels or activity.
Figure 2. Western blot and electroretinogram analysis of C57BL/6J and CAG-RFP-EGFP-LC3B mice. (A) Immunoblot analysis (probing with antibody against LC3) of retinal proteins from RFP-EGFP-LC3 mice and wild type control (C57BL/6J) mice, demonstrating expression of the transgenic RFP-EGFP-LC3 construct over the endogenous LC3 levels. The wild-type retina exhibits endogenous LC3 only. The expected molecular weights for RFP-EGFP-LC3-I and – II are 70 and 68 kDa, respectively. Also, note the lack of any cleaved transgenic product, such as EGFP-LC3 (expected molecular mass, ~ 41–43 kDa). (B) The ratio of the cytosolic transgenic product (LC3B-I) over the membrane-bound isoform (LC3B-II) is 3-fold higher as compared to the LC3B-I:LC3B-II ratio in the wild type mouse retina. The elevated RFP-EGFP-LC3B-I levels revealed in this assay agree with the observed cytoplasmic fluorescence (see above). (C-E) Scotopic and photopic ERG analysis of CAG-RFP-EGFP-LC3 transgenic mice, compared with age-matched C57BL/6J controls. Scotopic ERG a-wave and photopic ERG responses (C and E, respectively) of transgenic mice were comparable to those of control mice. Reporter transgenic mice exhibited slightly reduced scotopic b-wave amplitudes (D, blue asterisk, p < 0.05) at flash intensities <0.035 cd.s/m2, suggesting otherwise normal retinal physiology, but with possibly mild rod bipolar dysfunction.
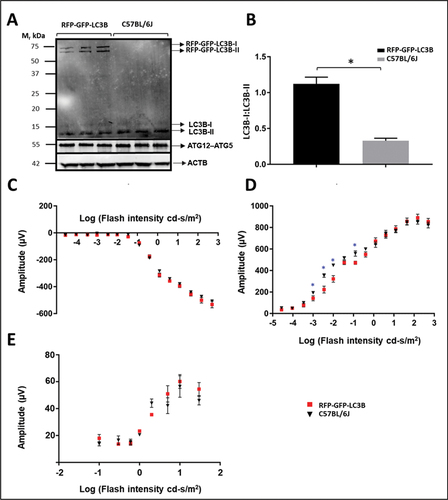
The tandem-tag autophagy reporter mice used in the study were on a C57BL/6J (rather than C57BL/6N) background, and thus obviated the presence of the Crb1rd8 mutation, which otherwise would compromise their suitability for this study, due to their hereditary retinal degeneration [Citation17,Citation37]. Since overexpression of genes can provoke cellular dysfunction and demise [Citation38], we examined the effects of CAG promoter-driven overexpression of the tandem-tag LC3B construct on retinal function. Rod and cone photoreceptor function was assessed using scotopic (dark-adapted) and photopic (light-adapted) electroretinography (ERG), respectively, in adult (two-month old), genotype-verified CAG-mRFP-EGFP-LC3B reporter mice in comparison to age-matched C57BL/6J control mice (n = 3/group). Scotopic a-wave ERG responses at all tested flash intensities in reporter mice were comparable to those of age-matched controls, indicating robust rod photoreceptor response to light (). The scotopic b-wave responses in CAG-RFP-EGFP-LC3 mice at low flash intensities (< 0.035 cd.s/m2) were slightly reduced (blue asterisk, , P < 0.05) compared to those of age-matched controls, suggesting only a mild dysfunction, possibly attributable to rod bipolar cells. However, photopic ERG responses in the CAG-RFP-EGFP-LC3 mice were comparable to those of controls (). Hence, the reporter mouse line used in this study appears to be suitable for investigating autophagy in the neural retina.
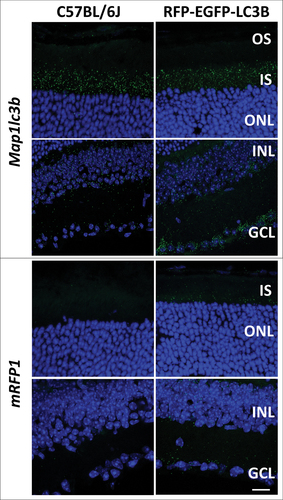
Transcript expression of CAG promoter-driven RFP-EGFP-LC3B transgene and autophagy-related genes in the murine retina was tested using in situ hybridization (ISH) against MAP1LC3B and RFP (n = 3/group). ISH against MAP1LC3B in C57BL/6J and the tandem-tagged reporter mouse line suggested robust expression in photoreceptor layer (especially the inner segment of photoreceptors), inner nuclear layer and ganglion cell layer (). Detection of phagosomes in the tandem-tagged reporter mouse line is directly dependent on expression of the transgene. We tested the expression of RFP-EGFP-LC3B transgene in the neural retina of the reporter mice through ISH analysis against mRFP (). The transgene mRNA expression was relatively sparse (in comparison to endogenous MAP1LC3B) in photoreceptor layer, and robust in the inner nuclear layer and ganglion cell layer (). C57BL/6J retinas served as a negative control for ISH against mRFP ().
Figure 3. In situ hybridization (ISH) against MAP1LC3B shows mRNA product in all layers of the neural retina, in both C57BL/6J (wild-type control) and CAG-RFP-EGFP-LC3B mouse lines. ISH analysis against mRFP-EGFP-LC3B transcript was tested using probes against RFP. RFP transcript expression was exclusive to the CAG-RFP-EGFP-LC3B mouse line (wild-type C57BL/6J mouse served as negative control). RFP expression in the photoreceptor layer was relatively sparse, as compared to endogenous MAP1LC3B. RFP expression in the INL and GCL was robust. All ISH analyses were performed on at least n = 3 independent samples. Scale bar: 10 µm.
Optimization of microscope settings to capture true EGFP fluorescence and lipofuscin autofluorescence
Published guidelines for studying autophagy suggest a requirement for use of high magnification fluorescence microscopy for reliable detection of phagosomes [Citation15,Citation16,Citation39]. In vivo detection of retinal phagosome population using in CAG-EGFP-LC3B mice appears to require starvation, leupeptin treatment, or pharmacological alkalinization of lysosomes leading to an increase in immature phagosomes at steady state by either increasing autophagic flux or decreasing lysosomal clearance, respectively [Citation19,Citation40]. These measures are necessary due to the technical limitations of the GFP-LC3 strategy (). Fig. S1 shows low magnification (40X objective, Zoom 1.5) confocal fluorescence microscopy images from a CAG-RFP-EGFP-LC3 mouse under normal, non-starvation conditions without treatment with lysosomal inhibitors. Phagosomes were readily detectable in the 568 nm channel (Laser intensity – 30%), while detection of immature phagosomes on the 488 nm channel using low magnification imaging was very challenging, at 3 different laser intensities. At high laser intensities (Fig. S1 B, C) in the 488-nm channel, the strong cytosolic signal arising from RFP-EGFP-LC3B-I obfuscates detection of immature phagosomes, due to strong cytosolic, microtubule-associated signal. This agrees with the observations in studies using CAG-GFP-LC3B transgenic mice [Citation26,Citation28,Citation40–48]. Low magnification images showed punctate RFP-positive structures in photoreceptor inner segment, as well as in the outer and inner retina (Fig. S1). In order to perform high throughput analysis of basal autophagy in the retina, we designed a high magnification microscopy regimen (40X objective, Zoom Factor 3X), taking into account laser intensity and tissue autofluorescence. Considerations in such experimental design and the findings are described below.
Several technical and biological factors play a critical role in detection of mature and immature phagosome populations using high magnification imaging. Key biological factors include expression of reporter transgene (See ), fluorophore properties (see Discussion), and age/disease-dependent lipofuscin accumulation [Citation49–56]. Technical factors include requisite pixel resolution (image magnification) for confident detection of phagosomes, and confocal microscopy settings (e.g., laser intensity, gain, offset). The image properties used in the study (captured using 40X oil objective, Zoom factor – 3X) are as follows: Image area (Field of View)- 91.54 µm2; Pixels- 1712 X 1712; 1.88 pixels/100 nm. These settings allow for detection of phagosomes with areas of >100 nm2 (~ 3.5 pixel2). In order to determine the microscopy settings required to detect true EGFP signal, we utilized ocular tissues from NRL-EGFP mice (n = 4 eyes, from 2 mice), expressing EGFP specifically in rod photoreceptors (a true positive control [Citation57],); PN 6-month old C57BL/6J mouse eyes (n = 3) served as negative controls. We first determined the laser power that was sufficient to detect EGFP in NRL-EGFP. We tested laser intensity and gain (5% and 15%, as a percentage of the laser power source, with a constant, arbitrary gain of 850 V) sufficient to detect EGFP in photoreceptors of NRL-EGFP mice, retinal sections from C57BL/6J mice served as negative control (Fig. S2A-C). Overexpression of soluble GFP in the photoreceptors shows strong colocalization in the inner segment (IS), but also exhibits diffusion to the outer segment (OS) [Citation57,Citation58]. Confocal microscopy analysis of NRL-EGFP mice using 15% laser intensity strong signal arising from the OS, IS, and ONL (Fig. S2A), compared to the weak signal arising from OS, while using 5% laser intensity (Fig. S2B). We determined that 15% laser intensity in the 488 nm channel was sufficient to detect bona fide EGFP expressed in the OS, IS and the ONL (Fig. S2A). However, the signal from the 488 nm channel in C57BL/6J retina, at the same laser intensity, was negligible (Fig. S2C).
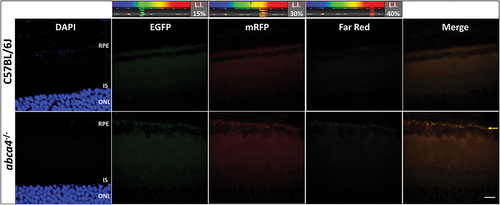
We empirically determined that laser intensity of 30% allows for confident detection of RFP-positive phagosomes (with minimal cytosolic signal) using high magnification imaging (See Discussion regarding relative brightness of fluorophores). Using these optimized laser settings, we then tested for tissue autofluorescence. Although several sources lead to tissue background autofluorescence (e.g., NADPH, formaldehyde, retinaldehyde, protein), a significant challenge in imaging phagosomes arises from punctate hyperfluorescence, as observed upon lipofuscin accumulation [Citation49,Citation56]. In order to image and account for lipofuscin-associated punctate hyperfluorescence, we utilized pigmented abca4−/- mice (a murine model of Stargardt disease), characterized by lipofuscin accumulation in the RPE, as a bona fide positive control [Citation59]. Age-matched C57BL/6J mice served as negative controls. We observed punctate, lipofuscin-associated hyperfluorescence in the RPE layer of abca4−/- mice [n = 4 eyes (2 mice), PN 6-mo] in 488-, 568-, and 647-nm channels (laser intensity – laser intensity of 15%, 30%, 40% respectively) (yellow arrow, ), unlike C57BL/6J controls. Punctate hyperfluorescence was not observed in other retinal layers (photoreceptors and inner retina) of abca4−/- or C57BL/6J mice. Because the RFP-EGFP-LC3B animal model was engineered on a C57BL/6J background [Citation17], we reasonably can assume that lipofuscin-induced background, punctate autofluorescence in PN 2- to 6-mo old CAG-RFP-EGFP-LC3B mice is negligible.
Figure 4. High magnification (40X objective; Zoom Factor, 3X) imaging of PN 6-month old C57BL/6J and abca4−/- mouse retinas shows lipofuscin-associated autofluorescent puncta in the RPE layer in the latter animal model. Control C57BL/6J mice do not exhibit tissue autofluorescence with the microscope laser settings employed here (488 nm channel, 15%; 568 nm, 30%; 647 nm, 40%; Arbitrary gain: 850.0 V). Scale bar (all panels): 10 µm.
High magnification imaging of total phagosome population in the outer retina
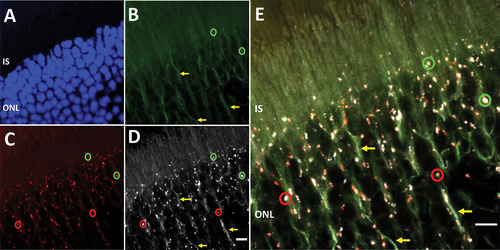
High magnification microscopy of retina (40X objective, Zoom Factor – 5.0) from PN 2- to 6-mo old CAG-RFP-EGFP-LC3B mice. We observed RFP-positive phagosomes (representative red circles, ) in photoreceptor IS and in the ONL; a few “naïve” autophagosomes also were EGFP-positive (representative green circles, ), representing immature phagosomes. Diffuse cytosolic EGFP fluorescence was observed in the ONL (yellow arrows, ). Immunohistochemical analysis of the CAG-RFP-EGFP-LC3 retina using a monospecific anti-RFP antibody (the amino terminus of the chimeric RFP-EGFP-LC3B protein) was carried out for independent verification that the cytosolic signal was indeed due to RFP-EGFP-LC3-I (). RFP immunohistochemistry afforded the ability to identify the phagosome population, i.e., the RFP-positive autolysosomes and RFP- and GFP-positive immature phagosomes (representative red and green circles, ), as well as the cytosolic, microtubule-associated RFP-EGFP-LC3B (representative yellow arrows, ). Therefore, under the optimized microscopy conditions employed, we first successfully detected phagosomes in the outer retina, although such manual detection of immature phagosomes is subjective. Immunohistochemistry against MAP1LC3B using commercially available antibodies did not exhibit phagosome-specific binding (data not shown) [Citation60].
Figure 5. Cytosol and phagosome colocalization of RFP-GFP-LC3 reporter chimeric protein. (A) DAPI labeling of the outer nuclear layer (ONL) to elucidate tissue orientation (ONL). (B) Cytosolic EGFP signal was observed in the IS, as well as in the perinuclear region (yellow arrows). Few EGFP-positive punctate structures were observed, which most likely were immature phagosomes (representative green circles). (C) Photoreceptors exhibited RFP-positive autolysosomes in the myoid region of the IS, as well as in the perinuclear region (representative red circles). (D) Immunohistochemistry against the amino-terminus of the chimeric protein (i.e., RFP) suggests excessive cytosolic LC3 levels (yellow arrows), which colocalized with EGFP fluorescence. Also anti-RFP signal was specific to phagosome population (red and green circles) (E) Merge image shows RFP-EGFP-LC3 reporter chimeric protein in cytosolic state, as well as phagosome-bound state. Magnification: 40X objective; Zoom Factor, 5X. Scale bar: 5 µm.
Images of the outer retina of the tandem-tag reporter mice were captured using the microscopy settings described in [40X objective, Zoom factor 3.0]. Only sections/images with good alignment (with the section plane nearly parallel to imaging plane) were selected, in order to identify and demarcate the external limiting membrane (ELM), and hence the inner segment region of photoreceptors (). Fluorescence image and DIC (differential interference contrast) was utilized to setup the regions of interest (RPE, IS, and the ONL). FIJI ImageJ® software [Analyze Particles algorithm] was utilized to identify RFP and GFP-positive punctate structures, in order to eliminate cytosolic signal. In order to analyze the total phagosome population in the outer retina, 8-bit images from the RFP channel were generated. Upon thresholding of 8-bit images, RFP-positive particles were filtered in RPE, Myoid, and ONL (using the FIJI ImageJ® Analyze Particles feature) based on critical properties of phagosomes, such as circularity (0.05–1.00) and size (0.1–2.00 µm2) (). Representative filtered RFP-positive particles in the regions of interest from a single field of view are shown in . Particle analysis was extended to abca4−/- and C57BL/6J retinal sections to filter for lipofuscin-associated hyperfluorescent puncta. The average size (in µm2, ± SEM) of RFP-positive phagosomes in the specific regions of interest were as follows: RPE (0.309 ± 0.015); IS-myoid (0.544 ± 0.031); ONL (0.429 ± 0.011) (). Phagosomes in the IS were found in the myoid region, apposed to the outer limiting membrane (). Phagosomes in the myoid region were significantly larger compared to those in the RPE or ONL. The average size of lipofuscin puncta in RPE of PN 6-moold
Figure 6. Analysis of fluorescent and autofluorescent puncta in the outer retina. (A) Representative high magnification confocal image (with differential interference contrast (DIC)), utilizing optimized microscope settings (with merged RFP and EGFP channel) shows phagosome population in the outer retina. Well aligned sections allow for easy manual detection of the external limiting membrane (ELM; yellow arrow). This allows for demarcation of the outer nuclear layer (ONL) and the inner segment (IS). RFP channel was converted to 8-bit image, followed by appropriate thresholding. Thresholded image was then utilized for separate detection of phagosome population (between 100 nm – 2 µm) in the three regions of interest. Scale bar: 10 µm. (B) High magnification imaging was performed on well-aligned sections from CAG-RFP-EGFP-LC3B, C57BL/6J, and abca4−/- mice to analyze phagosome or autofluorescent puncta size (see inset table for number of animals, number of images, and number of particles analyzed). Phagosome size (in µm2, average ± SEM) in the three regions of interest in the outer retina is as follows: RPE (0.309 ± 0.015), IS-Myoid (0.544 ± 0.031); ONL (0.429 ± 0.011). Phagosome population in myoid was significantly larger compared to RPE and ONL. Further, lipofuscin autofluorescent puncta size in the RPE of abca4−/- mice was found to be 0.372 ± 0.031 µm2. The distribution of particle sizes (phagosomes and lipofuscin particles) has been provided. *p < 0.05, Student’s t-test. (C) Particle size distribution in the three regions of interest in the outer retina of CAG-RFP-EGFP-LC3B and abca4−/- mice.
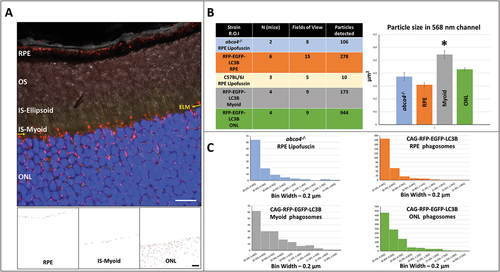
abca4−/- mice was estimated to be about 0.372 ± 0.032 µm2 (). Lipofuscin accumulation in age-matched C57BL/6J mice was negligible (). Size distribution of RFP-positive phagosomes in the three regions of interest, and that of lipofuscin particles in the RPE of abca4−/- mice have been provided (). To the best of our knowledge, this is the first example of high-throughput estimation of phagosome size in the outer retina, and significantly builds upon a previous study that utilized electron microscopy for qualitative assessment of autophagosome physiology in the neural retina [Citation24].
Analysis of basal autophagy in the outer retina
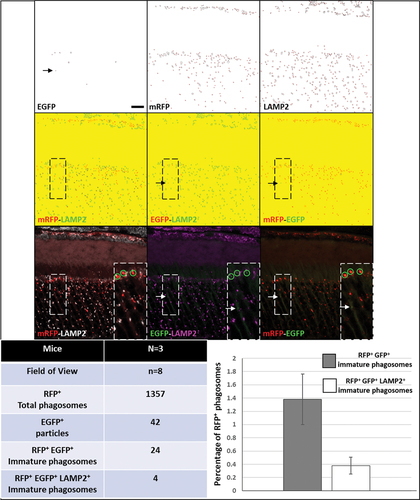
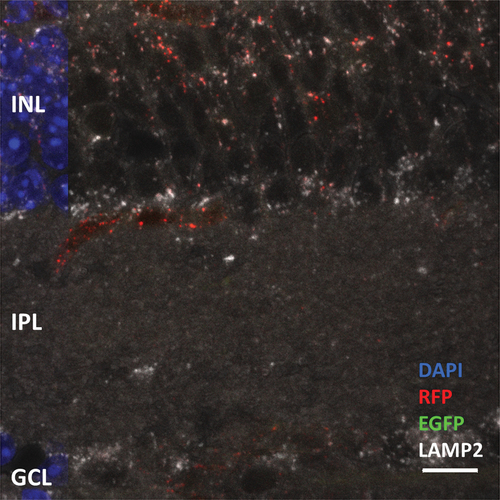
Immunohistochemistry against RFP detected RFP-positive mature phagosomes, as well as the RFP-positive, EGFP-positive immature phagosome population. We also established that the C57BL/6J background exhibits minimal autofluorescence in all three channels (488, 568, and 647 nm), thereby allowing confident detection of EGFP-positive and RFP-positive particles, as well as particles in the far- red channel. We performed immunohistochemistry against an established marker of lysosomes, LAMP2 (lysosome-associated membrane protein 2). We then extended ImageJ particle analysis to study basal autophagy, i.e., to detect RFP-positive, EGFP-positive immature phagosomes, as well as fusion of RFP-positive mature phagosomes with LAMP2-positive lysosomes. Notably, this was achieved without the use of animal starvation or chronic chloroquine treatment. We generated 8-bit images, and performed image thresholding for all three channels (EGFP 488-nm channel, RFP 568-nm channel, LAMP2 647-nm channel). Representative outlines of EGFP, mRFP, and LAMP2-positive particles are shown in . We merged the outlines to identify RFP- and LAMP2-positive mature autolysosomes, and RFP- and EGFP-positive immature phagosomes. Merging of RFP and EGFP also allowed identification of strong EGFP signal arising from the cytosol, but importantly, this is not specific to phagosomes (due to non-merger with RFP-positive phagosomes, black and white arrows, ). Merging the EGFP and LAMP2 images allowed for identification of true immature phagosomes, where EGFP-positive particles (which colocalize with RFP) do not colocalize with LAMP2 (). Screen for immature phagosomes (RFP-positive, EGFP-positive, but LAMP2-negative particles) was performed (N = 3 mice, 8 images/fields of view, n = 1357 RFP-positive phagosomes) [see white arrows and green circles, inset of ]. The vast majority of RFP-positive phagosomes colocalized with LAMP2. The steady-state level of immature phagosomes in the outer retina was estimated to be 1.39% ± 0.4% (average ± SEM) of the total phagosome population. We were also able to capture immature phagosomes in the process of lysosome fusion (RFP, EGFP, and LAMP2-positive particles; 4 of 1,357 phagosomes) []. Alternatively, immunohistochemistry using antibodies against Cathepsin-D (CTSD), another reliable marker of lysosomes, also demonstrated colocalization of phagosomes with lysosomes in photoreceptors. (Fig. S3).
Figure 7. Immunohistochemistry against lysosome marker LAMP2 was performed to verify formation of autolysosomes, as well as detection and quantification of immature phagosomes at steady state in CAG-RFP-EGFP-LC3B mice (n = 3, 8 images). We performed particle analysis in EGFP, RFP and far-red channels. The particle outlines were merged: RFP-LAMP2 particle merge shows mature phagosome and autolysosome population; EGFP-LAMP2 particle merge shows lack of colocalization of immature phagosomes and lysosomes; and RFP-EGFP particle merge shows mature and immature phagosomes, while allowing user to discount strong cytosolic EGFP signal which are not specific to RFP-positive phagosomes (black and white arrows). Such particle merge was comparable to channel merge obtained on the confocal microscope. Immature phagosomes were identified upon comparison of EGFP-LAMP2 merge, and RFP-EGFP merge (green circles). We detected a total of 1,357 RFP-positive phagosomes (in the outer retina) from 8 different images (n = 3 mice). While we filtered 42 EGFP-positive particles, only 24 particles were EGFP-positive (true immature phagosomes). Also, 4 particles were RFP-, EGFP- and LAMP2-positive out of the total population of RFP-positive phagosomes, capturing phagosomes in the process of maturation. Total immature phagosome content was estimated to be about 1.39% ± 0.4% of the overall phagosome population, using the microscope settings and particle analysis regimen. Therefore, at basal autophagic flux, the maturation of phagosomes in the outer retina must occur rapidly. Scale bar: 10 µm.
To further verify that the microscopy setting utilized in the study were sufficient to detect immature phagosomes, we isolated primary fibroblasts from CAG-mRFP-EGFP-LC3B mice, and subjected them to chloroquine treatment (75 µM, 1 h) in vitro. As expected, we observed substantial accumulation of EGFP- and RFP-positive immature phagosomes in chloroquine-treated primary fibroblasts, unlike for control fibroblasts incubated without chloroquine (Fig. S4).
Autophagosome detection in cone photoreceptors, Müller glia, microglia, endothelial cells, and the inner retina
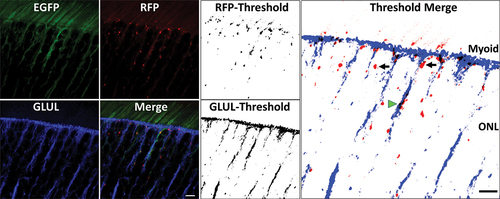
We observed active autophagy in cone photoreceptors by utilizing a lectin (peanut agglutinin, PNA) that specifically binds to glycan constituents of the cone matrix sheath (Fig. S5). Cone photoreceptor myoid regions contained phagosomes (Fig. S5). However, phagosomes were notably absent in the ellipsoid region of rod and cone photoreceptor inner segments. Phagosome populations in the outer retina, independent of PNA-labeling, may therefore arise from rod photoreceptors. We posit that another contributor to phagosome populations in the outer retina may be Mϋller glial processes and microvilli extending up to the external limiting membrane (ELM). To test this, we performed immunohistochemistry against glutamine synthetase (GLUL). Images were captured in the red, green and far-red channels (the latter pseudocolored blue). 8-bit images from red and far-red channels were thresholded, and merged to identify phagosomes co-localizing to Mϋller glia processes. Several phagosomes lined up along the ELM (, see also ). Also, many phagosomes were observed in the myoid region of photoreceptor inner segments, and the ONL (black arrows, ). By comparison, only a few phagosomes also co-localized with GLUL-positive, Mϋller glial processes (green arrowhead, ), suggesting that only a small percentage of phagosomes in the outer retina may arise from Mϋller glial cells. While our analysis suggests occurrence of phagosomes in the Müller glia, and its apical microvilli, in-depth investigation of autophagy in Müller glial cells may be better achieved using primary Müller glial cell cultures.
Figure 8. High magnification confocal microscopy image (40X objective, Zoom Factor 5X) of photoreceptor IS and cell body alongside immunohistochemistry against glutamine synthetase (GLUL), a marker of Müller glial cells. Thresholded images of red and far-red channels (corresponding to RFP and GLUL, respectively), and subsequent merger using ImageJ® software, demonstrated that several phagosomes were lined up in the IS-myoid along the external limiting membrane (ELM), and also were present in photoreceptor cell bodies (black arrows). Some phagosomes also colocalized in GLUL-positive Müller glial cells exclusive of GLUL-positive cellular processes (green arrowhead). Scale bar: 5 µm.
RFP-positive mature phagosomes were detected in all constituent cell types in the INL (). However, unlike the photoreceptor layer, the cytosolic GFP signal and immature phagosome content was minimal in INL-resident cell types (). Such mature phagosomes strongly colocalized with the lysosomal marker LAMP2 (). The ganglion cell layer consists of ganglion cells, astrocytes, endothelial cells (blood vessels near the vitreoretinal interface), and Mϋller glia endfeet. Autophagic activity was mostly confined to GFAP-positive astrocytes and/or Mϋller glia endfeet (white arrows, Fig. S6A), as well as to endothelial cells. Also, note the lack of phagosomes in ganglion cells (, and Figs. S1,S6A), suggesting a low level of autophagy in such cells in the healthy retina. The pattern of GFAP labeling – with immunoreactivity mostly localized to the vitreoretinal interface (internal limiting membrane, ILM) and lacking a radial, fibrillar pattern – is indicative of a lack of gliosis [Citation61] (Fig. S6A), yet another signature of a normal, healthy retina (cf. ). Probing tissue sections with antibodies to AIF1 (allograft inflammatory factor 1) [Citation62,Citation63] revealed the presence of phagosomes in quiescent microglial cells (white arrows, Fig. S6B). Notably, AIF1-positive cells were restricted to the innermost retinal layers; by contrast, activated microglia, if any, were rarely observed in the CAG-RFP-EGFP-LC3 retina, further suggesting the normal, healthy status of the retina.
Figure 9. Representative high magnification image of the inner retina shows phagosome occurrence in the inner retinal cell types. Cytosolic EGFP signal was diminished in the inner retina, with far fewer immature phagosomes. Immunohistochemistry against LAMP2 shows that the majority of the phagosomes were mature autolysosomes. Scale bar: 10 µm.
The endothelial cells of inner retinal blood vessels exhibited an intense cytosolic EGFP signal as well as RFP-positive phagosomes (Fig. S7A), and appeared to have a constitutively inactive MTOR pathway, observed as lack of phosphorylated (p)-RPS6/S6 (ribosomal protein S6) signal (see contrast within demarcated area, Fig. S7B). A representative endothelial cell in the inner retina also appeared to be actively engaged in autophagy, as it exhibited RFP-positive mature phagosomes ().
Discussion
Transgenic fluorescence reporter strategies have been instrumental in investigating various cellular processes and determining the subcellular localization of target gene products [Citation64]. Novel fluorescence assays for analyzing phagosome maturation rely on the detection of the total phagosome population using acid-insensitive RFP, and immature phagosomes using an acid-sensitive EGFP component [Citation65,Citation66]. The advantage of the tandem-tagged RFP-GFP-LC3B approach and the technical limitations of the single-tagged EGFP-LC3B model have been described above (see also [Citation20]). Below, we discuss other critical factors that contribute to the challenges in monitoring autophagy in the neural retina, in particular, and highlight the technical considerations that must be considered in order to achieve reliable monitoring of autophagy.
Factors to be considered for reliable monitoring of retinal autophagy using CAG-RFP-EGFP-LC3B mice
Broad-range lipofuscin autofluorescence (450–700 nm), as is often observed in the RPE, contributes to elevated background fluorescence (noise) [Citation49–56]. The ability to reliably detect lipofuscin autofluorescence by confocal microscopy depends on the laser intensity and the capture window (emission bandpass). Given that the goal of the present study was to perform high-throughput analysis of the phagosome population in CAG-RGP-EGFP-LC3 mice, we optimized the emission bandpass for EGFP, RFP, and far-red (Alexa Fluor® 647) channels based on their respective emission spectra. We also optimized the laser intensity to best capture EGFP, RFP, and Alexa Fluor® 647 signals, and then accounted for lipofuscin autofluorescence captured using those microscope settings. The emission spectra of RFP and Alexa Fluor® 647 are broader than that of EGFP, therefore the capture window utilized for the 488-nm channel was narrower compared to that used for RFP and Alexa Fluor® 647 (). Further, we included an EGFP-expressing retina specimen as a true positive control to optimize the laser intensity required to detect fluorescence in the 488 nm channel [Citation57] (Fig. S2). We caution that the failure to include a true positive control when pursuing studies using autophagy reporter mice does not allow for accurate determination of minimally sufficient laser intensity to detect true EGFP signal. To make this point, we have presented findings that illustrate the consequences of low magnification imaging using varying laser intensities in the 488 nm channel (Fig. S1). The above microscope settings were optimized for images captured using a 40X objective, with a Zoom Factor of 3.0. Importantly, we found that employing higher magnification (63X objective, or higher Zoom Factor) using the same laser intensity leads to photobleaching. Using a 40X objective (Zoom Factor, 3.0), the field of view for each image was 91.5 µm2, with 1712 × 1712 pixels. This allows for confident detection of particles of sizes >100 nm2. The phagosome size and circularity can be leveraged for filtering and particle analysis, as demonstrated in this study (). Using these microscope settings and particle analysis workflow, we were able to detect phagosomes in CAG-RFP-EGFP-LC3B mice, and also lipofuscin hyperfluorescence in abca4−/- mice (a true positive control). C57BL/6J mice served as negative controls, as they have negligible lipofuscin accumulation in the RPE (). However, we caution that investigation of autophagy using the workflow optimized as we’ve shown in this study, will not allow for confident detection of phagosomes in the RPE of abca4−/- mice, given that the particle size of lipofuscin is comparable to that of RFP-positive phagosomes in the RPE ( and ). In addition, we found that reliable identification of phagosomes in the RPE is challenging, due to the presence of melanin granules in pigmented mice, which can obscure the fluorescence signal. Another significant factor that affects the facility of phagosome detection in the RPE is the level of CAG promoter-driven transgene expression. Commonly employed depigmentation strategies, such as treatment of tissue sections with 10% H2O2 or KMnO4, quench GFP and RFP fluorescence; hence, they are not useful for this application [Citation67].
Western blot analysis of RFP-EGFP-LC3B retinal proteins using anti-LC3B antibody showed four predominant bands, corresponding to RFP-EGFP-LC3B-II/I (70/68 kDa) and LC3B-II/I (16/14 kDa), and demonstrated a lack of RFP-EGFP-LC3B degradation products (). Furthermore, over-expression of the RFP-EGFP-LC3B construct lead to increased cytosolic RFP-EGFP-LC3B-I (,5,Citation8, and Fig. S1). Immunohistochemical analysis using an antibody against RFP demonstrated signal that colocalized with phagosomes and cytosolic LC3 (). Surprisingly, sparse transcript expression of RFP-EGFP-LC3B transgene in photoreceptors (compared to that of LC3B) was sufficient to lead to a significant increase in cytosolic, transgenic product (). However, the relatively intense cytosolic fluorescence of EGFP (but not of RFP) occurs because of the significantly lower molar extinction coefficient, quantum yield, and relative intensity of RFP as compared to EGFP (see https://www.microscopyu.com/techniques/fluorescence/introduction-to-fluorescent-proteins). Properties of fluorescent proteins should be kept in mind when choosing a fluorophore in the design of tandem-tagged reporter mice, as they may affect the strength of the cytosolic LC3B signal in the green and red channels and make phagosome detection challenging when monitoring the EGFP channel. Another interesting observation made in this study was that the EGFP signal associated with immature phagosomes appeared in the “core” of RFP-positive particles, which had not fused with lysosomes (,7). We could not measure the size of immature phagosomes because the particles filtered in the EGFP channel were significantly smaller than the associated RFP-positive particles.
The morphological appearance of fluorescence in the GFP channel of RFP-EGFP-LC3 retinas, upon high magnification imaging, was comparable to that observed at steady-state in EGFP-LC3 retinas in other published studies, i.e., the neural retina normally exhibits very few immature phagosomes at steady-state [Citation28,Citation68,Citation69] (,4). In the present study, we did not include chloroquine-induced alkalinization of lysosomes (commonly employed to cause autophagocytosis), because of two challenges. First, chronic intraperitoneal injection of chloroquine (particularly at the dosages that would be required to alter the autophagy process as desired) can lead to significant animal distress and also progressive retinal degeneration (e.g., chloroquine-induced maculopathy). The time-dose regimen for chloroquine administration varies significantly [Citation70,Citation71], and such optimization is beyond the scope of this study. Furthermore, chloroquine treatment also induces increased fundus autofluorescence, further confounding accurate detection of the phagosome population [Citation72–75].
The cytosolic EGFP signal observed in this study (and by others), using low magnification microscopy [Citation28,Citation40,Citation41,Citation45], was due to overexpression of the transgenic LC3B construct, and also possibly due to the high laser intensity employed (Fig. S1). The cytosolic form of the transgenic construct (,5), as observed in this study and in several previous studies employing the EGFP-LC3B approach, is artifactual and has no bearing on actual autophagic flux. Importantly, the intensity of the cytosolic EGFP signal is strictly a function of CAG promoter-driven over-expression and the microscope settings utilized, and is not dependent on mTOR signaling-mediated regulation of autophagy. Also, the levels of GFP-LC3B-I or RFP-GFP-LC3B-I expression clearly are not indicators of autophagic flux.
Imaging of CAG-RFP-GFP-LC3B retina
Capturing images at high magnification while utilizing a small z-stack (<1 µm) increases photobleaching of phagosomes in subsequent z-stacks. A z-stack thickness of 1 µm works optimally to image cryosections of 5–10 µm in thickness. We recommend scanning for the area of interest only in the RFP channel, and then acquire images using the DAPI, GFP, and RFP channels. This unbiased, “masked” approach to capturing images in the GFP channel (with the recommended microscope settings, and testing a true positive control tissue for EGFP; see Fig. S2) helps to eliminate observer bias while attempting to detect immature phagosomes. We utilized a gain value (voltage value) setting at 850.00 V; while higher gain values help to improve the signal:noise ratio in samples with low background fluorescence (endogenous and formaldehyde-induced), they are undesirable when imaging specimens with high background fluorescence and/or high cytosolic EGFP content (causing low dynamic range and decreased signal:noise ratio). Diminished contrast between the cytosolic EGFP fluorescence and autophagosomes may act as a limiting factor in the detection of immature phagosomes, especially in animals with high cytosolic RFP-EGFP-LC3B-I content. These considerations allowed successful differentiation between artifactual autofluorescent material vs. true immature and mature phagosomes ().
Limitations of the study
The high throughput analysis utilized in the study is based on a 2-D particle analysis regimen. At the magnification utilized (40X objective; Zoom factor, 3X), it is challenging to distinguish individual phagosomes that are in close spatial proximity to one another. This can lead to a slight overestimation of autophagosome size. However, this disadvantage does not obviate an important comparison made in the study: that phagosomes in the myoid region of photoreceptors are larger than those found in the ONL.
Summary of key observations in the retina of the RFP-EGFP-LC3 model
In the current study, imaging all retinal cell layers in CAG-RFP-EGFP-LC3 reporter mice with the empirically determined confocal fluorescence microscopy settings (using appropriate controls wherever possible), in conjunction with immunohistochemical analysis using validated retinal cell type-specific markers, rigorously characterized antibodies, and correlative western blot analysis, revealed the following observations:
a) Strong cytosolic EGFP signal arises from significantly elevated levels of cytosolic RFP-GFP-LC3B1 (observed as anti-RFP-positive, EGFP cytoplasmic signal, and by western blot analysis) (,5)
b) Protein-level demonstration of over-expression of RFP-EGFP-LC3 (over the endogenous LC3 level), compared to LC3 levels from control retinas ();
c) High-throughput particle analysis exhibited a low percentage of immature phagosomes (1.4% ± 0.4%) in the outer retina at steady-state (i.e., fewer RFP-GFP-positive phagosomes, compared to RFP-positive, alone, autolysosomes), arising from cone and rod photoreceptors and Mϋller glia (). Mature phagosomes observed in the retina co-localized with LAMP2 and Cathepsin-D, faithful markers of lysosomes;
e) Phagosomes were not observed in the ellipsoid region of photoreceptor inner segments. Phagosomes were found in the inner segment myoid region, juxtaposed to the ELM (, and Figs. S1,S5). Phagosomes in the myoid region were significantly larger than phagosomes observed in the RPE or in the ONL of the neural retina ()
f) Phagosome content was very low in ganglion cells (, and Figs. S1,S6,S7), unlike the case for endothelial cells, astrocytes and microglial cells, in which autophagy appeared to be constitutively active.
The tandem-tagged EGFP-LC3 strategy requires an in vivo experimental approach that includes animal starvation and/or chloroquine or bafilomycin A1-mediated lysosomal alkalization as a control to assess autophagic flux. However, use of the RFP-EGFP-LC3B strategy obviates the need to resort to these extreme (far from normal physiological) measures: phagosome maturation at steady-state can be detected directly, as demonstrated in this study. Thus, the tandem-tagged RFP-EGFP-LC3 model serves as a substantially better reporter model to monitor autophagy in the neural retina (and likely in other tissues as well) than the conventional EGFP-LC3 model.
Materials and methods
Unless otherwise specified, common laboratory chemicals, reagents, enzymes, and routine reagents were used as purchased from Sigma-Aldrich (St. Louis, MO). All reagents and materials utilized for SDS-PAGE and western blot analyses were obtained from Bio-Rad Laboratories (Hercules, CA). Plasticware (Falcon™), and all other general lab supplies were obtained from ThermoFisher Scientific, unless otherwise indicated.
Animals and eye tissues
Mice used throughout this study were on a C57BL/6J background. Wild-type mice were obtained from The Jackson Laboratories (Stock 000664). The use of mice complied with the ARVO Statement for the Use of Animals in Ophthalmic and Vision Research, and all procedures were reviewed and approved by the Institutional Animal Care and Use Committee of the VA Western NY Healthcare System (VAWNYHS). A validated, established CAG-RFP-EGFP-LC3 transgenic mouse line is currently available through JAX laboratories (C57BL/6-Tg[CAG-RFP/GFP/Map1lc3b]1Hill/J). However, the CAG-RFP-EGFP-LC3 mouse line used in this study was a kind gift from Dr. Joseph Hill (Department of Cardiology, University of Texas Southwestern Medical School, Dallas, TX). CAG-RFP-GFP-LC3 mice were maintained under the standard 12 h:12 h cyclic light-dark regimen (standard white fluorescent lighting; 20–40 lux ambient light intensity). Transgenic mice were selected by PCR tail snip analysis using the following primer sets: FWD: 5ʹ – CATGGACGAGCTGTACAAGT – 3ʹ, and REV: 5ʹ – CACCGTGATCAGGTACAAGGA – 3ʹ, which yields a 208-bp product [Citation17]. Two- to Four-month old transgenic mice were sacrificed for analysis of autophagic flux. NRL-EGFP and abca4−/- mouse eyes were kind gifts of Dr. Anand Swaroop (National Eye Institute/NIH, USA), and Dr. Muna I. Naash (University of Houston, USA).
Electroretinography (ERG)
Scotopic ERGs were recorded from C57BL/6J and CAG-RFP-EGFP-LC3 reporter mice after overnight dark adaptation, as described in detail elsewhere [Citation76]. Briefly, animals were anesthetized by intraperitoneal injection of ketamine hydrochloride and xylazine hydrochloride, followed by pupil dilation with Atropine. ERGs were recorded from both eyes using a silver DTL thread electrode (Ocuscience, 1.5 inches) contacting the corneal surface using conductive Gonak (Akorn, NDC 17478–064-12). A 16 step flash stimuli (10−3 to 500 cd-sec/m2) were applied using Espion electrophysiology system bowl (LKC Technologies, MD, USA). Bite bar electrodes and platinum electrode under the skin served as reference and ground leads, respectively. Upon rod desensitization, photopic ERG was performed with green light (520 nm) flicker illumination at 30 Hz, using an 8-step custom protocol with increasing flash intensity (10−1 to 30 cd-sec/m2).
SDS-PAGE, western blot and densitometric analyses
Retinal tissue harvested from C57BL/6J and reporter mice were lysed with RIPA lysis and extraction buffer (ThermoFisher Scientific, 89900) supplemented with protease inhibitor cocktail (ThermoFisher Scientific, 78441) at 1:100 dilution. Protein yield was estimated using a Pierce™ BCA Protein Assay Kit (ThermoFisher Scientific, 23225). Western blot analysis was performed as described elsewhere [Citation76,Citation77] using the following primary antibodies: rabbit anti-MAP1LC3B (Cell Signaling Technology, 2775; 1:1000); rabbit anti-ATG5 (Cell Signaling Technology, 2630; 1:1000); and rabbit anti-ACTB (Cell Signaling Technology, 4967; 1:1000). membranes were then incubated with appropriate host-specific alkaline phosphatase-tagged secondary antibodies (1:10,000 dilution for 1 h at room temperature; Sigma Aldrich, A9919). Detection of antibody binding was achieved using chemifluorescent enzyme substrate (GE Healthcare Life Sciences, 45000947) and a ChemiDoc™ MP Imaging System (Bio-Rad Laboratories). Semi-quantitative densitometric analysis was performed using ImageLab® 5.0 software (Bio-Rad Laboratories), with band intensities of target antigens normalized to ACTB levels.
Tissue harvesting, fixation, and cryosectioning
CAG-RFP-GFP-LC3 mice (PN 2–6 months old) and control (wild type) C57BL/6J mice were euthanized by carbon dioxide inhalation 6 h after light onset, per the local IACUC guidelines and approved protocols. Eyes were enucleated, and immersion fixed in ice-cold 4% formaldehyde (Fisher Scientific, 50980487) in PBS (137 mM NaCl, 2.5 mM KCl, 10 mM Na2HPO4, 1.8 mM KH2PO4, pH 7.4) overnight. Freshly harvested NRL-EGFP and abca4−/- mouse eyes (see above) were immersion fixed in 4% PFA, and shipped overnight to our laboratory for immediate processing. Eyes were rinsed in ice-cold PBS three times, and incubated in 30% (w:v) sucrose (Fisher Scientific, 57501) in PBS at 4°C until equilibrated, then equilibrated overnight at 4°C in a 2:1 (v:v) mixture of O.C.T. (Optimal Cutting Temperature) Compound (Tissue-Tek®, Electron Microscopy Sciences, 62550) and 30% sucrose in PBS. Eyes were then aligned and embedded in O.C.T. Compound in tissue molds, and tissue cryosections (10-µm thickness) were collected onto Plus Gold Seal™ UltraFrost™ microscope slides (ThermoFisher Scientific, 3063–002), using a cryostat (CM3050S, Leica Microsystems, Buffalo Grove, IL). Sections were then subjected to immunohistochemistry and confocal imaging as described below.
In situ hybridization
RNAScope® in situ hybridization (ISH) against MAP1LC3B, RFP, and ATG5 was performed on cryosections in a HybEZ™ oven (321711) at 40°C, as per manufacturer instructions. Briefly, sections were treated with RNAScope® Protease III (322337) for 20–30 min. Sections were then incubated for 2 h with probes RNAScope® against mRFP (471,271), murine MAP1LC3B (477991), and murine ATG5 (469711). Sections were then sequentially treated with Amp1 – Amp4A (320850). Sections were counterstained with DAPI, and subjected to high magnification confocal microscopy imaging.
Primary fibroblast culture and chloroquine treatment
Primary fibroblasts from CAG-RFP-EGFP-LC3B mice were isolated as described elsewhere [Citation78]. Briefly, fresh tail snips were chopped using surgical blades to a putty-like consistency, and then subjected to enzymatic digestion in DMEM:F12 media (ThermoFisher Scientific, 11965118, 11765054) containing 0.14 Wunsch unit of Liberase TL Research Grade enzyme (Roche, 05401020001), and 1X penicillin-streptomycin. Digestion was performed in a rotator at 37°C for 45 min. The tissue was spun down, resuspended and plated in DMEM: F12 culture media supplemented with 10% FBS and 1X penicillin-streptomycin. Primary fibroblasts appeared in 5–7 days, and passaged to 12 well plates (with coverslips). Primary fibroblasts were treated with culture medium supplemented with chloroquine (75 µM; Sigma Aldrich, C6628) for 1 h. Untreated primary fibroblasts served as controls. Coverslips were fixed in ice-chilled 4% PFA for 15 min, and subjected to confocal fluorescence microscopy as described below.
Immunohistochemistry and confocal microscopy
Retinal cryosections were blocked with nonimmune (normal) donkey (Sigma-Aldrich, D9663) or goat (Sigma-Aldrich, G9023) serum (5% [v:v] in Tris-buffered saline [TBS; 150 mM NaCl, 50 mM Tris-Cl, pH 7.5], supplemented with 0.1% [v:v] Tween-20 [Fisher Scientific, AAJ20605AP; TBST], 0.1% [w:v] BSA [Sigma Aldrich, A3059], and 0.2% [w:v] fish skin gelatin [Sigma-Aldrich, G7061]). Cryosections were then briefly rinsed with TBST, and exposed (overnight at 4°C in a humidified chamber) to primary antibodies (diluted in TBST supplemented with 0.1% [w:v] BSA): mouse anti-GFAP (Dako Agilent, Z0334); rabbit anti-CTSD (Calbiochem, M16; 1:100); rabbit anti-RFP (Abcam, ab62341); rat anti-LAMP2 (Abcam, Clone GL2A7, ab13524); anti-AIF1 (Abcam, 178846), anti-p-RPS6/S6 (Cell Signaling Technology, 2211S), anti-GLUL/glutamine synthetase (BD Biosciences, 610517), AF647-conjugated peanut agglutinin (PNA; ThermoFisher, L32460). Tissue sections were incubated for 45 min at room temperature with secondary IgG from suitable host species, conjugated with Alexa Fluor® 647 (1:1000 in antibody diluent TBST; Invitrogen, A31571, A21247, A32795). Slides were rinsed with TBS, counterstained with DAPI (4ʹ,6-diamido-2-phenylindole), coverslip mounted using Vectashield® mounting medium (Vector Laboratories, H-1000), and subjected to confocal microscopy as described below with a Leica TCS SPEII DMI4000 scanning laser confocal fluorescence microscope (Leica Microsystems, Buffalo Grove, IL) equipped with 4 diode-pumped, solid-state laser lines (405 nm, 488 nm, 568 nm, 647 nm), and a rotating stage which allows for proper alignment of the retina. Images were captured using a 40X oil immersion (RI-1.518) objective (Zoom factor of 1.5X for low magnification imaging, and 3.0X for high magnification imaging). The arbitrary gain was set to 850 V, and offset of −0.5 to optimize the signal-to-noise ratio. Z-stack size was set to 1 µm. Laser intensity of GFP (488 nm), RFP (568 nm), and far red (647 nm) channel was set at 15%, 30%, and 40% respectively [These percentiles are of maximum laser power output: 2.8, 2, and 1.6 mW, respectively]. The laser intensity required to image phagosomes has to be custom-optimized on every microscope utilizing true positive controls for EGFP and autofluorescence. Images were collected with a 40X, 1.15 NA oil immersion objective at 400 Hz, 1712 × 1712 pixels, 91.54 µm2 field-of-view, pinhole 1 AU with pixel average of 2. The pixel dwell period was 721 ns, and pixel-aspect ratio was 1.0.
Particle analysis using FIJI imagej®
Individual and merged channel images (maximum projection) were stored as .tiff files without data compression. Particle analysis was carried out utilizing FIJI ImageJ® software. Green, red, and far-red channel 8-bit images were carefully threshold modified to retain all critical punctate details while minimizing background. Satisfactorily threshold-modified images were subjected to particle analysis (Analyze particles function) utilizing the following filtering criteria: particles size: 0.1–2.0 µm2, circularity: 0.05–1.00. At a resolution of 1712 × 1712 pixels and 91.54 µm2 field of view, we were able to confidently detect structures >100 nm (ave. diameter). While the user-defined thresholding step to minimize background may involve subjectivity, the final particle analysis step is objective. Outlines from all channels were saved as their respective .tiff files. Where applicable, similar analysis was conducted in the region of interest (such as myoid, RPE, and ONL) using fluorescence and DIC images. Result summary (from every channel of every image) from “Analyze particles” function were stored as .xls files to calculate the size of phagosomes. The outline drawings in RFP, GFP and far-red channels were then merged to generate a composite image, which allowed for easy monitoring of phagosome-lysosome fusion, and manual counting of immature phagosomes.
Statistical analysis
Quantitative data were subjected to statistical analysis using one-way ANOVA and Student’s t-test; a p-value of 0.05 was set as the threshold for statistical significance, using GraphPad® software.
Supplemental Material
Download Zip (20.6 MB)Acknowledgments
We sincerely thank Dr. Joseph Hill (Dept. of Cardiology, University of Texas Southwestern Medical Center) for the kind gift of CAG-RFP-EGFP-LC3 mice (Imported under MTA). We thank Dr. Bruce Pfeffer for suggestions regarding tissue sectioning and confocal microscopy, and Dr. Lara A. Skelton for important suggestions regarding ImageJ® analysis. We thank Rebecca Benz, Kristie Kilby, and Cheryl Dann for assistance with animal colony maintenance and care. We thank Drs. Anand Swaroop and Muna I. Naash for kind gift of NRL-EGFP and abca4−/- mouse eyes. The opinions expressed herein do not reflect those of the Department of Veteran Affairs or the U.S. Government.
Disclosure statement
No potential conflict of interest was reported by the author(s).
Supplementary material
Supplemental data for this article can be accessed here
Additional information
Funding
Related Research Data
References
- Kuma A, Hatano M, Matsui M, et al. The role of autophagy during the early neonatal starvation period. Nature. 2004 Dec 23;432(7020):1032–1036.
- Jung CH, Ro SH, Cao J, et al. mTOR regulation of autophagy. FEBS Lett. 2010 Apr 2;584(7):1287–1295.
- Syrja P, Anwar T, Jokinen T, et al. Basal autophagy is altered in lagotto romagnolo dogs with an ATG4D mutation. Vet Pathol. 2017 Nov;54(6):953–963.
- Kyostila K, Syrja P, Jagannathan V, et al. A missense change in the ATG4D gene links aberrant autophagy to a neurodegenerative vacuolar storage disease. PLoS Genet. 2015 Apr;11(4):e1005169.
- Kim M, Sandford E, Gatica D, et al. Mutation in ATG5 reduces autophagy and leads to ataxia with developmental delay. Elife. 2016;5:e12245. doi:https://doi.org/10.7554/ELIFE.12245
- Frost LS, Mitchell CH, Boesze-Battaglia K. Autophagy in the eye: implications for ocular cell health. Exp Eye Res. 2014 Jul;124:56–66.
- Bernstein AM, Ritch R, Wolosin JM. Exfoliation Syndrome: a Disease of Autophagy and LOXL1 Proteopathy. J Glaucoma. 2018 Jul;27(Suppl 1):S44–S53.
- Karanasios E, Walker SA, Okkenhaug H, et al. Autophagy initiation by ULK complex assembly on ER tubulovesicular regions marked by ATG9 vesicles. Nat Commun. 2016 Aug 11;7(1):12420.
- Nishimura T, Mizushima N. The ULK complex initiates autophagosome formation at phosphatidylinositol synthase-enriched ER subdomains. Autophagy. 2017 Oct 3;13(10):1795–1796.
- Nishimura T, Tamura N, Kono N, et al. Autophagosome formation is initiated at phosphatidylinositol synthase-enriched ER subdomains. EMBO J. 2017 Jun 14;36(12):1719–1735.
- Thukral L, Sengupta D, Ramkumar A, et al. The molecular mechanism underlying recruitment and insertion of lipid-anchored LC3 protein into membranes. Biophys J. 2015 Nov 17;109(10):2067–2078.
- Ge L, Melville D, Zhang M, et al. The ER-Golgi intermediate compartment is a key membrane source for the LC3 lipidation step of autophagosome biogenesis. Elife. 2013 Aug 6;2:e00947.
- Mizushima N. Methods for monitoring autophagy. Int J Biochem Cell Biol. 2004 Dec;36(12):2491–2502.
- Eskelinen EL. To be or not to be? Examples of incorrect identification of autophagic compartments in conventional transmission electron microscopy of mammalian cells. Autophagy. 2008 Feb;4(2):257–260.
- Mizushima N, Kuma A. Autophagosomes in GFP-LC3 transgenic mice. Methods Mol Biol. 2008;445:119–124.
- Mizushima N. Methods for monitoring autophagy using GFP-LC3 transgenic mice. Methods Enzymol. 2009;452:13–23.
- Li L, Wang ZV, Hill JA, et al. New autophagy reporter mice reveal dynamics of proximal tubular autophagy. J Am Soc Nephrol. 2014 Feb;25(2):305–315.
- Kneen M, Farinas J, Li Y, et al. Green fluorescent protein as a noninvasive intracellular pH indicator. Biophys J. 1998 Mar;74(3):1591–1599.
- Mizushima N, Murphy LO. Autophagy assays for biological discovery and therapeutic development. Trends Biochem Sci. 2020 Dec;45(12):1080–1093.
- Kimura S, Noda T, Yoshimori T. Dissection of the autophagosome maturation process by a novel reporter protein, tandem fluorescent-tagged LC3. Autophagy. 2007 Sep-Oct;3(5):452–460.
- Kaden TR, Li W. Autophagy, mitochondrial dynamics and retinal diseases. Asia Pac J Ophthalmol (Phila). 2013 Sep-Oct;2(5):341–348.
- Szikra T, Krizaj D. Intracellular organelles and calcium homeostasis in rods and cones. Vis Neurosci. 2007 Sep-Oct;24(5):733–743.
- Mitter SK, Rao HV, Qi X, et al. Autophagy in the retina: a potential role in age-related macular degeneration. Adv Exp Med Biol. 2012;723:83–90.
- Reme CE, Wolfrum U, Imsand C, et al. Photoreceptor autophagy: effects of light history on number and opsin content of degradative vacuoles. Invest Ophthalmol Vis Sci. 1999 Sep;40(10):2398–2404.
- Zhou Z, Doggett TA, Sene A, et al. Autophagy supports survival and phototransduction protein levels in rod photoreceptors. Cell Death Differ. 2015 Mar;22(3):488–498.
- Zhou Z, Vinberg F, Schottler F, et al. Autophagy supports color vision. Autophagy. 2015;11(10):1821–1832.
- Reme CE. Autography in visual cells and pigment epithelium. Invest Ophthalmol Vis Sci. 1977 Sep;16(9):807–814.
- Yao J, Jia L, Feathers K, et al. Autophagy-mediated catabolism of visual transduction proteins prevents retinal degeneration. Autophagy. 2016;Dec;12(12):2439–2450.
- Sprott D, Poitz DM, Korovina I, et al. Endothelial-specific deficiency of ATG5 (autophagy protein 5) attenuates ischemia-related angiogenesis. Arterioscler Thromb Vasc Biol. 2019 Jun;39(6):1137–1148.
- Ferguson TA, Green DR. Autophagy and phagocytosis converge for better vision. Autophagy. 2014 Jan;10(1):165–167.
- Rodriguez-Muela N, Koga H, Garcia-Ledo L, et al. Balance between autophagic pathways preserves retinal homeostasis. Aging Cell. 2013 Jun;12(3):478–488.
- He F, Nichols RM, Kailasam L, et al. Critical role for phosphatidylinositol-3 Kinase Vps34/PIK3C3 in ON-Bipolar Cells. Invest Ophthalmol Vis Sci. 2019 Jul 1;60(8):2861–2874.
- Bejarano-Escobar R, Sanchez-Calderon H, Otero-Arenas J, et al. Muller glia and phagocytosis of cell debris in retinal tissue. J Anat. 2017 Oct;231(4):471–483.
- Lopez-Luppo M, Catita J, Ramos D, et al. Cellular senescence is associated with human retinal microaneurysm formation during aging. Invest Ophthalmol Vis Sci. 2017 Jun 1;58(7):2832–2842.
- Rodriguez-Muela N, Germain F, Marino G, et al. Autophagy promotes survival of retinal ganglion cells after optic nerve axotomy in mice. Cell Death Differ. 2012 Jan;19(1):162–169.
- Want A, Gillespie SR, Wang Z, et al. Autophagy and mitochondrial dysfunction in tenon fibroblasts from exfoliation glaucoma patients. PLoS One. 2016;11(7):e0157404.
- Mattapallil MJ, Wawrousek EF, Chan CC, et al. The Rd8 mutation of the Crb1 gene is present in vendor lines of C57BL/6N mice and embryonic stem cells, and confounds ocular induced mutant phenotypes. Invest Ophthalmol Vis Sci. 2012;53(6):2921–2927.
- Tan E, Wang Q, Quiambao AB, et al. The relationship between opsin overexpression and photoreceptor degeneration. Invest Ophthalmol Vis Sci. 2001 Mar;42(3):589–600.
- Klionsky DJ, Abdel-Aziz AK, Abdelfatah S, et al. Guidelines for the use and interpretation of assays for monitoring autophagy. Autophagy. 2021 Jan;17(1):1–382. (4th edition)(1).
- Esteban-Martinez L, Boya P. Autophagic flux determination in vivo and ex vivo. Methods. 2015 Mar;75:79–86.
- Kunchithapautham K, Coughlin B, Lemasters JJ, et al. Differential effects of rapamycin on rods and cones during light-induced stress in albino mice. Invest Ophthalmol Vis Sci. 2011 May 5;52(6):2967–2975.
- Gomez-Sintes R, Villarejo-Zori B, Serrano-Puebla A, et al. Standard assays for the study of autophagy in the ex vivo retina. Cells. 2017 Oct 22;6(4):37.
- Diot A, Agnew T, Sanderson J, et al. Validating the RedMIT/GFP-LC3 mouse model by studying mitophagy in autosomal dominant optic atrophy due to the OPA1Q285STOP mutation. Front Cell Dev Biol. 2018;6:103.
- Russo R, Varano GP, Adornetto A, et al. Rapamycin and fasting sustain autophagy response activated by ischemia/reperfusion injury and promote retinal ganglion cell survival. Cell Death Dis. 2018 Sep 24;9(10):981.
- Rodriguez-Muela N, Hernandez-Pinto AM, Serrano-Puebla A, et al. Lysosomal membrane permeabilization and autophagy blockade contribute to photoreceptor cell death in a mouse model of retinitis pigmentosa. Cell Death Differ. 2015 Mar;22(3):476–487.
- Naso F, Intartaglia D, Falanga D, et al. Light-responsive microRNA miR-211 targets Ezrin to modulate lysosomal biogenesis and retinal cell clearance. EMBO J. 2020 Apr 15;39(8):e102468.
- McWilliams TG, Prescott AR, Villarejo-Zori B, et al. A comparative map of macroautophagy and mitophagy in the vertebrate eye. Autophagy. 2019 Jul;15(7):1296–1308.
- Nettesheim A, Dixon A, Shim MS, et al. Autophagy in the aging and experimental ocular hypertensive mouse model. Invest Ophthalmol Vis Sci. 2020 Aug 3;61(10):31.
- Croce AC, Bottiroli G. Autofluorescence spectroscopy and imaging: a tool for biomedical research and diagnosis. Eur J Histochem. 2014 Dec 12;58(4):2461.
- Sparrow JR, Wu Y, Nagasaki T, et al. Fundus autofluorescence and the bisretinoids of retina. Photochem Photobiol Sci. 2010 Nov;9(11):1480–1489.
- Liu Z, Ueda K, Kim HJ, et al. Photobleaching and fluorescence recovery of RPE bisretinoids. PLoS One. 2015;10(9):e0138081.
- Yamamoto K, Zhou J, Hunter JJ, et al. Toward an understanding of bisretinoid autofluorescence bleaching and recovery. Invest Ophthalmol Vis Sci. 2012 Jun 8;53(7):3536–3544.
- Gibbs D, Cideciyan AV, Jacobson SG, et al. Retinal pigment epithelium defects in humans and mice with mutations in MYO7A: imaging melanosome-specific autofluorescence. Invest Ophthalmol Vis Sci. 2009 Sep;50(9):4386–4393.
- Haralampus-Grynaviski NM, Lamb LE, Clancy CM, et al. Spectroscopic and morphological studies of human retinal lipofuscin granules. Proc Natl Acad Sci U S A. 2003 Mar 18;100(6):3179–3184.
- Ragauskaite L, Heckathorn RC, Gaillard ER. Environmental effects on the photochemistry of A2-E, a component of human retinal lipofuscin. Photochem Photobiol. 2001 Sep;74(3):483–488.
- Taubitz T, Fang Y, Biesemeier A, et al. Age, lipofuscin and melanin oxidation affect fundus near-infrared autofluorescence. EBioMedicine. 2019 Oct;48:592–604.
- Akimoto M, Cheng H, Zhu D, et al. Targeting of GFP to newborn rods by Nrl promoter and temporal expression profiling of flow-sorted photoreceptors. Proc Natl Acad Sci U S A. 2006 Mar 7;103(10):3890–3895.
- Calvert PD, Schiesser WE, Pugh EN Jr. Diffusion of a soluble protein, photoactivatable GFP, through a sensory cilium. J Gen Physiol. 2010 Mar;135(3):173–196.
- Conley SM, Cai X, Makkia R, et al. Increased cone sensitivity to ABCA4 deficiency provides insight into macular vision loss in Stargardt’s dystrophy. Biochim Biophys Acta. 2012 Jul;1822(7):1169–1179.
- Martinet W, Schrijvers DM, Timmermans JP, et al. Immunohistochemical analysis of macroautophagy: recommendations and limitations. Autophagy. 2013 Mar;9(3):386–402.
- Lewis GP, Fisher SK. Up-regulation of glial fibrillary acidic protein in response to retinal injury: its potential role in glial remodeling and a comparison to vimentin expression. Int Rev Cytol. 2003;230:263–290.
- Ahmed Z, Shaw G, Sharma VP, et al. Actin-binding proteins coronin-1a and IBA-1 are effective microglial markers for immunohistochemistry. J Histochem Cytochem. 2007 Jul;55(7):687–700.
- Ito D, Imai Y, Ohsawa K, et al. Microglia-specific localisation of a novel calcium binding protein, Iba1. Brain Res Mol Brain Res. 1998 Jun 1;57(1):1–9.
- Tsien RY. The green fluorescent protein. Annu Rev Biochem. 1998;67(1):509–544.
- Kaizuka T, Morishita H, Hama Y, et al. An autophagic flux probe that releases an internal control. Mol Cell. 2016 Nov 17;64(4):835–849.
- Geng J, Klionsky DJ. Direct quantification of autophagic flux by a single molecule-based probe. Autophagy. 2017 Apr 3;13(4):639–641.
- Manicam C, Pitz S, Brochhausen C, et al. Effective melanin depigmentation of human and murine ocular tissues: an improved method for paraffin and frozen sections. PLoS One. 2014;9(7):e102512.
- He F, Agosto MA, Anastassov IA, et al. Phosphatidylinositol-3-phosphate is light-regulated and essential for survival in retinal rods. Sci Rep. 2016 Jun 1;6(1):26978.
- Yao J, Qiu Y, Frontera E, et al. Inhibiting autophagy reduces retinal degeneration caused by protein misfolding. Autophagy. 2018 Jun 25;14(7):1226–1238.
- Gaynes BI, Torczynski E, Varro Z, et al. Retinal toxicity of chloroquine hydrochloride administered by intraperitoneal injection. J Appl Toxicol. 2008 Oct;28(7):895–900.
- Guha S, Coffey EE, Lu W, et al. Approaches for detecting lysosomal alkalinization and impaired degradation in fresh and cultured RPE cells: evidence for a role in retinal degenerations. Exp Eye Res. 2014 Sep;126:68–76.
- Kellner U, Renner AB, Tillack H. Fundus autofluorescence and mfERG for early detection of retinal alterations in patients using chloroquine/hydroxychloroquine. Invest Ophthalmol Vis Sci. 2006 Aug;47(8):3531–3538.
- Greenstein VC, Lima de Carvalho JR Jr., Parmann R, et al. Quantitative fundus autofluorescence in HCQ retinopathy. Invest Ophthalmol Vis Sci. 2020 Sep 1;61(11):41.
- Reichel C, Berlin A, Radun V, et al. Quantitative fundus autofluorescence in systemic chloroquine/hydroxychloroquine therapy. Transl Vis Sci Technol. 2020 Aug;9(9):42.
- Marmor MF, Kellner U, Lai TY, et al. Recommendations on screening for chloroquine and hydroxychloroquine retinopathy (2016 revision). Ophthalmology. 2016 Jun;123(6):1386–1394.
- Ramachandra Rao S, Skelton LA, Wu F, et al. Retinal degeneration caused by rod-specific dhdds ablation occurs without concomitant inhibition of protein N-Glycosylation. iScience. 2020 Jun 26;23(6):101198.
- Ramachandra Rao S, Pfeffer BA, Mas Gomez N, et al. Compromised phagosome maturation underlies RPE pathology in cell culture and whole animal models of smith-lemli-opitz syndrome. Autophagy. 2018;14(10):1796–1817.
- Seluanov A, Vaidya A, Gorbunova V. Establishing primary adult fibroblast cultures from rodents. J Vis Exp. 2010 Oct;5(44):2033. doi:https://doi.org/10.3791/2033.