
ABSTRACT
Cerebral ischemia is a pathology involving a cascade of cellular mechanisms, leading to the deregulation of proteostasis, including macroautophagy/autophagy, and finally to neuronal death. If it is now accepted that cerebral ischemia induces autophagy, the effect of thrombolysis/energy recovery on proteostasis remains unknown. Here, we investigated the effect of thrombolysis by PLAT/tPA (plasminogen activator, tissue) on autophagy and neuronal death. In two in vitro models of hypoxia reperfusion and an in vivo model of thromboembolic stroke with thrombolysis by PLAT/tPA, we found that ischemia enhances neuronal deleterious autophagy. Interestingly, PLAT/tPA decreases autophagy to mediate neuroprotection by modulating the PI3K-AKT-MTOR pathways both in vitro and in vivo. We identified IGF1R (insulin-like growth factor I receptor; a tyrosine kinase receptor) as the effective receptor and showed in vitro, in vivo and in human stroke patients and that PLAT/tPA is able to degrade IGFBP3 (insulin-like growth factor binding protein 3) to increase IGF1 (insulin-like growth factor 1) bioavailability and thus IGF1R activation.
Abbreviations: AKT/protein kinase B: thymoma viral proto-oncogene 1; EGFR: epidermal growth factor receptor; Hx: hypoxia; IGF1: insulin-like growth factor 1; IGF1R: insulin-like growth factor I receptor; IGFBP3: insulin-like growth factor binding protein 3; Ka: Kainate; MAP1LC3/LC3: microtubule-associated protein 1 light chain 3; MAPK/ERK: mitogen-activated protein kinase; MTOR: mechanistic target of rapamycin kinase; MTORC1: MTOR complex 1; OGD: oxygen and glucose deprivation; OGDreox: oxygen and glucose deprivation + reoxygentation; PepA: pepstatin A1; PI3K: phosphoinositide 3-kinase; PLAT/tPA: plasminogen activator, tissue; PPP: picropodophyllin; SCH77: SCH772984; ULK1: unc-51 like kinase 1; Wort: wortmannin
Introduction
Stroke is the second leading cause of death and the most frequent cause of disability in adults [Citation1]. Acute treatments have been developed: the recent endovascular thrombectomy and thrombolysis by PLAT/tPA (plasminogen activator, tissue) [Citation2]. However, endovascular thrombectomy is restricted to large vessels occlusion [Citation3], while thrombolysis with PLAT/tPA has a short therapeutic windows, a low recanalization rate, and a higher risk of hemorrhagic transformation [Citation2,Citation4]. Therefore, a better comprehension of ischemic stroke’s pathophysiology is required to improve prevention, therapy and reparation following the disease.
Ischemic stroke is a complex disease involving a cascade of cellular mechanism, which deregulates proteostasis and leads to cell death [Citation5]. A key mechanism involved in proteostasis regulation is autophagy [Citation5], a protein degradation/recycling system highly conserved. Macroautophagy (hereafter called autophagy) is characterized by the synthesis of a double-layered membrane structure called an autophagosome, which contains cargos targeted for degradation. Autophagosomes then fuse with lysosomes to form autolysosomes resulting in the degradation of their contents. The main autophagy-regulating pathway involves MTOR (mechanistic target of rapamycin kinase). Under physiological conditions, MTOR complex 1 (MTORC1) is phosphorylated and associated with ULK1 (unc-51 like kinase 1)-ULK2, allowing the phosphorylation of ATG13 and ULK1-ULK2. This inhibits ULK1-ULK2 kinase activity, leading to an inhibition of autophagy [Citation6]. Under pathological conditions, such as starvation or metabolic stress, MTORC1 is inactivated by dephosphorylation and the ULK1-ULK2 kinase activity is restored.
Interestingly, PLAT/tPA is involved in proteostasis by decreasing ischemia-induced endoplasmic reticulum stress [Citation7]. Moreover, PLAT/tPA has been shown to increase neuronal survival following dissociation and plating in a JAK (Janus kinases)-STAT (signal transducer and activator of transcription)-MTOR dependent manner [Citation8,Citation9] and is involved in the detection and the adaption to metabolic stress [Citation10]. However, the impact on neuronal autophagy and its consequences during cerebral ischemia has never been explored.
Here, we first evidence that neuronal autophagy is an important deleterious pathway activated by ischemia/reperfusion. We found that autophagy contributes to ischemia-induced neuronal death both in vitro and in vivo. We then show that PLAT/tPA is able to decrease ischemia-enhanced autophagy and mediates neuroprotection by modulating the phosphoinositide 3-kinase (PI3K)-AKT/protein kinase B (thymoma viral proto-oncogene)-MTORC1 pathway both in vitro and in vivo. We identified IGF1R (insulin-like growth factor I receptor) as a new receptor implicated in autophagy modulation by PLAT/tPA. Finally, we showed that during thrombolysis in human stroke patients, PLAT/tPA is able to degrade IGFBP3 (insulin-like growth factor binding protein 3) to increase IGF1 (insulin-like growth factor 1) bioavailability and thus IGF1R activation, opening new strategies for the detection and the treatment of the disease.
Results
Autophagy pathways are increased by oxygen and glucose deprivation followed by reoxygenation in cortical neurons
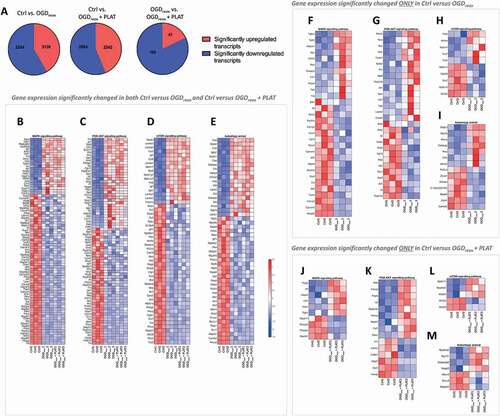
To determine the pathways affected by oxygen and glucose deprivation (OGD) and PLAT/tPA treatments (300 nM), we performed a RNAseq followed by an enrichment pathways analysis. In total 5383 transcripts are differentially expressed in the Ctrl Vs OGDreox condition, 5126 in the Ctrl Vs OGDreox+ PLAT/tPA condition, and 229 in the OGDreox Vs OGDreox+ PLAT/tPA condition (). The enrichment pathway analysis shows 33 pathways differentially expressed between Ctrl/OGDreox/OGDreox+ PLAT/tPA (). Among them, 5 are linked to hypoxia/ischemia and 12 are linked to autophagy. Indeed, the most affected pathways are MAPK (mitogen-activated protein kinase) (), PI3K-AKT (), MTOR () and the autophagy () pathways. Focusing on these autophagic pathways, we found that 30 genes are significantly deregulated in the MAPK pathway under OGDreox condition compared to Ctrl (), 28 genes in the PI3K-AKT pathway (), 10 genes in the MTOR pathway () and 14 genes in the autophagy pathway (). Furthermore, the presence of PLAT/tPA during OGDreox modified the expression of 10 genes in the PI3K-AKT pathway compared to OGDreox condition (), 15 in the MAPK pathway (), in the MTOR pathway () in the autophagy pathway (). and Altogether, these results show that autophagy and upstream pathways are strongly affected during OGDreox, and that PLAT/tPA seems to counteract these deregulations.
Table 1. RNAseq pathway analysis of neurons subjected or not to OGDreox ± 300 nM PLAT/tPA
Figure 1. Autophagy pathways are increased by oxygen and glucose deprivation in cortical neurons. (A) Pie charts representing significantly (p < 0.05) up- and downregulated transcripts in Ctrl Vs OGDreox, Ctrl Vs OGDreox + PLAT/tPA and OGDreox Vs OGDreox + PLAT/tPA conditions. Heatmaps of genes significantly affected (p < 0.05) in both OGDreox and OGDreox + PLAT/tPA conditions Vs Ctrl condition for (B) MAPK signaling pathway, (C) PI3K-AKT signaling pathway, (D) MTOR signaling pathway, and (E) autophagy pathway. Heatmaps of genes significantly affected (p < 0.05) between Ctrl and OGDreox conditions for (F) MAPK signaling pathway, (G) PI3K-AKT signaling pathway, (H) MTOR signaling pathway, and (I) autophagy pathway. Heatmaps of genes significantly affected (p < 0.05) between Ctrl and OGDreox + PLAT/tPA conditions for (J) MAPK signaling pathway, (K) PI3K-AKT signaling pathway, (L) MTOR signaling pathway, and (M) autophagy pathway.
PLAT/tPA decreases OGD-enhanced autophagy flux and cell death in primary cortical neurons
To deepen the RNAseq, we evaluated the effect of OGDreox on autophagy flux in mice primary cortical neurons in the presence or not of PLAT/tPA (). We investigated the flux by measuring the levels of both MAP1LC3/LC3 (microtubule-associated protein 1 light chain 3)-II (recruited to phagophore membranes, the precursor to autophagosomes) and SQSTM1/p62 (a selective autophagy receptor) [Citation11]. As shown by western blots, the level of LC3-II increases by 106.7% following OGDreox (), reflecting an increase of autophagosome presence, while the level of SQSTM1/p62 decreases by 66.5% (), suggesting that OGDreox enhances the autophagy flux. We next confirmed this observation by using lentivirus transducing GFP-LC3 in neurons. Puncta of GFP-LC3, presumably autophagosomes, are increased by 143.9% in OGDreox conditions (Fig. S1A and S1B).
Figure 2. PLAT/tPA decreases OGD-induced autophagy and cell death in cortical neurons. (A) Schematic representation of in vitro ischemic model consisting in 1 h of OGD followed by 3 h of reoxygenation (OGDreox), on 12 days old murine primary cortical neurons in the presence or not of treatments. (B) Representative western blots of LC3-II, SQSTM1/p62 and ACTB in neurons subjected or not to OGDreox with and without PLAT/tPA (300 nM). Densitometric quantification of LC3-II (C) and SQSTM1/p62 (D) normalized to ACTB (mean±S.E.M. n = 5 and 6 independent experiments for LC3 and SQSTM1/p62 respectively; ##: p < 0.01 and #: p < 0.05 compared to Ctrl; **: p < 0.01 and *: p < 0.05 compared between OGDreox conditions; Mann–Whitney test). (E) Neuronal death of pure cortical neurons assessed by LDH release after OGDreox in the presence or not of 10 µg/ml of E64d and 10 µg/ml pepstatin A (mean±S.E.M. n = 12 for Ctrl, n = 16 for Ctrl+E64d-PepA, n = 31 for OGDreox, n = 33 for OGDreox+E64d-PepA, n = 28 for OGDreox+ PLAT/tPA from 4 independent experiments; ###: p < 0.001 compared to Ctrl; ***: p < 0.001 compared between OGDreox; Mann–Whitney test). (F) Representative western blots of LC3-II, SQSTM1/p62 and ACTB in neurons subjected or not to OGDreox in the presence or not of 10 µg/ml of E64d and 10 µg/ml Pepstadin A. Densitometric quantification of LC3-II (G) and SQSTM1/p62 (H) normalized to ACTB (mean±S.E.M. n = 8 independent experiments; ##: p < 0.01 and ###: p < 0.001 compared to Ctrl; ***: p < 0.001 compared between OGDreox; Mann–Whitney test.
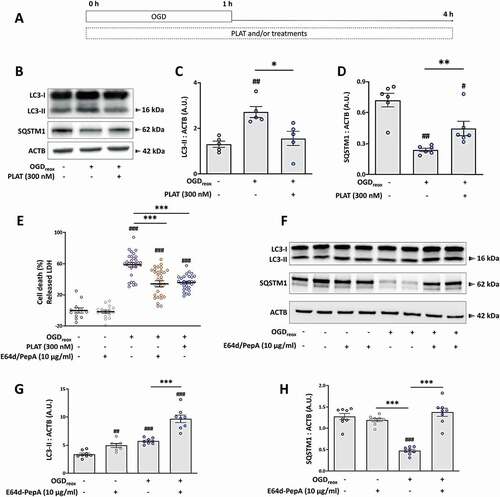
OGDreox induces neuronal death by several mechanisms, including excitotoxicity, apoptosis, ER stress and autophagy [Citation5,Citation7,Citation9,Citation12]. To assess the role of enhanced autophagy observed in OGDreox conditions, we pre-treated neurons with a combination of the lysosomal enzyme inhibitors E64d (10 μg/ml) and pepstatin A1 (PepA) (10 μg/ml) to block the flux and we measured the neuronal death. In neurons subjected to OGDreox, E64d-PepA blocks autophagy as demonstrated by the greater accumulation of LC3-II (+69.1%; ), and by the accumulation of SQSTM1/p62 (+41.4%, ) compared to OGDreox alone. E64d-PepA has no effects on neurons in control conditions; but decreases neuronal death under OGDreox (). Chloroquine, an inhibitor of the maturation step of autophagy by preventing the fusion between autophagosomes and lysosomes, also protects neurons from OGDreox-induced cell death in a dose-dependent manner (Fig. S1C). Taken together, autophagy is deleterious in our model of neuronal OGDreox, and its blocking offers neuroprotection.
Interestingly, PLAT/tPA (300 nM) also protects neurons from death at the same level than E64d-PepA (38.6% protection, ). As suggested by the RNAseq analysis, the presence of PLAT/tPA within the media decreases OGDreox-induced autophagy as demonstrated by the drop of LC3-II accumulation (−42.4%, ) together with an increase of SQSTM1/p62 (+85.44%, ). Of note, we do not observe an effect of PLAT/tPA on autophagic flux in normoxic conditions (Fig. S1D-F). The decrease of OGDreox-induced autophagy flux is confirmed by the use of GFP-LC3 lentivirus, showing a decrease of GFP-LC3-positive puncta following PLAT/tPA treatment (−40.1%, Fig. S1A and B). Additionally, several doses of PLAT/tPA have been tested (from 0.3 to 300 nM): only the high dose of PLAT/tPA is able to inhibit both autophagosome formation and SQSTM1/p62 degradation induced by OGDreox (Fig. S1G-H). However, the lowest dose of PLAT/tPA decreases autophagosome formation as suggested by LC3-II western blot, without affecting SQSTM1/p62 levels (Fig. S1G-I).
Altogether, PLAT/tPA is able to decrease OGDreox-enhanced autophagy leading to neuroprotection in an in vitro model of ischemia.
PLAT/tPA prevents hypoxic/excitotoxic-enhanced autophagy and neuronal death
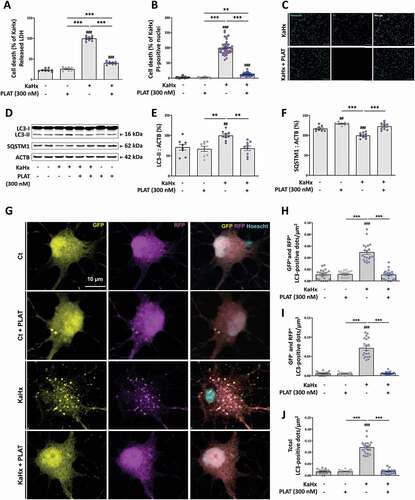
In another model, we previously shown that the combination of kainate (Ka, 30 µM) and hypoxia (Hx, 6% oxygen) for 30 min in primary cortical neuron cultures enhanced autophagy and that both pharmacological (3-methyladenine or E64d-pepA) and genetic (downregulation of Beclin1 and ATG7) inhibition of autophagy reduced neuronal death [Citation12]. In this KaHx model, the presence of PLAT/tPA (300 nM) is strongly neuroprotective as shown by both a reduction of LDH release in the medium (−60%, ) and a reduction of the number of PI-positive nuclei (−80%, ) 6 h after the stimulus. Moreover, the KaHx-induced increase in LC3-II levels () and SQSTM1/p62 degradation () was nearly fully prevented by PLAT/tPA treatment suggesting that autophagy was almost completely blocked. To confirm this result, primary cortical neurons were transfected with a tandem mRFP-GFP-LC3 plasmid that allows to simultaneously monitor autophagy induction and degradation efficiency. Based on the pH sensitivity of GFP signal, autophagosome presence is reflected by the number of RFP+ GFP+ dots and active autolysosome/amphisome are revealed by the number of RFP+ GFP− dots. As shown in , in the presence of PLAT/tPA KaHx has no effect on the number of both types of dots demonstrating that PLAT/tPA treatment completely prevented the KaHx-induced autophagy flux.
Figure 3. PLAT/tPA prevents hypoxic/excitotoxic-induced autophagy and neuronal death. (A-C) PLAT/tPA (300 nM) affords strong neuroprotection against cell death induced by the combination of kainate (Ka, 30 µM) and hypoxia (Hx, 6% oxygen) for 30 min in primary cortical neuron cultures as shown by a reduction in both (A) the release of lactate dehydrogenase (LDH) and (B-C) propidium iodide (PI)-staining 6 h after KaHx treatment. (A) Quantification of released LDH expressed as a percentage of the KaHx value (data are represented as mean±S.E.M. n = 8 from 3 independent experiments; ###: p < 0.001 compared to Ctrl; ***: p < 0.001 compared between KaHx; Tukey’s multiple comparisons tests) (B) Quantification of the PI-positive nuclei expressed as a percentage of the number of KaHx PI-positive nuclei (data are represented as mean±S.E.M. n = 24 from 3 independent experiments; ###: p < 0.001 compared to Ctrl; ***: p < 0.001 and **: p < 0.01 compared between KaHx; Tukey’s multiple comparisons tests) (C) Representative images of PI- (magenta) and Hoechst- (cyan) stained nuclei. Bars = 100 µm. (D-F) PLAT/tPA treatment prevents KaHx-induced autophagy as indicated by a suppression of both KaHx-induced (E) increase in LC3-II level and (F) degradation of SQSTM1/p62. (D) Representative western blots of LC3-II and SQSTM1/p62 in neurons subjected or not to KaHx in the presence of PLAT/tPA 0 to 300 nM. ACTB was used as loading control. (E) Densitometric quantification of LC3-II normalized to ACTB. Levels expressed as a percentage of KaHx value (data are represented as mean±S.E.M. n = 8 independent experiments; ##: p < 0.01 compared to Ctrl; **: p < 0.01 compared between KaHx; Tukey’s multiple comparisons tests). (F) Densitometric quantification of SQSTM1/p62 normalized to ACTB. Levels expressed as a percentage of KaHx value (data are represented as mean±S.E.M. n = 8 independent experiments; ###: p < 0.001 and ##: p < 0.01 compared to Ctrl; ***: p < 0.001 compared between KaHx; Tukey’s multiple comparisons tests). (G) Representative confocal images of transfected cortical neurons with a tandem mRFP-GFP-LC3-expressing plasmid in control (Ct) or kainate/hypoxia (KaHx) condition with or without PLAT/tPA (300 nM) treatment. (H-I) Corresponding quantifications of the number of dots per µm2 of (H) GFP+ (yellow) RFP+ (magenta) (early autophagosomes) (I) GFP− RFP+ (mature autophagosomes/autolysosomes) and (J) the total of the two types (total dots). PLAT/tPA treatment prevents the increase in the autophagy flux (both autophagosome formation and autophagosome/lysosome fusion) induced after 3 h of KaHx stimulation. Data are represented as mean±S.E.M. n = 20; ###: p < 0.001 compared to Ctrl; ***: p < 0.001 compared with KaHx; Tukey’s multiple comparisons tests).
OGD-enhanced autophagy is dependent on MTOR pathway
The next step was then to investigate by which mechanism PLAT/tPA could modulate OGD-enhanced autophagy and neuronal death. The main signaling pathway leading to autophagy initiation is the MTOR pathway [Citation6]. MTOR is a large multidomain protein that exists in two multiprotein complexes: MTOR complex 1 (MTORC1) associated with RPTOR/Raptor, and MTOR complex 2 (MTORC2) associated with RICTOR [Citation13]. When MTORC1 is phosphorylated, it blocks the initiation of autophagy by phosphorylating ULK1-ULK2 on the Ser757, resulting in the inhibition of ULK1-ULK2 complex kinase activity needed in the early steps of autophagosome biogenesis [Citation6]. On the contrary, when MTORC1 activity is low, ULK1-ULK2 Ser757 is dephosphorylated and the complex kinase activity is restored, leading to autophagy activation [Citation6,Citation14]. Therefore, we measured the levels of phosphorylated MTORC1 (Ser2448; p-MTORC1) following OGDreox (). We found that p-MTORC1 is reduced under OGDreox (−62.4%, ) suggesting an increase of autophagy. Accordingly, we also observed that OGDreox leads to a decrease of p-ULK1-ULK2 (Ser757) (−57.8%, ). Lastly, we found that PLAT/tPA prevents the decrease of p-MTORC1 () and p-ULK1-ULK2 () during OGDreox. Similarly, KaHx-induced neuronal death involves a strong decrease in MTORC1 (Ser2448) phosphorylation that was completely prevented by PLAT/tPA treatment (Fig. S2) reinforcing the fact that PLAT/tPA prevents OGD-induced MTOR-dependent autophagy.
Figure 4. OGD-enhanced autophagy is dependent on MTOR pathway. (A) Representative western blots of p-MTORC1 (Ser2448), p-MTORC2 (Ser2481), MTOR total, p-ULK1-ULK2 (Ser757) and ACTB in neurons subjected or not to OGDreox with and without PLAT/tPA (300 nM). Densitometric quantification of p-MTORC1 (Ser2448) normalized to MTOR total (B), of p-MTORC2 (Ser2481) normalized to MTOR total (C), of p-ULK1-ULK2 (Ser757) normalized to ACTB (D) (mean±S.E.M. n = 4 to 6 independent experiments; ##: p < 0.01 and #: p < 0.05 compared to Ctrl; **: p < 0.01 and *: p < 0.05 compared to OGDreox; Mann–Whitney test).
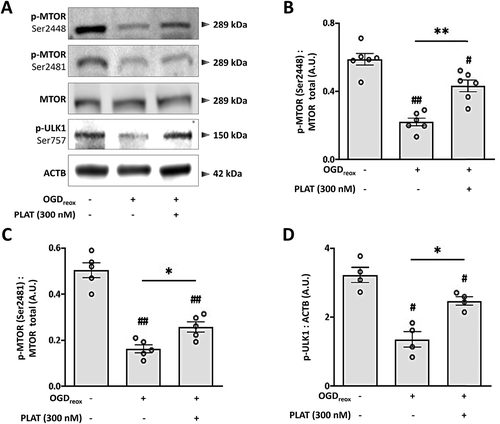
We also observed that OGDreox also induces a drop in the phosphorylation of MTORC2 (−67.7%, ). However, the effect of PLAT/tPA on p-MTORC2 is much weaker than the one observed on p-MTORC1 as PLAT/tPA partially prevents the drop of phosphorylation ().
PLAT/tPA decreases OGD-enhanced autophagy through PI3K-AKT pathway
MTORC1 is controlled by 2 main upstream pathways: MAPK/ERK and PI3K-AKT [Citation15,Citation16]. We confirmed that OGDreox leads to a decrease of both p-MAPK/ERK (−71.2%) and p-AKT (−64%, -C), in line with our previous observations showing that OGDreox leads to the inhibition of MTORC1 (). Interestingly, when PLAT/tPA is present in the media, the decrease of p-MAPK/ERK and p-AKT are partially reversed ().
Figure 5. PLAT/tPA decreases OGD-induced autophagy through the PI3K-AKT pathway. (A) Representative western blots of p-MAPK/ERK1/2 (Thr202, Tyr204), MAPK/ERK1/2 total, p-AKT (Ser473) and AKT total in neurons subjected or not to OGDreox with and without PLAT/tPA (300 nM). Densitometric quantification of p-MAPK/ERK1/2 (Thr202, Tyr204) normalized to MAPK/ERK1/2 total (B) and of p-AKT (Ser473) normalized to AKT total (C) (mean±S.E.M. n = 5 independent experiments; ##: p < 0.01 compared to Ctrl; **: p < 0.01 and p < 0.05 compared between OGDreox conditions; Mann–Whitney test). (D) Representative western blots of LC3-II, SQSTM1/p62 and ACTB in neurons subjected or not to OGDreox with and without PLAT/tPA (300 nM) in the presence or not of 5 μM SCH772984 (SCH77; MAPK/ERK1/2 inhibitor). Densitometric quantification of LC3-II (E) and SQSTM1/p62 (F) normalized to ACTB (mean±S.E.M. n = 6 independent experiments; #: p < 0.05 compared to Ctrl; **: p < 0.01 and *: p < 0.05 compared between OGDreox conditions; Mann–Whitney test). (G) Representative western blots of LC3-II, SQSTM1/p62 and ACTB in neurons subjected or not to OGDreox with and without PLAT/tPA (300 nM) in the presence or not of 10 μM A6730 (AKT inhibitor). Densitometric quantification of LC3-II (H) and SQSTM1/p62 (I) normalized to ACTB (mean±S.E.M. n = 5 and 6 independent experiments for LC3 and SQSTM1/p62 respectively; ##: p < 0.01 and #: p < 0.05 compared to Ctrl; **: p < 0.01 and *: p < 0.05 compared between OGDreox conditions; Mann–Whitney test). (J) Representative western blots of LC3-II, SQSTM1/p62 and ACTB in neurons subjected or not to OGDreox with and without PLAT/tPA (300 nM) in the presence or not of 250 nM wortmannin (Wort; PI3K inhibitor). Densitometric quantification of LC3-II (K) and SQSTM1/p62 (L) normalized to ACTB (as mean±S.E.M. n = 5 independent experiments; ##: p < 0.01 and #: p < 0.05 compared to Ctrl; *: p < 0.05 compared between OGDreox conditions; Mann–Whitney test).
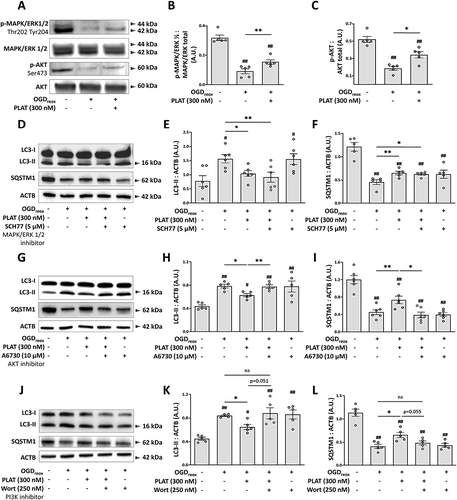
To test whether PLAT/tPA modulates autophagy via MAPK/ERK or PI3K-AKT pathways, we used pharmacological inhibitors of each pathway: SCH772984 (SCH77) [Citation17] and A6730 [Citation18] respectively. In the presence of PLAT/tPA, SCH77 does not reverse the drop of LC3-II (), nor the increase of SQSTM1/p62 (). However, A6730 reverses the decrease of LC3-II () and the increase of SQSTM1/p62 induced by PLAT/tPA during OGDreox (). It suggests that OGDreox decreases p-MAPK/ERK and p-AKT, leading to p-MTORC1 inhibition and autophagy activation during OGDreox. Also, PLAT/tPA decreases autophagy through MTORC1 activation by its ability to prevent the drop of p-AKT.
It is also supported by the use of Wortmannin (Wort, 250 nM) a broad PI3K and class III phosphatidylinositol 3-kinase (PtdIns3K) inhibitor. Our results demonstrate that Wort by itself does not modify OGDreox–induced autophagy flux (). In the presence of PLAT/tPA, Wort almost reverses the decrease of LC3-II (p = 0.051, ) and restores the degradation of SQSTM1/p62 (p = 0.055, ); thus reinforcing the implication of the PI3K-AKT pathway in the effect of PLAT/tPA on MTORC1 and autophagy.
PLAT/tPA decreases OGD-enhanced PI3K-AKT signaling through IGF1R receptor
We and others have already shown that PLAT/tPA can induce PI3K-AKT signaling through various receptors [Citation19–21]. For instance, PLAT/tPA is able to activate EGFR (epidermal growth factor receptor), a tyrosine kinase receptor promoting PI3K-AKT signaling, to mediate neuroprotection [Citation22–24]. Therefore, we tested the ability of AG1478 (a specific EGFR inhibitor) to prevent the effects of PLAT/tPA on neuronal autophagy during OGDreox. When EGFR activity is blocked, PLAT/tPA still decreases LC3-II accumulation (,B) and increases SQSTM1/p62 level (). Surprisingly enough, we observed that AG1478 alone can reverse LC3-II conversion induced by OGDreox (−43.5%, ), but has no effect on SQSTM1/p62 level () indicating that AG1478 has probably no effect on OGD-enhanced autophagy.
Figure 6. PLAT/tPA decreases OGD-induced PI3K-AKT signaling through IGF1R receptor. (A) Representative western blots of LC3-II, SQSTM1/p62 and ACTB in neurons subjected or not to OGDreox with and without PLAT/tPA (300 nM) in the presence or not of 5 µM AG1478 (EGFR inhibitor). Densitometric quantification of LC3-II (B) and SQSTM1/p62 (C) normalized to ACTB (mean±S.E.M. n = 4 and 5 independent experiments for LC3 and SQSTM1/p62 respectively; ##: p < 0.01 and #: p < 0.05 compared to Ctrl; **: p < 0.01 and*: p < 0.05 compared between OGDreox conditions; Mann–Whitney test). (D) Representative western blots of p-AKT (Ser473), AKT total, p-MTORC1 (Ser2448) and MTOR total in neurons subjected or not to OGDreox with and without PLAT/tPA (300 nM) in the presence or not of 100 nM Picropodophyllotoxin. Densitometric quantification of p-AKT (Ser473) normalized to AKT total (E) and of MTORC1 (Ser2448) normalized to MTOR total (F) (mean±S.E.M. n = 4 independent experiments; #: p < 0.05 compared to Ctrl; *: p < 0.05 compared between OGDreox conditions; Mann–Whitney test). (G) Representative western blots of LC3-II, SQSTM1/p62 and ACTB in neurons subjected or not to OGDreox with and without PLAT/tPA (300 nM) in the presence or not of 100 nM Picropodophyllotoxin (PPP; IGF1R inhibitor). Densitometric quantification of LC3-II (H) and of SQSTM1/p62 (I) normalized to ACTB (mean±S.E.M. n = 5 independent experiments; ##: p < 0.01 compared to Ctrl; **: p < 0.01 compared between OGDreox; Mann–Whitney test). (J) Representative western blots of LC3-II, SQSTM1/p62 and ACTB in neurons subjected or not to OGDreox with and without IGF1 (250 nM). Densitometric quantification of LC3-II (K) and SQSTM1/p62 (L) normalized to ACTB (mean±S.E.M. n = 6 and 7 independent experiments for LC3 and SQSTM1/p62 respectively; ###: p < 0.005 and ##: p < 0.01 compared to Ctrl; **: p < 0.01 compared between OGDreox conditions; Mann–Whitney test).
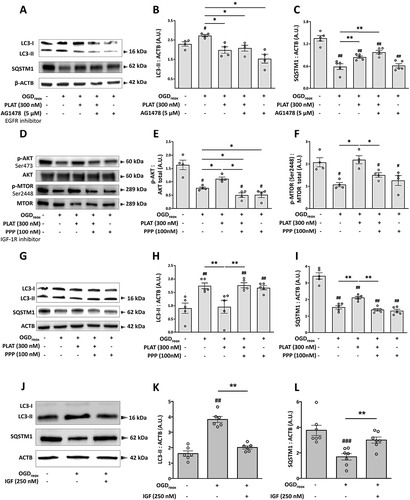
We next tested picropodophyllin (PPP), a selective inhibitor of the tyrosine kinase receptor IGF1R [Citation25]. In neurons subjected to OGDreox conditions, PPP (100 nM) slightly exacerbates the decrease of p-AKT (−32.3%, ). However, PPP has no effects by itself neither on MTORC1 () nor on autophagy flux (). Interestingly, when PPP is added in the presence of PLAT/tPA, LC3-II accumulation is no more reversed (−34.2%, ) and SQSTM1/p62 degradation is restored (+34.4%, ). PPP also prevents the inhibition of autophagy pathways by PLAT/tPA by decreasing PLAT/tPA -induced MTORC1 phosphorylation (−31.1%, ). In the presence of PPP, PLAT/tPA does not longer induce AKT signaling under OGDreox conditions (−55.2%, ).
We also activated the IGF1R by adding IGF1 (250 nM) to the culture media during OGDreox (). Contrary to the inhibition of IGF1R by PPP, its activation leads to a decrease of autophagy flux as shown by the decrease of LC3-II (−47.6%, ) and the increase of SQSTM1/p62 (+77.3%, ). Altogether, these results indicate that PLAT/tPA decreases autophagy by influencing IGF1R activation.
Proteolytically active PLAT/tPA protects neurons from cell death by decreasing autophagy through IGFR/PI3k-AKT/MTORC1
As we showed in , PLAT/tPA decreased-autophagy is independent of p-MAPK/ERK. As expected, MAPK/ERK inhibition by SCH77 does not reverse the neuroprotection induced by PLAT/tPA (). On the contrary, Wortmannin reverses the protective effect of PLAT/tPA on neuronal death (). AKT inhibition with A6730 also prevents PLAT/tPA -mediated neuroprotection (). These results support the notion that PLAT/tPA protects neurons by decreasing autophagy through the PI3K-AKT pathway. Importantly, PPP reverses the neuroprotection mediated by PLAT/tPA ().
Figure 7. Active PLAT/tPA protects neurons from cell death by decreasing autophagy through IGF1R/PI3k-AKT/MTORC1. Neuronal death of pure cortical neurons assessed by LDH release after OGDreox in the presence or not of PLAT/tPA and 5 μM SCH772984 (SCH77; MAPK/ERK1/2 inhibitor) (A), 250 nM Wortmannin (Wort; PI3K inhibitor) (B), 10 μM A6730 (AKT inhibitor) (C), 100 nM Picropodophyllotoxin (PPP; IGF1R inhibitor) (D), 300 nM d-GGACK- PLAT/tPA (inactive PLAT/tPA) (E) or 1 μM Aprotinin (plasmin inhibitor) (F) (mean±S.E.M. n = 14 to 30 from 6 independent experiments; ###: p < 0.001 compared to Ctrl; ***: p < 0.001, **: p < 0.01 and *: p < 0.05 compared between OGDreox; Mann–Whitney test).
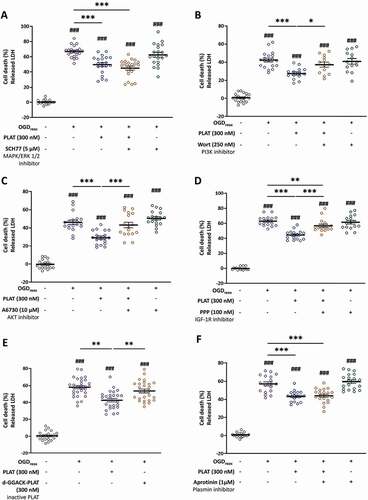
Interestingly, we investigated the ability of an inactive form of PLAT/tPA (d-GGACK-tPA) to mediate its effect in our OGDreox model in vitro. Our results show that inactive PLAT/tPA does not protect neurons from death (). In addition, PLAT/tPA effect is independent from its capacity to activate plasminogen into active plasmin, as the use of Aprotinin, an antifibrinolytic molecule, does not reverse its neuroprotection (). Altogether, these results show that PLAT/tPA needs to be active to mediate both neuroprotection and a decrease in OGD-enhanced autophagy through the IGFR/PI3K-AKT/MTORC1 pathway.
PLAT/tPA decreases autophagy and ischemic lesion in a mouse model of cerebral ischemia
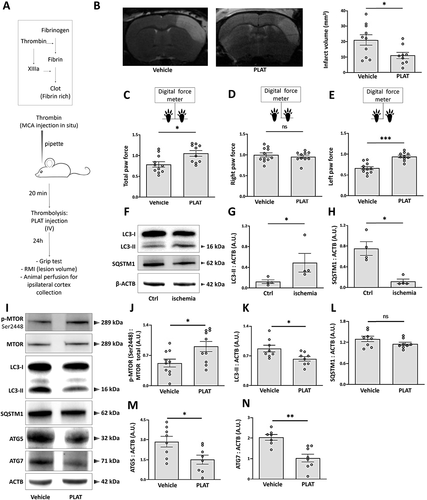
We then moved to an in vivo model of cerebral ischemia consisting in the injection of thrombin directly into the middle cerebral artery to form a clot [Citation26,Citation27] (). Twenty-four h after, the lesion volume is assessed by MRI, motor deficits are assessed by grip test, and brains are harvested for further analysis. In this model, we perform thrombolysis by PLAT/tPA like in clinic (i.e. 10% bolus, 90% infusion), resulting in a decrease of the infarct size 24 h after ischemia (−10.11 mm3, ). In addition, thrombolysed animals present a higher total force at the grip test (). Interestingly, the force default observed in non-thrombolysed animals only comes from the left paw (), which is in agreement with the ischemia performed on the right middle cerebral artery. In this model, stroke leads to the cerebral activation of autophagy, as demonstrated by the increase of LC3-II () together with a drop of SQSTM1/p62 (). Importantly, we found that autophagy decreases in PLAT/tPA -thrombolysed animals (). Indeed, we showed that MTORC1 phosphorylation is increased (), and that LC3-II (), ATG5 (), and ATG7 () are decreased in PLAT/tPA treated animals. However, we did not observe any difference in SQSTM1/p62 protein levels ().
Figure 8. PLAT/tPA decreases autophagy and ischemic lesion in a mouse model of cerebral ischemia. (A) Schematic representation of Middle Cerebral Artery occlusion (MCAo) based on thrombin injection in the MCA. (B) Representative MRI images and infarct volumes (mm3) 24 h after MCAo in mice treated with vehicle or PLAT/tPA. (mean±S.E.M; n = 10 for Vehicle; n = 9 for PLAT/tPA; *: p < 0.05; t test). Grip strength of both forepaws (C), right forepaw (D), or left forepaw (E) in mice treated with vehicle or PLAT/tPA after MCAo. Measurements were picked up the day before MCAo surgery (baseline acquisition) and 24 h after MCAo surgery, ratio between the two values is calculated in order to normalize each mouse with its own baseline values (mean±S.E.M; n = 10 for Vehicle; n = 9 for PLAT/tPA; ***: p < 0.001, *: p < 0.05; t test) (F) Representative western blots of LC3-II, SQSTM1/p62 and ACTB in ipsilateral cortex of mice after MCAo. Densitometric quantification of LC3-II (G) or SQSTM1/p62 (H) normalized to ACTB (mean±S.E.M. n = 4 independent experiments; *: p < 0.05; Mann–Whitney test). (I) Representative western blots of p-MTOR (Ser2448), MTOR tot, LC3-II, SQSTM1/p62, ATG5, ATG7 and ACTB in cortex treated with vehicle or PLAT/tPA after MCAo. Densitometric quantification of p-MTORC1 (Ser2448) normalized to MTOR total (J), of LC3-II normalized to ACTB (K), of SQSTM1/p62 normalized to ACTB (L), of ATG5 normalized to ACTB (M), of ATG7 normalized to ACTB (N) (mean±S.E.M. n = 8 to 10; *: p < 0.05; Mann–Whitney test).
Altogether, our results show the neuroprotective effect of PLAT/tPA on neuronal death in different in vitro models and in a thromboembolic mouse model of cerebral ischemia, associated to a decrease of autophagy.
PLAT/tPA cleaves IGFBP3 and increases the bioavailability of IGF1 in vitro and in vivo in mice
Our results show that PLAT/tPA decreases autophagy and cell death through IGF1R. Therefore, we tested the ability of PLAT/tPA to directly bind to and activate IGF1R. For this purpose, we measured Actilyse (the recombinant form of PLAT/tPA), Wt- PLAT/tPA (a recombinant PLAT/tPA produced in the lab) and ΔEGF- PLAT/tPA (a PLAT/tPA lacking its EGF-like domain, produced in the same conditions than WT PLAT/tPA; Fig. S3A) binding capacity to IGF1R. All tested PLAT/tPAs are able to bind to IGF1R in a dose dependent manner (Fig. S3B), however KDs are too high to mediate a biological effect (from 1.71 to 7.78 µM; Fig. S3C). We then hypothesized a role of PLAT/tPA on the bioavailability of IGF1, the natural ligand of the receptor. IGF1 is normally bound to IGFBPs (insulin like growth factor binding protein) and cannot activate its receptor [Citation28]. Interestingly, IGFBP3 cerebral levels are upregulated following hypoxia [Citation29,Citation30]. Moreover, IGFBP3 is sensitive to protease degradation [Citation31].
Therefore, we incubated recombinant IGFBP3 with PLAT/tPA (equimolar) from 15 to 280 min. After 15 min of incubation, PLAT/tPA promotes the cleavage of IGFBP3, and becomes total at 60 min (). We analyzed by ELISA the levels of IGFBP3 in our neurons supernatants from OGDreox± PLAT/tPA, and found that PLAT/tPA leads to a decrease of IGFBP3 in the media (−266.6 µg/ml, ). In addition, we also measured the levels of IGFBP3 in the serum of mice subjected to the thromboembolic model ± thrombolysis by PLAT/tPA at 1 and 24 h following thrombolysis. We observed that without thrombolysis, the serum level of IGFBP3 stays identical at 1 h and 24 h (). Interestingly, like in vitro, PLAT/tPA induces the cleavage of IGFBP3 in the serum of stroke mice at 1 and 24 h following thrombolysis ().
Figure 9. PLAT/tPA cleaves IGFBP3 and increases the bioavailability of IGF1 in vitro, in vivo in mice and in humans. (A) Human recombinant IGFBP3 was incubated or not with PLAT/tPA during 15 min, 1 h, 2 h or 4 h. Samples were then analyzed to SDS/PAGE and western blotting probed with anti-IGFBP3 antibody. (B) Concentration of IGFBP3 (ng/ml) measured by ELISA in cell culture medium of cortical neurons subjected or not to OGDreox with or without PLAT/tPA (300 nM) (mean±S.E.M. n = 8 independent experiments; ***: p < 0.001; t test). (C) Concentration of IGFBP3 (ng/ml) measured by ELISA in serum of mice treated with vehicle or PLAT/tPA after MCAo. Serum was collected 1 h and 24 h after treatment (mean±S.E.M; n = 8 for vehicle 1 h; n = 9 for PLAT/tPA 1 h; n = 8 for vehicle 24 h; n = 7 for PLAT/tPA 1 h; ##: p < 0.01 vehicle 1 h compared to PLAT/tPA 1 h; $: p < 0.05 vehicle 24 h compared to PLAT/tPA 24 h; Mann-Whitney test). Total IGF1 (ng/ml) (D), Free IGF1 (ng/ml) (E), and ratio between free and total IGF1 (F) measured by ELISA in serum of mice treated with vehicle or PLAT/tPA after MCAo. Serum was collected 1 h and 24 h after treatment (mean±S.E.M; n = 8 for vehicle 1 h; n = 9 for PLAT/tPA 1 h; n = 8 for vehicle 24 h; n = 7 for PLAT/tPA 1 h; ###: p < 0.001, ##: p < 0.01 vehicle 1 h compared to PLAT/tPA 1 h; $$$: p < 0.001, $$: p < 0.01 vehicle 24 h compared to PLAT/tPA 24 h; ***: p < 0.001, *: p < 0.05 PLAT/tPA 1 h compared to PLAT/tPA 24 h; Mann-Whitney test). (G) Concentration of IGFBP3 (ng/ml) was measured by ELISA in serum of stroke patients before PLAT/tPA injection (baseline) and 1 h, 2 h and 24 h after t PLAT/tPA injection (mean±S.E.M; n = 5 patients; *: p < 0.05; Paired t test).
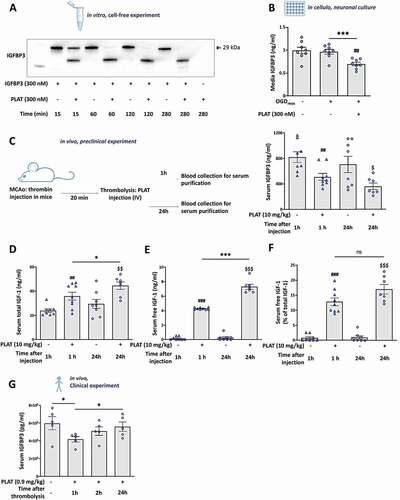
As PLAT/tPA mediates proteolysis of IGFBP3, we investigated the amount of IGF1 in serum of ischemic mice with or without PLAT/tPA treatment (). As expected, thrombolysis increases free IGF1 at both 1 h (+4.13 ng/ml, ) 24 h (+7.01 ng/ml, ) compared to non-thrombolysed animals at the same time points. Surprisingly, thrombolysis by PLAT/tPA increases also the concentration of the serum total IGF1 (). However, after analyzing the ratio between total and free IGF1, this increase in free IGF1 over time in PLAT/tPA -treated mice was no more significant, whereas we confirmed that thrombolysis increases the bioavailability of IGF1 in mice serum at both 1 and 24 h ().
PLAT/tPA cleaves IGFBP3 in humans following cerebral ischemia
With a translational prospective, we decided to investigate in clinic the effect of thrombolysis on serum levels of IGFBP3. In 5 acute stroke patients eligible for intravenous thrombolysis ( for the clinical parameters), we measured baseline levels of serum IGFBP3 at 1, 2, and 24 h following PLAT/tPA injection (0.9 mg/kg). We found that IGFBP3 is decreased at 1 h and recover with time (); confirming that thrombolysis by PLAT/tPA is also responsible for IGFBP3 cleavage in human.
Table 2. Clinical parameters of the five acute stroke patients eligible for intravenous thrombolysis
Discussion
Our study gives new important insight into the neuroprotective mechanisms of PLAT/tPA in cerebral ischemia. We showed first that autophagy and its upstream pathways are strongly activated in neurons in vitro during ischemia and in vivo after thromboembolic stroke and that PLAT/tPA treatment is associated with a reduction in autophagy in ischemic conditions. Second, we demonstrated that PLAT/tPA decreases autophagy through IGF1R activation and MTORC1 phosphorylation, a key inhibitor of autophagy. Finally, we showed that, to mediate its effects on IGF1R, PLAT/tPA degrades IGFBP3, the main inhibitor of IGF1, thus increasing its bioavailability. This is particularly true with thrombolysis by PLAT/tPA in stroke patients, where we show a drop of IGFBP3, opening new therapeutic approaches for the disease.
Using RNA sequencing in hypoxic neurons, we found a strong modulation of the major genes controlling autophagy and its upstream and downstream pathways. We validated this in vitro by using different pharmacological approaches. We found that OGDreox-induced autophagy is due to a drop of both MAPK/ERK and AKT signaling, and a decrease of phospho-MTORC1. OGDreox also decreases the phosphorylation of MTORC2, a complex between MTOR and Rictor that activates and phosphorylates AKT at Ser473 to promote cell survival [Citation32,Citation33]. MTORC2 could then indirectly activate MTORC1 through AKT.
Autophagy has often been associated with cell death during cerebral ischemia [Citation5,Citation34–37]. We have previously clearly demonstrated the role of enhanced autophagy in KaHx-induced neuronal death [Citation12] (Figure S3). In the present study, the protective effect of E64d-PepA () and chloroquine (Figure S1) also demonstrates a direct implication of autophagy in neuronal death. The presence of PLAT/tPA is neuroprotective and alleviates the deregulation of the autophagic pathways during OGDreox () and in KaHx (Figure S3). We found that PLAT/tPA is able to decrease autophagy by increasing the phosphorylation of MTORC1, through the activation of the PI3K-AKT pathway.
It has been suggested that some PLAT/tPA neuroprotection could be dependent on MTOR. In non-stressed postnatal neurons, PLAT/tPA has been shown to promote survival mainly by activating the MTOR cascade as its effect was reversed by rapamycin, an MTOR inhibitor [Citation8]. Similarly, Wu and collaborators have shown, in an OGD model, that PLAT/tPA can decrease neuronal cell death by mediating MTOR-dependent glucose recapture though SLC2A3/GLUT3 [Citation9]. However, these studies did not investigate autophagy. Here, we report that PLAT/tPA can directly activate MTORC1 phosphorylation and decrease autophagosome formation and autophagy degradation.
It is well known that IGF1R can regulate autophagy through the PI3K-AKT/MTOR pathway [Citation38–40]. Here we show that the serine protease PLAT/tPA is able to mediate the activation of IGF1R/PI3K-AKT/MTOR. We identified IGF1R as the receptor responsible for the PLAT/tPA -dependent decrease of autophagy activation and subsequent neuronal death in vitro in OGD, and in vivo in a mouse model of stroke. The natural ligand of IGF1R is IGF1, that has been shown to be neuroprotective in many models of stroke [Citation41]. Similarly, injections of circulating IGF1 are able to mediate neuroprotection in a rat stroke model, validating IGF1R as a promising target [Citation42].
Six IGFBPs are known to inhibit the activity of IGF1, and almost 99% of the circulating IGF1 is complexed with IGFBPs, and more particularly to IGFBP3 [Citation43]. After cerebral ischemia, the serum level of IGF1 and IGFBP3 is decreased [Citation44], probably because their secretion is regulated by growth hormones [Citation45]. At the cellular level, IGFBP3 controls the bioavailability and the half-life of IGF1, by preventing its binding to IGF1R [Citation46–48]. IGFBP3 can be cleaved by many proteases such as plasmin, thrombin and MMPs [Citation49,Citation50]. Interestingly it has already been suggested that PLAT/tPA, as well as uPA, are capable to cleave circulating IGFBP3 during pregnancy [Citation51]. In our study, we demonstrate that PLAT/tPA can directly cleave IGFBP3 in vitro and in vivo during ischemia, resulting in an increase of free circulating IGF1. Through the cleavage of IGFBP3, PLAT/tPA can modulate IGF1R signaling. This is the first time that a direct link between PLAT/tPA and IGF1R is described. Interestingly both are expressed in the brain parenchyma and are involved in many responses including brain development [Citation52,Citation53], neuronal survival following hypoxia [Citation7,Citation54], inflammation [Citation55–57], tissue remodeling after an ischemic lesion [Citation42,Citation58] and BBB integrity [Citation59–61].
Overall, we show here that the thrombolytic drug PLAT/tPA degrades IGFBP3 in the blood of mice and human stroke patients, leading to an increase of free IGF1 and the activation of IGFR. This activates the PI3K-AKT signaling and MTOR phosphorylation to decrease the enhancement of autophagic flux and its toxic effects. Our study demonstrate a new function of the serine protease PLAT/tPA and highlight the IGFR/PI3K/MTOR pathway as a potential therapeutic pathway to decrease deleterious enhanced autophagy following cerebral ischemia.
Materials and methods
Reagents
Dulbecco’s modified eagle’s medium (DMEM; D0819), poly-D-lysine (P7280), cytosine β-d-arabinoside (C1768), fetal bovine serum (H7524), horse serum (H1270), D-glucose (G8644), Tween 20 (P9416), phosphatase inhibitor cocktail (P2850), protease inhibitor cocktail (P2714), Triton X-100 (T8787) paraformaldehyde, picropodophyllotoxin (T9576), wortmannin (W1628), AKT1/AKT2 kinase inhibitor (A6730), isopropyl b-D-1-thiogalactopyranoside (IPTG; 16768), E64d (E8640), aprotinin (A6130), human recombinant IGFBP3 (I5278) and TRI reagent (93289) were from Sigma-Aldrich. Glutamine (25030123), laminin (23017015), glucose-free DMEM (A1443001) and Pierce ECL Plus (32209) were purchased from Thermo Fisher. AG1478 (N-(3-chlorophenyl)-6,7-dimethoxy-4-quinazolinanine hydrochloride; 1276) and chloroquine (4109) were from Tocris; Bicinchoninic acid assay (BCA Protein Assay kit; 23225) was from Pierce; human recombinant PLAT/tPA (actilyse®) was from Boehringer Ingelheim; and MAPK1/ERK2-MAPK3/ERK1 inhibitor (SCH772984) was from Selleckchem. Human recombinant IGF1R (291-G1) was purchased from Bio-Techne. Pepstatin A (ALX-260-085) was purchased from Enzo Life Sciences.
Primary neuronal cell culture for Oxygen and glucose deprivation model
Primary cultures of cortical neurons were prepared from fetal mice (embryonic day 14) as previously described [Citation62]. Briefly, cells were cultured on individual glass bottom Petri dishes (MatTek Corporation, P35G) or 24-well plates, previously coated with poly-d-lysine (0.1 mg/ml) and laminin (0.02 mg/ml), in DMEM supplemented with 5% fetal bovine serum, 5% horse serum and 1 mM glutamine. Cultures were maintained at 37°C in a humidified 5% CO2 atmosphere. Cytosine β-D-arabinoside (10 μM) was added after 3 days in vitro (DIV) to inhibit glial proliferation in the 24-well plates.
Oxygen and glucose deprivation (OGD)
Neuronal cultures (12 DIV) were subjected for 1 h to OGD in a hypoxic chamber (AWEL International, Ruskinn InvivO2 500) programmed at 0.2% O2, 5% CO2 and 37°C in glucose/serum-free deoxygenated DMEM. Cortical neurons are treated with PLAT/tPA and/or inhibitors in the hypoxic chamber, at the beginning of OGD. For reoxygenation, D-glucose (4.5 mg/l) is added in cell media under normoxic conditions. Controls were subjected to sham washes.
Primary neuronal cell culture for kainate/hypoxia model
Primary cultures of cortical neurons were prepared from 2-day-old Sprague-Dawley rat pups (from Janvier) in accordance with the Swiss Laws for the protection of animals as previously described [Citation63] and the procedures were approved by the Vaud Cantonal Veterinary Office. Dissociated neurons were plated on poly‐D‐lysine pre‐coated 6 wells or 12 wells in neurobasal medium supplemented with 2% B27, 0.5 mM L-glutamine and 100 μg/ml penicillin-streptomycin. For PI staining, neurons were plated on poly‐D‐lysine pre‐coated 12-mm glass coverslips (Electron microscopy Sciences, 72294–02). Primary neuronal cultures were maintained at 37°C with a humidified 5% CO2-containing atmosphere and experiments were performed after 11–13 DIV. These cultures contain around 15% of non-neuronal cells (MAP2 or RBFOX3/NeuN-negative).
Kainate/hypoxia model (KaHx)
Primary cortical neurons were subjected to a hypoxic/excitotoxic stimulus by combining kainate treatment (Ka, 30 μM) with hypoxia performed in a sealed modular incubator chamber (Billups-Rothenberg, MIC-101) that had been flushed for 5 min with a gas mixture at 6% oxygen, as previously described [Citation12]. KaHx stimulation was performed for 30 min in bicarbonate-buffered saline (BBS) solution (116 mM NaCl, 5.4 mM KCl, 0.8 mM MgSO4, 1 mM NaH2PO4, 26.2 mM NaHCO3, 0.01 mM glycine, 1.8 mM CaCl2, pH 7.4) containing 4.5 mg/mL glucose and previously deoxygenated for 1 h in the hypoxic chamber. At the end of KaHx stimulation, BBS was replaced with the reserved neurobasal medium. For control stimulation, primary cortical neurons were subjected to 30 min in normoxic BBS.
RNA sequencing
Three RNA-seq libraries per population (three biological replicates) were prepared using the TruSeq Stranded mRNA sample Prep kit (Illumina) and sequenced on an Illumina GAIIx sequencer as 75 bp paired reads by Hybrigenics-Helixio (Clermont-Ferrand, France). Samples were quantified with Qubit 2.0 Fluorometer (Thermo Fischer) and checked with Nanodrop ND-1000 (Thermo Fisher). Libraries were prepared with three kits: NEBNext Ultra II Directional Library prep Kit (New England Biolabs, E7760), NEBNext Poly(A) mRNA Isolation Module (New England Biolabs, E7490) and NEBNext Multiplex Oligos (New England Biolabs, E7140). Sequencing was done with NextSeq 500 (Illumina). Data were processed with Bcl2fastq (Illumina). Raw data were checked with FastQC (Babraham Institute). Reads were mapped on reference genome (GRCm38, release 91) with TopHat (https://ccb.jhu.edu/software/tophat) and differential expression analysis is done with Cuffdiff (Cufflinks suite, https://github.com/cole-trapnell-lab/cufflinks). IT performs tests between supplied conditions. FPKM values were calculated for each transcript in each sample (geometric library normalization, pooled dispersion method). IT uses the reference annotation GTF file (GRCm38, release 91) and quantitates the expression values and differential regulation across BAM files. CummeRbund (https://bioconductor.org/packages/release/bioc/html/cummeRbund.html) R package is designed to process global statistics and quality control. Pie charts and heatmaps were generated using MATLAB 2020.
Neuronal death
Neuronal death was quantified 4 h after reoxygenation by measuring the LDH (lactate dehydrogenase) activity released from damaged cells into the bathing medium with a cytotoxicity detection kit (Roche Diagnostics, 91963). For KaHx experiments, neuronal death was measured by both LDH assay using the Cytotox 96 nonradioactive cytotoxicity assay kit (Promega, G1780) and quantification of the number of propidium iodide (PI)-positive nuclei as previously described [Citation12]. For PI-staining, cortical neurons on coverslips were washed and incubated for 5 min in 5 µg/ml PI (Sigma-Aldrich, P4170) diluted in PBS (Sigma, 14190144) containing 1 mM MgCl2. After PBS washes neurons were fixed in 4% paraformaldehyde in 0.1 M PBS (pH 7.4) for 15 min. After a Hoechst staining, coverslips were mounted with FluorSave (Calbiochem, 345–789-20) and images were taken using a Zeiss Axioplan 2 imaging microscope.
Construction and production of recombinant PLAT/tPA
WT PLAT/tPA and ΔEGF PLAT/tPA, rat PLAT/tPA sequence signal (aa 1–32) were amplified from the full-length Rattus norvegicus PLAT/tPA cDNA (Swiss-prot accession P19637) using the upstream primer 5′-CGGCTAGCATGAAGGGAGAGCTGTTG-3′ and the downstream primer 5′-GCGGATCC-GTGATGGTGAT-GGTGATGCCGA-GCTCCTCTTCT-3′, thus including the NheI and BamHI restriction sites, respectively, and a 6xHis tag just before the BamHI site. PCR products were digested and inserted into the eukaryotic expression system pcDNA5/FRT. Coding sequence for mature rat WT PLAT/tPA and ΔEGF PLAT/tPA proteins were amplified from the same PLAT/tPA cDNA sequence by using the appropriate primers. Deletion of the EGF domain was obtained by fusing the PCR product corresponding to the finger and K1 domains of PLAT/tPA with the PCR product corresponding to the protease domain of PLAT/tPA. PCR products were inserted into pcDNA5/FRT plasmid between the BamHI and XhoI restriction sites. The various plasmids obtained were systematically checked by automated sequencing (GATC-Biotech, Ebersberg). 293 HEK FlpIn Cells (Invitrogen, R75007) were then transfected using Lipofectamine 2000 and positive clones were isolated using a 300 µg/ml hygromycin B (Sigma-Aldrich, H3274) selection. Supernatants containing PLAT/tPA -related muteins were harvested and the proteins of interest purified on a nickel affinity matrix (Qiagen, 30210) as described by the manufacturer. Elimination of imidazole was performed by overnight dialysis against 0.5 M ammonium bicarbonate buffer. After concentration using Amicon Ultra (cutoff, 10 kD; Millipore, UFC5010), recombinant proteins were subjected to zymography to assess their enzymatic activity and confirm their molecular mass.
Immunoblotting
Cells and tissues were dissociated in ice-cold TNT buffer (50 mM Tris-HCl, pH 7.4, 150 mM NaCl, 0.5% Triton X-100, phosphatase and protease inhibitors cocktails) and centrifuged (12,000 g, 4°C, 15 min). Protein concentration was measured by BCA Protein Assay method, before migration on an SDS-PAGE gel (Bio-Rad) and a transfer onto a polyvinylidene difluoride membrane. Membranes were blocked with PBS+0.1% Tween 20, 5% milk and incubated overnight at 4°C in blocking buffer containing primary antibodies. The following primary antibodies and dilutions were used: rabbit anti-MTOR (1:1000; Cell Signaling Technology, 2983), rabbit anti-phospho-MTOR Ser2448 (1:1000; Cell Signaling Technology, 2971), rabbit anti-phospho-MTOR Ser2481 (1:1000; Cell Signaling Technology, 2974), rabbit anti-AKT (1:1000; Cell Signaling Technology, 9272), rabbit anti-phospho/AKT Ser473 (1:1000; Cell Signaling Technology, 9271), rabbit anti-ULK1-ULK2 (1:1000; Cell Signaling Technology, 8054), rabbit anti-phospho-ULK1-ULK2 Ser757 (1:1000; Cell Signaling Technology, 6888), rabbit anti- MAPK/ERK p44/42 (1:1000; Cell Signaling Technology, 9102), rabbit anti-phospho-MAPK/ERK p44/42 (Thr202/Tyr204, 1:1000; Cell Signaling Technology, 9101), mouse anti-SQSTM1/p62 (1:1000; Abcam, ab56416), goat anti-IGFBRP3 (1:1000; Abcam, ab77635), rabbit anti-LC3B (1:1000; Sigma-Aldrich, L7543), mouse anti-ATG5 (1:1000; Santa Cruz Biotechnology, sc-133158), mouse anti-ATG7 (1:1000, Santa Cruz Biotechnology, sc-376212). Membranes were then incubated with the corresponding peroxidase-conjugated secondary antibodies (1:25000–50000; Sigma-Aldrich, A0545 and A9917) in blocking buffer, and visualized with an enhanced chemiluminescence Pierce ECL Plus kit.
For KaHx experiments, primary cortical neurons were collected in lysis buffer (20 mM HEPES, pH 7.4, 10 mM NaCl, 3 mM MgCl2, 2.5 mM EGTA, 0.1 mM dithiothreitol, 50 mM NaF, 1 mM Na3VO4, 1% Triton X-100) (reagents from Sigma-Aldrich), and a protease inhibitor cocktail (Roche, 11873580001). After a brief sonication, protein concentration was measured by a Bradford assay and proteins were separated by SDS PAGE, transferred on nitrocellulose membrane and analyzed by fluorescent immunoblotting. Primary antibodies were diluted in blocking buffer solution (0.1% casein [Sigma-Aldrich, C8654], 0.2% PBS, dH2O, 0.02% sodium azide). The following primary antibodies were used: mouse anti-ACTB (1:2000; Invitrogen, MAS-11869), rabbit anti-LC3 (1:1000; Abcam, ab48394) and rabbit anti-SQSTM1/p62 (1:2000; Sigma, P0067). Membranes were then incubated with the corresponding Dy light-conjugated secondary antibodies (1:10000; Cell Signaling Technology, 7074–7076). The Odyssey Infrared Imaging System (LI-COR) was used to analyze protein bands using Odyssey v1.2 software (LI-COR).
mRFP-GFP-LC3 plasmid transfection and quantification
Rat primary cortical neuronal cultures on 12-mm coverslips were transfected using Lipofectamine 2000 (Invitrogen, 11668–019) as described previously [Citation64]. Two-thirds of the medium was removed and replaced for 5 h by freshly prepared Neurobasal medium (Life Technologies, 21103–049) plus transfection mix (3 μg of DNA for 6 μl of Lipofectamine) with the tandem mRFP-GFP-LC3-expressing plasmid ptf LC3 (Addgene, 21074; deposited by Tamotsu Yoshimori), allowing the distinction between acidic (GFP− RFP+) and nonacidic (GFP+ RFP+) LC3-positive structures. One day after transfection, cortical neurons were subjected to KaHx in the presence of absence of PLAT/tPA (300 nM), then washed in PBS MgCl2, fixed for 15 min in 4% paraformaldehyde in PBS and finally stained with Hoechst (2 µg/ml for 5 min). Coverslips were then mounted in FluorSave (Calbiochem, 345–789-20). Confocal images were acquired using a Zeiss LSM 780 Meta confocal laser scanning microscope (Carl Zeiss). Signals were sequentially visualized in the same section with acquisition performed in separated mode. Images were processed with Zen software (Carl Zeiss) and mounted using Adobe Photoshop 10.0 (Adobe Systems). Total LC3-positive dots (GFP+ RFP+ and GFP− RFP+ dots), early autophagosomes (GFP+ RFP+ dots) and autolysosomes (GFP− RFP+ dots) were analyzed using ImageJ software and expressed as a number of positive dots per neuron per μm2.
Construction and production of lentivirus
The pGFP-LC3 (Addgene, 21074; deposited by Tamotsu Yoshimori) [Citation65] was cloned in the pENTR4 entry vector (Invitrogen, K253520). The GFP-LC3 was then transferred with the LR clonase recombination system in the SIN-cPPT-PGK-gateway vector-WPRE [Citation66] to generate the SIN-cPPT-PGK-GFP-LC3-WPRE plasmid. The lentiviral vector was produced in 293 T cells with a four-plasmid system, concentrated by ultracentrifugation and resuspended in PBS containing 1% bovine serum albumin (BSA; A9418) as previously reported [Citation67]. Primary cortical neurons were infected at DIV2 and OGD is performed at DIV12 as described below.
Immunocytochemistry
After a brief wash in PBS, neuronal cultures grown on glass bottom Petri dishes were fixed during 5 min in 0.1 M PBS containing 4% paraformaldehyde and 5% sucrose. After PBS washes, cells were blocked for 1 h in PBS-Tween 20 0.1% containing 2% BSA and then incubated overnight at 4°C in blocking buffer containing primary antibodies (chicken anti-GFP, 1:1000; Abcam, ab13970; and mouse anti-RBFOX3/NeuN, 1:800, Millipore, MAB377). Primary antibodies were revealed using FITC or Alexa Fluor 647-coupled secondary F(ab’)2 (1:800; Jackson ImmunoResearch, 715–606-150). Confocal laser-scanning microscopy was performed using a Leica SP5 confocal microscope (Leica Microsystems SAS).
Surface Plasmon Resonance
All SPR binding experiments were performed on BIACORE T200 instrument (GE Healthcare) at 25°C. Human recombinant IGF1R at 20 μg/mL in 5 mM maleate buffer pH 5, was immobilized at 1000 RU by THIOL coupling procedure (according to recommendations and kits from GE Healthcare, BR-1005-57). PLAT/tPA actilyse, WT PLAT/tPA and ΔEGF PLAT/tPA were injected at 10, 5, 2.5, 1.25 and 0.625 µM in a kinetic titration series (Single Cycle Kinetics) at a flow rate of 30 μL/min for a contact time of 120 s, followed by a dissociation time of 10 min. The regeneration between each SCK cycle has been realized by a 30-s injection of 1 M ethanolamine pH 8. All SPR data processing and analyses were performed using BiaEvaluation software 4.1 (GE Healthcare). The SPR response as a function of time, namely the sensorgram, was then fitted globally or at the steady state by using a 1:1 binding model.
IGFBP3 cleavage
Human recombinant IGFBP3 (300 nM) was incubated in the presence or not of equimolar human recombinant PLAT/tPA (300 nM). The reaction was carried out at 37°C in PBS + 1% BSA. After 15 min, 1 h, 2 h or 4 h of incubation. Samples were then analyzed to SDS/PAGE and western blotting probed with anti-IGFBP3 antibody.
IGFBP3 dosage
Enzyme-linked immunosorbent assay (ELISA) was used to measure cell culture media concentrations of mouse IGFBP3 (Bio-Techne, MGB300). Assays were performed according to the manufacturers’ instructions. Each sample was analyzed in duplicate and the mean of the two values was used.
Animals
All the experiments were approved by the French ministry of education and research (agreement numbers: #18,344). The animal investigations were performed under the current European directive (2010/63/EU) as incorporated in national legislation (Decree 87/848) and in authorized laboratories (GIP Cyceron; approval n° E14118001). Experiments were performed on groups of male mice (urss) weighing 25–40 g aged of 8–12 weeks. All animals were housed under standard conditions with a 12 h light/dark cycle.
Middle Cerebral Artery occlusion (MCAo) and PLAT/tPA (actilyse) treatment
Mice were separated in two groups: vehicle group (n = 10) and PLAT/tPA group (n = 9). Animals were anesthetized with isoflurane 5% and maintained with 2% isoflurane in a 70%-30% mixture of N2O/O2. Rectal temperature was controlled and maintained at 37 ± 0.5°C throughout the surgical procedure using a heating pad. Once placed in the stereotactic frame, a catheter was placed in the tail vein of mice, to allow intravenous injection. Then, the skin between the right eye and ear was incised, the middle cerebral artery (MCA) was exposed through a small craniotomy and the dura was excised. A micropipette filled with purified murine alpha-thrombin (0.05 mg; Stago BNL) was introduced into the MCA lumen, and 1 µL of thrombin (1UI) was injected to induce in situ clot formation. The pipette was removed 10 min post occlusion (time required for clot stabilization). The fibrinolytic (Actilyse® 10 mg/kg 10% bolus, 90% perfusion for 40 min) or the control vehicle (saline) was injected 20 min after MCAo in the tail vein. Physiological parameters were recorded by the MouseOxPlus® system (Starr Life Sciences) and blood pressure values were assessed by the tail-cuff system BP-2000 Bioseb system® (Visitech Systems). Surgeries and treatments were randomized and performed blind. A sample of blood for serum purification was collected 1 h and 24 h after the end of PLAT/tPA or vehicle injection.
Serum assays
After blood collection, tubes are put 1 h at room temperature to promote coagulation. Then, serum is separated by two centrifugations at 1500 g for 15 min at room temperature, and stored at 80°C until total IGFBP3, IGF1 and free IGF1 were measured. ELISAs were used to measure serum concentrations of mouse IGFBP3 (Bio-Techne, MGB300), mouse total IGF‐I and mouse free IGF‐I (Biosynex, AL136-AL137). Assays were performed according to the manufacturers’ instructions.
Perfusion
Animals were deeply anesthetized with isoflurane 5%, and thereafter maintained with 2.5% isoflurane in a 70%-30% mixture of N2O/O2. A transcardial perfusion was performed with ice cold 0.9% NaCl heparinized. Brains were removed and ipsilateral cortex are collected and stored at −80°C immediately until processing.
Magnetic resonance imaging
Experiments were carried out on a Pharmascan 7 T/12 cm system using surface coils (Bruker). T2-weighted images were acquired 24 h after cerebral ischemia using a multislice multiecho sequence: TE/TR 33 ms/2500 ms. Lesion sizes were quantified on these images using ImageJ software. T2*-weighted sequences were used to control if animals underwent hemorrhaging events. Two-dimensional time-of-flight angiographies (TE/TR 12 ms/7 ms) were acquired and analyses of the MCA angiogram were performed to control the spontaneous recanalization of the arteries of the mice.
Functional recovery assessment
Functional recovery was assessed using the grip strength test (BIOSEB). Mice, holding by the tail, were dropped on a T-like-bar and gently removed by the experimenter. In this context of unilateral (right) ischemic lesion due to stroke, the individual strength of each forepaw was assessed with a wrench connected to the device, while a fake wrench (unconnected to the electronic device) was placed on the other side. To obtain the mean strength, 5 assays per mouse were performed to reduce variabilities with 1 min of rest between each assay. Data were assessed in grams. Measurements were picked up the day before MCAo surgery (baseline acquisition) and 24 h after MCAo surgery, ratio between the two values is calculated in order to normalize each mouse with its own baseline values.
Human patient study
Human study protocol (PR[AG]154/2004 and PR[AG]157/2011) was approved by the local ethics committee at Hospital Universitari Vall d’Hebron, and all patients or relatives gave written informed consent. The study was performed in accordance with the ethical standards as laid down in the 1964 Declaration of Helsinki and its later amendments. The study included 5 patients with an acute ischemic stroke and a proximal occlusion of the middle cerebral artery occlusion documented by transcranial Doppler (TCD) admitted to the Emergency Department who received PLAT/tPA in a standard 0.9-mg/kg dose (10% bolus, 90% continuous infusion for 1 h) within 3 h of symptom onset.
A clinical examination was performed on admission, after PLAT/tPA infusion and at 24 h from symptom onset and at discharge. Stroke severity and neurological outcome were assessed using the National Institutes of Health Stroke Scale (NIHSS). TCD assessments were performed by an experienced neurologist using a Multi-Dop® X4 (DWL Elektroniche Systeme GmbH, Sipplingen) device as previously described 29, to assess recanalization.
Serial extractions were performed to test the effect of treatment on IGFBP3, peripheral blood samples were drawn in all five patients at study entry (prior to t-PA administration) at 1 h and 2 h after PLAT/tPA infusion and at 24 h after stroke onset to obtain a temporal profile after therapy. SST tubes were used to collect the blood, and serum was immediately separated by centrifugation at 1500 g for 15 min at 4°C, and stored at 80°C until IGFBP-3 was measured.
IGFBP-3 was measured using two ELISAs (RayBiotech, ELH-IGFBP3-1). Serum samples were diluted at 1:300, and the assay was performed according to manufacturer’s instructions. Each sample was analyzed in duplicate and the mean of the two values was used. The mean intra-assay coefficient of variation was < 15% in all cases. And inter-assay variation was determined testing two times in each plate a sample from one patient, and it was < 15%.
Statistics
Statistical analyses were performed using GraphPad Prism 8.0.2 software. Results are represented as mean ± S.E.M. The distribution was assessed by the D’agostino Pearson normality test. When data were normally distributed, Student’s t-tests were used to compare two conditions. When analysis of the data sets via parametric approaches turned out to be inappropriate due to violation of residual normality, non-parametric approaches where used (Mann-Whitney’s U-tests for independent samples). An alpha level of p < 0.05 was used for determination of significance in all statistical tests; all tests are two tailed.
For KaHx experiments if the data were normally distributed, one-way ANOVA was done followed by a Tukey’s multiple comparison test. If values were not normally distributed, the non-parametric equivalent Kruskal-Wallis test was used followed by a Dunn’s multiple comparison test.
Supplemental Material
Download MS Word (2.5 MB)Acknowledgments
This work was supported by the INSERM (French National Institute for Health and Medical Research), the French Ministry for Research and upper Education, the Caen-Normandy University, the RHU project Marvelous (16-RHUS-0009), the ENTRAIN Marie Sklodowska-Curie Innovative Training Network, Fonds Européens de Développement Economique et Régional (FEDER) Normandie and AIRC IG n. 15572 to PC. J.P. is supported by grants from the Swiss National Science Foundation (310030-163064 and 310030-182332).
Disclosure statement
No potential conflict of interest was reported by the author(s).
Supplementary material
Supplemental data for this article can be accessed here.
References
- Feigin VL, Nichols E, Alam T. Global, regional, and national burden of neurological disorders, 1990-2016: a systematic analysis for the global burden of disease study 2016. Lancet Neurol. 2019;18:459–480.
- Thiebaut AM, Gauberti M, Ali C, et al. The role of plasminogen activators in stroke treatment: fibrinolysis and beyond. Lancet Neurol. 2018;17:1121–1132.
- Berkhemer OA, Fransen PS, Beumer D, et al. A randomized trial of intraarterial treatment for acute ischemic stroke. N Engl J Med. 2015;372:11–20.
- Tissue plasminogen activator for acute ischemic stroke. The national institute of neurological disorders and stroke rt-PA stroke study group. N Engl J Med. 1995;333:1581–1587.
- Thiebaut AM, Hedou E, Marciniak SJ, et al. Proteostasis during cerebral Ischemia. Front Neurosci. 2019;13:637.
- Jung CH, Jun CB, Ro SH, et al. ULK-Atg13-FIP200 complexes mediate mTOR signaling to the autophagy machinery. Mol Biol Cell. 2009;20:1992–2003.
- Louessard M, Bardou I, Lemarchand E, et al. Activation of cell surface GRP78 decreases endoplasmic reticulum stress and neuronal death. Cell Death Differ. 2017;24:1518–1529.
- Grummisch JA, Jadavji NM, Smith PD. tPA promotes cortical neuron survival via mTOR-dependent mechanisms. Mol Cell Neurosci. 2016;74:25–33.
- Wu F, Wu J, Nicholson AD, et al. Tissue-type plasminogen activator regulates the neuronal uptake of glucose in the ischemic brain. J Neurosci. 2012;32:9848–9858.
- Wu F, Echeverry R, Wu J, et al. Tissue-type plasminogen activator protects neurons from excitotoxin-induced cell death via activation of the ERK1/2-CREB-ATF3 signaling pathway. Mol Cell Neurosci. 2013;52:9–19.
- Klionsky DJ, Abdel-Aziz AK, Abdelfatah S, et al. Guidelines for the use and interpretation of assays for monitoring autophagy (4th edition). Autophagy. 2021;1:1–382.
- Ginet V, Spiehlmann A, Rummel C, et al. Involvement of autophagy in hypoxic-excitotoxic neuronal death. Autophagy. 2014;10:846–860.
- Bhaskar PT, Hay N. The two TORCs and Akt. Dev Cell. 2007;12:487–502.
- Kim J, Kundu M, Viollet B, et al. AMPK and mTOR regulate autophagy through direct phosphorylation of Ulk1. Nat Cell Biol. 2011;13:132–141.
- Huang J, Manning BD. A complex interplay between Akt, TSC2 and the two mTOR complexes. Biochem Soc Trans. 2009;37:217–222.
- Carriere A, Cargnello M, Julien LA, et al. Oncogenic MAPK signaling stimulates mTORC1 activity by promoting RSK-mediated raptor phosphorylation. Curr Biol. 2008;18:1269–1277.
- Morris EJ, Jha S, Restaino CR, et al. Discovery of a novel ERK inhibitor with activity in models of acquired resistance to BRAF and MEK inhibitors. Cancer Discov. 2013;3:742–750.
- Zheng Y, Gu S, Li X, et al. Berbamine postconditioning protects the heart from ischemia/reperfusion injury through modulation of autophagy. Cell Death Dis. 2017;8:e2577.
- Echeverry R, Wu J, Haile WB, et al. Tissue-type plasminogen activator is a neuroprotectant in the mouse hippocampus. J Clin Invest. 2010;120:1269–1277.
- An J, Zhang C, Polavarapu R, et al. Tissue-type plasminogen activator and the low-density lipoprotein receptor-related protein induce Akt phosphorylation in the ischemic brain. Blood. 2008;112:2787–2794.
- Liot G, Roussel BD, Lebeurrier N, et al. Tissue-type plasminogen activator rescues neurones from serum deprivation-induced apoptosis through a mechanism independent of its proteolytic activity. J Neurochem. 2006;98:1458–1464.
- Bertrand T, Lesept F, Chevilley A, et al. Conformations of tissue plasminogen activator (tPA) orchestrate neuronal survival by a crosstalk between EGFR and NMDAR. Cell Death Dis. 2015;6:e1924.
- Lemarchand E, Maubert E, Haelewyn B, et al. Stressed neurons protect themselves by a tissue-type plasminogen activator-mediated EGFR-dependent mechanism. Cell Death Differ. 2016;23(1):123–31.
- Parcq J, Bertrand T, Montagne A, et al. Unveiling an exceptional zymogen: the single-chain form of tPA is a selective activator of NMDA receptor-dependent signaling and neurotoxicity. Cell Death Differ. 2012;19:1983–1991.
- Duan Z, Choy E, Harmon D, et al. Insulin-like growth factor-I receptor tyrosine kinase inhibitor cyclolignan picropodophyllin inhibits proliferation and induces apoptosis in multidrug resistant osteosarcoma cell lines. Mol Cancer Ther. 2009;8:2122–2130.
- Orset C, Haelewyn B, Allan SM, et al. Efficacy of Alteplase in a mouse model of acute Ischemic stroke: a retrospective pooled analysis. Stroke. 2016;47:1312–1318.
- Orset C, Macrez R, Young AR, et al. Mouse model of in situ thromboembolic stroke and reperfusion. Stroke. 2007;38:2771–2778.
- Ballard FJ, Knowles SE, Walton PE, et al. Plasma clearance and tissue distribution of labelled insulin-like growth factor-I (IGF-I), IGF-II and des(1-3)IGF-I in rats. J Endocrinol. 1991;128:197–204.
- Forbes K, Souquet B, Garside R, et al. Transforming growth factor-{beta} (TGF{beta}) receptors I/II differentially regulate TGF{beta}1 and IGF-binding protein-3 mitogenic effects in the human placenta. Endocrinology. 2010;151:1723–1731.
- Gluckman P, Klempt N, Guan J, et al. A role for IGF-1 in the rescue of CNS neurons following hypoxic-ischemic injury. Biochem Biophys Res Commun. 1992;182:593–599.
- Xu S, Savage P, Burton JL, et al. Proteolysis of insulin-like growth factor-binding protein-3 by human skin keratinocytes in culture in comparison to that in skin interstitial fluid: the role and regulation of components of the plasmin system. J Clin Endocrinol Metab. 1997;82:1863–1868.
- Guertin DA, Stevens DM, Thoreen CC, et al. Ablation in mice of the mTORC components raptor, rictor, or mLST8 reveals that mTORC2 is required for signaling to Akt-FOXO and PKCalpha, but not S6K1. Dev Cell. 2006;11:859–871.
- Jacinto E, Facchinetti V, Liu D, et al. SIN1/MIP1 maintains rictor-mTOR complex integrity and regulates Akt phosphorylation and substrate specificity. Cell. 2006;127:125–137.
- Wen YD, Sheng R, Zhang LS, et al. Neuronal injury in rat model of permanent focal cerebral ischemia is associated with activation of autophagic and lysosomal pathways. Autophagy. 2008;4:762–769.
- Wang N, Yang L, Zhang H, et al. MicroRNA-9a-5p Alleviates ischemia injury after focal cerebral ischemia of the rat by targeting ATG5-mediated autophagy. Cell Physiol Biochem. 2018;45:78–87.
- Puyal J, Vaslin A, Mottier V, et al. Postischemic treatment of neonatal cerebral ischemia should target autophagy. Ann Neurol. 2009;66:378–389.
- Xie C, Ginet V, Sun Y, et al. Neuroprotection by selective neuronal deletion of Atg7 in neonatal brain injury. Autophagy. 2016;12:410–423.
- Troncoso R, Vicencio JM, Parra V, et al. Energy-preserving effects of IGF-1 antagonize starvation-induced cardiac autophagy. Cardiovasc Res. 2012;93:320–329.
- Lin Y, Deng W, Pang J, et al. The microRNA-99 family modulates hepatitis B virus replication by promoting IGF-1R/PI3K/Akt/mTOR/ULK1 signaling-induced autophagy. Cell Microbiol. 2017;19(5).
- Wang S, Gu K. Insulin-like growth factor 1 inhibits autophagy of human colorectal carcinoma drug-resistant cells via the protein kinase B/mammalian target of rapamycin signaling pathway. Mol Med Rep. 2018;17:2952–2956.
- Kooijman R, Sarre S, Michotte Y, et al. Insulin-like growth factor I: a potential neuroprotective compound for the treatment of acute ischemic stroke? Stroke. 2009;40(4):e83–8.
- De Geyter D, De Smedt A, Stoop W, et al. Central IGF-I receptors in the brain are instrumental to neuroprotection by systemically injected IGF-I in a rat model for ischemic stroke. CNS Neurosci Ther. 2016;22:611–616.
- Kelley KM, Oh Y, Gargosky SE, et al. Insulin-like growth factor-binding proteins (IGFBPs) and their regulatory dynamics. Int J Biochem Cell Biol. 1996;28:619–637.
- Schwab S, Spranger M, Krempien S, et al. Plasma insulin-like growth factor I and IGF binding protein 3 levels in patients with acute cerebral ischemic injury. Stroke. 1997;28(9):1744–1748.
- Blum WF, Albertsson-Wikland K, Rosberg S, et al. Serum levels of insulin-like growth factor I (IGF-I) and IGF binding protein 3 reflect spontaneous growth hormone secretion. J Clin Endocrinol Metab. 1993;76:1610–1616.
- Blat C, Villaudy J, Binoux M. In vivo proteolysis of serum insulin-like growth factor (IGF) binding protein-3 results in increased availability of IGF to target cells. J Clin Invest. 1994;93:2286–2290.
- Imai Y, Moralez A, Andag U, et al. Substitutions for hydrophobic amino acids in the N-terminal domains of IGFBP-3 and −5 markedly reduce IGF-I binding and alter their biologic actions. J Biol Chem. 2000;275:18188–18194.
- Jogie-Brahim S, Feldman D, Oh Y. Unraveling insulin-like growth factor binding protein-3 actions in human disease. Endocr Rev. 2009;30:417–437.
- Booth BA, Boes M, Bar RS. IGFBP-3 proteolysis by plasmin, thrombin, serum: heparin binding, IGF binding, and structure of fragments. A J Physiol. 1996;271:E465–70.
- Fowlkes JL, Enghild JJ, Suzuki K, et al. Matrix metalloproteinases degrade insulin-like growth factor-binding protein-3 in dermal fibroblast cultures. J Biol Chem. 1994;269:25742–25746.
- Bang P, Fielder PJ. Human pregnancy serum contains at least two distinct proteolytic activities with the ability to degrade insulin-like growth factor binding protein-3. Endocrinology. 1997;138:3912–3917.
- Pasquet N, Douceau S, Naveau M, et al. Tissue-type plasminogen activator controlled corticogenesis through a mechanism dependent of NMDA receptors expressed on radial glial cells. Cereb Cortex. 2019;29(6):2482–2498.
- Nieto-Estevez V, Defterali C, Vicario-Abejon C. IGF-I: a key growth factor that regulates neurogenesis and synaptogenesis from embryonic to adult stages of the brain. Front Neurosci. 2016;10:52.
- Liu W, D’Ercole JA, Ye P. Blunting type 1 insulin-like growth factor receptor expression exacerbates neuronal apoptosis following hypoxic/ischemic injury. BMC Neurosci. 2011;12:64.
- Bake S, Selvamani A, Cherry J, et al. Blood brain barrier and neuroinflammation are critical targets of IGF-1-mediated neuroprotection in stroke for middle-aged female rats. PLoS One. 2014;9:e91427.
- Siao CJ, Fernandez SR, Tsirka SE. Cell type-specific roles for tissue plasminogen activator released by neurons or microglia after excitotoxic injury. J Neurosci. 2003;23:3234–3242.
- Flavin MP, Zhao G, Ho LT. Microglial tissue plasminogen activator (tPA) triggers neuronal apoptosis in vitro. Glia. 2000;29:347–354.
- Pu H, Shi Y, Zhang L, et al. Protease-independent action of tissue plasminogen activator in brain plasticity and neurological recovery after ischemic stroke. Proc Natl Acad Sci U S A. 2019;116:9115–9124.
- Benchenane K, Berezowski V, Ali C, et al. Tissue-type plasminogen activator crosses the intact blood-brain barrier by low-density lipoprotein receptor-related protein-mediated transcytosis. Circulation. 2005;111:2241–2249.
- Liang M, Woodard LE, Liang A, et al. Protective role of insulin-like growth factor-1 receptor in endothelial cells against unilateral ureteral obstruction-induced renal fibrosis. Am J Pathol. 2015;185:1234–1250.
- Polavarapu R, Gongora MC, Yi H, et al. Tissue-type plasminogen activator-mediated shedding of astrocytic low-density lipoprotein receptor-related protein increases the permeability of the neurovascular unit. Blood. 2007;109:3270–3278.
- Roussel BD, Mysiorek C, Rouhiainen A, et al. HMGB-1 promotes fibrinolysis and reduces neurotoxicity mediated by tissue plasminogen activator. J Cell Sci. 2011;124:2070–2076.
- Grishchuk Y, Ginet V, Truttmann AC, et al. Beclin 1-independent autophagy contributes to apoptosis in cortical neurons. Autophagy. 2011;7:1115–1131.
- Vaslin A, Puyal J, Borsello T, et al. Excitotoxicity-related endocytosis in cortical neurons. J Neurochem. 2007;102:789–800.
- Kabeya Y, Mizushima N, Ueno T, et al. LC3, a mammalian homologue of yeast Apg8p, is localized in autophagosome membranes after processing. EMBO J. 2000;19:5720–5728.
- Drouet V, Perrin V, Hassig R, et al. Sustained effects of nonallele-specific Huntingtin silencing. Ann Neurol. 2009;65:276–285.
- Hottinger AF, Azzouz M, Deglon N, et al. Complete and long-term rescue of lesioned adult motoneurons by lentiviral-mediated expression of glial cell line-derived neurotrophic factor in the facial nucleus. J Neurosci. 2000;20:5587–5593.