
ABSTRACT
Intrauterine adhesions (IUA), characterized by endometrial fibrosis, is a common cause of uterine infertility. We previously demonstrated that partial epithelial-mesenchymal transition (EMT) and the loss of epithelial homeostasis play a vital role in the development of endometrial fibrosis. As a pro-survival strategy in maintaining cell and tissue homeostasis, macroautophagy/autophagy, conversely, may participate in this process. However, the role of autophagy in endometrial fibrosis remains unknown. Here, we demonstrated that autophagy is defective in endometria of IUA patients, which aggravates EMT and endometrial fibrosis, and defective autophagy is related to DIO2 (iodothyronine deiodinase 2) downregulation. In endometrial epithelial cells (EECs), pharmacological inhibition of autophagy by chloroquine (CQ) promoted EEC-EMT, whereas enhanced autophagy by rapamycin extenuated this process. Mechanistically, silencing DIO2 in EECs blocked autophagic flux and promoted EMT via the MAPK/ERK-MTOR pathway. Inversely, overexpression of DIO2 or triiodothyronine (T3) treatment could restore autophagy and partly reverse EEC-EMT. Furthermore, in an IUA-like mouse model, the autophagy in endometrium was defective accompanied by EEC-EMT, and CQ could inhibit autophagy and aggravate endometrial fibrosis, whereas rapamycin or T3 treatment could improve the autophagic levels and blunt endometrial fibrosis. Together, we demonstrated that defective autophagy played an important role in EEC-EMT in IUA via the DIO2-MAPK/ERK-MTOR pathway, which provided a potential target for therapeutic implications.
Abbreviations: ACTA2/α-SMA: actin alpha 2, smooth muscle; AMPK: adenosine 5’-monophosphate-activated protein kinase; AKT/protein kinase B: AKT serine/threonine kinase; ATG: autophagy related; CDH1/E-cadherin: cadherin 1; CDH2/N-cadherin: cadherin 2; CQ: chloroquine; CTSD: cathepsin D; DIO2: iodothyronine deiodinase 2; DEGs: differentially expressed genes; EECs: endometrial epithelial cells; EMT: epithelial-mesenchymal transition; FN1: fibronectin 1; IUA: intrauterine adhesions; LAMP1: lysosomal associated membrane protein 1; LPS: lipopolysaccharide; MAP1LC3/LC3: microtubule associated protein 1 light chain 3; MAPK: mitogen-activated protein kinase; MTOR: mechanistic target of rapamycin kinase; Rapa: rapamycin; SQSTM1/p62: sequestosome 1; T3: triiodothyronine; T4: tetraiodothyronine; TFEB: transcription factor EB; PBS: phosphate-buffered saline; TEM: transmission electron microscopy; TGFB/TGFβ: transforming growth factor beta.
Introduction
Intrauterine adhesions (IUA) is a common uterine factor of infertility [Citation1]. Around one in five women undergoing miscarriage suffer from it [Citation2]. Its main histopathological lesion is endometrial fibrosis, which often follows curettage related to pregnancy termination or infection [Citation1]. Few interventions improve live-birth rates in endometrial fibrosis [Citation3,Citation4], indicating that in most cases the underlying mechanisms are incompletely understood. Recently we demonstrated that the partial transition of endometrial epithelial cells (EECs) to mesenchymal phenotype, a hybrid phenotype of both epithelial and mesenchymal traits, plays an important role in the pathogenesis of endometrial fibrosis in IUA [Citation5–7]. Loss of the epithelial integrity indicates the destruction of epithelial homeostasis [Citation8–10].
Macroautophagy (hereafter referred to as autophagy) is considered to play a housekeeping role in maintaining cellular homeostasis [Citation11]. After engulfing target structures into autophagosomes, they fuse with lysosomes for degradation and serve as an intracellular recycling system [Citation12]. With this mechanism, autophagy helps to eliminate misfolded proteins, damaged organelles and lipid droplets, enabling cells to function continuously and properly [Citation11]. However, whether it participates in endometrial epithelial-mesenchymal transition (EEC-EMT) and endometrial fibrosis is not known. In fact, several studies have uncovered that autophagy defect is involved in the EMT process of lung, liver and kidney fibrosis [Citation13–16]. To investigate the relationship between autophagy and EEC-EMT, we compared the transcriptome profiles between IUA and normal endometria, and identified that autophagy deficiency was evident in IUA patients and DIO2 decreased most significantly among the downregulated genes. DIO2 is a selenoenzyme responsible for the deiodination of the outer ring of pro-hormone thyroxine (T4) into bioactive T3 to maintain local thyroid metabolic homeostasis [Citation17]. In this study, we proved that autophagy deficiency in IUA patients was related to DIO2 downregulation via the MAPK/ERK-MTOR signaling pathway, which promoted EEC-EMT and endometrial fibrosis. Overexpression of DIO2 or giving its product T3 could attenuate endometrial fibrosis through restoring autophagic activity in IUA-like mice model. Collectively, our study reveals the unexpected role of autophagy and DIO2-T3 in the EEC-EMT process in IUA patients and provides insights into novel therapeutic targets.
Results
Autophagy is downregulated in endometria of IUA patients
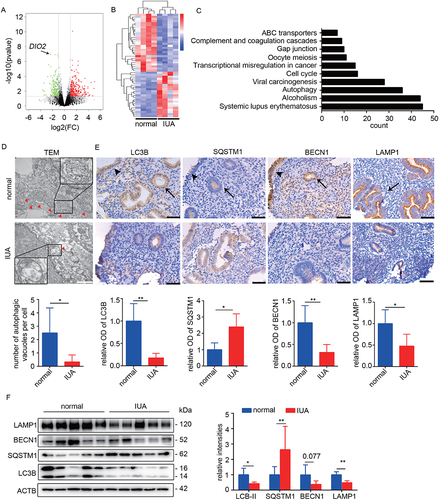
The endometrial transcriptional profiles of IUA patients and normal controls in the late proliferative phase of menstrual cycle were compared. As shown in the volcano plot (), 553 genes were differentially expressed between normal controls and IUA patients (fold change ≥ 2, P < 0.05). The hierarchical clustering analysis of top 50 differentially expressed genes (DEGs) separated into two groups (). We performed KEGG analysis of all DEGs and found that among Top10 pathways, autophagy changed significantly (). Then, the endometrial autophagy levels in IUA patients and normal controls were further analyzed. First, we used transmission electron microscopy (TEM) to analyze the number of autophagic vacuoles. The results showed that a large amount of autophagosomes existed in endometria of normal controls, which were significantly decreased in IUA patients (). Then, we analyzed the expression of autophagy-related markers. The results showed that the mRNA expression levels of LC3B and BECN1 (beclin 1) were reduced by 54.82% and 66.92% respectively in endometria of IUA patients (Fig. S1B). The protein expression levels of LC3B-II (autophagosome marker), BECN1 (autophagy activation marker) and LAMP1 (lysosomal associated membrane protein 1; early lysosome marker) were decreased by 57.04%, 62.41% and 51.04%, whereas SQSTM1/p62 protein (a receptor and degradation substrate of autophagy) was increased by a mean of 2.64-fold in IUA assessed by Western blotting (), suggesting impaired formation of autophagosome and lysosome. The results of immunohistochemical staining showed that the autophagy levels of endometrial epithelial and stromal cells in IUA patients were all reduced, but mainly in EECs ( and Fig. S1C).
Figure 1. Autophagy is downregulated in endometria of IUA patients. (A) Volcano plot of DEGs in endometria of normal controls (n = 4) and IUA patients (n = 4) based on RNA-sequencing analysis. Green dots represent downregulated DEGs and red dots represent upregulated DEGs (fold change ≥ 2, P < 0.05). (B) Heatmap showing top 50 DEGs in endometria of normal controls (n = 4) and IUA patients (n = 4). (C) Top 10 pathways based on KEGG analysis of all DEGs. (D) Top: Representative transmission electron microscopy (TEM) images of endometria of normal controls (n = 3) and IUA patients (n = 3). Arrowheads indicate autophagosomes. Scale bars: 1 μm. Bottom: Quantitative analysis of the numbers of autophagic vacuoles. (E) Top: Immunohistochemical staining of LC3B, BECN1, SQSTM1 and LAMP1 in endometria of normal controls (n = 5) and IUA patients (n = 5). Scale bars: 50 μm. Arrowhead: luminal epithelial cells; arrow: glandular epithelial cells. Bottom: Relative optical densities (OD) analyzed by Image-pro plus. (F) Left: The protein levels of LC3B, SQSTM1, BECN1 and LAMP1 in endometria of normal controls (n = 5) and IUA patients (n = 5) detected by Western blotting. Right: Relative band intensities analyzed by ImageJ. Error bars, mean ± SEM. *P < 0.05, **P < 0.01.
Alteration of autophagy affects phenotype of EECs
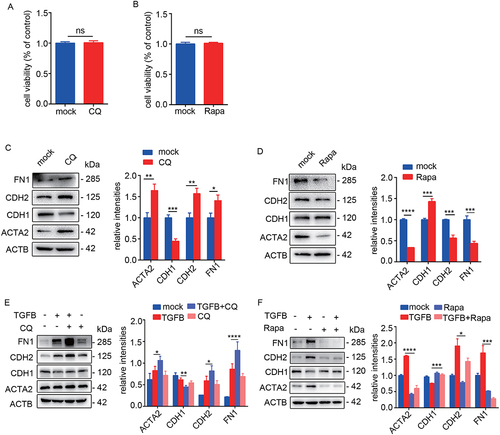
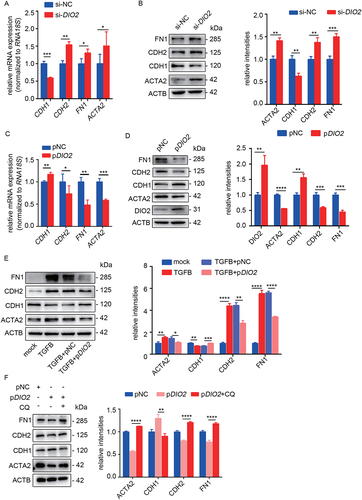
Epithelial homeostasis is critical to endometrial function and EMT plays an important role in IUA process [Citation5–7] (Fig. S1A). To investigate the relationship between epithelial autophagy and EEC-EMT, the primary EECs (>95% purity identified with cytokeratin 7 and vimentin staining as shown in Fig. S1D) were treated with CQ (50 μM, an autophagy inhibitor) or rapamycin (100 nM, an autophagy inducer) for 48 h. The cell viability was not affected by CQ or rapamycin treatment (). After inhibition of autophagy in EECs, the protein levels of mesenchymal markers (CDH2/N-cadherin, FN1 and ACTA2/α-SMA) were significantly increased and the epithelial marker (CDH1/E-cadherin) was decreased (). On the contrary, activated autophagy significantly downregulated the expression of mesenchymal markers and upregulated epithelial marker (). Then we used TGFB/TGFβ to induce EEC-EMT in combination with CQ or rapamycin. The results showed that CQ significantly enhanced EMT (CDH2, FN1 and ACTA2 increased and CDH1 decreased) (). However, rapamycin alleviated TGFB-induced EEC-EMT (CDH2, FN1 and ACTA2 decreased and CDH1 increased) ().
Figure 2. Inhibition of autophagy promotes EEC-EMT and activation of autophagy prevents EEC-EMT. (A) The cell viability in IK cells incubated with CQ (50 μM) for 48 h detected by CCK-8. (B) The cell viability in IK cells incubated with Rapamycin (Rapa, 100 nM) for 48 h detected by CCK-8. (C) Left: The protein levels of ACTA2, CDH1, CDH2, FN1 in EECs (n = 3) incubated with CQ (50 μM) for 48 h detected by Western blotting. Right: Relative band intensities analyzed by ImageJ. (D) Left: The protein levels of ACTA2, CDH1, CDH2 and FN1 in EECs (n = 3) incubated with rapamycin (Rapa, 100 nM) for 48 h detected by Western blotting. Right: Relative band intensities analyzed by ImageJ. (E) Left: The protein levels of ACTA2, CDH1, CDH2 and FN1 in EECs (n = 3) incubated with CQ in the presence of TGFB for 48 h detected by Western blotting. Right: Relative band intensities analyzed by ImageJ. (F) Left: The protein levels of ACTA2, CDH1, CDH2 and FN1 in EECs (n = 3) incubated with rapamycin in the presence of TGFB for 48 h detected by Western blotting. Right: Relative band intensities analyzed by ImageJ. Error bars, mean ± SEM. *P < 0.05, **P < 0.01, ***P < 0.001, ****P < 0.0001, ns: no significant difference.
DIO2 is related to endometrial autophagy
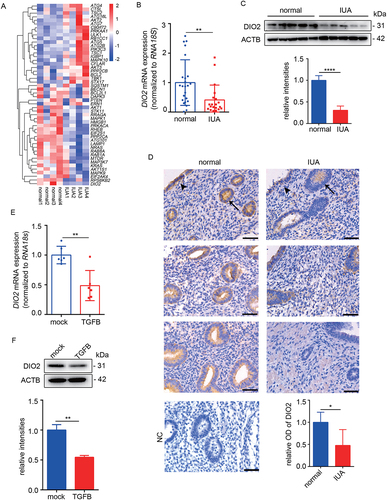
To explore the molecular mechanism underlying the reduced autophagic activity in EECs in IUA, we further analyzed autophagy-related genes based on RNA-seq. Among the downregulated genes, DIO2 decreased most significantly (). We proved this result by qRT-PCR and Western blotting and the results showed that the mRNA and protein levels of DIO2 in endometria of IUA patients were significantly decreased to 40.97% and 30.80% of normal controls ( and 3C). According to immunohistochemistry analysis, DIO2 was mainly expressed in the luminal and glandular epithelium and weakly expressed in the stroma of endometria (). Moreover, the correlation between the expression of DIO2 and autophagy-related molecules in IUA endometria was analyzed. Interestingly, the mRNA expression of DIO2 was positively correlated with LC3B (r = 0.7648) and BECN1 (r = 0.8109) (Fig. S1E and S1F). In TGFB-induced EECs, the mRNA () and protein () levels of DIO2 were also downregulated by 51.29% and 45.49% respectively in the progress of EEC-EMT.
Figure 3. DIO2 is downregulated in endometria of IUA patients. (A) Heatmap showing autophagy-related genes in endometria of normal controls (n = 4) and IUA patients (n = 4). (B) The mRNA level of DIO2 in endometria of normal controls (n = 24) and IUA patients (n = 20) measured by qRT-PCR. (C) Top: The protein level of DIO2 in endometria of IUA patients (n = 5) compared to normal controls (n = 5) by Western blotting. Bottom: Relative band intensities analyzed by ImageJ. (D) Immunohistochemical staining of DIO2 in endometria of normal controls (n = 5) and IUA patients (n = 5). Scale bars: 50 μm. Arrow head: luminal epithelial cells; arrow: glandular epithelial cells. NC: negative control of DIO2 staining. (E) The mRNA level of DIO2 in EECs (n = 3) treated with TGFB for 48 h detected by qRT-PCR. (F) Top: The protein level of DIO2 in EECs (n = 3) treated with TGFB for 48 h detected by Western blotting. Bottom: Relative band intensities analyzed by ImageJ. Error bars, mean ± SEM. *P < 0.05, **P < 0.01, ****P < 0.0001.
Studies have reported that fluctuations in serum T3 and T4 concentrations could also lead to changes in the expression of DIO2 in organs [Citation18]. In order to exclude the influence of circulating thyroid hormone levels on local DIO2 expression, we tested the serum thyroid hormones including TSH, fT3 and fT4 in normal controls and IUA patients, and the results showed no differences between two groups (). Furthermore, we examined the level of thyroid hormone in the endometrial tissues and found that the level of T3 in endometria of IUA had a downward trend (Fig. S1G), suggesting that the dysregulation of thyroid hormone metabolism took place in local endometria of IUA.
Table 1. Characteristics of the two groups.
DIO2 and T3 induce autophagic flux in EECs
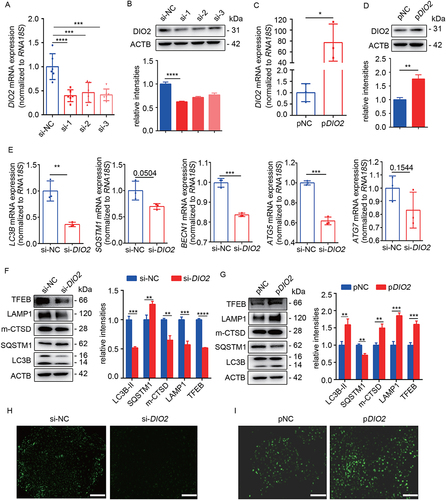
To investigate the effect of DIO2 on autophagy, we performed the overexpression and suppression of DIO2 in primary EECs. We conducted the knockdown of DIO2 through siRNA transfection, and the three interference sequences (si-1, si-2 and si-3) significantly suppressed the mRNA and protein expression of DIO2 after transfection for 48 h. Among them, si-1 was the most efficient siRNA which reduced the mRNA level to 39.75% and protein level to 61.86% ( and 4B). Therefore, we chose si-1 for the following experiments. We also transfected EECs with a plasmid containing DIO2 cDNA (pDIO2) for 48 h. Compared to control plasmids, the mRNA and protein levels of DIO2 were increased by 77.11- and 1.76-fold respectively (). After downregulation of DIO2, the mRNA levels of LC3B, SQSTM1, BECN1, ATG5 and ATG7 were decreased (). The protein level of the LC3B-II was also decreased to about 51.77% while SQSTM1 was increased by about 1.27-fold (), which suggested that autolysosomes didn’t exert effective degradation. We further examined lysosome related indicators. As shown in , the protein levels of LAMP1, mature CTSD (a principal lysosomal protease, hallmark of lysosomal maturation and degradative function) and TFEB (a key transcription factor to regulate autophagy pathway and lysosomal biogenesis) were declined to 57.34%, 65.19% and 51.91%, respectively. The DAPGreen fluorescence, representing autophagosomes and autolysosomes, was significantly reduced (). On the contrary, after overexpression of DIO2, the protein levels of LC3B-II, LAMP1, mature CTSD and TFEB were increased by about 1.59-, 1.86-, 1.5- and 1.61-fold respectively while the expression of SQSTM1 was decreased by 29.1% (), and the DAPGreen fluorescence was enhanced (). These results indicated that DIO2 promoted not only the formation of autophagosome but also the formation of lysosome and the maturation of lysosomal acid hydrolases.
Figure 4. DIO2 induces autophagic flux in EECs. (A and B) The mRNA and protein levels of DIO2 in EECs (n = 3) transfected with three different small interfering RNA sequences of DIO2 (si-1, si-2, si-3) or negative control (si-NC) for 48 h by qRT-PCR and Western blotting. (C and D) The mRNA and protein levels of DIO2 in EECs (n = 3) transfected with DIO2 plasmid (pDIO2) or control plasmid (pNC) for 48 h by qRT-PCR and Western blotting. (E) The mRNA levels of LC3B, SQSTM1, BECN1, ATG5 and ATG7 in EECs (n = 3) transfected with si-DIO2 (si-1) for 48 h detected by qRT-PCR. (F and G) Left: The protein levels of LC3B, SQSTM1, mature CTSD (m-CTSD), LAMP1 and TFEB examined by Western blotting in EECs (n = 3) after transfected with si-DIO2 and pDIO2 for 48 h. Right: Relative band intensities analyzed by ImageJ. (H and I) Representative images of DAPGreen of EECs (n = 3) transfected with si-DIO2 and pDIO2 for 48 h. Scale bars: 100 μm. Error bars, mean ± SEM. *P < 0.05, **P < 0.01, ***P < 0.001, ****P < 0.0001.
Considering that DIO2 is an enzyme converting T4 into bioactive T3 [Citation17], we further explored the role of T3 in EECs autophagic flux. We found that T3 (20 nM, 100 nM) significantly increased LC3B-II levels by about 1.36- and 1.89-fold respectively and decreased SQSTM1 levels to 81.69% and 68.79% (Fig. S2A). T3 could also upregulate the expression of LAMP1, mature CTSD, TFEB (Fig. S2B) and enhance the green fluorescence representing autophagosomes and autolysosomes (Fig. S2C). Since LC3B-II accumulation could be caused by autophagosome formation or degradation blockade [Citation19], we measured LC3B-II turnover in the presence of CQ to distinguish the above two cases. When we inhibited autophagosome-lysosome fusion by CQ, the LC3B-II levels were increased compared to control (Fig. S2D). CQ and T3 treatment significantly increased LC3B-II levels compared to T3 or CQ alone suggesting that T3 increased autophagic flux in EECs.
DIO2 prevents EEC-EMT through autophagy
To investigate the role of DIO2 in the EMT, we conducted DIO2 knockdown and overexpression in EECs and then examined the EMT-related indicators. Compared to the control group, the mRNA and protein levels of CDH2, FN1 and ACTA2 were upregulated, while the expression of CDH1 was downregulated in EECs transfected with si-DIO2 (). In contrast to the results of DIO2 downregulation, the overexpression of DIO2 prevented EECs from EMT (). Furthermore, we transfected pDIO2 into EECs pre-stimulated with TGFB for 24 h and found that the protein level of CDH1 was increased while the levels of ACTA2, CDH2 and FN1 were all reduced after pDIO2 transfection for 48 h, (). Importantly, the cytoprotective effect of DIO2 overexpression was lost in the CQ pre-treated EECs (), suggesting that DIO2 prevented EEC-EMT through autophagy induction.
Figure 5. DIO2 prevents EEC-EMT through autophagy. (A and B) The mRNA and protein levels of EMT-related genes (CDH1, CDH2, FN1, ACTA2) in EECs (n = 3) transfected with si-DIO2 or si-NC for 48 h by qRT-PCR and Western blotting. (C and D) The mRNA and protein levels of EMT-related genes (CDH1, CDH2, FN1, ACTA2) in EECs (n = 3) transfected with DIO2 plasmid (pDIO2) or control plasmid (pNC) for 48 h by qRT-PCR and Western blotting. (E) Left: The protein levels of ACTA2, CDH1, CDH2, FN1 in EECs (pre-treated with TGFB for 24 h) transfected with pDIO2 or pNC for 48 h. Right: Relative band intensities analyzed by ImageJ. (F) Left: The protein levels of ACTA2, CDH1, CDH2 and FN1 in EECs (n = 3, pre-treated with CQ) transfected with pDIO2 for 48 h detected by Western blotting. Right: Relative band intensities analyzed by ImageJ. Error bars, mean ± SEM. *P < 0.05, **P < 0.01, ***P < 0.001, ****P < 0.0001.
We further explored the role of T3 in EEC-EMT. After pre-treatment with TGFB for 24 h, the EECs were incubated with T3 (20 nM, 100 nM) for another 24 h. Compared with the TGFB-induced group, T3 could reverse the TGFB-induced EEC-EMT (Fig. S3A-S3C).
DIO2 and T3 regulate autophagy through MAPK/ERK-MTOR signaling
MTOR (mechanistic target of rapamycin kinase) is an important negative regulatory molecule of autophagy and the phosphorylation of MTOR (p-MTOR, associated with its activation) inhibits the formation of autophagosomes [Citation20,Citation21]. In order to explore the possible signaling pathway that DIO2 induced autophagy, we examined the level of p-MTOR. As shown in , downregulation of DIO2 increased the phosphorylation of MTOR without changing the level of total MTOR in EECs. However, the overexpression of DIO2 decreased the level of p-MTOR and activated autophagy. Thus, these results suggested that MTOR was a downstream target in DIO2-mediated autophagy.
Figure 6. DIO2 regulates autophagy through MAPK/ERK-MTOR pathway. (A and B) Left: The protein levels of p-MTOR and MTOR in EECs (n = 3) transfected with si-DIO2 and pDIO2 for 24 h detected by Western blotting. Right: Relative band intensities analyzed by ImageJ. (C and D) Left: The protein levels of p-MAPK/ERK, MAPK/ERK, p-AKT, AKT, p-AMPK and AMPK in EECs (n = 3) transfected with si-DIO2 and pDIO2 for 24 h detected by Western blotting. Right: Relative band intensities analyzed by ImageJ. (E) Top: The protein levels of p-MAPK/ERK, MAPK/ERK, p-MTOR and MTOR in endometria of IUA patients (n = 5) compared to normal controls (n = 5) by Western blotting. Bottom: Relative band intensities analyzed by ImageJ. (F)Top: The protein levels of p-MTOR, ACTA2, CDH1, CDH2 and FN1 in EECs (pre-treated with 5 μM U0126) transfected with si-DIO2 for 48 h. Bottom: Relative band intensities analyzed by ImageJ. Error bars, mean ± SEM. *P < 0.05, **P < 0.01, ***P < 0.001, ****P < 0.0001, ns: no significant difference.
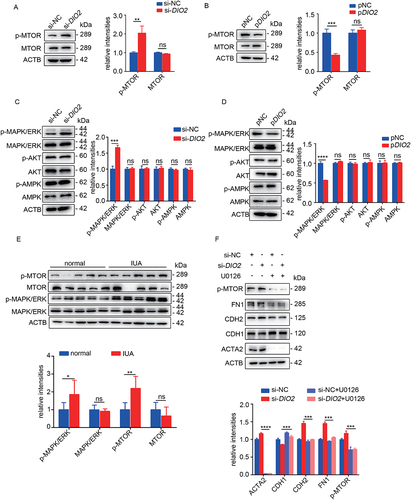
Since p-MTOR is regulated by MAPK/ERK, AKT and AMPK [Citation21], we examined the phosphorylation of MAPK/ERK, AKT and AMPK in EECs after transfecting with si-DIO2 and pDIO2. The results showed that si-DIO2 significantly induced the phosphorylation of MAPK/ERK but not AMPK and AKT, while the overexpression of DIO2 inhibited the phosphorylation of MAPK/ERK (). Importantly, as shown in , we found increased levels of p-MTOR and p-MAPK/ERK in endometria from IUA patients, which was consistent with the results obtained in EECs (). Next, U0126 (MAPK/ERK inhibitor) was employed to further ascertain the critical role of MAPK/ERK in EECs. The protein level of CDH1 was significantly increased while the levels of ACTA2, CDH2 and FN1 were significantly decreased after pre-treatment of U0126 compared with si-DIO2 group. Meanwhile, we also observed that the activation of MTOR was inhibited by pre-treatment of U0126 (). Additionally, we examined the effect of T3 on MAPK/ERK-MTOR signaling pathway and the results showed that T3 could also reduce p-MTOR by inhibiting p-MAPK/ERK to maintain autophagic activity (Fig. S4A and S4B).
Thyroid hormone (T3) improves autophagy and attenuates endometrial fibrosis in IUA murine model
To further study the role of thyroid hormone in vivo, we established a dual-damage IUA-like mice model by mechanically injuring endometria and injecting LPS as reported in the previous research [Citation5]. Compared with the sham-operated group, the IUA-like mice model had fewer endometrial glands and more collagen deposition, and EECs underwent EMT (Fig. S5A). Of note, the expression of DIO2 was significantly reduced in endometria (Fig. S5B) and the expression levels of LC3B, BECN1, CTSD and TFEB were all downregulated, while SQSTM1 was accumulated in endometria of IUA-like mice model (Fig. S5C), suggesting defective autophagy in IUA mice.
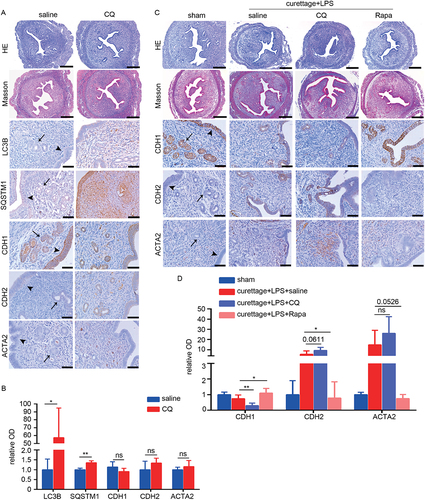
To investigate the potential role of autophagy in fibrotic endometria, we induced autophagy impairment in mice by intraperitoneal injection of CQ (60 mg/kg) for 2 weeks and then examined the effect of CQ on EMT and endometrial fibrosis. As shown in , CQ treatment blocked lysosomal degradation and thus caused accumulation of LC3B and SQSTM1. The pathological sections showed mild collagen deposition and an EMT trend (), though with no statistical significance. Then we treated IUA-like mice model induced by dual damage with CQ to further detect the effect of autophagy on endometrial fibrosis. Accompanied with CQ treatment, the expression levels of CDH2 and ACTA2 in EECs were increased, whereas of CDH1 was further declined in endometria, compared with dual damage (). However, administration of rapamycin (2 mg/kg) on IUA-like mice was effective in ameliorating dual-damage induced EEC-EMT and endometrial fibrosis (). These results indicated that impaired autophagy was a consequence of injury and could further aggravate fibrosis, while activation of autophagy could ameliorate fibrosis.
Figure 7. Pharmacological inhibition of autophagy by CQ aggravates endometrial fibrosis and activation of rapamycin ameliorates endometrial fibrosis in vivo. (A and B) The mice were divided into the following two groups: saline (intraperitoneal injection of saline, n = 4) and CQ (intraperitoneal injection of CQ, 60 mg/kg/d, 2 weeks, n = 4). (A) HE, Masson staining (scale bars of HE and Masson: 250 μm) and Immunohistochemical staining of LC3B, SQSTM1, CDH1, CDH2 and ACTA2 in endometria of mice. Scale bars: 50 μm. (B) Relative optical densities (OD) analyzed by Image-pro plus. Error bars, mean ± SEM. *P < 0.05, **P < 0.01, ns: no significant difference. (C and D) The mice were divided into the following four groups: sham operation (n = 4), curettage+LPS+saline (n = 4), curettage+LPS+CQ (60 mg/kg/d, 2 weeks, n = 4) and curettage+LPS+Rapa (rapamycin, 2 mg/kg, 2 weeks, n = 4). (C) HE, Masson staining (scale bars of HE and Masson: 250 μm) and Immunohistochemical staining of CDH1, CDH2 and ACTA2 in endometria of mice. Scale bars: 50 μm. (D) Relative optical densities (OD) analyzed by Image-pro plus. Arrow head: luminal epithelial cells; arrow: glandular epithelial cells. Error bars, mean ± SEM. *P < 0.05, **P < 0.01, ns: no significant difference.
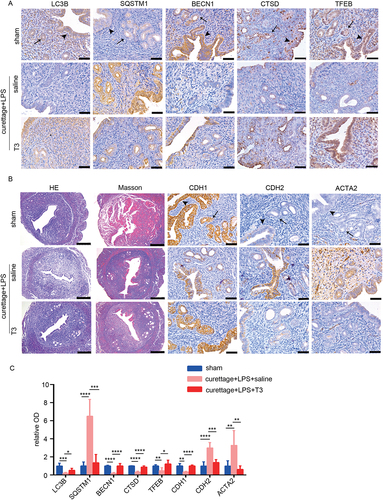
Since the main function of DIO2 is to regulate the local thyroid hormone levels and we have demonstrated the T3 activated autophagy and was anti-fibrotic in vitro, we continuously injected T3 intraperitoneally 5 days after the operation. Compared with saline administration, T3 treatment significantly promoted the expression levels of LC3B, BECN1, CTSD and TFEB, and downregulated the accumulation of SQSTM1 (), suggesting that T3 could ameliorate autophagy impairment in IUA model. Additionally, T3 attenuated endometrial fibrosis as demonstrated by Masson and IHC staining ().
Figure 8. T3 improves autophagy and attenuates endometrial fibrosis in vivo. The mice were divided into the following three groups: sham operation, curettage+LPS+saline and curettage+LPS+T3 (40 mg/kg). (A) Immunohistochemical staining of LC3B, SQSTM1, BECN1, CTSD and TFEB in endometria of mice with sham-operation (sham, n = 4), dual-damage IUA-like mice model (curettage+LPS+saline, n = 4) and IUA with T3 treatment (curettage+LPS+T3, n = 4). Scale bars: 50 μm. (B) HE, Masson staining (scale bars of HE and Masson: 250 μm) and immunohistochemical staining of CDH1, CDH2 and ACTA2 in endometria of mice. Scale bars: 50 μm. (C) Relative optical densities (OD) analyzed by Image-pro plus. Arrow head: luminal epithelial cells; arrow: glandular epithelial cells. Error bars, mean ± SEM. *P < 0.05, **P < 0.01, ***P < 0.001, ****P < 0.0001.
Discussion
In the present study, we revealed that autophagy deficiency exists in the endometria of IUA patients on multiple levels (a series of molecules at early and late stage of autophagy). Both in vitro and in vivo, inhibition of autophagy disturbed the endometrial epithelial homeostasis, contributing to EEC-EMT and endometrial fibrosis, while activation of autophagy effectively inhibited EEC-EMT and fibrosis. DIO2 (T3)-MAPK/ERK-MTOR pathway was the underlying molecular mechanism of defective autophagy in EECs. These results provide a feasible therapeutic strategy for IUA patients.
Autophagy plays an important role in maintaining endometrial homeostasis throughout the menstrual cycle [Citation22,Citation23]. Despite the dramatic changes such as proliferation, decidualization, shedding (when a woman is not pregnant) and regeneration, the endometrium keeps normal morphology in this physiological process [Citation24]. Under pathological conditions, same as studies researching autophagy in other organs [Citation25–27], contradictory studies exist in researching endometrial autophagy in endometriosis [Citation28–32]. This discrepancy was at least in part due to different sampling time points in the menstrual cycle. To avoid this caveat, in this study all the endometrial specimens were specifically taken in the late proliferative phase since physiologically endometrial epithelium in this phase has no EMT and is suitable for researching epithelial characteristics, while in the secretory phase, the epithelium undergoes abrupt and discontinuous changes frequently [Citation33]. Few studies focus on autophagy in the pathogenesis of IUA. Although recently Wei et al. reported that endometrial stromal cells in the proliferative phase of IUA patients are characterized with impaired autophagy [Citation34], it only focused on stromal cells, without connecting autophagy with EMT. Our research, conversely, confirmed the defective autophagy in both epithelia and stroma, but more obvious in epithelia ().
In searching for the underlying molecules that cause autophagy changes, we found DIO2, the most significant downregulated gene according to RNA-seq. DIO2 is the highest expressed deiodinase in endometrial tissue, and is involved in maintaining the level of local thyroid hormone in both the nonpregnant and pregnant state [Citation35,Citation36]. We demonstrated endometrial DIO2 and T3 downregulation in IUA endometria in euthyroid patients, which was different from the studies that found serum thyroid hormone abnormality (hyperthyroidism or hypothyroidism) in close relationship with fibrosis of the heart [Citation37], liver [Citation38–40], lung [Citation41–43], and kidney [Citation44].
Additionally, because DIO2 is responsible for converting local T4 to T3, we chose the more common T3 as pharmaceutic treatment. T3 is widely used in clinical practice and has been verified of its security. We showed that T3 increased autophagic flux, which was similar to its induction of autophagy in other organs [Citation43,Citation45–48]. The dose as low as 40 μg/(kg*d) of intraperitoneal injection (for dosage accuracy) of T3, 8% of the hyperthyroxinemia-inducing threshold according to previous studies [Citation49], is effective enough for inducing autophagic flux. This also indicates potential clinical application of T3 for the treatment of IUA.
Different from results in vitro, inhibition of autophagy in mice models by CQ only led to mild EMT. However, dual damage of the IUA-like mice model presented continuous decline of autophagy and severe EMT and fibrosis. This is mainly because it is injury rather than autophagy that initiates EMT and fibrogenic process. However, when mice were pre-treated with rapamycin to promote autophagy before dual damage, endometrial EMT and fibrosis were significantly alleviated, supporting an unequivocal role for autophagy in this damage-initiated process.
In this study, there are some limitations. Firstly, endometrial autophagy alterations exist in both epithelial and stromal cells in endometria of IUA patients, yet our study focused only on epithelial cells and EMT. Stromal cell autophagy defect was already revealed by the previous research [Citation34]. Secondly, we showed autophagy defect in endometria of IUA patients but did not explore its selective target and degradation substrates through receptor proteins, which needs further investigation. Lastly, whether patients with hyperthyroidism or hypothyroidism are more susceptible to IUA is not known, which requires future research.
In summary, autophagy was downregulated in IUA endometria and DIO2 was the key regulator in this process. Downregulated DIO2 triggered the defective autophagy by MAPK/ERK-MTOR pathway and promoted EEC-EMT and fibrosis. To the best of our knowledge, this is the first time to connect autophagy with EMT in IUA, to elucidate the function and mechanism of DIO2-T3 in protection against this disease, and to provide insight into the potential therapeutic value of T3.
Materials and methods
Patients and human endometrial tissues
This study was approved by the Ethics Committee of the Affiliated Drum Tower Hospital of Nanjing University (No.2012022) and all participants gave the written informed consent. The endometrial samples and serum samples were obtained from April 2016 to October 2019 in the child-bearing women undergoing hysteroscopy with IUA and normal endometria of patients with tubal infertility (normal controls) in the late proliferative phase according to the menstrual cycle, progesterone level and ultrasound scan (dominant follicle diameter ranged from 15 to 18 mm and progesterone < 5.5 mmol/L). Fifty-four patients were enrolled in this study, including twenty-seven normal controls and twenty-seven IUA patients. The endometrial biopsies were used for mRNA and protein extraction, immunohistochemistry and four normal controls and four IUA endometria among them were carried on RNA-seq. In addition, three normal controls and three IUA endometria were used for TEM. Two months before sampling all participants had no taken estrogen or progesterone. The clinical characteristics of normal controls and IUA patients were summarized in .
Isolation of primary endometrium epithelial cells and cell culture
The fresh endometrial tissues at the late proliferative phase were rinsed with PBS (Bio-channel, BC-BPBS-01) several times and then excised into 1 mm3 fragments. The fragments were digested with a mixture of collagenase type I (Sigma, C2674), hyaluronidase (Sigma, H3506), DNase (Roche, 10,104,159,001) and BSA (Sigma, A9418) for 3 min, 3 to 5 times at 37°C, followed by filtration through a 40-μm (BD Falcon, 352,340) and 100-μm (BD Falcon, 352,360) pore filter to obtain stromal cells and epithelial cells. EECs were plated on Matrigel (Corning, 354,230)-coated dishes and cultured in defined keratinocyte serum-free medium (K-SFM; Gibco, 10,785–012) supplemented with 1% penicillin-streptomycin (Wisent, 450–201-EL) at 37°C in a humidified 5% CO2 atmosphere. Ishikawa (IK) cells were maintained in DMEM/F12 (Corning, R10-092-CV) supplemented with 10% fetal bovine serum (Gibco, 10,270–106) and 1% penicillin-streptomycin. They were purchased from ATCC (HTB-112) and authenticated using STR profiling by ATCC, and they are tested to be free from mycoplasma contamination.
RNA extraction and quantitative real-time PCR (qRT-PCR)
Total RNA was extracted from frozen tissues or cells using TRNzol reagent (Tiangen, DP424) following the manufacturer’s instructions. The purity and quality of the RNA was assessed by Nano Drop (Thermo Fisher Scientific, USA). The RNA (1 μg) was reverse-transcribed using HiScript III 1st Strand cDNA Synthesis Kit (Vazyme, R323-01). ChamQ SYBR® qPCR Master Mix (Vazyme, Q321-02) was used for the qRT-PCR analysis and RNA18S served as a housekeeping gene. The relative expression of the mRNA was calculated by the value of 2−ΔCt. All the primer sequences used in this study were summarized in .
Table 2. Primer sequences for quantitative real-time PCR.
RNA-sequencing analysis
RNA-sequencing of endometria of 4 normal and 4 IUA patients were done at Vazyme Biotech Co. (Nanjing, China). Total RNA was extracted by RNeasy Plus Micro Kit (Qiagen, 74,134). RNA quality was checked using 1% agarose gel electrophoresis and RNA Nano 6000 Assay Kit (Agilent, 5067–1511). Genes with P < 0.05 and absolute fold change ≥ 2 were considered DEGs.
Protein extraction and Western blotting analysis
Proteins were extracted in lysis buffer (Biosharp, BL509A) added with protease inhibitor cocktail (MedChemExpress, HY-K0010) and phosphatase inhibitor cocktail II (MedChemExpress, HY-K0022) and the protein concentration in the lysates was measured by using the Pierce BCA protein reagent kit (Thermo Scientific, 23,225). An equal amount (30 μg) of the protein lysate was separated by 10% or 12% SDS-PAGE gel and then transferred onto PVDF-membrane (Bio-Rad, 1,620,177), and incubated in 5% nonfat milk (Bio-Rad, 1,706,404) at room temperature, hybridized overnight with appropriate primary antibodies according to manufacturer’s protocol. After washed with TBST (Solarbio, T1082) for 3 times, the membranes were hybridized with secondary antibodies at room temperature for 1 h and exposed with ECL solution (FuDe, FD8030) and quantified the protein bands with ImageJ software (NIH, USA). The antibodies used in this study are listed below: DIO2 (66,813–1; 1:1000), TFEB (13,372-1-AP; 1:1000), CTSD (21,327-1-AP; 1:1000) were purchased from Proteintech; LC3B (12,741; 1:1000), SQSTM1/p62 (88,588; 1:1000), MTOR (2983; 1:1000), p-MTOR (Ser2448; 5536; 1:1000), MAPK/ERK (4695; 1:1000), p-MAPK/ERK (Thr202/Tyr204; 4370; 1:1000), AKT (2920; 1:1000), p-AKT (Ser473; 4060; 1:1000), AMPK (5831; 1:1000), p-AMPK (Ser485; 2573; 1:1000), LAMP1 (9091; 1:1000), goat anti-rabbit IgG (7074; 1:2000) and goat anti-mouse IgG (7076; 1:2000) were purchased from Cell Signaling Technology; BECN1 (ab62557; 1:1000), CDH2/N-cadherin (ab18203; 1:500), CDH1/E-cadherin (ab76055; 1:2000), ACTA2/α-SMA (ab5694; 1:500) and FN1 (ab2413; 1:500) were purchased from Abcam; ACTB/β-actin (AC028; 1:8000) was obtained from Abclonal.
Cell viability assay
The viability of Ishikawa cells was determined using a Cell Counting Kit-8 (CCK-8; MedChemExpress, HY-K0301) according to the manufacturer’s protocol. 2 × 10⁴ cells were seeded into 96-well plates overnight and then exposed to 50 μM CQ (Sigma, C6628) or 100 nM rapamycin (MedChemExpress, HY-10219) for 48 h. After removing the supernatant, the cells were incubated in 200 μl DMEM/F-12 medium containing 20 μl CCK-8 solution for an additional 2 h at 37°C and 5% CO2. The optical density (OD) values were measured at a wavelength of 450 nm.
Histology and immunohistochemistry
The human and mouse tissues were fixed with 4% paraformaldehyde (Biosharp, BL539A) and embedded in paraffin. Tissue section (5-μm thick) were stained with hematoxylin and eosin, or Masson’s Trichrome according to the kit instruction (Solarbio, G1340). Immune staining was performed after paraffin removal, rehydration, peroxidase quenching with 3% H2O2 and antigen retrieval. The sections were incubated with primary antibody overnight at 4°C (diluted in antibody diluent reagent solution) and then with HRP-conjugated secondary antibodies (Typng, 17,901,353–1) at room temperature for 8 min. The sections were then developed with DAB substrate (Typng, TPB13) to visualize the antigen signals and counterstained with hematoxylin. The sections were then viewed under a microscope (DMi8, Leica, Germany) and quantified the optical densities with Image-pro plus software (Media Cybernetics, USA). The antibodies used in IHC were listed below: DIO2 (ab77481; 1:100), BECN1 (ab62557; 1:200), CDH2/N-cadherin (ab18203; 1:200), CDH1/E-cadherin (ab76055; 1:400) and ACTA2/α-SMA (ab5694; 1:200) were purchased from Abcam; SQSTM1/p62 (88,588; 1:200) and LAMP1 (9091; 1:200) were purchased from Cell Signaling Technology; LC3B (NB100-2220; 1:200) was purchased from Novus; TFEB (13,372-1-AP; 1:200), CTSD (21,327-1-AP; 1:400) were purchased from Proteintech.
Transmission electron microscopy
Fresh endometrium tissues were fixed with 2.5% glutaraldehyde and 1% osmium tetroxide, rinsed in sodium phosphate buffer (0.1 M, pH 7.4), dehydrated in ethanol and embedded in epon (Electron Microscopy Sciences, 14,120). Ultrathin sections of tissues were collected on formvar-coated grids (Electron Microscopy Sciences, FCF100-Cu-UA) and stained with 10% uranyl acetate and 1% lead citrate, and then examined with a JEM-1010 Transmission Electron Microscope (JEOL, Japan) operated at 80 KV.
Immunofluorescence
The EECs were washed with PBS for twice, fixed with 4% paraformaldehyde for 10 min, permeabilized with 0.1% PBST (0.1% Triton X-100 [Solarbio, 9002–93-1] in PBS) and blocked with 1% BSA. And then the cells were incubated with primary antibodies overnight at 4°C and with secondary antibodies at room temperature away from light for 1 h. Nuclear was labeled with DAPI (Abcam, 104,139). Images were taken with a fluorescence microscope (DMi8, Leica, Germany).
DAPGreen
When the primary EECs reached the proper density in 24-well plates, aspirate the supernatant and washed with K-SFM once. Add 0.1 μmol/L DAPGreen working solution (Dojindo, D676) and cultured for 30 min at 37°C. Aspirate the supernatant and washed with K-SFM 2 times. And then the cells were treated with T3 (100 nM) for 24 h or transfected with DIO2 for 48 h and viewed using a microscope.
Measurement of thyroid hormone
The thyroid hormone levels of serum from patients’ peripheral blood and endometria were tested in the department of Nuclear Medicine, the Affiliated Drum Tower Hospital of Nanjing University.
Experimental animal models
All animal procedures were approved by the Ethics Review Board for animal studies of the Affiliated Drum Tower Hospital of Nanjing University. Eight-week-old C57BL/6 female mice were maintained in SPF conditions and adapted to the new environment for about one week. To establish IUA-like mice model, mechanical and inflammatory damage were performed at the estrum stage according to the vaginal smears. The mice were anesthetized with isoflurane inhalation. The uterus was exposed by an incision in the midline abdomen. A 7-gauge rough needle was inserted and scratched the entire uterine wall carefully for about 50 times until the uterus became hyperemic, and then injected 10 μL LPS (1 mg/kg; Sigma, L2880) into the bilateral uterus directly and clamped with tweezers for 5 min, closed the abdominal cavity subsequently. Sham-operated mice underwent the same procedure without scratching and injection of LPS. For the T3-treated group, 200 μL T3 (40 mg/kg; MedChemExpress, HY-A0070A) was injected intraperitoneally and the IUA group received 200 μL saline at days 6–15. For the pharmacological alteration of autophagy treatment, the mice received CQ (60 mg/kg/d) or rapamycin (2 mg/kg/d) intraperitoneal injection at 2 h prior to surgery and continuously received CQ or rapamycin for 2 weeks. For CQ injection alone, the mice received CQ treatment without surgery for 2 weeks. Mice were sacrificed at estrum and the uteri were obtained for further analysis.
Statistical analysis
Data were statistically analyzed using GraphPad Prism Version 6 (GraphPad Software, USA) software and were presented as means ± standard error of mean (SEM) of at least three independent experiments. Normal distribution data were analyzed by unpaired Student’s t-test for comparisons between two groups or by one-way ANOVA with a Student-Newman-Keuls test for pairwise comparisons between three or more groups. A non-parametric test was used when data were not normally distributed. Data were considered statistically significant at P value < 0.05.
Supplemental Material
Download MS Word (2.2 MB)Disclosure statement
No potential conflict of interest was reported by the author(s).
Supplementary material
Supplemental data for this article can be accessed here
Additional information
Funding
References
- Yu D, Wong YM, Cheong Y, et al. Asherman syndrome–one century later. Fertil Steril. 2008;89(4):759–779.
- Hooker AB, Lemmers M, Thurkow AL, et al. Systematic review and meta-analysis of intrauterine adhesions after miscarriage: prevalence, risk factors and long-term reproductive outcome. Hum Reprod Update. 2014;20(2):262–278.
- Chen Y, Liu L, Luo Y, et al. Effects of aspirin and intrauterine balloon on endometrial repair and reproductive prognosis in patients with severe intrauterine adhesion: a prospective cohort study. BioMed Res Int. 2017;2017:8526104.
- Cao Y, Sun H, Zhu H, et al. Allogeneic cell therapy using umbilical cord MSCs on collagen scaffolds for patients with recurrent uterine adhesion: a phase I clinical trial. Stem Cell Res Ther. 2018;9(1):192.
- Zhao G, Li R, Cao Y, et al. ΔNp63α-induced DUSP4/GSK3β/SNAI1 pathway in epithelial cells drives endometrial fibrosis. Cell Death Dis. 2020;11(6):449.
- Song M, Cao C, Zhou Z, et al. HMGA2-induced epithelial–mesenchymal transition is reversed by let-7d in intrauterine adhesions. Mol Hum Reprod. 2021;27(2):gaaa074.
- Song M, Zhao G, Sun H, et al. circPTPN12/miR-21-5 p/∆Np63α pathway contributes to human endometrial fibrosis. Elife. 2021;10:e65735.
- Nieto MA, Huang RY, Jackson RA, et al. EMT: 2016. Cell. 2016;166(1):21–45.
- Macara IG, Guyer R, Richardson G, et al. Epithelial homeostasis. Curr Biol. 2014;24(17):R815–R825.
- Tai K, Cockburn K, Greco V. Flexibility sustains epithelial tissue homeostasis. Curr Opin Cell Biol. 2019;60:84–91.
- Li Y, Liu R, Wu J, et al. Self-eating: friend or foe? The emerging role of autophagy in fibrotic diseases. Theranostics. 2020;10(18):7993–8017.
- Mizushima N, Komatsu M. Autophagy: renovation of cells and tissues. Cell. 2011;147(4):728–741.
- Hill C, Li J, Liu D, et al. Autophagy inhibition-mediated epithelial-mesenchymal transition augments local myofibroblast differentiation in pulmonary fibrosis. Cell Death Dis. 2019;10(8):591.
- Song Y, Tao Q, Yu L, et al. Activation of autophagy contributes to the renoprotective effect of postconditioning on acute kidney injury and renal fibrosis. Biochem Biophys Res Commun. 2018;504(4):641–646.
- Gui X, Chen H, Cai H, et al. Leptin promotes pulmonary fibrosis development by inhibiting autophagy via PI3K/Akt/mTOR pathway. Biochem Biophys Res Commun. 2018;498(3):660–666.
- Kong D, Zhang Z, Chen L, et al. Curcumin blunts epithelial-mesenchymal transition of hepatocytes to alleviate hepatic fibrosis through regulating oxidative stress and autophagy. Redox Biol. 2020;36:101600.
- Arrojo E, Drigo R, Fonseca TL, et al. Role of the type 2 iodothyronine deiodinase (D2) in the control of thyroid hormone signaling. Biochim Biophys Acta. 2013;1830(7):3956–3964.
- Bianco AC, Kim BW. Deiodinases: implications of the local control of thyroid hormone action. J Clin Invest. 2006;116(10):2571–2579.
- Klionsky DJ, Abdel-Aziz AK, Abdelfatah S, et al. Guidelines for the use and interpretation of assays for monitoring autophagy (4th edition)1. Autophagy. 2021;17(1):1–382.
- Liu GY, Sabatini DM. mTOR at the nexus of nutrition, growth, ageing and disease. Nat Rev Mol Cell Bio. 2020;21(4):183–203.
- Kim YC, Guan KL. mTOR: a pharmacologic target for autophagy regulation. J Clin Invest. 2015;125(1):25–32.
- Choi J, Jo M, Lee E, et al. The role of autophagy in human endometrium. Biol Reprod. 2012;86(3):70.
- Devis-Jauregui L, Eritja N, Davis ML, et al. Autophagy in the physiological endometrium and cancer. Autophagy. 2021;17(5):1077–1095.
- Evans J, Salamonsen LA, Winship A, et al. Fertile ground: human endometrial programming and lessons in health and disease. Nat Rev Endocrinol. 2016;12(11):654–667.
- Sioutas A, Vainikka LK, Kentson M, et al. Oxidant-inmduced autophagy and ferritin degradation contribute to epithelial-mesenchymal transition through lysosomal iron. J Inflamm Res. 2017;10:29–39.
- Yan Q, Zhu K, Zhang L, et al. A negative feedback loop between JNK-associated leucine zipper protein and TGF-β1 regulates kidney fibrosis. Commun Biol. 2020;3(1):288.
- Wang YJ, Chen YY, Hsiao CM, et al. Induction of autophagy by pterostilbene contributes to the prevention of renal fibrosis via attenuating NLRP3 inflammasome activation and epithelial-mesenchymal transition. Front Cell Dev Biol. 2020;8:436.
- Mei J, Zhu XY, Jin LP, et al. Estrogen promotes the survival of human secretory phase endometrial stromal cells via CXCL12/CXCR4 up-regulation-mediated autophagy inhibition. Hum Reprod. 2015;30(7):1677–1689.
- Liu H, Du Y, Zhang Z, et al. Autophagy contributes to hypoxia-induced epithelial to mesenchymal transition of endometrial epithelial cells in endometriosis. Biol Reprod. 2018;99(5):968–981.
- Zhan L, Li J, Wei B. Autophagy in endometriosis: friend or foe? Biochem Biophys Res Commun. 2018;495(1):60–63.
- Lu H, Li S, Wu Q. Retinoic acid regulates endometriotic stromal cell growth through upregulation of Beclin1. Arch Gynecol Obstet. 2018;297(1):93–99.
- Yin B, Liu X, Guo SW. Caloric restriction dramatically stalls lesion growth in mice with induced endometriosis. Reprod Sci. 2018;25(7):1024–1036.
- Wang W, Vilella F, Alama P, et al. Single-cell transcriptomic atlas of the human endometrium during the menstrual cycle. Nat Med. 2020;26(10):1644–1653.
- Wei C, Pan Y, Zhang Y, et al. Overactivated sonic hedgehog signaling aggravates intrauterine adhesion via inhibiting autophagy in endometrial stromal cells. Cell Death Dis. 2020;11(9):755.
- Bianco AC, Salvatore D, Gereben B, et al. Biochemistry, cellular and molecular biology, and physiological roles of the iodothyronine selenodeiodinases. Endocr Rev. 2002;23(1):38–89.
- Galton VA, Martinez E, Hernandez A, et al. The type 2 iodothyronine deiodinase is expressed in the rat uterus and induced during pregnancy. Endocrinology. 2001;142(5):2123–2128.
- Ueta CB, Oskouei BN, Olivares EL, et al. Absence of myocardial thyroid hormone inactivating deiodinase results in restrictive cardiomyopathy in mice. Mol Endocrinol. 2012;26(5):809–818.
- Vincken S, Reynaert H, Schiettecatte J, et al. Liver cirrhosis and thyroid function: friend or foe? Acta Clin Belg. 2017;72(2):85–90.
- Arjola B, Layal C, Plompen EPC, et al. Thyroid function and the risk of nonalcoholic fatty liver disease: the rotterdam study. J Clin Endocrinol Metab. 2016;101(8):3204–3211.
- Harrison SA, Bashir MR, Guy CD, et al. Resmetirom (MGL-3196) for the treatment of non-alcoholic steatohepatitis: a multicentre, randomised, double-blind, placebo-controlled, phase 2 trial. Lancet. 2019;394(10213):2012–2024.
- Bano A, Chaker L, Muka T, et al. Thyroid function and the risk of fibrosis of the liver, heart, and lung in humans: a systematic review and meta-analysis. Thyroid. 2020;30(6):806–820.
- Oldham JM, Kumar D, Lee C, et al. Thyroid disease is prevalent and predicts survival in patients with idiopathic pulmonary fibrosis. Chest. 2015;148(3):692–700.
- Yu G, Tzouvelekis A, Wang R, et al. Thyroid hormone inhibits lung fibrosis in mice by improving epithelial mitochondrial function. Nat Med. 2018;24(1):39–49.
- Lu X, Chen Z, Liang H, et al. Thyroid hormone inhibits TGFβ1 induced renal tubular epithelial to mesenchymal transition by increasing miR34a expression. Cell Signal. 2013;25(10):1949–1954.
- Yau WW, Singh BK, Lesmana R, et al. Thyroid hormone (T3) stimulates brown adipose tissue activation via mitochondrial biogenesis and MTOR-mediated mitophagy. Autophagy. 2019;15(1):131–150.
- Zhou J, Waskowicz LR, Lim A, et al. A liver-specific thyromimetic, VK2809, decreases hepatosteatosis in glycogen storage disease type Ia. Thyroid. 2019;29(8):1158–1167.
- Sinha RA, You SH, Zhou J, et al. Thyroid hormone stimulates hepatic lipid catabolism via activation of autophagy. J Clin Invest. 2012;122(7):2428–2438.
- Lesmana R, Sinha RA, Singh BK, et al. Thyroid hormone stimulation of autophagy is essential for mitochondrial biogenesis and activity in skeletal muscle. Endocrinology. 2016;157(1):23–38.
- Massol J, Martin P, Brochet D, et al. Are antidepressant-like effects of triiodothyronine (T3) in rodents related to an hyperthyroid state? Prog Neuropsychopharmacol Biol Psychiatry. 1989;13(5):749–764.
- Listed N. The American Fertility Society classifications of adnexal adhesions, distal tubal occlusion, tubal occlusion secondary to tubal ligation, tubal pregnancies, müllerian anomalies and intrauterine adhesions. Fertil Steril. 1988;49(6):944–955.