
ABSTRACT
The endolysosomal system not only is an integral part of the cellular catabolic machinery that processes and recycles nutrients for synthesis of biomaterials, but also acts as signaling hub to sense and coordinate the energy state of cells with growth and differentiation. Lysosomal dysfunction adversely influences vesicular transport-dependent macromolecular degradation and thus causes serious problems for human health. In mammalian cells, loss of the lysosome associated membrane proteins LAMP1 and LAMP2 strongly affects autophagy and cholesterol trafficking. Here we show that the previously uncharacterized Drosophila Lamp1 is a bona fide ortholog of vertebrate LAMP1 and LAMP2. Surprisingly and in contrast to lamp1 lamp2 double-mutant mice, Drosophila Lamp1 is not required for viability or autophagy, suggesting that fly and vertebrate LAMP proteins acquired distinct functions, or that autophagy defects in lamp1 lamp2 mutants may have indirect causes. However, Lamp1 deficiency results in an increase in the number of acidic organelles in flies. Furthermore, we find that Lamp1 mutant larvae have defects in lipid metabolism as they show elevated levels of sterols and diacylglycerols (DAGs). Because DAGs are the main lipid species used for transport through the hemolymph (blood) in insects, our results indicate broader functions of Lamp1 in lipid transport. Our findings make Drosophila an ideal model to study the role of LAMP proteins in lipid assimilation without the confounding effects of their storage and without interfering with autophagic processes.
Abbreviations: aa: amino acid; AL: autolysosome; AP: autophagosome; APGL: autophagolysosome; AV: autophagic vacuole (i.e. AP and APGL/AL); AVi: early/initial autophagic vacuoles; AVd: late/degradative autophagic vacuoles; Atg: autophagy-related; CMA: chaperone-mediated autophagy; Cnx99A: Calnexin 99A; DAG: diacylglycerol; eMI: endosomal microautophagy; ESCRT: endosomal sorting complexes required for transport; FB: fat body; HDL: high-density lipoprotein; Hrs: Hepatocyte growth factor regulated tyrosine kinase substrate; LAMP: lysosomal associated membrane protein; LD: lipid droplet; LDL: low-density lipoprotein; Lpp: lipophorin; LTP: Lipid transfer particle; LTR: LysoTracker Red; MA: macroautophagy; MCC: Manders colocalization coefficient; MEF: mouse embryonic fibroblast MTORC: mechanistic target of rapamycin kinase complex; PV: parasitophorous vacuole; SNARE: soluble N-ethylmaleimide sensitive factor attachment protein receptor; Snap: Synaptosomal-associated protein; st: starved; TAG: triacylglycerol; TEM: transmission electron microscopy; TFEB/Mitf: transcription factor EB; TM: transmembrane domain; tub: tubulin; UTR: untranslated region.
Introduction
Endocytosis, phagocytosis, and autophagy funnel proteins and lipids into lysosomes where they are degraded by hydrolases in their acidic environment [Citation1–3]. Lysosomes, originally identified by DeDuve in the 1950s, were thus traditionally considered catabolic organelles degrading biomass to recycle metabolic building blocks for biosynthetic processes. Only more recently, the lysosomal surface has also been recognized as signaling hub regulating nutrient signaling and lysosomal biogenesis via recruitment of the nutrient sensor MTOR (mechanistic target of rapamycin kinase) complex 1 (MTORC1) or the master regulator of lysosomal biosynthesis TFEB/Mitf (transcription factor EB; reviewed in [Citation4–7]). Lysosomal dysfunction affects membrane trafficking and repair on the one hand, and metabolism and signaling on the other [Citation4–7] and thus has wide-ranging consequences for human health. Lysosomal storage diseases are caused by mutations in about 70 genes encoding hydrolases, lysosomal membrane proteins (LMPs), and transport proteins [Citation7] and include Pompe disease caused by glycogen accumulation in lysosomes [Citation8] and Nieman Pick Type C disorder that results in lysosomal lipid, particularly cholesterol, accumulation [Citation9]. Additionally, degradation of cytoplasmic proteins and organelles via autophagy is critically dependent on lysosomal function, and defective lysosomal proteolysis and autophagosomal-lysosomal fusion contribute to neurodegenerative diseases including Parkinson, Alzheimer and Huntington disease [Citation10–12].
The LAMP (lysosomal associated membrane protein) family of proteins are type 1 transmembrane domain proteins characterized by lumenal LAMP domains stabilized by two S-S bridges () [Citation13,Citation14] that are followed by a transmembrane domain (TM) and short C terminus facing the cytosol and containing a YXXΦ – type endosomal sorting signal () [Citation15–17]. In vertebrates, LAMP1 and LAMP2 are ubiquitously expressed and make up ~50% of proteins in the lysosomal membrane [Citation18,Citation19]. Their lumenal domains are heavily N– and O-glycosylated and form a glycocalyx that is hypothesized to protect the lysosomal membrane from the acidic hydrolases [Citation18]. While lamp1 mutant mice are mostly normal [Citation20], 50% of lamp2 mutants die within weeks of birth, and surviving animals show cardiomyopathy and an increase in autophagic vacuoles (AVs) in many tissues including the liver [Citation21,Citation22]. Importantly, human patients with mutations in LAMP2 have Danon disease, characterized by similar phenotypes [Citation23,Citation24]. LAMP2 encodes three splice-isoforms that differ in their TM region and C-termini. Lack of the 2B isoform is sufficient to cause defects in macroautophagy (MA), the form of autophagy dependent on the formation of autophagosomes that engulf cytoplasmic content [Citation21,Citation22,Citation24–26]. Arguably, the best characterized isoform is LAMP2A, which functions as substrate translocation channel in chaperone-mediated autophagy (CMA), a form of autophagy specific for soluble cytoplasmic proteins containing a KFERQ-targeting motif. Lack of LAMP2A leads to premature aging-like phenotypes and enhances neurodegeneration [Citation27–29]. lamp1 lamp2 double-mutant mice are embryonic lethal and double-mutant mouse embryonic fibroblasts (MEFs) show a strong accumulation of autophagic vacuoles (AV) and unesterified cholesterol in late endosomes and lysosomes without altering gross proteolysis [Citation18,Citation25,Citation30,Citation31]. Furthermore, lamp2 and lamp1 lamp2 double-mutant MEFs and hiPSC-derived cardiomyocytes from Danon disease patients revealed a block of MA flux [Citation25,Citation32]. However, the cause for the accumulation of AVs and the block of MA is not well understood [Citation21,Citation25].
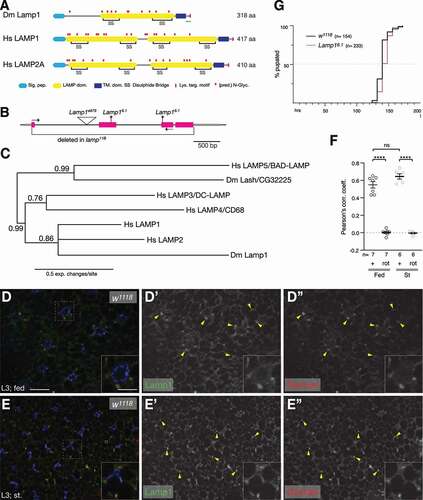
Figure 1. Lamp1 mutants are viable and have no developmental delay. (A) Schematic comparing Drosophila Lamp1 with human LAMP1 and LAMP2A. Note that Lamp1 has only one lumenal LAMP domain. The green bar indicates the peptide region used to raise the Lamp1 antibody. (B) Schematic of Lamp1 locus with mutant alleles indicated. UTRs are in gray, coding sequence in magenta. Lamp16.1 contains two frame shifts (*) at the positions of both gRNAs used to induce it. Arrows depict location of RT-PCR primers. (C) Bayesian phylogenetic tree of indicated LAMP proteins. Numbers indicate bootstrap values. (D, E) In 3rd instar larval fat body under fed (C) and starved conditions (D), Lamp1 colocalizes with TRITC-Dextran-labeled endolysosomes (examples marked by yellow arrowheads). Single channel images show Lamp1 (D’, E’) and Dextran (D”, E”), respectively. Insets show enlarged section indicated by dotted squares. Nuclei are in blue. Scale bars: 20 µm (10 µm in insets). (F) Pearson’s correlation coefficient for the colocalization of Lamp1 with TRITC-Dextran under indicated conditions. As control, one channel was rotated (rot) by 180°. One-way ANOVAs (Tukey correction) P < 0.0001; ****, P < 0.0001; ns, not significant. (G) Quantification of pupation timing shows that Lamp16.1 mutants have no developmental delay. n indicates total number of pupae scored.
In contrast to the two partially redundant mouse Lamp1 and Lamp2 genes, the Drosophila melanogaster genome contains a single ubiquitously expressed Lamp1 gene evolutionarily related to vertebrate LAMP1 and LAMP2 that remains uncharacterized [Citation33,Citation34]. To our surprise, we find that Drosophila Lamp1 null mutants are homozygous viable and show no delay during development, suggesting normal steroid hormone signaling. Furthermore, Lamp1 mutants have no defect in macroautophagy or endosomal microautophagy (eMI), suggesting that LAMP proteins may not per se be required for autophagy. However, we find a strong increase of acidic vesicles under basal and starvation conditions in the fat body that has functions akin to the mammalian liver. Furthermore, lipid analyses show that while levels of neutral fats (triacylglycerols; TAG) are unaffected in larvae, levels of sterols and medium chain diacylglycerols (DAG) are increased, suggesting changes in inter-organ lipid transport or assimilation. Our results thus indicate that the roles of LAMP proteins in autophagy and in lipid homeostasis are likely independent processes.
Results
Drosophila Lamp1 localizes to endolysosomes and is dispensable for viability
Drosophila Lamp1 (CG3305) encodes a protein of 318 aa with an N-terminal signal peptide followed by a single LAMP domain with four conserved cysteines (, B), which is ubiquitously and strongly expressed in all tissues and at all stages [Citation33]. A second uncharacterized protein CG32225/Lash/Lamp shade containing a LAMP domain is encoded by the fly genome, but its expression is restricted to the nervous system [Citation33]. Consistent with the expression data, phylogenetic analyses group Lamp1 most closely with human LAMP1 and LAMP2 (), while CG32225/Lash is more closely related to LAMP5/BAD-LAMP, which also is known to be preferentially expressed in the nervous system [Citation35–37]. To start to assess the function of Lamp1, we stained 3rd instar larval fat bodies (FB) with an antibody generated against the Lamp1 C-terminal peptide (). Lamp1 mostly localizes in a punctate pattern under fed and starved conditions ( D, E and S1 F, H), a pattern that is specific, as no staining is found in Lamp16.1 mutants (Fig. S1G, I; see below for mutant). Consistent with known routes of transport of LAMP proteins [Citation17,Citation38], some Lamp1 can be found on the cell membrane (, E). Co-labeling of Lamp1 with late endosomes and lysosomes marked by fluid phase endocytosis of fluorescent dextran (90 min chase period) [Citation39–41] shows that Lamp1 indeed localizes to late endosomes and lysosomes of 3rd instar larval FB under fed and starved conditions (nd E; Pearson’s correlation coefficients [Citation42] of 0.6 and 0.7, respectively, 1 F). Co-labeling with endosomal, ER, and Golgi markers showed a consistent partial overlap with the lysosomal protease Cp1/cathepsin L and the late endosome/lysosome marker Rab7, particularly upon starvation (Fig. S2; Table S1 for Manders colocalization coefficients).
To address the function of Lamp1, we generated mutants using CRISPR-Cas9 [Citation43] and obtained two independent alleles (). Lamp16.1 contains frameshifts in exons two and three, well upstream of the TM domain, possibly encoding the first 90 aa of Lamp1, while in Lamp111B, all but the first 8 aa are deleted ( and S1A). Additionally, the PiggyBac insertion Lamp1e879, inserted in the first intron of Lamp1, is an RNA null allele, as RT-PCR showed absence of any mRNA (Fig. S1B). Unexpectedly, all three Lamp1 alleles are homozygous viable and fertile, and adults do not show an externally visible phenotype. In addition, Lamp16.1 mutants show no developmental delay, as they take a median of 140 h to pupation similar to WT controls (). However, longevity assays (Fig. S1) showed that Lamp16.1 mutant males have a reduced median life span of 50 days compared to controls (58 days; maximal life span unchanged; Fig. S1L).
Lamp1 protein migrates at an apparent molecular mass of 45 kDa with additional larger bands of up to ~ 60 kDa in lysates of adult heads and 3rd instar larvae (Fig. S1D, E), thus considerably larger than its predicted mass of 34.8 kDa, consistent with 11 predicted N-glycosylation sites upstream of a transmembrane domain (). Importantly, these bands are specific to Lamp1, as they are absent from lysates of Lamp16.1 and Lamp111B mutants (Fig. S1D, E), also confirming that all Lamp1 alleles are likely null alleles. Upon treatment of adult head lysates with Endo H, which removes mannose rich oligosaccharides from proteins [Citation44,Citation45], or PNGase F that removes all N-linked sugars [Citation45], the apparent Mw of Lamp1-specific bands shifts toward smaller protein species at the expense of the largest ones, an effect that is stronger upon PNGase F treatment (Fig. S1C). Phylogenetic analyses, expression pattern, the late endosomal and lysosomal localization, and the N-glycosylation status of Lamp1 are consistent with it being a bona fide ortholog of mammalian LAMP1 and LAMP2 (and possibly LAMP3 and CD68/LAMP4).
Acidification of the endo-lysosomal compartment in Lamp1 mutants
To assess changes in the endolysosomal compartment, we stained larval FB for the early and late endosomal markers Hrs and Rab7, respectively [Citation46], and the lysosomal protease Cp1/cathepsin L and found no consistent differences between wild type and Lamp16.1 and Lamp111B mutants (Fig. S3 A-F) although there may be a tendency toward an increase in Rab7 and Cp1 puncta (quantified in Fig. S3 G-I).
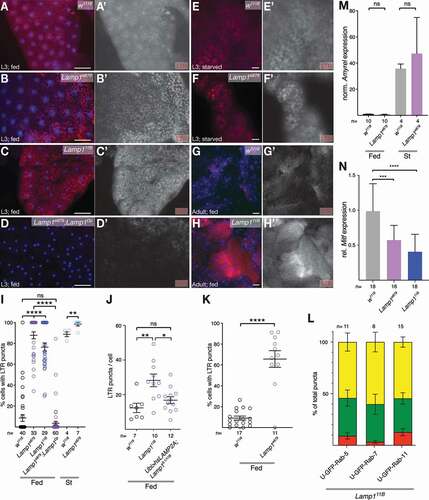
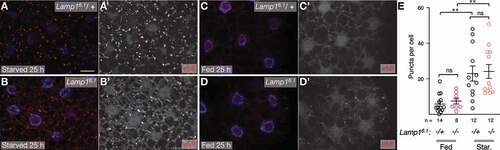
LysoTracker Red (LTR) is retained in acidic structures upon protonation and has been used to monitor starvation induced MA in Drosophila as barely any LysoTracker positive structures are found under fed conditions [Citation47]. Staining larval FB ex vivo with LTR showed that, compared to control (), FB of well-fed larvae of all three Lamp1 alleles show a very pronounced increase in acidic structures ( B, C and Fig. S4; quantified in ). Importantly, this phenotype is rescued by a duplication that includes the Lamp1 locus (Lamp1Dp; , quantified in 2I) and by expression of human LAMP2A (). The phenotype is not restricted to larvae, but also found in FB of adult Lamp111B mutants (, H; quantified in 2 K). A similar, albeit smaller expansion of acidic structures is found upon starvation (, F and S4D-F; quantified in 2I). Expression of GFP-Rab5, GFP-Rab7, and GFP-Rab11, markers of early, late, and recycling endosomes [Citation39,Citation48] in the FB of Lamp111B mutants revealed a substantial colocalization of the LTR puncta with all three markers (Fig. S5; quantification in ), suggestive of acidification of the whole endo-lysosomal pathway. Lamp1 mutant larvae still respond to starvation, as the mRNA of Amyrel, the gene encoding an α-amylase-like protein, known to be strongly induced by starvation [Citation49,Citation50], is low in fed larvae and normally upregulated by starvation to similar levels in WT and Lamp1 mutants (). The expression levels of the major regulator of lysosomal biogenesis in flies, Mitf [Citation51], is significantly decreased (), suggesting that the acidification is not due to a major increase in lysosomes (see also below).
Figure 2. Lamp1 mutant fat body cells have strongly increased acidic structures. Compared to w1118 (A), fed 3rd instar FB of Lamp1e879 (B), and Lamp111B (C) show a strong increase of LTR staining, a phenotype that is rescued by a duplication including Lamp1 (D; quantified in I). (E, F) LTR staining is also increased in starved 3rd instar FB of Lamp1e879 mutants (compare E, F; quantified in I). (G, H) A similar increase in the acidic compartment is seen in adult fat body of Lamp111B mutants (compare G, H). Nuclei are in blue; grayscale images show LTR channel; scale bars: 20 µm. (I) Quantification LTR staining in larval fat body of indicated genotypes. One-way ANOVA (Tukey correction) for Fed P < 0.0001; Starved: T-test. (J) Human LAMP2A expressed under the control of Ubiquitin-Gal4 rescues lysotracker staining in Lamp1 mutants. One-way ANOVA (Tukey correction) P < 0.001. (K) Quantification LTR staining in adult fat body of indicated genotypes. T-test. (L) Mean percentages (with SEM) of colocalization of LTR structures with indicated GFP-Rab fusion proteins expressed in the larval FB of Lamp111B mutants. Red: LTR only; Green: GFP-Rab only; Yellow: double-positive structures. (M) Amyrel is normally induced upon starvation in Lamp1e879 mutant larvae (qPCR normalized to RpL32). Two-tailed T-test. (N) Mitf mRNA expression in the larval FB of indicated genotypes normalized to control (w1118). One-way ANOVA (Dunnett correction) P < 0.0001. *P < 0.05; **P < 0.01; *** P < 0.001; **** P < 0.0001; ns, not significant.
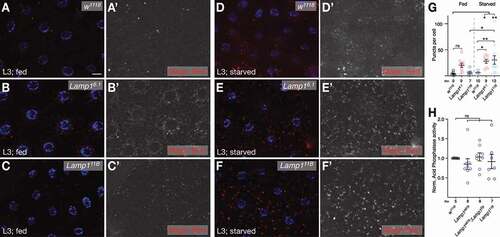
To test if the LTR phenotype correlated with increased lysosomal activity, we first stained FB of 3rd instar larvae with MagicRed, a CtsB (Cathepsin B) substrate that becomes fluorescent in active, acidic lysosomes [Citation52,Citation53]. Under basal, fed conditions and in contrast to increased LTR staining, Lamp1 mutants show no increase in sites of CtsB activity, suggestive of unchanged lysosomal activation (; compare w1118 with Lamp16.1 (B) and Lamp111B (C); quantified in 3 G). This is also supported by normal Acph-1 (Acid phosphatase 1) activity in lysosome-enriched fractions of Lamp1 mutant larval lysates (), a common marker of lysosomal activity [Citation54,Citation55]. However, although quite variable, sites of CtsB activity are more frequent in Lamp1 mutants under starved conditions (; quantified in 3 G), suggesting that lysosomal activation can be abnormal under certain stress conditions. No change in Cp1 processing was observed in either condition in Lamp16.1 mutants (Fig. S6 A, B).
Figure 3. Lysosomal activity. (A-C) Sites of CtsB activity as measured by Magic Red assay are not significantly increased in FB of fed 3rd instar larvae (compare w1118 in A with Lamp16.1 (B) and Lamp111B (C); quantified in G). In contrast, under starved conditions (D-F), Lamp16.1 (E) and Lamp111B (F) have increased CtsB activity (compare to w1118 in D; quantified in G). Nuclei are in blue; grayscale images show Magic Red channel; scale bar: 20 µm. (G) Quantification of Magic Red puncta in FB of indicated genotypes. One-way ANOVA (Tukey correction) P < 0.001. (H) Normalized Acph-1 activity of lysates enriched for lysosomes of fed 3rd instar larvae of indicated genotypes. One-way ANOVA (Dunnett correction). * P < 0.05; **P < 0.01; ns, not significant.
Lamp1 is dispensable for autophagy
In wild-type larval FB, LTR staining increases during starvation induced MA [Citation56]; thus, the expanded acidic compartment could be suggestive of a MA defect. MA is well characterized in 3rd instar larval fat body [Citation40,Citation56,Citation57] and autophagic flux is commonly assessed using a tandem-tagged GFP-mCherry-Atg8a reporter which fluoresces green and red in autophagosomes, but red only in autolysosomes due to GFP fluorescence being quenched by their acidic pH [Citation58]. However, neither under fed ( B; quantified in 4E) nor starved conditions (; quantified in 4E) do Lamp16.1/Lamp111B transheterozygous or Lamp16.1 homozygous mutants (quantified in ) show a difference in autophagosomes (APs; green puncta) nor total autophagic structures (red puncta) compared to controls (, B; quantified in 4E). Importantly, we find a robust, normal stimulation of MA upon starvation as seen in the strong increase of autolysosomes and a tendency toward an increase in APs (, D; quantified in ). Consistently, MA flux measured by lipidation of Atg8a (i.e., formation of Atg8a-II) upon blockage of AP-lysosome fusion by chloroquine is not blocked in Lamp1 mutants (rather there may be an increase; Fig. S6C, D). Prior to fusion of APs with lysosomes, APs recruit the SNAREs Syx17 (STX17 in vertebrates) and Snap29 as part of the fusion process [Citation59,Citation60]. Consistent with functional starvation induced MA, Snap29 is normally recruited to autophagosomes marked by mCherry-Atg8a of 3rd instar FB cells of Lamp16.1 homozygous mutants (quantified in ) or Lamp16.1/ Lamp111B transheterozygotes (, G; quantification in 4 H). In addition, there is no change in the expression of the core MA genes Atg5 and Atg8a in adult flies (). Our data thus suggest, that, in contrast to humans and mice [Citation21–24], there is no basal or starvation induced MA defect in the absence of Lamp1 in Drosophila.
Figure 4. Autophagic flux is normal in FB of Lamp1 mutants. (A,B) Under basal conditions, MA in 3rd instar FB is low and indistinguishable between Lamp16.1 heterozygous control (A), Lamp16.1/Lamp111B (B), and homozygous Lamp16.1 (quantified in E) mutants. (C, D) MA is normally induced by starvation in Lamp16.1 heterozygotes (C), Lamp16.1/Lamp111B (D), and homozygous Lamp16.1 (quantified in E). APs are labeled with GFP and mCherry, while GFP fluorescence is quenched by the acidic pH in autolysosomes, which are thus labeled in red only. (E) Quantification of GFP puncta (APs) and cherry only puncta (APs and APGLs) shows normal MA flux in Lamp1 mutants with no difference to controls. One-way ANOVA (Tukey correction) P < 0.001 (GFP) and P < 0.0001 (cherry only). (F, G) Snap29 (green) recruitment to APs (marked by mCherry-Atg8a; C-Atg8a; red) is normal in FB of Lamp16.1/ Lamp111B transheterozygote mutants and Lamp16.1 mutants (quantified in H; compare to heterozygotes in F; examples of APs are marked by yellow arrowheads). (H) Pearson’s correlation coefficient of colocalization of Snap29 with mCherry-Atg8a of indicated genotypes. One-way ANOVA (Dunnett correction) not significant. Nuclei are in blue; grayscale images show indicated channels; scale bars: 20 µm. (I) Lamp1e879 mutant adults have normal expression of the essential MA genes Atg5 and Atg8 (fed; normalized to RpL32). Two-tailed T-tests. **P < 0.01; ***P < 0.001; **** P < 0.0001; ns, not significant.
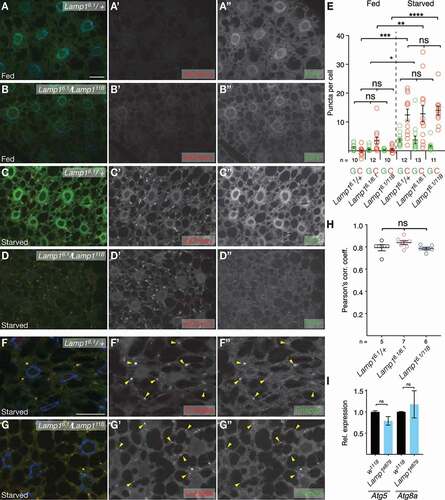
In mammals, in addition to MA, CMA and eMI also contribute to autophagic protein degradation [Citation27,Citation61]. eMI has recently been identified in flies based on its selective requirement of Hsc70-4 and the ESCRT machinery [Citation62,Citation63]. Conversely, to date, CMA has only been shown to occur in mammals and fish as other species (except for birds) lack amino acids critical for Hsc70/HSPA8 interaction in their LAMP proteins [Citation28,Citation64]. We therefore tested if Lamp1 is required for eMI, but found that similar to MA, there is no eMI defect in Lamp1 mutants, as prolonged starvation normally induces eMI sensor puncta (KFERQ-PAmCherry) in Lamp16.1 mutants (; compare heterozygous larval FB (A, C) with homozygous mutant tissue (B,D); quantification in 5E). Given the essential role of LAMP2A in CMA and the fact that KFERQ-PAmCherry acts as CMA sensor in vertebrates [Citation65,Citation66], the lack of differences in the levels of KFERQ-mCherry puncta between wild-type and Lamp1 mutants support the idea that flies lack a CMA-like process.
Figure 5. eMI induced by prolonged starvation is normal in Lamp16.1 mutants (compare starved Lamp16.1 heterozygous control (A) and homozygous Lamp16.1 mutant larval FB (B) with corresponding fed tissue (C, D). Grayscale images show eMI sensor; nuclei are in blue; scale bar 20 µm. (E) quantification of eMI sensor puncta per 3rd instar FB cells of indicated genotypes. One-way ANOVA (Tukey correction) P < 0.0001; ** P < 0.01; ns, not significant.
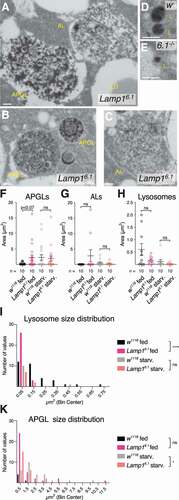
To independently assess MA, we performed morphometric analyses of autophagic structures on TEM sections of fed and starved Lamp16.1 mutant 3rd instar FB (). No difference between wild-type and Lamp1 mutant tissue was found for the density of mature autolysosomes (ALs; examples in , C; quantified in ; see Fig. S7 for overview images and materials and methods for definition of structures) and lysosomes (examples in , E; quantified in ). However, under fed conditions, individual lysosomes are smaller (). A tendency toward an increased area of APGLs was found for fed Lamp16.1 mutant FB, while the size distribution of those structures changed toward smaller ones under starvation (). Autophagosomes (AVi in e.g [Citation18].) were very rare in all cases. Overall, our data thus show no indication for autophagy defects in Lamp1 mutants.
Figure 6. TEM analyses of Lamp1 mutant fat body. (A-E) Examples of autolysosomal structures of Lamp16.1 mutant (A-C) and WT (D) 3rd instar fed larval fat body. APGL: autophagolysosome; AL: autolysosome; L: lysosome; LD: lipid droplet. See also methods for structure definitions. Scale bars: 0.5 µm. Original full images are shown in Fig. S7. (F-H) Quantification of density (area per field of view) of APGLs (F), ALs (G), and lysosomes (H) under indicated conditions. Mann-Whitney tests. (I, K) Size distribution of Lysosomes (I) and APGLs (K) under indicated conditions. Mann-Whitney and Kolmogorov-Smirnov tests. * P < 0.05; **** P < 0.0001; ns: not significant.
Altered lipid content in Lamp1 mutants.
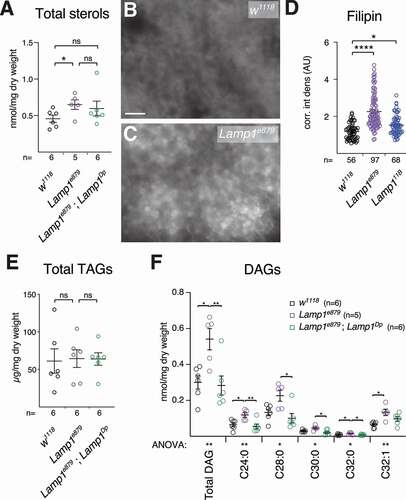
lamp1 lamp2 mutant MEFs accumulate cholesterol in the endolysosomal system, and it was shown that LAMP1 and LAMP2 proteins bind cholesterol for storage in lysosomes [Citation26,Citation67]. We therefore determined whether lack of Lamp1 altered lipid profiles of mutant 3rd instar larvae. Lamp1e879 mutants showed elevated total sterol levels, a phenotype rescued by a Lamp1 duplication (). Consistently, Lamp1 mutants show an increase in unesterified sterols in larval FB, as shown by Filipin staining (, C; quantified in ), in line with what was reported for lamp1 lamp2 double-mutant mouse MEFs [Citation26]. In flies, dietary lipids are taken up by enterocytes in the gut and converted to diacylglycerols (DAG), secreted and transported in the hemolymph (blood) as lipoprotein complexes, from where they are taken up by other tissues such as FB cells that convert them to triacyclglycerols (TAGs) for storage [Citation68]. No changes were found in triglycerides in Lamp1e879 mutants (), consistent with no change in lipid droplet density (LD) in the fat body in our TEM analyses (Fig. S7G). In contrast, Lamp1 mutant larvae show elevated levels of DAGs that are rescued by a transgenic copy Lamp1 (duplication; ). The increase is specific for DAGs with medium chain fatty acid tails (), characteristic of DAGs associated with lipoproteins, which suggests that interorgan lipid transport or mobilization is affected. No changes were found on glycogen density by TEM (Fig. S7H).
Figure 7. Lamp1 mutant larvae have altered lipid levels. (A) Sterol levels are increased in Lamp1e879 mutants, an effect that is partially rescued by a duplication including Lamp1 (Dp). Two-tailed T-tests. (B-D) Compared to wildtype (B), Lamp1e879 mutant larvae (C) accumulated unesterified sterols as revealed by filipin staining (quantified in D). One-way Anova (Dunnett) P < 0.0001. (E) Triacylglycerols (TAG) are unaffected. (C) Levels of larval DAGs and their indicated subclasses in Lamp1e879 mutants. Note the rescue by Lamp1Dp. One-way ANOVA (Tukey correction) significance levels are indicated below the X-axis. Unless indicated, changes are not significant (ns). * P < 0.05; ** P < 0.01; **** P < 0.0001.
Discussion
Our phylogenetic analysis in conjunction with expression data [Citation33] suggest that Lamp1 is the ortholog of the mammalian LAMP1 and LAMP2 (and possibly LAMP3 and CD68/LAMP4) proteins (). Consistently, using a marker of fluid phase endocytosis chased into lysosomes in living FB cells we found that Lamp1 localizes to late endosomes and lysosomes. Unexpectedly, Lamp1 mutants are homozygous viable and show no developmental delay, distinct from mice lacking both, partially redundant Lamp1 and Lamp2 genes, which die around E15.5 [Citation26]. We found a large expansion of the cellular acidic compartment under basal conditions and starvation in Lamp1 mutants. Again, this is distinct from mouse lamp2 mutants and differentiated cardiomyocytes derived from hiPSC of Danon patients, in which no change in LTR staining was observed [Citation32]. Importantly though, the increased LTR signal is rescued by ubiquitous overexpression of human LAMP2A (), further supporting the notion that LAMP1, LAMP2 and Lamp1 are bona fide orthologs. Future experiments may show whether Lamp1 can rescue the phenotypes of lamp1 lamp2 double mutant mice. It is worth mentioning that lysosomal pH is driven by a difference in membrane potential between the cytoplasm and the lysosomal lumen (more positive), which could be altered in Lamp1 mutants [Citation69]. Interestingly, under basal conditions, the increase in acidic structures does not result in increased activity of lysosomal hydrolases, as we saw no increase in sites of CtsB activity or total Acph-1 activity (). Most likely, acidification of a large part of the endo-lysosomal system contributes to the strong increase of LTR-positive structures, as we find those strongly colocalizing with GFP-Rab5, Rab7, and Rab11 ( and S5). Therefore, many of the LTR positive structures are not lysosomes. An additional contribution to the increase in LTR puncta can be explained by the presence of more, but smaller lysosomes as assessed by TEM morphometry (; note though that total lysosomal area is unchanged). Expanded acidic structures also have been reported upon knockdown of Drosophila Gga (Golgi-localized, γ-adaptin ear containing, ARF binding protein) which is required for the transport of cathepsins to lysosomes and thus for their proteolytic processing and activation. However, we found no indication of altered Cp1 processing in FB of Lamp1 mutants (Fig. S6).
lamp2 and lamp1 lamp2 double-mutant cells have a block in autophagic flux as shown by measurements of LC3-II levels [Citation32] and of APs using tandem GFP-RFP-LC3 reporters [Citation25,Citation32] and EM [Citation22]. However, the mechanistic reason for this phenotype is unclear. It was suggested that LAMP2 is required for AP-lysosome fusion [Citation25], or to promote fusion via simultaneous interaction with ATG14 on APs and the lysosomal SNARE VAMP8 [Citation32], therefore having a direct function in fusion. However, Hubert et al. [Citation25] showed failure of APs to recruit the SNAREs STX17 and SNAP29 required for fusion of APs to lysosomes in lamp2 and lamp1 lamp2 double-mutant cells, which is not easily reconcilable with a direct function of LAMPs in MA. Additionally, nonfunctional vesicular transport and thus a potentially indirect effect has also been suggested as reason for defects in phagosome-lysosome fusion in lamp1 lamp2 mutant MEFs [Citation70]. Furthermore, the initial TEM analysis of lamp1 lamp2 double-mutant MEFs found no defect in the formation of APs or their fusion with lysosomes, but rather a retardation in maturation of autolysosomes [Citation18,Citation26]. Our results show that basal MA flux and starvation induced MA are normal in Drosophila Lamp1 mutant larval fat body (, Fig. S6C, D). Consistently, we find normal recruitment of Snap29 to APs ( F-H) and no accumulation of APs in our TEM analyses, arguing against an essential direct function of LAMPs in MA. Alternatively, a more direct function of LAMPs in MA could have evolved after divergence of vertebrates from arthropods or lost in the latter species. Furthermore, we cannot rule out that Lamp1 affects MA elicited by other forms of cellular stress or combinations thereof. Importantly, we also show that, as LAMP2A in mammals [Citation61,Citation71], Lamp1 is dispensable for eMI and, since our eMI sensor is equivalent to the mammalian CMA sensor [Citation62,Citation66], our data functionally confirm that there is no evidence for CMA in Drosophila.
LAMP proteins have also been implicated in lipid metabolism [Citation72]. Consistently, we find that Drosophila Lamp1 mutant larvae have increased sterol levels (), although the increase is small compared with the effect observed in mice. Fruit flies are sterol auxotrophs and rely on dietary sterols for survival [Citation73], and, consistently, both yeast-derived and plant-derived sterols were identified in our analysis (not shown). lamp1 lamp2 double mutants accumulate cholesterol in the endolysosomal system [Citation26,Citation74] and LAMP1 and LAMP2 bind cholesterol [Citation67]. As LAMP2 also binds NPC1 and NPC2 [Citation67], LAMP proteins have been implicated in the handover of cholesterol to the NPC lysosomal cholesterol export system [Citation67]. It is worth noting, though, that overexpression of neither NPC1 nor NPC2 is able to decrease the late endosomal/lysosomal cholesterol accumulation in LAMP mutant MEFs [Citation26].
Lamp1 mutant larvae also displayed a significant increase in DAGs. Unlike vertebrates, insects use DAGs as the main lipid species for transport of dietary lipids from the midgut to other tissues [Citation68,Citation75]. Lipids from the diet are digested by secreted lipases and esterases in the midgut, followed by absorption of fatty acids, sterols, and other molecules by enterocytes [Citation68,Citation75]. These cells then synthesize DAGs for export into the hemolymph, which transports lipids as lipoprotein complexes to other tissues [Citation75]. Lipophorin (Lpp), a member of the ApoB family, is the main hemolymph lipid carrier [Citation76]. The most abundant lipids in Lpp-containing lipoproteins are DAGs (70%), and phosphatidylethanolamine (20%), while sterols make up only 5% [Citation76]. ApoLpp is synthesized in the FB and released to the hemolymph as high-density lipoproteins (HDL) that are loaded with phospholipids but lack DAGs. HDLs travel to the gut where they are loaded with DAGs with the help of another lipoprotein particle containing lipid transfer particle (LTP) and become low-density lipoproteins (LDL) [Citation75,Citation76]. LDLs are transported in the hemolymph for final use in organs [Citation68,Citation75].
Importantly, DAGs transported in hemolymph contain medium chain fatty acid, with a large proportion of C12 and C14 tails [Citation76,Citation77], corresponding to the species showing the most significant increase in Lamp1 mutants (combined chain lengths of 24 and 28 carbons; ). Thus, it is apparent that Lamp1 has a broader role in lipid assimilation and is not limited to sterol metabolism. However, the mechanism by which Lamp1 affects DAGs is less clear. Given Lamp1ʹs prevalent localization in late endosomes and lysosomes, it can be hypothesized that the protein has a role in endocytosis, and lack of Lamp1 could affect endocytosis-dependent lipid transport. For example, it was shown that Lpp loading partially depends on endocytosis, as the intermediary lipoprotein LTP needs to be internalized in midgut enterocytes for loading. In turn, LTP is necessary for loading of DAGs and sterols into Lpp for transport via the hemolymph [Citation68,Citation76]. Moreover, LTP RNAi results in large accumulation of medium chain DAGs in the gut [Citation76] and defective LTP endocytosis in Lamp1 mutants could explain the observed lipid phenotype.
Defects in phagocytosis have been previously reported in lamp1 lamp2 mutant mouse fibroblasts transfected with FCGR2A/FcγIIA receptors [Citation70]. In this case, phagosomes acquire Rab5 but not Rab7, and fail to fuse with lysosomes, indicating that endocytosis is impaired at a late step in the process. It was proposed that the endocytosis defect is associated with a failure of endosomes and lysosomes to move on microtubules [Citation70]. Similarly, defective compensatory endocytosis was observed in lamp1 lamp2 mutant fibroblast during plasma membrane repair [Citation78]. The reduced ability of lamp1 lamp2 mutant fibroblasts to carry out compensatory endocytosis also explains their increased resistance to Trypanosoma cruzi infection, as the parasite causes plasma membrane injuries and then hijacks the compensatory endocytosis process to enter the host cell [Citation78,Citation79]. However, in this case it was proposed that the role of LAMP2 in endocytosis may be indirect, as a decrease in cholesterol level in the plasma membrane associated with failure to recruit CAV1 (caveolin 1) could have led to a reduction in endocytosis [Citation78]. Similarly, liver-stage Plasmodium berghei parasites have reduced growth in lamp1 lamp2 mutant host cells because the parasite fails to recruit late endosomes and lysosomes to the parasitophorous vacuole (PV) [Citation80]. The same phenotype was observed for NPC mutant host cells or when host cells were treated with the amphipathic steroid 3-b-(2-[diethylamine]eth-oxy)androst-5-en-17-one (U18666A). The common phenotype in the three cases is the accumulation of cholesterol in late endosome/lysosomes, suggesting that sequestration of cholesterol and potentially reduction of the available sterol pool leads to the defects in late endosome and lysosome recruitment to the PV, and/or reduced availability of sterols necessary for parasite growth [Citation80]. Importantly, late endosomal and lysosomal cholesterol accumulation, either due to NPC1 deficiencies or phenocopied pharmacologically using U18666A dramatically affects back fusion of intralumenal vesicles with the limiting membrane of LE [Citation81] and overexpression of LAMP2 reduces sterol accumulation in a NPC1 mutant [Citation82], suggesting a link between LAMP function, cholesterol accumulation, and regulation of endomembrane back fusion events.
These results further support the hypothesis that lack of LAMP proteins results in endocytosis defects, although the direct participation of LAMP proteins in specific membrane fusion events, or their indirect effect through changes in lipid composition of the membranes needs to be resolved. In any case, the disruption of endocytosis in Lamp1 mutants could not completely block this process, since manipulation of Drosophila genes essential for endocytosis also disrupt lysosome biogenesis and result in an overall decrease in LTR-positive puncta [Citation83], opposite to the phenotype observed for Lamp1 mutants.
Our analysis indicates that Drosophila Lamp1 is necessary to maintain the normal cellular composition of acidic organelles, and for lipid homeostasis. Our data showing that basal and starvation induced autophagy is not affected in Lamp1 mutants, while sterol and DAG levels changed lend support to the previous suggestion that changes in sterol levels and the defects in autophagic flux observed in lamp1 lamp2 mutant mice are independent phenotypes [Citation74]. Moreover, the use of DAGs as the main species for hemolymph lipid transport in insects rather than TAGs as in vertebrates allowed us to identify a broader effect for LAMP proteins in lipid metabolism without a confounding effect of lipid storage. These characteristics make Drosophila an ideal model to further dissect the roles of LAMPs in lipid metabolism and organelle traffic.
Materials and methods
Phylogenetic analysis
Protein sequences of human LAMP1 (P11279-1), LAMP2C (P13473-3), LAMP3/DC-LAMP (Q9UQV4-1), CD68/LAMP4 (P34810-1), LAMP5/BAD-LAMP (Q9UJQ1-1), Drosophila Lamp1 (NP_610111) and CG32225/Lash (AAY84938) were trimmed to include their proximal LAMP, transmembrane, and C-terminal domains [Citation14]. ClustalOmega alignment and Bayesian inference-based phylogenetic trees were calculated according to [Citation84–86].
Fly strains and genetics
All fly stocks were maintained at 25°C and reared on standard cornmeal media unless otherwise indicated. PBac{RB} Lamp1e00879 (here Lamp1e879) is a piggyBac insertion [Citation87] in the first intron of Lamp1 () and is a RNA null allele (Fig. S1D). y1 M{nos-Cas9.P}ZH-2A w* (BL# 54591) and Ubi-Gal4U-2 (BL#32551; then recombined onto Lamp16.1 FRT40) were from the Bloomington stock center. Dp(2;3)P6-B2[Lamp1] is a duplication including the Lamp1 locus in VK31 on chromosome 3L (referred to here as Dp) that was obtained from Genetivision (Huston, TX). UASp-GFP-mCherry Atg8a u2.6 (Chr. II; tandem tag) was from Dr. I. Nezis (U. Warwick, UK) and was recombined onto the Lamp16.1 chromosome. Lamp16.1; r4-Gal4 and Lamp111B; r4-Gal4 used in the flux assays are based on r4-Gal4 obtained from Dr. T. Neufeld (U. Minnesota) [Citation88], who also provided UAS-mCherry-Atg8a lines [Citation89], Atg7d14 and Atg7d77. UAS-KFERQ-PAmCherry 3B was as in [Citation62]. UAS-hsLAMP2A (1-7m) was from Dr. S. Birman (ESPCI, Paris, France)[Citation90] and (UAS-GFP-Rab5/TM3 Sb, and UAS-Rab7-GFP/TM3 Sb, and UAS-GFP-Rab11/TM3 Sb were gifts of Dr. M. Gonzalez Gaitan (University of Geneva, Switzerland) [Citation39,Citation48]. See Table S2 for exact genotypes and Table S3 for oligos used for genotype verification.
To measure pupation timing, flies were allowed to lay eggs overnight onto grape juice plates before removing hatched larvae by floating them on 20% sucrose (Fisher, BP220-1) for embryo synchronization. After verification of the absence of larvae, plates were incubated for 2 h at 25°C and newly hatched larvae were floated off with 20% sucrose, collected, and placed at roughly 30 larvae/vial onto regular food (t = 25 ± 1 h to account for 24 h of embryogenesis). Pupating larvae were scored every 8 h. For longevity studies, Lamp16.1 was outcrossed over 6 generations to an inbred w1118 strain that had previously been used for longevity studies [Citation91]. Parents were allowed to lay eggs for 2 days, offspring were collected within two days and kept mating for two days. Per set, 4 times 25 males and females were transferred to fresh food every two to three days and dead flies counted. Flies were kept at 25°C in a 12 h light/dark cycle. Results show the sum of three independent experiments. All statistical analyses including Kaplan Meier curves and median survival (average of single vials) were calculated with Prism.
Molecular biology and transgenic flies
Transgenes were injected by Rainbow Transgenic flies (CA). pCFD4_Lamp_13 pCFD4_lamp1-30_4-4 were made by Gibson assembly (New England Biolabs [NEB], E5510S) using oligos Lamp1_crisp_61_for, Lamp1_crisp_63_rev and Lamp1 exon 4_4, Lamp1 exon_1_30, respectively (Table S3) as described [Citation43]. Transgenic lines were crossed with isogenized nosCas9/FM6; FRT40/CyO, allowing generation of Lamp16.1 directly on a FRT40 chromosome. Genotyping oligos are indicated in Table S3. Lamp16.1 FRT40 (Lamp16.1 in text) contains frame shifts in exons 2 (5 bp deletion) and exon 3 (21 bp at expense of deletion of 8 bp, thus a net insertion of 13 bp) resulting in a predicted protein truncated after 90 aa of Lamp1 and an additional ectopic 32 residues ( and S1A). Lamp111B deletes all but the first 8 aa of the Lamp1 ORF including the stop codon (3067 bp, 1-bp insertion; 3066-bp net deletion; and S1A). Lamp16.1 FRT40 was outcrossed 6 times against w1118 to lose an off-target lethal mutation. In both cases, non-targeted chromosomes were exchanged.
For qPCR, total RNA was extracted using TRIzol reagent (Thermo Fisher Scientific, 15596–026) from ~25-30 larvae or whole adult flies, DNase-treated (Turbo DNA-free kit; Ambion, AM1907) and reverse transcribed using SuperScript III First Strand synthesis kit (Invitrogen, 18088051). qPCR was performed in triplicates with an ABI prism 7300 Sequence Detection System (Thermo Fischer Scientific, Waltham, MA, USA) using Absolut qPCR with SYBR Green + Rox kit (Applied Biosystems by Thermo Fischer Scientific, 4309155; see Table S3 for primers). mRNA abundances were normalized with RpL32 as housekeeping control using the ΔΔCT method [Citation92].
Biochemistry and lipid analyses
For Western blot analyses, larvae were starved for 4 h on 20% sucrose and adults for 24 h with water saturated filter papers. Ten fly heads or 20 washed larvae were suspended in 50 µl or 200 µl 1x Laemmli buffer with 2% SDS (2% SDS, 10% glycerol, 5% 2-mercaptoethanol, 0.002% bromophenol blue, 62.5 mM Tris HCl, pH 6.8), respectively, and boiled for 5 min at 95°C. After homogenization with a motor pestle (DWK Life Sciences-Kimble, 749540–0000), lysates were boiled again and centrifuged twice for 10 min at 20,000 g at room temperature. After each centrifugation, 90% of the liquid phase was removed avoiding lipids floating on top. Upon separation of the proteins by SDS-PAGE, proteins were transferred to PVDF or nitrocellulose membranes (for Lamp1 detection) and probed with NY2403 anti-Lamp1 (see below) at 1:5000 and anti TUBA/αTubulin (Sigma, T5168; 1:10,000) as loading control. For flux assays by Western blot, 60–72 h larvae were floated on 20% sucrose and transferred to food supplemented with 4 mM chloroquine (Sigma, C6628; ~25 larvae per vial) for 24 h [Citation93] prior to processing as above and running on a 15% SDS-PA gel. Atg8a was detected using anti-GABARAP/L1/L2 (Abcam, Ab109364) at 1:2000. Flux was calculated as the difference of Atg8a-II normalized to Ponceau under treated and non-treated conditions (treated – untreated) [Citation94]. Individual experiments were then normalized to fed w1118 larvae. For controls, Atg7d14/Atg7d77 transheterozygotes were identified by the absence of a GFP balancer. Drosophila Cp1 was detected with ab58991 (Abcam) at 1:1000 [Citation95].
For deglycosylation assays, 40 adult heads of indicated genotypes were lysed in 200 µl RIPA buffer (150 mM NaCl, 5 mM EDTA, pH 8.0, 20 mM Tris, pH 8.0, 1% NP40 [ICN, 19859650], 0.25% deoxycholate [US Biological, D3180] by homogenization with a motor pestle. After clearing at 10,000 g for 10 min at 4°C, 70 µg protein (as determined with a Lowry assay) was combined with 3 µl denaturing buffer (5% SDS, 400 mM DTT), heated to 95°C for 10 min prior to addition of protease inhibitors (Sigma, 11836170001). Two µl Endo H (NEB, P0702S) and 3 µl of G3 reaction buffer (NEB, B1720SVIAL) and 2 µl PNGase F (NEB, P0704S), 3 µl 10% NP40, and 3 µl G2 reaction buffer (NEB, B3704SVIAL) were added, respectively. After incubation for 18 h at 37°C, samples were boiled in Laemmli buffer and processed for Western blot analysis.
To measure Acph-1 activity, a fraction containing lysosomes, mitochondria, and cytoplasm was prepared by centrifugation from 15 to 30 3rd instar larvae as described [Citation54], with the addition of cOmplete, Mini, EDTA-free Protease Inhibitor Cocktail (Sigma, 11836170001) in the extraction buffer. The presence of lysosomes in this fraction was confirmed by LysoTracker Red DND99 (Invitrogen, L75528) staining and observation under a fluorescence microscope. Protein concentration was determined using the Pierce BCA protein assay kit (Thermo Fisher Scientific, 23227). Acph-1 activity was determined fluorometrically using 4-methylumbelliferyl phosphate (Sigma Aldrich, 22919–26-2) as substrate [Citation96].
For lipid quantification, ten 3rd instar larvae were weighed and homogenized with 350 µl of hot methanol (60°C), spiked with 25 μg of ribitol (Sigma Aldrich, A5502) and 25 μg of nonadecanoic acid (Sigma Aldrich, N5252) as internal standards. The mixture was immediately incubated at 60°C for 10 min and sonicated for 10 min. Samples were then extracted with 350 µl of chloroform and 300 µl of water and centrifuged for 7 min at 14,000 g. The lower, nonpolar fraction was transferred to new vials and dried in a Speed-Vac concentrator. Non-targeted metabolite analysis was used to quantify sterols and diacylglycerols (DAG). The samples were methoximylated and silylated as described [Citation97]. One microliter of the derivatized samples was injected into an Agilent 6890 GC interfaced to an Agilent 5973 quadrupole MS with a HP-5 ms (5%-phenyl)-methylpolysiloxane column (30 m × 0.25 mm × 0.25 μm; Agilent, 19091 J-433E) in splitless mode. The temperature was programmed from 70 to 320°C at 5°C/min with helium flow rate at 1.0 mL/min and inlet temperature at 280°C. EI-MS ionization energy was set to 70 eV and the interface temperature was 280°C. The GC-MS data files were deconvoluted and searched against an in-house MS-library and the NIST 14 Mass Spectral Library using NIST AMDIS software [Citation98]. Triacylglycerols (TAG) were analyzed with an Agilent Technologies 1200 Series four solvent gradient capable HPLC coupled to Agilent 1200 series evaporative Light scattering detector (ELSD) and a Supelco Ascentis-Si (25 cm x2.1 mm x5 um) column. Elution was performed using mobile phases containing A: hexane with 1% isopropanol with 0.4% acetic acid added, and B: 100% isopropanol. The solvent gradient used was: 0–5 min 100% solvent A, 5–10 min gradient to 95% solvent A, 10–15 min 95% solvent A, 15–20 min 100% solvent A; with a flow rate of 0.8 ml/min. ELSD: Nitrogen flow was 2.1 with 110°C source temperature. A mixture of TAGs (2 mg/ml) was used as quantification standard. All lipids were normalized using the dry weight after extraction.
Autophagy, LysoTracker, Magic Red, filipin, and dextran assays
Dextran uptake assays to label lysosomes was performed as described [Citation39,Citation40]. Briefly, fed or starved larvae were washed, inverted and incubated with fluoro-Ruby-Dextran (1:100 of 100 mg/ml stock; 10,000 MW; Invitrogen, D1817) in Graces medium (Inivtrogen, 11605–094) for 10 min, followed by 6 washes and a 90-min chase to allow the Dextran to be transported to lysosomes. Fixation and staining was as described below. Colocalization was calculated using Pearson’s correlation coefficient, turning one channel by 180° as control [Citation42].
MA flux using imaging was determined using a tandem GFP-RFP-Atg8a reporter as described [Citation58]. Briefly, well-fed mid 3rd instar larvae of appropriate genotypes were washed with H2O and incubated for 3–4 h in 35-mm petri dishes with 3 Whatman filter paper (Fisher, 1001–329) soaked in 800 µl 20% sucrose supplemented with heat-inactivated yeast (fed; LabScientific, Fly-8040-10 or 20% sucrose only (for starvation) [Citation57]. After dissection and fixation, FB lobes of approximately 5 larvae were mounted in 20 µl DAPI fluoromount-G (Southern Biotech, 0100–20) per slide and imaged on an ApoTome.2 system using an Axiovert 200 equipped with a 63 × 1.4 NA oil lens (Carl-Zeiss, Oberkochen, Germany). Quantification was done using the atgCOUNTER script in Fiji to threshold and exclude nuclear signal [Citation58]. Average green puncta were subtracted from red puncta to obtain red only autolysosomes.
eMI activity was determined as described [Citation62] after recombining r4-Gal4 with UAS-KFERQ-PAmCherry 3B (once in Lamp16.1 background, the strain was backcrossed to homozygous Lamp16.1). FB was imaged as above.
For LysoTracker staining, 3rd instar larvae were starved in PBS (VWR, 45000–434) for 4 h () or 20% sucrose (Fig. S2). Larval or adult FB tissues were dissected in 1X PBS, incubated for 3 to 5 min in 0.1 μM LysoTracker – Red DND-99 (Life Technologies, L7528) [Citation56] and 1 μM Höchst 33342 (Thermo Fisher Scientific Inc, B1155) in PBS and immediately imaged using a Zeiss Imager (with or without ApooTome; larval FB), Zeiss 780 confocal or an Olympus BX51WI (adult tissues) with identical conditions across genotypes. FB cells that contained any LTR-positive puncta in adult flies or FB cells that contained more than 5 LTR-positive puncta in larvae were scored as positive.
For Magic Red staining (Cathepsin-B Assay Kit; Immunochemistry Technologies LLC, ICT937), larvae were starved for 4 h in 20% sucrose (supplemented with heat inactivated yeast for fed controls), washed and dissected in Graces medium (without serum in case of starved larvae). Larvae were inverted in the corresponding Graces medium and stained for 10 min in the same medium supplemented with Magic Red substrate (total dilution 1:150) and DAPI (14.3 M stock at 1:2000). After 2 rinses in corresponding Graces medium, FB was dissected on glass slides and immediately imaged on a Zeiss ApoTome with a 40x/1.3NA oil DIC lens.
Fixed larval FB were stained in a 1:5 dilution of 250 μg filipin/ml DMSO (Sigma-Aldrich, F4767) in PBS for 30 min in the dark, followed by 3 PBS washes [Citation99]. Samples were then equilibrated in PBS, 50% glycerol (Fisher, BP229-4) overnight and mounted in ProLong Gold Anti-Fade (Inivtrogen, P10144). For quantification, equivalent ROIs in the center of each image were selected in Fiji and their integrated density was quantified (after subtracting background intensity averaged from similar sized ROIs lacking tissue of randomly picked images of all genotypes).
Immunohistochemistry and TEM analyses
Lamp1 antibodies were generated against KLH coupled C-terminal peptide (CARRRSTSRGYMSF) in rabbits (#NY2403) by Covance (Denver, PA; animal protocol #20170902) and affinity purified for use in immunohistochemistry (1:400–1:1000). Staining of FB was done as described [Citation62,Citation100]. Rabbit anti-Snap29 [Citation59] was used at 1:1000. GP anti-Cp1 was a kind gift of Dr. P. Dolph (Dartmouth) and was used at 1:125 [Citation101]. Mouse anti-Hrs 27-4-s, Rab7-s, and Cnx99A 6-2-1-s were used at 1:10, and goat anti-Golgin245, and Gmap at 1:2000 (all DSHB). Secondary antibodies were Alexa Fluor 488 and Alexa Fluor 647 goat anti-rabbit and anti mouse (Invitrogen, A21245 and A11034), and Alexa Fluor 488 and Alexa Fluor 647 donkey anti-rabbit and anti-goat (Invitrogen, A31573 and A21447) were used at 1:300.
For TEM, larvae were treated and processed as above, and, after inversion, fixed with 2.0% paraformaldehyde, 2.5% glutaraldehyde in 0.1 M sodium cacodylate buffer, postfixed with 1% osmium tetroxide followed by 2% uranyl acetate, dehydrated through a graded series of ethanol and embedded in LX112 resin (LADD Research Industries, Fisher, NC9925769). Ultrathin sections were cut on a Leica Ultracut UC7, stained with uranyl acetate followed by lead citrate and viewed on a JEOL 1200EX transmission electron microscope at 80kv. Morphometric quantification was done by outlining indicated structures in Fiji/ImageJ and tabulating their area [Citation102] on blindly and randomly selected fields of view (excluding only nuclei). APGLs were identified as electron dense (dark) structures with very well or less-well (likely more degrading already) defined content, in contrast to ALs that were less electron dense (more similar to surrounding cytoplasm) and contained ill-defined content (advanced degradation). APGLs and ALs are likely similar to AVds in e.g [Citation18]. Lysosomes (L) are very electron dense without halo (distinguishing them from peroxisomes) and small. Structure density (area per field of view of 100 µm2) or size distribution was analyzed using the Mann-Whitney and Kolmogorov-Smirnov tests.
Statistical analysis
Statistical tests were done with GraphPad Prism (Versions 8&9; GraphPad Software, La Jolla, CA) using indicated tests and corrections. Unless noted, graphs represent means with standard error of means (SEM). “n=” indicates fields of view unless indicated. As larvae are bilaterally symmetric and have two main FB lobes, we cannot exclude that two fragments may have originally belonged to the same lobe in the preparation. It is therefore a reasonable estimate that the number of animals is minimally about n/2 and maximally equal to n.
Supplemental Material
Download Zip (220.8 MB)Acknowledgments
We thank Drs. T. Neufeld, S. Birmann, I. Nezis, G. Juhasz, T. Vaccari, K. Finley, and the Bloomington Drosophila Stock centers for kindly sharing fly strains. We are grateful to Drs. T. Vaccari and P. Dolph for antibodies and to Drs. Mimi Kim (Division of Biostatistics, Einstein) and Ana Maria Cuervo for advice on the analyses of TEM images. We thank Zoé Butti for help with longevity studies, Dr. L. Ambrosio for help with fly genetics, the W. M. Keck Metabolomics Research Laboratory at Iowa State University for help with lipidomics analyses, and Drs. J. Secombe and A. Melendez for comments on this manuscript and the Einstein Analytical Imaging Facility (NIH P30CA013330) for support. This work was supported by AHA postdoctoral fellowship 18POST34030231 (to A.M.), NIH/NIGMS grant GM119160 (to A.J.), and grants of the Roy J. Carver Charitable Foundation (Muscatine, Iowa) and NSF grant MCB–1714996 (to G.C.M.). A.R. and N.C. were further supported by Fulbright fellowships.
Disclosure statement
No potential conflict of interest was reported by the author(s).
Supplementry material
Supplemental data for this article can be accessed publisher’s website.
Additional information
Funding
Related Research Data
References
- Herb M, Gluschko A, Schramm M. LC3-associated phagocytosis - The highway to hell for phagocytosed microbes. Semin Cell Dev Biol. 2020 May;101:68–76.
- Pohl C, Dikic I. Cellular quality control by the ubiquitin-proteasome system and autophagy. Science. 2019 Nov 15;366(6467):818–822.
- Pryor PR, Luzio JP. Delivery of endocytosed membrane proteins to the lysosome. Biochim Biophys Acta. 2009 Apr;1793(4):615–624.
- Ballabio A, Bonifacino JS. Lysosomes as dynamic regulators of cell and organismal homeostasis. Nat Rev Mol Cell Biol. 2020 Feb;21(2):101–118.
- Savini M, Zhao Q, Wang MC. Lysosomes: Signaling hubs for metabolic sensing and longevity. Trends Cell Biol. 2019 Nov;29(11):876–887.
- Shin HR, Zoncu R. The lysosome at the intersection of cellular growth and destruction. Dev Cell. 2020 Jul 20;54(2):226–238.
- Trivedi PC, Bartlett JJ, and Pulinilkunnil T. Lysosomal biology and function: modern view of cellular debris bin. Cells. 2020 May 4;9(5):1131–1136.
- Kohler L, Puertollano R, Raben N. pompe disease: From basic science to therapy. Neurotherapeutics. 2018 Oct;15(4):928–942.
- Lloyd-Evans E, Platt FM. Lipids on trial: the search for the offending metabolite in Niemann-Pick type C disease. Traffic. 2010 Apr;11(4):419–428.
- Appelqvist H, Sandin L, Bjornstrom K, et al. Sensitivity to lysosome-dependent cell death is directly regulated by lysosomal cholesterol content. PLoS One. 2012;7(11):e50262.
- Kaushik S, Cuervo AM. Proteostasis and aging. Nat Med. 2015 Dec;21(12):1406–1415.
- Nixon RA. The role of autophagy in neurodegenerative disease. Nat Med. 2013 Aug;19(8):983–997.
- Terasawa K, Tomabechi Y, Ikeda M, et al. Lysosome-associated membrane proteins-1 and −2 (LAMP-1 and LAMP-2) assemble via distinct modes. Biochem Biophys Res Commun. 2016 Oct 21;479(3):489–495.
- Wilke S, Krausze J, Bussow K. Crystal structure of the conserved domain of the DC lysosomal associated membrane protein: implications for the lysosomal glycocalyx. BMC Biol. 2012 Jul 19;10(1):62.
- Bonifacino JS, Traub LM. Signals for sorting of transmembrane proteins to endosomes and lysosomes. Annu Rev Biochem. 2003;72(1):395–447.
- Braulke T, Bonifacino JS. Sorting of lysosomal proteins. Biochim Biophys Acta. 2009 Apr;1793(4):605–614.
- Rohrer J, Schweizer A, Russell D, et al. The targeting of Lamp1 to lysosomes is dependent on the spacing of its cytoplasmic tail tyrosine sorting motif relative to the membrane. J Cell Biol. 1996 Feb;132(4):565–576.
- Eskelinen EL. Roles of LAMP-1 and LAMP-2 in lysosome biogenesis and autophagy [review]. Mol Aspects Med. 2006 Oct-Dec;27(5–6):495–502.
- Hunziker W, Simmen T, Honing S. Trafficking of lysosomal membrane proteins in polarized kidney cells. Nephrologie. 1996;17(7):347–350.
- Andrejewski N, Punnonen EL, Guhde G, et al. Normal lysosomal morphology and function in LAMP-1-deficient mice. J Biol Chem. 1999 Apr 30;274(18):12692–12701.
- Eskelinen EL, Illert AL, Tanaka Y, et al. Role of LAMP-2 in lysosome biogenesis and autophagy. Mol Biol Cell. 2002 Sep;13(9):3355–3368.
- Tanaka Y, Guhde G, Suter A, et al. Accumulation of autophagic vacuoles and cardiomyopathy in LAMP-2-deficient mice. Nature. 2000 Aug 24;406(6798):902–906.
- Nishino I, Fu J, Tanji K, et al. Primary LAMP-2 deficiency causes X-linked vacuolar cardiomyopathy and myopathy (Danon disease). Nature. 2000 Aug 24;406(6798):906–910.
- Rowland TJ, Sweet ME, Mestroni L, et al. Danon disease - dysregulation of autophagy in a multisystem disorder with cardiomyopathy. J Cell Sci. 2016 Jun 1;129(11):2135–2143.
- Hubert V, Peschel A, Langer B, et al. LAMP-2 is required for incorporating syntaxin-17 into autophagosomes and for their fusion with lysosomes. Biol Open. 2016 Oct 15;5(10):1516–1529.
- Eskelinen EL, Schmidt CK, Neu S, et al. Disturbed cholesterol traffic but normal proteolytic function in LAMP-1/LAMP-2 double-deficient fibroblasts. Mol Biol Cell. 2004 Jul;15(7):3132–3145.
- Cuervo AM, Dice JF. A receptor for the selective uptake and degradation of proteins by lysosomes [research support, non-U.S. Gov’t research support, U.S. Gov’t, P.H.S.]. Science. 1996 Jul 26;273(5274):501–503.
- Kaushik S, Cuervo AM. The coming of age of chaperone-mediated autophagy. Nat Rev Mol Cell Biol. 2018 Jun;19(6):365–381.
- Scrivo A, Bourdenx M, Pampliega O, et al. Selective autophagy as a potential therapeutic target for neurodegenerative disorders. Lancet Neurol. 2018 Sep;17(9):802–815.
- Gonzalez-Polo RA, Boya P, Pauleau AL, et al. The apoptosis/autophagy paradox: autophagic vacuolization before apoptotic death. J Cell Sci. 2005 Jul 15;118(Pt 14):3091–3102.
- Kaushik S, Cuervo AM. Chaperone-mediated autophagy: a unique way to enter the lysosome world [Research support, N.I.H., extramural research support, non-U.S. Gov’t review]. Trends Cell Biol. 2012 Aug;22(8):407–417.
- Chi C, Leonard A, Knight WE, et al. LAMP-2B regulates human cardiomyocyte function by mediating autophagosome-lysosome fusion. Proc Natl Acad Sci U S A. 2019 Jan 8;116(2):556–565.
- Thurmond J, Goodman JL, Strelets VB, et al. FlyBase 2.0: the next generation. Nucleic Acids Res. 2019 Jan 8;47(D1):D759–D765.
- Lescat L, Veron V, Mourot B, et al. Chaperone-mediated autophagy in the light of evolution: insight from fish. Mol Biol Evol. 2020 Oct 1;37(10):2887–2899.
- David A, Tiveron MC, Defays A, et al. BAD-LAMP defines a subset of early endocytic organelles in subpopulations of cortical projection neurons. J Cell Sci. 2007 Jan 15;120(Pt 2):353–365.
- Koebis M, Urata S, Shinoda Y, et al. LAMP5 in presynaptic inhibitory terminals in the hindbrain and spinal cord: a role in startle response and auditory processing. Mol Brain. 2019 Mar 12;12(1):20.
- Tiveron MC, Beurrier C, Ceni C, et al. LAMP5 fine-tunes GABAergic synaptic transmission in defined circuits of the mouse brain. PLoS One. 2016;11(6):e0157052.
- Janvier K, Bonifacino JS. Role of the endocytic machinery in the sorting of lysosome-associated membrane proteins. Mol Biol Cell. 2005 Sep;16(9):4231–4242.
- Entchev EV, Schwabedissen A, Gonzalez-Gaitan M. Gradient formation of the TGF-beta homolog Dpp. Cell. 2000 Dec 8;103(6):981–991.
- Rusten TE, Vaccari T, Lindmo K, et al. ESCRTs and Fab1 regulate distinct steps of autophagy [Research Support, N.I.H., Extramural Research Support, Non-U.S. Gov’t]. Curr Biol. 2007 Oct 23;17(20):1817–1825.
- Ohkuma S, Poole B. Fluorescence probe measurement of the intralysosomal pH in living cells and the perturbation of pH by various agents. Proc Natl Acad Sci U S A. 1978 Jul;75(7):3327–3331.
- Dunn KW, Kamocka MM, McDonald JH. A practical guide to evaluating colocalization in biological microscopy. Am J Physiol Cell Physiol. 2011 Apr;300(4):C723–42.
- Port F, Chen HM, Lee T, et al. Optimized CRISPR/Cas tools for efficient germline and somatic genome engineering in Drosophila. Proc Natl Acad Sci U S A. 2014 Jul 22;111(29):E2967–76.
- Tarentino AL, Plummer TH Jr., Maley F. The release of intact oligosaccharides from specific glycoproteins by endo-beta-N-acetylglucosaminidase H. J Biol Chem. 1974 Feb 10;249(3):818–824.
- Tarentino AL, Trimble RB, Plummer TH Jr. Enzymatic approaches for studying the structure, synthesis, and processing of glycoproteins. Methods Cell Biol. 1989;32:111–139.
- Hayakawa A, Kitamura N. Early endosomal localization of hrs requires a sequence within the proline- and glutamine-rich region but not the FYVE finger. J Biol Chem. 2000 Sep 22;275(38):29636–29642.
- Juhasz G, Neufeld TP. Experimental control and characterization of autophagy in Drosophila. Methods Mol Biol. 2008;445:125–133.
- Wucherpfennig T, Wilsch-Brauninger M, Gonzalez-Gaitan M. Role of Drosophila Rab5 during endosomal trafficking at the synapse and evoked neurotransmitter release. J Cell Biol. 2003 May 12;161(3):609–624.
- Ambrosio L, Morriss S, Riaz A, et al. Phylogenetic analyses and characterization of RNase X25 from Drosophila melanogaster suggest a conserved housekeeping role and additional functions for RNase T2 enzymes in protostomes. PLoS One. 2014;9(8):e105444.
- Li HM, Sun L, Mittapalli O, et al. Transcriptional signatures in response to wheat germ agglutinin and starvation in Drosophila melanogaster larval midgut. Insect Mol Biol. 2009 Feb;18(1):21–31.
- Bouche V, Espinosa AP, Leone L, et al. Drosophila Mitf regulates the V-ATPase and the lysosomal-autophagic pathway. Autophagy. 2016;12(3):484–498.
- Hegedus K, Takats S, Boda A, et al. The Ccz1-Mon1-Rab7 module and Rab5 control distinct steps of autophagy. Mol Biol Cell. 2016 Oct 15;27(20):3132–3142.
- Van Noorden CJ, Jonges TG, Van Marle J, et al. Heterogeneous suppression of experimentally induced colon cancer metastasis in rat liver lobes by inhibition of extracellular cathepsin B. Clin Exp Metastasis. 1998 Feb;16(2):159–167.
- Honsi TG, Stenersen J. Activity and localisation of the lysosomal marker enzymes acid phosphatase, N-acetyl-beta-D-glucosaminidase, and beta-galactosidase in the earthworms Eisenia fetida and E. veneta. Comp Biochem Physiol B Biochem Mol Biol. 2000 Mar;125(3):429–437.
- Ashtari N, Jiao X, Rahimi-Balaei M, et al. Lysosomal acid phosphatase biosynthesis and dysfunction: a mini review focused on lysosomal enzyme dysfunction in brain. Curr Mol Med. 2016;16(5):439–446.
- Scott RC, Schuldiner O, Neufeld TP. Role and regulation of starvation-induced autophagy in the Drosophila fat body [Research Support, U.S. Gov’t, P.H.S.]. Dev Cell. 2004 Aug;7(2):167–178.
- Rusten TE, Lindmo K, Juhasz G, et al. Programmed autophagy in the Drosophila fat body is induced by ecdysone through regulation of the PI3K pathway [Research Support, Non-U.S. Gov’t]. Dev Cell. 2004 Aug;7(2):179–192.
- Jacomin AC, Nezis IP. Using fluorescent reporters to monitor autophagy in the female germline cells in drosophila melanogaster. Methods Mol Biol. 2016;1457:69–78.
- Morelli E, Ginefra P, Mastrodonato V, et al. Multiple functions of the SNARE protein Snap29 in autophagy, endocytic, and exocytic trafficking during epithelial formation in Drosophila. Autophagy. 2014;10(12):2251–2268.
- Takats S, Nagy P, Varga A, et al. Autophagosomal Syntaxin17-dependent lysosomal degradation maintains neuronal function in Drosophila. J Cell Biol. 2013 May 13;201(4):531–539.
- Sahu R, Kaushik S, Clement CC, et al. Microautophagy of cytosolic proteins by late endosomes [Research Support, N.I.H., Extramural]. Dev Cell. 2011 Jan 18;20(1):131–139.
- Mukherjee A, Patel B, Koga H, et al. Selective endosomal microautophagy is starvation-inducible in Drosophila. Autophagy. 2016;3:1984–1999.
- Uytterhoeven V, Lauwers E, Maes I, et al. Hsc70-4 deforms membranes to promote synaptic protein turnover by endosomal microautophagy. Neuron. 2015 Nov 18;88(4):735–748.
- Eskelinen EL, Cuervo AM, Taylor MR, et al. Unifying nomenclature for the isoforms of the lysosomal membrane protein LAMP-2. Traffic. 2005 Nov;6(11):1058–1061.
- Kaushik S, Bandyopadhyay U, Sridhar S, et al. Chaperone-mediated autophagy at a glance [research support, N.I.H., extramural research support, non-U.S. Gov’t]. J Cell Sci. 2011 Feb 15;124(Pt 4):495–499.
- Koga H, Martinez-Vicente M, Macian F, et al. A photoconvertible fluorescent reporter to track chaperone-mediated autophagy [Research Support, N.I.H., extramural research support, non-U.S. Gov’t]. Nat Commun. 2011;2:386.
- Li J, and Pfeffer SR. Lysosomal membrane glycoproteins bind cholesterol and contribute to lysosomal cholesterol export. Elife. 2016 Sep 24;5:21635–21651.
- Heier C, Kuhnlein RP. Triacylglycerol metabolism in drosophila melanogaster. Genetics. 2018 Dec;210(4):1163–1184.
- Xu H, Ren D. Lysosomal physiology. Annu Rev Physiol. 2015;77:57–80.
- Huynh KK, Eskelinen EL, Scott CC, et al. LAMP proteins are required for fusion of lysosomes with phagosomes. EMBO J. 2007 Jan 24;26(2):313–324.
- Santambrogio L, Cuervo AM. Chasing the elusive mammalian microautophagy. Autophagy. 2011 Jun;7(6):652–654.
- Meng Y, Heybrock S, Neculai D, et al. Cholesterol handling in lysosomes and beyond. Trends Cell Biol. 2020 Jun;30(6):452–466.
- Knittelfelder O, Prince E, Sales S, et al. Sterols as dietary markers for Drosophila melanogaster. Biochim Biophys Acta Mol Cell Biol Lipids. 2020 Jul;1865(7):158683.
- Schneede A, Schmidt CK, Holtta-Vuori M, et al. Role for LAMP-2 in endosomal cholesterol transport. J Cell Mol Med. 2011 Feb;15(2):280–295.
- Toprak U, Hegedus D, Dogan C, et al. A journey into the world of insect lipid metabolism. Arch Insect Biochem Physiol. 2020 Jun;104(2):e21682.
- Palm W, Sampaio JL, Brankatschk M, et al. Lipoproteins in Drosophila melanogaster–assembly, function, and influence on tissue lipid composition. PLoS Genet. 2012;8(7):e1002828.
- Matsuo N, Nagao K, Suito T, et al. Different mechanisms for selective transport of fatty acids using a single class of lipoprotein in Drosophila. J Lipid Res. 2019 Jul;60(7):1199–1211.
- Couto NF, Pedersane D, Rezende L, et al. LAMP-2 absence interferes with plasma membrane repair and decreases T. cruzi host cell invasion. PLoS Negl Trop Dis. 2017 Jun;11(6):e0005657.
- Albertti LA, Macedo AM, Chiari E, et al. Role of host lysosomal associated membrane protein (LAMP) in Trypanosoma cruzi invasion and intracellular development. Microbes Infect. 2010 Sep;12(10):784–789.
- Petersen W, Stenzel W, Silvie O, et al. Sequestration of cholesterol within the host late endocytic pathway restricts liver-stage Plasmodium development. Mol Biol Cell. 2017 Mar 15;28(6):726–735.
- Sobo K, Le Blanc I, Luyet PP, et al. Late endosomal cholesterol accumulation leads to impaired intra-endosomal trafficking. PLoS One. 2007 Sep 5;2(9):e851.
- Meneses-Salas E, Garcia-Melero A, and Blanco-Munoz P, et al. Selective degradation permits a feedback loop controlling annexin A6 and cholesterol levels in endolysosomes of NPC1 mutant cells. Cells. 2020 May 7;9(5):1152–1168.
- Jacomin AC, Fauvarque MO, Taillebourg E. A functional endosomal pathway is necessary for lysosome biogenesis in Drosophila. BMC Cell Biol. 2016 Nov 16;17(1):36.
- Dereeper A, Guignon V, Blanc G, et al. Phylogeny.fr: robust phylogenetic analysis for the non-specialist. Nucleic Acids Res. 2008 Jul 1;36:W465–9.
- Madeira F, Park YM, Lee J, et al. The EMBL-EBI search and sequence analysis tools APIs in 2019. Nucleic Acids Res. 2019 Jul 2;47(W1):W636–W641.
- Ronquist F, Teslenko M, van der Mark P, et al. MrBayes 3.2: efficient Bayesian phylogenetic inference and model choice across a large model space. Syst Biol. 2012 May;61(3):539–542.
- Thibault ST, Singer MA, Miyazaki WY, et al. A complementary transposon tool kit for Drosophila melanogaster using P and piggyBac. Nat Genet. 2004 Mar;36(3):283–287.
- Juhasz G, Hill JH, Yan Y, et al. The class III PI(3)K Vps34 promotes autophagy and endocytosis but not TOR signaling in Drosophila [Research Support, N.I.H., Extramural]. J Cell Biol. 2008 May 19;181(4):655–666.
- Pircs K, Nagy P, Varga A, et al. Advantages and limitations of different p62-based assays for estimating autophagic activity in Drosophila. PLoS One. 2012;7(8):e44214.
- Issa AR, Sun J, Petitgas C, et al. The lysosomal membrane protein LAMP2A promotes autophagic flux and prevents SNCA-induced Parkinson disease-like symptoms in the Drosophila brain. Autophagy. 2018;14(11):1898–1910.
- Simonsen A, Cumming RC, Brech A, et al. Promoting basal levels of autophagy in the nervous system enhances longevity and oxidant resistance in adult Drosophila [Research Support, Non-U.S. Gov’t]. Autophagy. 2008 Feb;4(2):176–184.
- Livak KJ, Schmittgen TD. Analysis of relative gene expression data using real-time quantitative PCR and the 2(-Delta Delta C(T)) Method. Methods. 2001 Dec;25(4):402–408.
- Low P, Varga A, Pircs K, et al. Impaired proteasomal degradation enhances autophagy via hypoxia signaling in Drosophila. BMC Cell Biol. 2013 Jun 25;14:29.
- Klionsky DJ, Abdelmohsen K, Abe A, et al. Guidelines for the use and interpretation of assays for monitoring autophagy (3rd edition). Autophagy. 2016;12(1):1–222.
- Xu T, Nicolson S, Sandow JJ, et al. Cp1/cathepsin L is required for autolysosomal clearance in Drosophila. Autophagy. 2020;28:1–16.
- Ahmed SU, Rojo E, Kovaleva V, et al. The plant vacuolar sorting receptor AtELP is involved in transport of NH(2)-terminal propeptide-containing vacuolar proteins in Arabidopsis thaliana. J Cell Biol. 2000 Jun 26;149(7):1335–1344.
- McVey PA, Alexander LE, Fu X, et al. Light-dependent changes in the spatial localization of metabolites in solenostemon scutellarioides (coleus henna) visualized by matrix-free atmospheric pressure electrospray laser desorption ionization mass spectrometry imaging. Front Plant Sci. 2018;9:1348.
- Stein S. An integrated method for spectrum extraction and compound identification from gas chromatography/mass spectrometry data. J Am Soc Mass Spectrom. 1999;10(8):770–781.
- Voght SP, Fluegel ML, Andrews LA, et al. Drosophila NPC1b promotes an early step in sterol absorption from the midgut epithelium. Cell Metab. 2007 Mar;5(3):195–205.
- Mesquita A, Glenn J, and Jenny A. Differential activation of eMI by distinct forms of cellular stress. Autophagy. 2020 Jun 5;195–205.
- Kinser RD, Dolph PJ. Cathepsin proteases mediate photoreceptor cell degeneration in Drosophila. Neurobiol Dis. 2012 Jun;46(3):655–662.
- Schindelin J, Arganda-Carreras I, Frise E, et al. Fiji: an open-source platform for biological-image analysis. Nat Methods. 2012 Jun 28;9(7):676–682.