
ABSTRACT
Cognitive impairment caused by systemic chemotherapy is a critical question that perplexes the effective implementation of clinical treatment, but related molecular events are poorly understood. Herein, we show that bortezomib exposure leads to microglia activation and cognitive impairment, this occurs along with decreased nuclear translocation of TFEB (transcription factor EB), which is linked to macroautophagy/autophagy disorder, STAT3 (signal transducer and activator of transcription 3) phosphorylation and IL23A (interleukin 23 subunit alpha) expression. Pharmacological enhancement of TFEB nuclear translocation by digoxin restores lysosomal function and reduces STAT3-dependent endothelial IL23A secretion. As a consequence, we found that brain endothelial-specific ablation of Il23a ameliorated both microglia activation and cognitive dysfunction. Thus, the endothelial TFEB-STAT3-IL23A axis in the brain represents a critical cellular event for initiating bortezomib-mediated aberrant microglial activation and synapse engulfment. Our results suggest the reversal of TFEB nuclear translocation may provide a novel therapeutic approach to prevent symptoms of cognitive dysfunction during clinical use of bortezomib.
Abbreviations: AAV: adeno-associated virus; BBB: blood-brain barrier; BTZ: bortezomib; DG: digoxin; DGs: dentate gyrus; DLG4/PSD95: discs large MAGUK scaffold protein 4; HBMECs: human brain microvascular endothelial cells; HP: hippocampus; IL23A: interleukin 23 subunit alpha; MBVECs: mouse brain vascular endothelial cells; mPFC: medial prefrontal cortex; NORT: novel object recognition test; OLT: object location test; PLX5622: 6-fluoro-N-([5-fluoro-2-methoxypyridin-3-yl]methyl)-5-(5-methyl-1H-pyrrolo[2,3-b]pyridin-3- yl)methyl; PPP3/calcineurin: protein phosphatase 3; SBEs: STAT3 binding elements; shRNA: small hairpin RNA; SLC17A7/VGLUT1: solute carrier family 17 member 7; SLC32A1/VGAT: solute carrier family 32 member 1; STAT3: signal transducer and activator of transcription 3, TFEB: transcription factor EB; Ub: ubiquitin.
Introduction
Chemotherapy has succeeded in increasing the survival rates of cancer patients. However, a number of clinical studies have shown that systemic chemotherapy causes long-term central nervous system deficits [Citation1,Citation2]. More than 60% of patients who receive systemic chemotherapy develop serious cognitive disabilities, which significantly influence survival and quality of life [Citation3]. Although much attention has focused on chemotherapy-related cognitive impairment, which is also known as “chemobrain” or “chemofog”, the cellular and molecular mechanisms remain unclear [Citation4].
Generally, chemotherapy drugs do not easily cross the blood-brain barrier (BBB) and cause brain damage. The BBB forms a tightly regulated neurovascular unit that is constructed of endothelial cells, pericytes, astrocytes and neurons and protects against circulating toxins or drugs entering the brain and maintains homeostasis [Citation5]. Bortezomib (BTZ), a first-in-class proteasome inhibitor, is used to treat mantle cell lymphoma and multiple myeloma and is reported to poorly cross the BBB [Citation6]. However, accumulating clinical and imaging results show that BTZ can induce neurological syndrome characterized by epilepsy, confusion, loss of consciousness, paralysis and numbness [Citation7–9]. To date, little is known about the origin and role of BTZ-induced molecular events involved in nervous system disorders.
Protein homeostasis is essential for cell health and survival, and the ubiquitin proteasome system and autophagy-lysosome proteolytic system play core roles in maintaining protein homeostasis [Citation10]. Abnormal autophagy is associated with various brain diseases, including neurodegenerative diseases, autism spectrum disorders and ethanol-induced neurotoxicity [Citation11–13]. BTZ blocks the activity of the 26S proteasome and inhibits the ubiquitin proteasome pathway, which induces protein aggregation [Citation14]. Whether BTZ-induced brain dysfunction is associated with the autophagy-lysosome mechanism requires further in-depth study.
Here, we provide compelling evidence that the chemotherapeutic drug BTZ induces the release of the inflammatory factor IL23A in the serum of patients and medium by human brain microvascular endothelial cells (HBMECs) in vitro, which enhanced microglial phagocytosis, resulting in neuronal synaptic protein engulfment. Of note, we found novel pharmacological effects of digoxin, which promoted the nuclear translocation of TFEB and ameliorated cognitive impairment by blocking TFEB-STAT3-IL23A pathway-mediated inflammatory events.
Results
Bortezomib administration induces cognitive dysfunction and aberrant microglial activation in mice
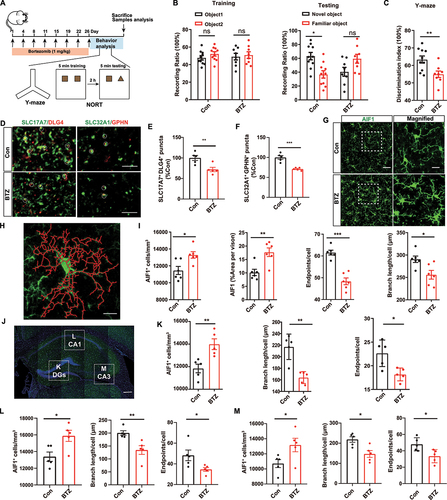
To ascertain whether chemotherapy leads to cognitive dysfunction, BTZ was injected intraperitoneally into mice (1 mg/kg) twice per week for 4 consecutive weeks (). We found that BTZ-treated mice showed significant deficits in novel object discrimination and spatial memory during novel object recognition test (NORT) () and Y-maze test (). Neuronal synapses are critical for memory formation and consolidation [Citation15]. Furthermore, we examined changes in synapse-associated proteins and found that both SCL17A7/VGLUT1-DLG4/PSD95 (a marker for excitatory synapses) and SLC32A1/VGAT-GPHN (gephyrin; a marker for inhibitory synapses) were decreased in hippocampus (HP) of mice following BTZ treatment (). Therefore, these results suggested that BTZ administration induced neuronal synaptic protein loss and cognitive dysfunction in mice.
Figure 1. Bortezomib induces cognitive function change and microglial activation in mice. (A) Schematic illustration of the BTZ administration strategy in mice. (B) Quantitation of NORT data from mice with or without BTZ administration (mean ± SEM; n = 8–10 mice per group; * P < 0.05, ns: not significant; two-way ANOVA with Sidak’s multiple comparisons test). (C) Changes in spontaneous alternation behavior in the Y-maze (mean ± SEM; n = 8–10 mice per group; ** P < 0.01; unpaired Student’s t-test). (D) Representative image of excitatory and inhibitory synapses in HP after BTZ exposure. SLC17A7, excitatory presynaptic marker; DLG4, excitatory postsynaptic marker; SLC32A1, inhibitory presynaptic marker; GPHN, inhibitory postsynaptic marker. Scale bar: 5 μm. (E and F) Quantification of SLC17A7+ DLG4+ and SLC32A1+ GPHN+-puncta in (D). (mean ± SEM; n = 5 mice per group; ** P < 0.01, ***P < 0.001; unpaired Student’s t-test). (G) Representative immunofluorescence images showing AIF1 (green, microglia marker) in the mPFC from control or BTZ-treated mice. Scale bar: 50 μm; magnified image: 20 μm. (H) Schematic of microglial cytoskeletal reconstruction. Scale bar: 20 μm. (I) Quantification of AIF1-positive microglia in the mPFC by microglial skeleton reconstruction (mean ± SEM; n = 6 mice per group; * P < 0.05, ** P < 0.01, *** P < 0.001; unpaired Student’s t-test). (J) Representative immunofluorescence images showing AIF1 (green) in DGs, CA1 and CA3 of HP. DAPI (blue), nuclear marker. Scale bar: 200 μm. (K-M) Quantification of number, branch length and endpoint in AIF1-positive cells of DGs (K), CA1 (L) and CA3 (M) (mean ± SEM; n = 5 mice per group; * P < 0.05, ** P < 0.01; unpaired Student’s t-test).
To explore whether BTZ exposure affects the microenvironment of the brain, which may result in chemotherapy drug accumulation in the parenchyma and further impair synapse and cognitive function, we first examined the impact of BTZ on BBB integrity and permeability. We extracted whole cerebral microvessels from mice treated with BTZ or PBS and performed western blotting. The data showed no changes in the levels of tight junction proteins, such as TJP1/ZO-1, CDH5/VE-cadherin, OCLN (occludin) and CLDN5 (claudin 5) (Fig. S1A and S1B). Consistently, the immunostaining data from the medial prefrontal cortex (mPFC) suggested that the colocalization of CLDN5 and Lectin (a marker for vascular endothelium) did not change in response to BTZ or PBS treatment (Fig. S1C and S1D). Moreover, we also found that there was no leakage of endogenous vascular proteins, including ALB (albumin), FG (fibrinogen) and several exogenous tracers ranging from small to large molecular sizes in mPFC of mouse with or without BTZ treatment (Fig. S1E-S1I). These results showed that BTZ had no effect on BBB permeability or integrity, suggesting that BBB status does not explain the phenotype of cognitive impairment in mice.
Microglia play important roles in maintaining the homeostasis of the brain microenvironment [Citation16]. However, aberrantly activated microglia can weaken neural synapse connections and circuits [Citation17,Citation18]. Immunostaining data from the mPFC revealed an increased number of AIF1/Iba1-positive microglia and an increased area in BTZ-exposed mice compared to control mice (). Microglial cytoskeleton analysis showed that microglia were activated and exhibited diminished endpoints and branch lengths (). Similar results were observed in the CA1, CA3 and dentate gyrus (DGs) region of the HP (). In addition, reactive astrocytes were not observed, as determined by quantifying the number of S100B/S100β and GFAP dual-positive astrocytes in BTZ- and control-treated mice (Fig. S1J and S1K). These results demonstrated that BTZ induced aberrant microglial activation in mice.
Microglia mediates excessive synaptic pruning following bortezomib treatment
Previous studies have indicated that activated microglia mediates excessive synaptic pruning and participate in cognitive impairment [Citation19]. Therefore, we investigated whether BTZ-mediated microglial activation was necessary for synapse loss. Mice were subjected to BTZ treatment as described above, and at D12, half of the BTZ-exposed mice were fed chow containing PLX5622, which inhibits colony stimulating factor 1 receptor required for microglial survival [Citation20]. The other half of the mice received control chow (Fig. S2A). As described previously [Citation21], approximately 80% of microglia were depleted after the mice were fed chow containing PLX5622 for 14 days (Fig. S2B and S2C). PLX5622 administration resulted in the significant restoration of synapse-associated proteins of SLC17A7-DLG4 and SLC32A1-GPHN during BTZ exposure (Fig. S2D and S2E), which correlated with microglial synaptic engulfment (Fig. S2F-S2I). To determine whether microglial depletion reverses the deleterious effects of BTZ-induced cognitive dysfunction, we performed OLT and NORT. Feeding mice PLX5622 chow to deplete microglia rescued learning and memory deficits (Fig. S2J and S2K). In conclusion, our data suggested that excessive microglia-mediated synaptic pruning participated in BTZ-induced cognitive dysfunction.
Bortezomib induces endothelial autophagic substrate accumulation associated with dysregulation of the TFEB pathway
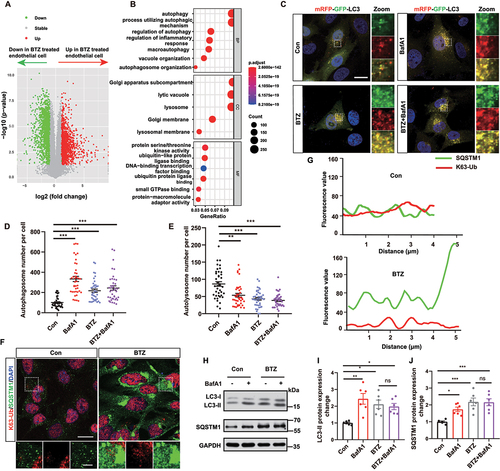
Brain vascular endothelial cells, which are the first layer of the BBB, are sensitive to external stimuli and performs communications with cells in the brain [Citation22,Citation23]. Next, we investigated the effects of BTZ on brain vascular endothelial cells. We treated mouse brain microvascular endothelial cells (bEnd.3 cells) with or without BTZ (20 nmol/L) for 24 h and performed RNA sequencing (RNA-seq) analysis. The RNA-seq data showed abundant upregulated genes and downregulated genes in BTZ-treated cells compared to control cells (). GO term analysis showed differential gene expression enriched in autophagy-lysosome pathway () in bEnd.3 cells following BTZ exposure. The subsequent autophagic degradation of the aggresome after proteasome inhibition has been well established [Citation24]. To clarify the changes of autophagy in HBMECs after BTZ treatment, we examined autophagic flux by constructing and transfecting mRFP-GFP-LC3 adenovirus to HBMECs with bafilomycin A1 (BafA1) or not, in which BafA1 was used as blocker of autophagy flux. The results showed that the number of autopagosome puncta increased and the number of autolysosome puncta decreased in HBMEC with BafA1, BTZ or BafA1+ BTZ treatment (), which indicated autophagic flux was inhibited. SQSTM1/p62 forms oligomers that recognize cargo proteins with K63-linked polyubiquitination [Citation25]. We found increased colocalization of SQSTM1 and K63-linked ubiquitination proteins and the accumulation of SQSTM1 aggregates, which suggested that autophagic cargo could not be degraded and autophagic clearance was inhibited (). Consistently, the western blot results verified increased expression of LC3-II and SQSTM1 protein in HBMECs with BafA1, BTZ or BafA1+ BTZ treatment (). Therefore, our results showed that BTZ exposure induced disturbances in autophagy, including autophagic flux blocking and the accumulation of autophagic cargo in HBMECs.
Figure 2. Bortezomib causes autophagic substrate accumulation in endothelial cells. (A) Volcano map showing differentially expressed genes in endothelial cells with or without BTZ exposure. Green represents downregulated genes, and red represents upregulated genes. (B) GO term enrichment analysis of differentially expressed genes. (C) Representative images showing GFP-LC3 (green), mRFP-LC3 (red) and DAPI (blue, nuclei). Scale bar: 20 μm; magnified image: 5 μm. (D and E) Quantification of the number of yellow puncta (autophagosome) (D) and red puncta (autolysosome) (E) in HBMECs from control or BTZ treatment in the presence or absence of BafA1 in (C) (mean ± SEM; n = 40 cells from 3 independent experiments; ** P < 0.01, *** P < 0.001; one-way ANOVA with Tukey’s multiple comparisons test). (F) Representative images of SQSTM1 (green) and K63-linked ubiquitin (K63-Ub, red) staining in the control or BTZ-treated group from three independent experiments. Scale bar: 20 μm; magnified image: 5 μm. (G) Fluorescence values of SQSTM1 (green) and K63-linked ubiquitination proteins (red) in (F). (H-J) Representative bands and quantification of LC3-II and SQSTM1 protein expression in HBMECs exposed to BTZ and BafA1 (mean ± SEM; n = 6 independent experiments; * P < 0.05, ** P < 0.01, *** P < 0.001; one-way ANOVA with Tukey’s multiple comparisons test).
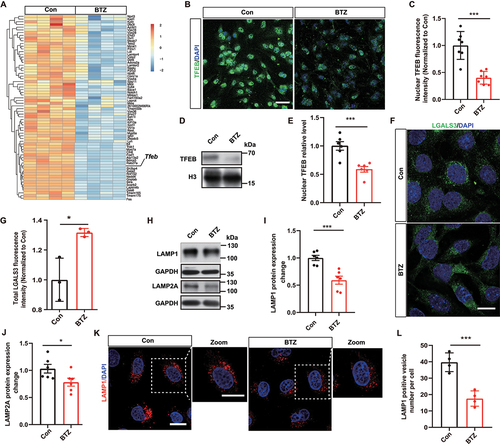
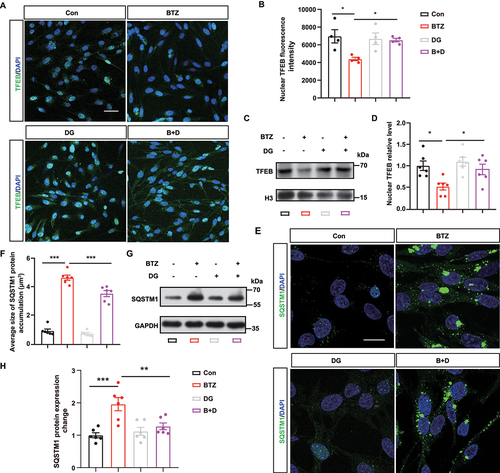
Furthermore, RNA-seq analysis showed downregulated lysosome-associated genes and reduced Tfeb mRNA levels when bEnd.3 were exposed to BTZ (). TFEB is considered a crucial driver of lysosome biogenesis regulation and proteostasis maintenance. We verified TFEB protein expression by immunostaining, and the findings indicated that nuclear TFEB protein levels were significantly decreased in BTZ-treated HBMECs (). Consistently, reduced nuclear translocation of TFEB was shown by western blot analysis (). Moreover, we found that staining for LGALS3/GAL3, which marks damaged lysosomal membranes, was significantly increased in BTZ-treated HBMECs compared to control HBMECs (). To verify whether TFEB controls downstream lysosome biogenesis-associated gene expression [Citation26,Citation27], we measured the expression of the lysosome-associated membrane proteins LAMP1 and LAMP2A. The results suggested decreased protein expression of LAMP1 and LAMP2A following BTZ exposure in HBMECs (). A similar result was observed by immunostaining and quantifying the number of LAMP1-positive lysosomes (). Our data revealed that BTZ impaired lysosome biogenesis via the TFEB-lysosome pathway, which could contribute to autophagic substrate accumulation in brain vascular endothelial cells.
Figure 3. Bortezomib impairs the TFEB-lysosome pathway and induces lysosomal deficits in endothelial cells. (A) Heatmap showing decreased lysosome-associated gene expression by RNA-seq analysis. (B) Representative images of TFEB (green) and DAPI (blue, nuclei) in the control or BTZ-treated group. Scale bar: 50 μm. (C) Quantification of the nuclear fluorescence intensity of TFEB in (B) (mean ± SEM; n = 7 independent experiments; *** P < 0.001; unpaired Student’s t-test). (D and E) Representative bands and quantification of nuclear TFEB protein levels in endothelial cells with or without BTZ treatment (mean ± SEM; n = 6 independent experiments; *** P < 0.001; unpaired Student’s t-test). (F) Representative images of LGALS3 (green) and DAPI (blue, nuclei) in the control or BTZ-treated group. Scale bar: 20 μm. (G) Quantification of the fluorescence intensity of LGALS3 in (F) (mean ± SEM; n = 3 independent experiments; * P < 0.05; unpaired Student’s t-test). (H-J) Representative bands and quantification of LAMP1 and LAMP2A protein expression in the control or BTZ-treated group. (mean ± SEM; n = 6 independent experiments; * P < 0.05, *** P < 0.001; unpaired Student’s t-test). (K and L) Representative images and quantification of LAMP1-positive lysosomes in control or BTZ-treated HBMECs (mean ± SEM; n = 4 independent experiments; *** P < 0.001; unpaired Student’s t-test).
Digoxin attenuates bortezomib-induced protein aggregation by restoring nuclear TFEB translocation
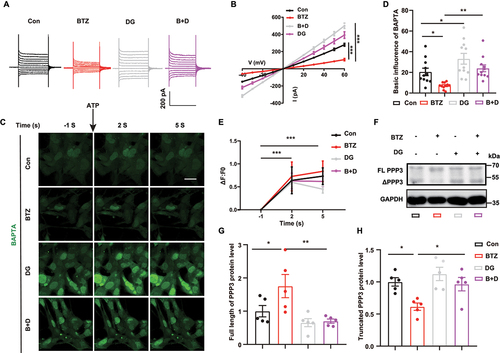
As BTZ exposure impaired lysosome biogenesis via the TFEB-lysosome pathway, the role of the phosphatase PPP3/calcineurin, which modulates TFEB, was further investigated. Calcium activates TFEB via the phosphatase PPP3 [Citation28]. Here, we found that BTZ decreased Ca2+ current in HBMECs, as shown by whole-cell patch recording. Interestingly, digoxin, a Na+/K+ ATPase activity inhibitor, increased the Ca2+ current, which reversed the BTZ-mediated decrease in the Ca2+ current (). Consistently, image analysis using the Ca2+ probe BAPTA showed that digoxin significantly restored the Ca2+ fluorescence intensity of living HBMECs in the BTZ-treated group (). Subsequently, we examined Na+/K+ ATPase activity and PPP3 expression after BTZ and digoxin treatment. BTZ increased Na+/K+ ATPase activity, which was inhibited by digoxin, as shown by the Na+/K+ ATPase activity assays (Fig. S3A). In addition, digoxin abolished the inhibitory effect of BTZ on the active form of PPP3 proteolytic fragments (ΔPPP3), a 48-kDa product cleaved from full-length PPP3 (FL-PPP3) ().
Figure 4. Digoxin restores PPP3 activity by increase Ca2+ currents in HBMECs. (A) Representative Ca2+ currents were recorded by whole-cell patch clamping in HBMECs with or without digoxin treatment in the presence of BTZ. (B) Quantification of the Ca2+ current in (A) (mean ± SEM; n = 3 independent experiments; *** P < 0.001; two-way ANOVA with Tukey’s multiple comparisons test). (C) Representative images of BAPTA fluorescence in living cells with or without digoxin treatment of control or BTZ-exposed HBMECs before and after ATP (25 μmol/L) supplementation. Scale bar: 20 μm. BAPTA (green), Ca2+ probe. (D) Quantification of BAPTA fluorescence before ATP supplementation in (C) (mean ± SEM; n = 3 independent experiments; * P < 0.05, ** P < 0.01; one-way ANOVA with Tukey’s multiple comparisons test). (E) Quantification of changes in BAPTA fluorescence after ATP supplementation in (C) (mean ± SEM; n = 3 independent experiments; *** P < 0.001; two-way ANOVA with Tukey’s multiple comparisons test). (F) Representative bands of full-length PPP3 (FL PPP3) and proteolytic fragments (ΔPPP3) in HBMECs. (G and H) Quantification of FL PPP3 and ΔPPP3 in (F) (mean ± SEM; n = 5 independent experiments; * P < 0.05, ** P < 0.01; one-way ANOVA with Tukey’s multiple comparisons test).
To determine whether digoxin further influences TFEB nuclear translocation, we measured TFEB nuclear translocation with or without digoxin treatment during BTZ exposure. The immunostaining images and western blot data revealed that nuclear TFEB was decreased significantly after BTZ treatment, and this effect was reversed by digoxin in HBMECs (). Furthermore, the western blot data revealed that digoxin eliminated the accumulation of SQSTM1 protein aggregates in a concentration-dependent manner, and a lower concentration of digoxin (60 nmol/L) had a significant effect on clearing SQSTM1 accumulation, which did not impair the viability of HBMECs (Fig. S3B-S3D). Consistently, we observed that the sizes of SQSTM1 aggregates were obviously smaller following BTZ treatment plus digoxin than after BTZ treatment alone (). Taken together, these results suggested that digoxin could activate the phosphatase activity of PPP3 which increase TFEB nuclear translocation in endothelial cells and then decrease protein aggregates in the presence of BTZ.
Figure 5. Digoxin treatment restores TFEB nuclear translocation and contributes to clear of SQSTM1 aggregates. (A) Representative images of TFEB (green) and DAPI (blue, nuclei) with or without digoxin treatment in control or BTZ-exposed HBMECs. Scale bar: 50 μm. (B) Quantification of the nuclear fluorescence intensity of TFEB in (A) (mean ± SEM; n = 4 independent experiments; * P < 0.05; one-way ANOVA with Tukey’s multiple comparisons test). (C and D) Representative bands and quantification of nuclear TFEB protein with or without digoxin treatment in control or BTZ-exposed HBMECs (mean ± SEM; n = 6 independent experiments; * P < 0.05; one-way ANOVA with Tukey’s multiple comparisons test). (E) Representative images of SQSTM1 (green) and DAPI (blue, nuclei) with or without digoxin treatment in the presence of BTZ. Scale bar: 20 μm. (F) Quantification of SQSTM1 puncta size in (E) (mean ± SEM; n = 6 independent experiments; *** P < 0.001; one-way ANOVA with Tukey’s multiple comparisons test). (G and H) Representative bands and quantification of SQSTM1 protein (mean ± SEM; n = 6 independent experiments; ** P < 0.01, *** P < 0.001; two-way ANOVA with Tukey’s multiple comparisons test).
Digoxin attenuates bortezomib-induced microglial activation and cognitive dysfunction mediated by aberrant endothelial inflammatory signaling
To uncover the potential relationship between endothelial cells and microglia in our model, we focused on inflammatory signal pathway which was closely related with autophagy (). We examined the top upregulated genes in the inflammatory signaling pathway in HBMECs by RT-qPCR, we found the IL23A mRNA level was 4-fold higher in the BTZ-treated group than in the control group (). The levels of IL23A protein in HBMEC culture medium were determined by ELISA, and the results showed increased IL23A secretion following BTZ exposure (). Furthermore, we found that IL23A secretion was elevated in the serum of patients after BTZ administration (). Interestingly, the ELISA data indicated that digoxin reversed the BTZ-induced increase of IL23A in the culture medium of HBMECs (). Overall, these data showed the inflammatory pathway was activated and that the secretion of IL23A was markedly elevated in brain vascular endothelial cells after BTZ exposure, which could be restored following digoxin incubation in HBMECs.
Figure 6. Digoxin rescues bortezomib-induced microglial activation and cognitive dysfunction by inhibiting IL23A inflammatory signal in vascular endothelial cells. (A) Heatmap showing differentially expressed genes in the inflammatory signaling pathway. (B) TNF, IL18, IL6, IL1A and IL23A mRNA level in control or BTZ-exposed HBMECs. The data were normalized to mRNA expression compared to the control (mean ± SEM; n = 5 independent experiments; * P < 0.05, *** P < 0.001, ns, not significant; unpaired Student’s t-test). (C) ELISA assessment of IL23A in the culture medium of control or BTZ-treated HBMECs. The results are expressed as the absolute concentrations compared with the control group (mean ± SEM; n = 3 independent experiments; ** P < 0.01; unpaired Student’s t-test). (D) ELISA assessment of patient serum before and after BTZ administration. The results are expressed as the absolute concentrations compared with the same patient before BTZ treatment (mean ± SEM; n = 5 patients; ** P < 0.01; unpaired Student’s t-test). (E) ELISA assessment of the culture medium of HBMECs with or without digoxin treatment in the presence of BTZ (mean ± SEM; n = 3 independent experiments; *** P < 0.001; one-way ANOVA with Tukey’s multiple comparisons test). (F) Schematic illustration of BTZ and digoxin administration strategies in mice. (G) Quantification of spontaneous alternation behavior in the Y-maze with or without BTZ or digoxin treatment (mean ± SEM; n = 6–10 mice per group; * P < 0.05; one-way ANOVA with Tukey’s multiple comparisons test). (H) Quantification of the time spent exploring the familiar or novel object with or without BTZ or digoxin treatment during the NORT (mean ± SEM; n = 6–10 mice per group; ** P < 0.01, *** P < 0.001, ns, not significant; two-way ANOVA with Sidak’s multiple comparisons test). (I) Quantification of the time spent exploring the familiar or novel location with or without BTZ or digoxin treatment during the OLT (mean ± SEM; n = 6–10 mice per group; ** P < 0.01, *** P < 0.001, ns, not significant; two-way ANOVA with Sidak’s multiple comparisons test). (J) Representative images of Il23a mRNA (red) and Lectin-labeled (green) hippocampus vascular endothelial cells, as determined by RNAscope. Scale bar: 20 μm; magnified image: 10 μm. (K) Quantification of the Il23a mRNA level in Lectin+ ECs in (J) (mean ± SEM; n = 4 mice per group; ** P < 0.01, *** P < 0.001; one-way ANOVA with Tukey’s multiple comparisons test). (L and M) Quantification of AIF1-postive microglia in CA1 (L) and CA3 (M) of hippocampus (mean ± SEM; n = 5 mice per group; * P < 0.05; ** P < 0.01, *** P < 0.001 one-way ANOVA with Tukey’s multiple comparisons test). (N) Representative images showing dendritic segments by Golgi staining. Scale bar: 10 μm. (O-R) Quantification of the total spine density (O), mushroom (P), stubby (Q) and thin (R) spines in (N) (mean ± SEM; n = 25 dendritic segments from 3 mice per group; *** P < 0.001; one-way ANOVA with Tukey’s multiple comparisons test).
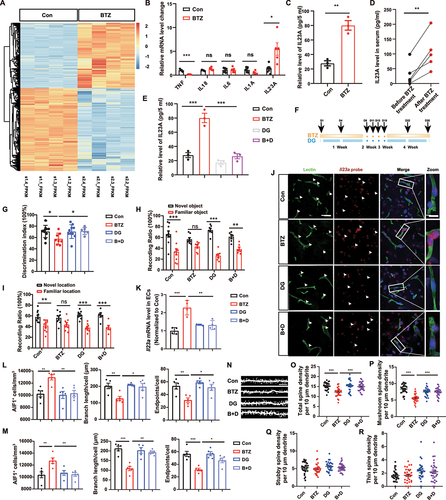
To further determine whether digoxin ameliorates cognitive impairment in mice exposed to BTZ, we intraperitoneally injected BTZ (1 mg/kg) twice per week for 4 consecutive weeks. Meanwhile, digoxin was administered intraperitoneally (0.25 mg/kg) every day (). The dose had no significant effect on the heart, including heart rate, coronary blood flow, fraction shortening (FS), ejection fraction (EF) or left ventricular volume, during the systolic and diastolic periods (LV VOL) in our study (Fig. S4A-S4G). After four weeks of administration, cognitive behaviors were assessed. In the Y-maze test, digoxin increased the discrimination index compared to treatment with BTZ alone (). Similarly, the results of the NORT and OLT revealed that mice treated with BTZ alone exhibited reduced abilities to discriminate old object/location from novel object/location, and this deficiency was improved in mice by treatment with digoxin ().
To verify the effect of digoxin on BTZ-mediated IL23A expression in vivo, we measured Il23a mRNA levels in brain vascular endothelial cells by RNAscope analysis. The data revealed that Lectin-labeled endothelial cells in HP of BTZ-exposed mice had high Il23a mRNA levels, and these levels were downregulated by digoxin (). Furthermore, immunostaining and microglial cytoskeletal analysis from CA1 and CA3 of HP revealed less microglial endpoints and shorter microglial branch lengths in BTZ group compared to control, which was reversed by digoxin in the presence of BTZ (). Consistently, we found that digoxin effectively inhibited microglial activation in mPFC (Fig. S4H and S4I). In addition, we found that digoxin effectively inhibited microglial activation and improved cognitive dysfunction during the first two weeks of digoxin treatment (Fig. S4J-S4M).
Moreover, we also performed Golgi staining to determine changes in spine number in the HP, as these structures are crucial for memory formation and construction. We found that BTZ treatment reduced total spine population and the number of mushroom spine, which was rescued by digoxin treatment ().
Endothelial Il23a is critical for inducing microglial activation and cognitive dysfunction
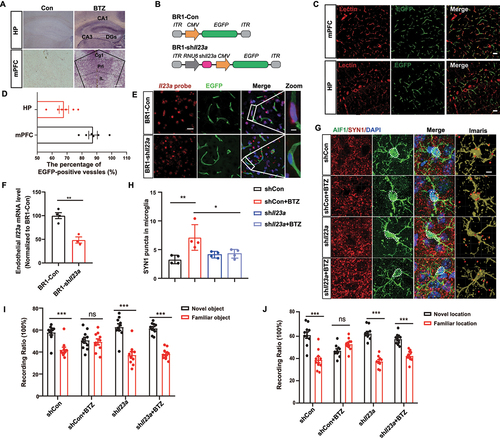
IL23A is a ligand that can interact with the receptor IL23R in microglia to trigger microglial activation and brain inflammation [Citation29]. Firstly, we performed ligand-binding experiments on HP and mPFC in control and BTZ treatment mice using biotinylated IL23A antibody and streptavidin-alkaline phosphatase (SA-AP). Endogenous IL23A binding sites were detected in the DGs, CA1 and CA3 regions of HP, and Cg1, Prl and Il of mPFC (). We hypothesize that IL23A plays a basic role in microglial activation and cognitive dysfunction. To test this hypothesis, we constructed the brain vascular endothelial conditional virus AAV-BR1 to deliver a short hairpin RNA (shRNA) to knock down ll23a (BR1-shIl23a) specifically in brain vascular endothelial cells (). EGFP fluorescence was specifically expressed in the brain endothelial cells of mice at 3 weeks after injection, as shown by coimmunostaining with Lectin (87.45%±7.08 in mPFC, 67.93%±7.67 in HP) (), and RNAscope data clearly showed the efficiency of viral-mediated Il23a knockdown (). We also measured the ability of microglia to engulf synapses by double labeling using antibodies against AIF1/Iba1 and SYN1 (synapsin I) (). A significant reduction of SYN1 spots was observed in AIF1-positive microglial soma in Il23a knockdown mice (). Importantly, abolishing Il23a in BTZ-treated mice reversed the observed deficits in novel object discrimination in NORT and OLT (). Based on these data, endothelial Il23a deficiency ameliorates microglial activation and cognitive impairment in BTZ-exposed mice, indicating that targeting upstream signaling may be a promising strategy to prevent cognitive dysfunction.
Figure 7. IL23A is essential for microglial synaptic engulfment. (A) AP staining images of IL23A binding region in HP and mPFC. Scale bar: 200 μm. CA, cornu ammonis; DGs, dentate gyrus; Cg1, Cingulate Cortex; Prl, prelimbic cortex; Il, infralimbic cortex. (B) Schematic illustration of AAV-BR1 construction with inverted terminal repeats (ITRs) at both ends and CMV promoter-driven EGFP or RNU6 promoter-driven shIl23a. (C and D) Representative images (C) and quantification (D) of EGFP-positive and Lectin-positive brain endothelial cells in mPFC and HP of mice after injection of the AAV-BR1-Con vector for three weeks (n = 6 mice per group). Lectin (red), brain endothelial cells (ECs) marker; Scale bar: 20 μm. (E and F) Representative images (E) and quantification (F) of Il23a mRNA levels in brain vascular endothelial cells by RNAscope. Il23a mRNA probes (red), EGFP (green) for ECs infected by AAV-BR1 and DAPI (blue) for nuclei (mean ± SEM; n = 3–4 mice per group; ** P < 0.01; unpaired Student’s t-test). Scale bar: 20 μm; magnified images: 5 μm. (G) Representative images of microglial synaptic engulfment following BTZ treatment. SYN1 (red), AIF1 (green), and DAPI (blue). Scale bar: 10 μm. (H) Quantification of the number of SYN1 spots localized in microglial soma in (E) (mean ± SEM; n = 4 mice per group; * P < 0.05, ** P < 0.01; one-way ANOVA with Tukey’s multiple comparisons test). (I and J) Quantification of the time to explore the familiar or novel object/location after BR1-shCon or BR1-shIl23a injection and BTZ treatment (mean ± SEM; n = 9–10 mice per group; *** P < 0.001, ns, not significant; two-way ANOVA with Sidak’s multiple comparisons test).
TFEB negatively regulates STAT3 nuclear translocation and IL23A transcription
Previous studies have shown that lysosome function abolishment increased IL23A expression [Citation30]; however, this mechanism remains unclear. To identify the transcription factor associated with IL23A, the JASPAR database screening was used, and we focused on STAT3, which as predicted to target the IL23A promoter region () and is involved in lysosome dysfunction [Citation31]. To determine the sequence characteristics of the IL23A promoter and identify 3 putative STAT3 binding elements (SBEs), we transfected wild-type (WT) and mutant SBEs (mSBEs) into HEK293 cells and performed a dual-luciferase reporter assay (). The results showed that wild-type SBEs significantly increased luciferase activity, and mutations within the STAT3 binding sites downregulated the expression of luciferase compared to wild-type SBEs ().
Figure 8. TFEB negatively regulates STAT3 nuclear translocation-mediated IL23A transcription. (A) Schematic diagram showing the human IL23A promoter and the presence of STAT3 binding element (SBE) sequences. SBE sequences from the JASPAR database. (B) Schematic diagram of the mutant SBE (mSBE) introduced into the human IL23A promoter to test regulation of IL23A transcription. (C) Dual-luciferase reporter assay of IL23A promoter transcription activity in HEK293 cells after the cells were transfected with different mSBE vectors (mean ± SEM; n = 4 independent experiments; * P < 0.05, ** P < 0.01; one-way ANOVA with Tukey’s multiple comparisons test). (D-F) Representative bands (D) and quantification of p-STAT3 (Y705) (E), p-STAT3 (S727) (F) and total STAT3 in HBMECs with or without digoxin treatment during control or BTZ exposure (mean ± SEM; n = 5 independent experiments; * P < 0.05, ** P < 0.01; one-way ANOVA with Tukey’s multiple comparisons test). (G-I) Representative bands (G) and quantification of p-STAT3 (Y705) (H), p-STAT3 (S727) (I) and total STAT3 in HEK293 cells with TFEB knockout (KO) or TFEB overexpression (mean ± SEM; n = 6 independent experiments; * P < 0.05, *** P < 0.001; one-way ANOVA with Tukey’s multiple comparisons test).
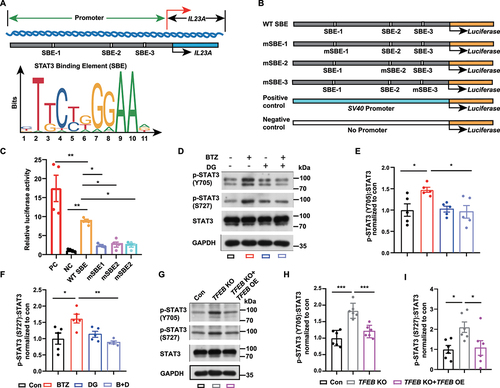
In addition, the phosphorylation of STAT3 at Y705 and S727 was shown to promote STAT3 dimerization and nuclear translocation [Citation32], which led us to examine the role of TFEB in STAT3 transcriptional activity. We found that BTZ increased STAT3 phosphorylation at Y705 and S727, and this effect was reversed by digoxin in HBMECs (). To provide further evidence for a functional role of TFEB, we knocked out TFEB in HEK293 cells by the CRISPR-Cas9 system (Fig. S5). We found that TFEB knockout increased the level of phosphorylated STAT3 (p-STAT3, Tyr705 and Ser727). Moreover, TFEB overexpression reversed the effects of TFEB depletion on phosphorylated STAT3 in HEK293 cells (). These results indicated that TFEB negatively regulates STAT3 phosphorylation. Taken together, these results verified the relationship between STAT3 and TFEB, supporting the hypothesis that TFEB downregulation enhances STAT3 transcriptional activity to promote IL23A transcription.
Discussion
Chemotherapy-induced “chemobrain” has received increasing attention [Citation3], which heightens the importance of understanding the underlying toxicity mechanisms of BTZ and designing a viable strategy to ameliorate the risk of cognitive dysfunction. Here, we provide evidence that BTZ exposure decreases TFEB nuclear translocation, subsequently dysregulating autophagy and impairing autophagic flux, which may induce the phosphorylation of STAT3 at Y705 and S727 in cerebral microvascular endothelial cells, resulting in the production and secretion of endothelium-derived IL23A and ultimately leading to aberrant microglial activation and cognitive dysfunction. Of particular note was that the pharmacological agent digoxin promoted the nuclear translocation of TFEB and ameliorated cognitive impairment by blocking TFEB-STAT3-IL23A pathway-mediated inflammatory events and cognitive dysfunction.
The present study indicates that brain vascular endothelial IL23A is an important sensor of cellular communication between neurovascular unit components during BTZ exposure. Neurovascular unit dysfunction has been reported to be involved in cognitive dysfunction [Citation33,Citation34]. Endothelial cells play a central role in maintaining BBB integrity and neurovascular unit cellular interactions [Citation23,Citation35]. BTZ was reported to increase ICAM1 expression and leukocyte adhesion in endothelial cells [Citation36], and BTZ probably induced a proinflammatory effect. In the present study, we found that BTZ exposure contributed to the expression and secretion of IL23A by brain vascular endothelial cells in mice and patient serum. More importantly, we found that endothelium-derived IL23A triggered microglial activation and accelerated microglial phagocytosis of synapses, resulting in cognitive impairment. The proinflammatory cytokine IL23 or IL23A-IL12B is mainly secreted by dendritic cells and activated macrophage [Citation29]. IL23A is upregulated in autoimmune encephalomyelitis, multiple sclerosis, psoriatic keratinocytes and psoriasis [Citation37–40]. Considering the heterogeneity of endothelial cells, we specifically knocked down Il23a in brain vascular endothelial cells with the AAV-BR1 virus [Citation41] and found that the loss of Il23a alleviated microglial activation and cognitive impairment.
We first showed that STAT3 targeted IL23A promoter regions to upregulate IL23A transcription in human brain vascular endothelial cells through BTZ-mediated STAT3 phosphorylation at Y705 and S727, which induced STAT3 dimerization and nuclear translocation. Muller et al. reported that lysosomotropic beta blockers contributed to IL23A transcription by RELB recruitment to IL23A promoter regions in Langerhans cells [Citation30]. Furthermore, we discovered that TFEB played an important role in BTZ-mediated STAT3 phosphorylation. The level of phosphorylated STAT3 at Y705 and S727 increased when TFEB was knocked out by the CRISPR-Cas9 system, and this effect was reversed by TFEB overexpression.
Consistent with a key role for TFEB in lysosome biogenesis and proteostasis, our pharmacological and genetic approaches established TFEB as a relevant player in the maintenance of autolysosome homeostasis via the TFEB-STAT3-IL23A pathway. TFEB is a potential drug target, which has potential pharmacological effects in alleviating toxic protein aggregation in neurodegenerative diseases [Citation42–44]. Here, our data revealed that BTZ exposure reduced the nuclear translocation of TFEB, accompanied by reductions in lysosome biogenesis (LAMP1 and LAMP2A) and autophagic substrate accumulation (LC3-II and SQSTM1) in brain vascular endothelial cells. The nuclear translocation of TFEB has been reported to depend on TFEB dephosphorylation mediated by PPP3 activity [Citation28]. Consistent with a previous report, we found that BTZ exposure decreased Ca2+ current and PPP3 activity, which inhibited TFEB dephosphorylation and nuclear translocation. Therefore, TFEB plays a decisive role in BTZ-mediated autophagic dysfunction and IL23A generation.
Of particular note in the present study was the ability of the pharmacological agent digoxin, which is a Na+/K+ ATPase activity inhibitor, to have positive inotropic effects on myocardial cells by increasing the exchange of intracellular sodium for extracellular calcium during heart failure [Citation45]. Recently, digoxin was reported to reduce atherosclerotic lesion formation by attenuating IL17A-related inflammatory responses [Citation46]. However, in addition to the positive inotropic effect, the other effects and mechanisms of digoxin remain unclear. Our data suggested that digoxin increased the Ca2+ current and reversed the BTZ-mediated decline in the Ca2+ current in HBMECs. The increased intracellular calcium activated PPP3, resulting in TFEB dephosphorylation and nuclear translocation. The digoxin-induced increase in TFEB nuclear translocation improved autophagy and autophagic substrate accumulation. Subsequently, digoxin inhibited microglial activation and ameliorated cognitive dysfunction in mice treated with BTZ. Overall, our findings demonstrated that digoxin may be a potential drug target of TFEB to protect the brain vasculature and rescue cognitive dysfunction induced by BTZ. However, to extend the validity of TFEB as a therapeutically relevant target for BTZ-induced cognitive dysfunction, future studies will need to examine its efficacy in alternative models of “chemobrain”, as well as in clinical trials.
Taken together, these findings suggest that enhancing TFEB functions through agents that increase the Ca2+ current and inhibit IL23A-induced inflammatory events is a promising therapeutic strategy to treat BTZ-induced cognitive dysfunction.
Materials and methods
Patient samples
Blood samples were obtained with informed consent from five patients before and after BTZ treatment. The project was approved by the Institutional Review Board and Ethics Committee of the Nanjing Medical University. The serum was obtained by placed blood at room temperature (RT) for 30 min and centrifuged at 600 g, 4°C for 20 min. For the IL23A assay, 1 mL serum was concentrated to 200 μl for ELISA determination of IL23A levels following the instructions.
Animal experiments
12-week-old C57BL/6 J female mice were purchased from SLA CCAL Lab Animal Ltd. (Shanghai, China). All mice were housed under a 12-h light/dark schedule and fed with food (Medicience, MD17121) and water ad libitum. All experiments and protocols were approved by the Nanjing Medical University Institutional Animal Care and Use Committee, and were in complete compliance with the National Institutes of Health Guide for the Care and Use of Laboratory Animals.
For BTZ administration experiment, mice were injected intraperitoneally (i.p.) with BTZ (1 mg/kg; Selleck, S1013) twice a week for consecutive four weeks. Digoxin (0.25 mg/kg/day, i.p; Selleck, S4290) were injected to mice during BTZ exposure. And control mice injected intraperitoneally (i.p.) with PBS (Invitrogen, 003002).
The ablation of brain microglia was performed as described previously [Citation21]. Mice were fed with normal AIN-76A diet (SYSE Bio, PD1001) or PLX5622-formulated AIN-76A diet (SYSE Bio, D20010801; gift from Prof. B Peng, Fudan University) for 14 days.
All mice of similar weight were grouped randomly into control and treated groups. To perform animal experiments in a blinded manner, we numbered all mice and the numbers corresponding to specific group categories in different analysis. Moreover, animal preparation, experiments and data analysis were performed by different investigators.
Behavior analysis
Object location test (OLT), novel object recognition test (NORT) and Y-maze are used to evaluate learning and memory of mice [Citation22,Citation23]. In the OLT and NORT training phase, two of the same objects were placed ¼ of the total distance away from each adjacent wall of a chamber (35 × 35 × 25 cm). Mice were placed in the center of chamber and explored freely for 5 min during training phase, then returned to their homecages for 2 h rest. In OLT testing phase, one object was transferred to diagonal location as a novel object location in chamber. In NORT testing phase, one object was replaced for a new different shape object as a novel object. The mice were placed in the center of chamber and recorded with a video camera for 5 min. The recognition ability of mice to novel object or location was calculated as (time to explore novel object or location/total time to explore novel object or location and old one) × 100%. We excluded mice which spent significantly unequal amounts of time exploring object 1 and object 2 during the training phase in NORT and OLT.
The Y-maze task was performed in Y-type labyrinth device (50 × 16 × 32 cm) as previous. Mice were placed at the end of one arm of the maze and allowed to explore the Y-maze and recorded with a video camera for 8 min. Three consecutive choices were defined as an alternation. We exclude mice the total alternation number were less than three. Discrimination index was calculated as (actual alternations/maximum alternations) × 100%.
Extract of mice brain microvascular endothelial cell
Mice brain microvascular endothelial cells were isolated from brain cortex [Citation23]. Briefly, brain cortex was dissected, sheered to pieces with a scalpel and digested at 37°C for 30 min with the Dulbecco’s modified Eagle’s medium (DMEM; Gibco, C11995500BT) containing 10 mmol/L HEPES, 5 mmol/L Ca2+, 400 U/mL collagenase (Sigma, C5138), and 10 mg/mL DNase I (Roche, 104,159), mixing upside and down every 10 min. After digestion, it was centrifuged at 1000 g at 4°C for 5 min to obtain a cell pellet. To further obtain abundant brain microvascular endothelial cells, 20% BSA (BioFroxx, 4240) in DMEM was added to cell pellet and resuspended, then performed gradient centrifugation at 1000 g at 4°C for 20 min. Finally, obtained brain microvascular endothelial cells at the bottom were homogenized to carry out the following western blot.
Western blot analysis
For total protein extraction, treated cells or animal tissue samples were homogenized in lysis buffer as described previously [Citation47]. For nuclear protein extraction, special lysis buffer and protocol was used as previous [Citation48]. Equivalent protein samples were loaded to the SDS-polyacrylamide gel electrophoresis (SDS-PAGE) for separating and transferred to PVDF membrane (Immobilon-P Membrane, 0.45 μm; Millipore, IPVH0010) for the subsequent western blot analysis. The following dilutions of antibody were used: anti-LC3 (1:10,000; Sigma Aldrich, L7543), anti-SQSTM1/p62 (1:5000; Cell Signaling Technology, 5114), anti-TFEB (1:1000; Abcam, ab2636), anti-LAMP1 (1:3000; Abcam, ab24170), anti-LAMP2A (1:3000; Abcam, ab18528), anti-PPP3/calcineurin was prepared as previously described and provided by Dr. Kohji Fukunaga (Tohoku University) [Citation49] (1:1000), anti-STAT3 (1:2000; Cell Signaling Technology, 12,640), anti-phospho-STAT3 (Y705, 1:1000; Cell Signaling Technology, 9145), anti-phospho-STAT3 (S727, 1:2000; Cell Signaling Technology, 9134), anti-GAPDH (1:5000; Cell Signaling Technology, 2118), anti-ACTB/β-actin (1:5000; Sigma Aldrich, A5441), anti-H3 (1:5000; Cell Signaling Technology, 4909). Corresponding secondary antibody with HRP (1:5000; Cell Signaling Technology,7074, 7076) were used and protein bands were visualized by ECL (Amersham Biosciences, GE Healthcare, RPN2236). The gray value of each protein band is analyzed with Fiji software (NIH), and the results were normalized with corresponding loading control.
Immunohistochemistry
Microglial morphology and BBB permeability were performed by immunohistochemistry as previous [Citation23,Citation50]. Briefly, the mice were anesthetized under pentobarbital sodium (60 mg/kg, i.p). The brain was dissected and immediately immersed into 4% paraformaldehyde (PFA) to fixation, and then cryoprotected in 30% sucrose (MCKLIN, S818046) and cut to 45-μm-thick section by a freezing microtome. The sections were incubated with primary antibody in 3% BSA for 48 h at 4°C and stained by using corresponding secondary antibodies conjugated to Alexa Fluor 488, 594 or 647 fluorescent dyes (1:300; Invitrogen, A21206, A21203, A21447; A21209; Abcam, ab150185). After incubating with 4′,6-diamidino-2-phenylindole (DAPI; Sigma, D8417), the sections were washed with PBS and mounted with Vectashield mounting medium (Vector Laboratories, H-1000). Fluorescence pictures were taken by using ZEISS LSM800 confocal microscope (Carl Zeiss, Germany). Microglial volume change was detected by assessing the average area of AIF1-positive microglia (total area/microglial number). For microglial endpoints and branch length change, the images were measured by obtaining microglial skeleton structure using the plugins of “Analysis Skeleton” in Fiji software (NIH) [Citation51]. All primary antibodies applied during immunostaining in brain slices were anti-AIF1/Iba1 (1:500; Abcam, ab5076), anti-CLDN5/claudin 5 (1:300; Invitrogen, 35–2500), GFAP (1:500; Millipore, MAB360), anti-S100B (1:500; Abcam, ab52642), ALB/albumin (1:100; Abcam, ab207327), anti-FG/fibrinogen (1:200, Abcam, ab34269), anti-SYN1/synapsin I (1:1000; Cell Signaling Technology, 5297) and anti-Lectin-594 (1:200; Vector Laboratories, DL-1177).
Immunohistochemistry for cells were carried out as previous [Citation52]. Briefly, the cells grown on glass coverslip were washes with PBS immediately and fixed with fresh 4% PFA at 4°C for 15 min. After permeabilization with 0.1% (v:v) Triton X-100 (Sigma, T9284) in PBS cells were next rinsed in PBS and blocked for 1 h in 5% (w:v) BSA solution in PBS. Next, cells were immunolabeled with primary antibody in 5% BSA solution at 4°C overnight. And following dilutions of primary antibody were used: anti-SQSTM1/p62 (1:500; Cell Signaling Technology, 5114), anti-ubiquitin (linkage-specific K63, 1:300; Abcam, ab179434), anti-LGALS3/GAL3 (1:200; Santa Cruz Biotechnology, sc-32,790), anti-LAMP1 (1:300; Abcam, ab24170), anti-TFEB (1:500; Abcam, ab2636). Subsequently, secondary antibodies conjugated to Alexa Fluor 488 or 594 fluorescent dyes were diluted in 5% BSA solution and added to cells at RT for 2 h. Finally, DAPI diluted in PBS was used to label cell nucleus at RT for 10 min and subsequently the cells were mounted for next imaging capture.
RNA sequencing and gene expression analysis
Total RNA from BTZ-exposed or control bEnd.3 cells were extracted using RNAiso Plus (TaKaRa, 9109), followed RNA quantity and quality was performed by Agilent 2100 Bioanalyzer (Agilent Technologies). Total RNA was transcribed into full-length cDNA and was processed with NEBNext Ultra RNA Library Prep Kit (NEB, E7770) for sequencing library preparation. DNA sequencing was carried out with an Illumina platform and data were processed by Genewiz (China). FastQC (v0.10.1) was used to provide quality-control checks on the raw RNA-seq data. To further clean the data, Cutadapt (version 1.9.1) was applied to remove low-quality read and data of fastq format. Next, we aligned the RNA-seq reads to the mouse reference genome (mm9) by Hisat2 (v2.0.1). Differentially expressed genes (DEGs) between control and BTZ-exposed group were characterized by q ≤ 0.05 and |log2 Foldchange| ≥ 1 and were processed by DESeq2 (V1.6.3). GOSeq (v1.34.1) was used for to determine whether Gene Ontology (GO) terms and pathway gene sets showed statistically significant.
Cell culture
Human brain microvascular endothelial cells (HBMECs) were purchased from ScienCell Research Laboratories (1000). HBMECs were cultured in Endothelial Cell Medium (ECM; Sciencell, 1001–500) with 1% Endothelial Cell Growth Supplement (ECGS; Sciencell, 1052) and 5% fetal bovine serum (FBS; Sciencell, 0025). HEK293 (CRL-1573) and mouse cerebral microvascular endothelial cells (bEnd.3; CRL-2299) were purchased from American Type Culture Collection (ATCC), and cultured in DMEM medium supplemented with 10% FBS (Gibco, 10,099–141). For plasmid transfection, 80% confluent HEK293 cells were transfected with associated plasmids using Lipofectamine 3000 (Invitrogen, L3000008) following the manufacturer’s instructions. For the toxicity and molecular mechanism studies, cells were treated with BTZ (20 nmol/L) or digoxin (50 nmol/L) for 24 h.
Elisa analysis
To detect IL23A in HBMECs culture medium, the supernatants were collected and concentrated using Amicon Ultra Filters (Millipore, UFC801008). Enzyme-linked immunosorbent assays (ELISAs) was performed following the instructions (BD, D2300B).
mRFP-GFP-LC3 puncta analysis
HBMECs was seeded in the glass coverslips placed in the 24-well plates. 50% confluent cell was transfected with mRFP-GFP-LC3 adenovirus (1x10⁹ PFU/well; HanBio Technology, HB-AP210) to trace autophagic flux. In the lysosomes, the acidic condition (pH<5) induces EGFP fluorescence quenching and mRFP no change, the yellow puncta in green and red-merged images are shown in autophagosomes, and the red puncta are shown in autolysosomes [Citation53]. After transfection overnight, HBMECs was treated with or without BTZ continuously for 24 h. At the last two hours, bafilomycin A1 (100 nmol/L; Selleck, S1413), a blocker of autophagy flux, was added to the culture medium of HBMECs. Then, the cells on the coverslips were fixed with 4% PFA and labeled nucleus with DAPI. Subsequently, the z-stack images were taken by using ZEISS LSM800 confocal microscope, yellow and red LC3 puncta number was calculated by “spots” module in Imaris software.
Whole-cell patch clamp recording
HBMECs were seeded on coverslips covered with 0.1 mg/mL poly-D-lysine (Sigma, P6407). After treatment with BTZ and/or digoxin, cells were placed on the recording chamber filled with external recording solution and visualized with a 40× water-immersion lens (Olympus). Ca2+ current was performed under whole-cell patch clamp recording with a MultiClamp 700B amplifier (Molecular Devices) at a holding potential from −40 mV to 60 mV. Calcium current recordings were performed in voltage-clamp mode with a modified aCSF containing: 120 mmol/L NaCl (MACKLIN, S805275), 3 mmol/L KCl (Sigma, P9541), 20 mmol/L TEA-Cl (Sigma, T2265), 5 mmol/L CsCl (Sigma, C3011), 10 mmol/L HEPES (Sigma, H3375), 1 mmol/L 4-AP (Sigma, 275,875), 1 µmol/L TTX (TOCRIS, 1078), 2 mmol/L MgCl2 (Honeywell, 63,020) and 1 mmol/L CaCl2 (Honeywell, 21,114). To ensure calcium current isolation, we used a CsMeSO4 based internal solution containing in mmol/L: 130 CsMeSO4 (Sigma, C1426), 10 EGTA (Sigma, E3889), 5 MgCl2, 10 TEA-Cl, 5 Na2+-ATP (Sigma, A2383) and 10 HEPES [Citation54]. Tight seals were established using glass micropipettes with 3–5 MΩ.
Calcium imaging in live cell
Calcium imaging in live cells was performed as previously described [Citation55]. HBMECs were grown in Nunc Glass Bottom Dish (Thermo Scientific, 150,682) coated with 0.1 mg/mL poly-D-lysine. After treated with BTZ (20 nmol/L) or/and digoxin (50 nmol/L) for 24 h, HBMECs were loaded with 2 μmol/L BAPTA (Invitrogen, O6807) for 30 min. Then, culture medium was replaced with imaging buffer (20 mmol/L HEPES, pH 7.4, 140 mmol/L NaCl, 2.5 mmol/L KCl, 1.8 mmol/L CaCl2, 1 mmol/L MgCl2, 10 mmol/L D-glucose and 5% FBS) and imaged with a ZEISS LSM800 confocal microscope. HBMECs were stimulated with 25 μmol/L ATP (TOCRIS, 987,655) at the time point of 10s and recorded continuously for next 20s at 1-s intervals.
Cell Counting Kit-8 assay
Cell viability was measured by Cell Counting Kit-8 (CCK-8; Dojindo, CK04) assay. In brief, the HBMECs were seeded into 96-well plates at a density of 5000 cells/well and cultured then treated with digoxin of different concentrations and DMSO for 24 h. Subsequently, 10 μl CCK-8 solution was added to each well and incubated at 37°C for 1–2 h. The optical detection wavelength at 450 nm, which is indicative of a positive correlation with cell viability, was measured using a microplate reader.
RNAscope in situ hybridization assay and protein co-staining
The Il23a mRNA and Lectin were co-staining by using mouse Il23a probe (ACD, 319,561) and Co-Detection of RNA and Protein kit (ACD, 323,180). Briefly, mice were perfused with fresh 4% PFA and brain was dissected and fixed at 4°C for 24 h in PFA. Subsequently, brain was immersed in 30% sucrose in PBS until 15-μm-thick frozen sections were performed. For RNA and protein co-staining, 15-μm brain slices was mounted on SuperFrost Plus glass slides (Erie, 71,869). After being treated with hydrogen peroxide for 10 min at RT, the sample was boiled in co-detection RNAscope Target Retrieval Solution for 15 min. Next, Lectin (1:300; Vector Laboratories, FL-1171) was incubated at 4°C until the second day. Then, samples were fixed again in fresh 10% neutral buffered formalin for 30 min at RT, and RNAscope Protease Plus was used to digest at 40°C for 30 min. RNA hybridization in situ was performed by incubating mouse Il23a probe at 40°C for 2 h. Standard signal amplification reagent and red signal detection reagent (ACD, 322,350) was used according to the instructions. Following RNA probe hybridization, corresponding secondary antibodies was incubated at RT for 2 h. Finally, the sample was stained with DAPI. Images were captured using ZEISS LSM800 confocal microscope.
Golgi-Cox staining
The mice were anesthetized and brain was collected for Golgi-Cox staining with FD Rapid GolgiStainTM Kit (FD NeuroTechnologies, PK401) according to the manufacturer. In brief, the whole brain was immersed into silver impregnation for 2 weeks, followed by 7 d for sucrose dehydration at room temperature in darkness. Finally, 150-μm-thick coronal sections were cut and covered in resinous medium, then images of dendrite of pyramidal neurons in CA1 and CA3 of hippocampus were captured under a 100× oil-immersion objective on Olympus BX53 fluorescence microscope (Olympus, Japan). Captured images was processed with the plugin “Skeleton” and “Analysis skeleton” in ImageJ (NIH). For the quantification of different types of spines, we used the plugin “Cell Counter” in ImageJ to manually distinguish and count the number of thin, stubby and mushroom spine along the second order branches of apical dendrites. The spine density was calculated by dividing the length of the dendrite.
Plasmid and virus construction
To knockout TFEB by CRISPR-Cas9 system in vitro, a 21-bp DNA sequence (5’-GTGAAATGCAGATGCCCAACA-3’) and gRNA scaffold with PolyT sequence (TTTTTT) were cloned into the vector of PLKO.1-puro plasmid (Addgene, 8453; deposited by Dr. Bob Weinberg) between AgeI and EcoRI sites. The sgRNA was driven by the RNU6 promoter, then targeted DNA sequence containing protospacer adjacent motif in the human TFEB genomic locus. Finally, the insertion was verified by DNA sequencing (Genewiz, China).
Human TFEB coding sequence was amplified and inserted in the sites of BamH I and Hind III of overexpressing vector pCMV-N-EGFP (Beyotime, D2707). Then, TFEB-overexpressing plasmids were transfected in TFEB-KO HEK293 for next immunoblotting assay.
For luciferase reporter assays, PGL3-basic and pGL3-SV40-luciferase vector were formed as previously descripted [Citation56]. The promoter region, a 2000-bp sequence before the transcription start site, of human IL23A was synthesized and subcloned into the multiple cloning sites of pGL3-Basic vectors (Promega, E1751). Mutant STAT3 binding elements were introduced by separately deleting three predicted binding sites (SBE1, TTTCCTAGAAT; SBE2, CTTCCAATCAA; SBE3, CTCCTGAGAAA) via JASPAR database. Primer sets for SBEs site mutagenesis were shown in Table S2. Above all sequences were confirmed by DNA sequencing in Genewiz.
Viral vectors and virus injection
For specifically knockdown Il23a in mouse brain vascular endothelial cells (MBVECs) in vivo, AAV-BR1-shIl23a and AAV-BR1-Con was constructed in OBIO (China). Briefly, the effective targeting oligonucleotide was inserted into pAAV-U6-shRNA-CMV-EGFP, which drives shRNA by the RNU6 promoter and drives EGFP by the CMV promoter. The sequence of shRNA in AAV vector was as follows: shIl23a: 5’-GAGCAACTTCACACCTCCCTA-3’. AAV-BR1-associated plasmids containing helper plasmid and replication-capsid packaging plasmid were kindly provided by Dr. Jakob Körbelin (University Medical Center Hamburg-Eppendorf) [Citation41]. For delivery AAV-BR1 in vivo, 9-week-old mice were anaesthetized and intravenously injected with BR1-shIl23a and BR1-Con at a dose of 3 × 10¹¹ genomic particles/mouse. After 3-week expression, Il23a knockdown efficiency was verified by detecting Il23a mRNA levels in MBVECs and following administration in mice were performed.
Luciferase reporter assays
To confirm STAT3 as transcription factor participated in IL23A transcription processing, dual-luciferase reporter assay was performed. In brief, HEK293 cells was seeded in 24-well plates until growth to 80% confluence. Then, 500 ng Firefly luciferase reporter vectors driven by normal or mutant IL23A promoter region and 100 ng Renilla luciferase reporter vector pRL-TK (Beyotime, D2760) were transfected into HEK293 cells using Lipofectamine 3000 (Invitrogen, L3000008) according to the manufacturer. In addition, pGL3-SV40-luciferase vector driven by the SV40 promoter as a positive control and pGL3-basic vector as a negative control were transfected with pRL-TK. Then, 48 h after transfection, cultured cells were lysed in reporter lysis buffer at RT for 20 min, and Firefly luciferase and Renilla luciferase activity was analyzed by Dual-Luciferase Reporter Assay System (Promega, E1910) and detected by SpectraMax M2 Multi-detection Readers (Molecular Devices) individually at the wavelength of 560 nm and 465 nm. Finally, the data was calculated by normalizing Firefly/Renilla relative light unit values.
Real-time quantitative PCR (RT-qPCR)
We extracted total RNA by using RNAiso Plus (Takara, 9109) and then reverse transcribed the RNA to cDNA by a HiScript II Q RT SuperMix for qPCR kit (Vazyme, R223-01) according to the manufacturer’s protocols. RT-qPCR was performed in Hard-Shell PCR 384-well plate (Bio-Rad, HSP3801) with Real-Time PCR instrument (Applied Biosystems) using AceQ qPCR SYBR Green Master Mix (Vazyme, Q131-02). All primers were used as listed in Table S1. Finally, the mRNA expression level was normalized to GAPDH and analyzed by the method of 2−ΔΔCt.
Alkaline phosphatase (AP) binding assays
To detect endogenous IL23A secretion and binding region in brain, we performed AP-binding analysis. Briefly, we obtained 10-μm fresh frozen coronal sections and postfixed with precooled methanol at −20°C for 8 min. The sections were incubated with biotinylated IL23A antibody (Abcam, ab119545) overnight at 4°C and then washed with HBAH buffer (0.5 mg/mL BSA, 0.1% [w:v] NaN3, 20 mmol/L HEPES in Hanks’ balanced salt solution, pH 7.0). After incubating with streptavidin (SA)-AP (Invitrogen, 434,322) for 1.5 h at room temperature, the sections were fixed with 4% PFA for 5 min and washed with HBS buffer (150 mmol/L NaCl, 20 mmol/L HEPES, pH 7.0). Finally, inactivating endogenous AP activity at 65°C for 1 h and AP binding was detected by BCIP/NBT substrate solution (Sangon Biotech, E670032) according to the manufacturer.
Statistical analysis
All experiments were performed independently at least three times. All data collection and analysis were performed blind. The data were presented as mean ± SEM. Two-tailed unpaired Student’s t-test was used to compare between two experimental groups, except for the data analysis from , A paired two-tailed Student’s t-test. For compare more than two groups as referred in the figure legends, one-way ANOVA with Tukey’s multiple comparisons test and two-way ANOVA with Tukey’s multiple comparisons test were used. Two-way ANOVA with Sidak’s multiple comparisons test were used in NORT/OLT experiments. P < 0.05 was considered significant. All statistical analyses were performed using Prism v.8.0.1 (GraphPad Software). No statistical methods were used to predetermine sample sizes but we followed the standard sample sizes those reported in previous publication.
Data availability
The data that support the findings of this study including all Supplementary materials and RNA-seq data are available from the corresponding author upon reasonable request.
Supplemental Material
Download MS Word (8.4 MB)Acknowledgments
The authors thank Dr. B Peng (Fudan University) for the friendly gift of AIN-76A diet and PLX5622-formulated AIN-76A diet.
Disclosure statement
No potential conflict of interest was reported by the authors.
Supplementary material
Supplemental data for this article can be accessed online at https://doi.org/10.1080/15548627.2022.2162244
Additional information
Funding
References
- Nguyen LD, Ehrlich BE. Cellular mechanisms and treatments for chemobrain: insight from aging and neurodegenerative diseases. EMBO Mol Med. 2020;12(6):e12075.
- Vitali M, Ripamonti CI, Roila F, et al. Cognitive impairment and chemotherapy: a brief overview. Crit Rev Oncol Hematol. 2017;118:7–14.
- Gutmann DH. Clearing the Fog surrounding Chemobrain. Cell. 2019;176(1–2):2–4.
- Mounier NM, Abdel-Maged AE, Wahdan SA, et al. Chemotherapy-induced cognitive impairment (CICI): an overview of etiology and pathogenesis. Life Sci. 2020;258:118071.
- Zlokovic BV. Neurovascular pathways to neurodegeneration in Alzheimer’s disease and other disorders. Nat Rev Neurosci. 2011;12(12):723–738.
- Wang W, Swenson S, Cho HY, et al. Efficient brain targeting and therapeutic intracranial activity of bortezomib through intranasal co-delivery with NEO100 in rodent glioblastoma models. J Neurosurg. 2019;132(3):959–967.
- Fischer M, Schmutzhard E. Posterior reversible encephalopathy syndrome. J Neurol. 2017;264(8):1608–1616.
- Ho CH, Lo CP, Tu MC. Bortezomib-induced posterior reversible encephalopathy syndrome: clinical and imaging features. Intern Med. 2014;53(16):1853–1857.
- Terwiel E, Hanrahan R, Lueck C, et al. Reversible posterior encephalopathy syndrome associated with bortezomib. Intern Med J. 2010 Jan;40(1):69–71.
- Leeman DS, Hebestreit K, Ruetz T, et al. Lysosome activation clears aggregates and enhances quiescent neural stem cell activation during aging. Science. 2018;359(6381):1277–1283.
- Nixon RA. The role of autophagy in neurodegenerative disease. Nat Med. 2013;19(8):983–997.
- Kim HJ, Cho MH, Shim WH, et al. Deficient autophagy in microglia impairs synaptic pruning and causes social behavioral defects. Mol Psychiatry. 2017;22(11):1576–1584.
- Luo J. Autophagy and ethanol neurotoxicity. Autophagy. 2014;10(12):2099–2108.
- Nawrocki ST, Carew JS, Pino MS, et al. Aggresome disruption: a novel strategy to enhance bortezomib-induced apoptosis in pancreatic cancer cells. Cancer Res. 2006;66(7):3773–3781.
- Bosch M, Castro J, Saneyoshi T, et al. Structural and molecular remodeling of dendritic spine substructures during long-term potentiation. Neuron. 2014;82(2):444–459.
- Bohlen CJ, Friedman BA, Dejanovic B, et al. Microglia in brain development, homeostasis, and neurodegeneration. Annu Rev Genet. 2019;53(1):263–288.
- Nguyen PT, Dorman LC, Pan S, et al. Microglial Remodeling of the Extracellular Matrix Promotes Synapse Plasticity. Cell. 2020;182(2):388–403.
- Lui H, Zhang J, Makinson SR, et al. Progranulin deficiency promotes circuit-specific synaptic pruning by microglia via complement activation. Cell. 2016;165(4):921–935.
- Vasek MJ, Garber C, Dorsey D, et al. A complement-microglial axis drives synapse loss during virus-induced memory impairment. Nature. 2016;534(7608):538–543.
- Spangenberg E, Severson PL, Hohsfield LA, et al. Sustained microglial depletion with CSF1R inhibitor impairs parenchymal plaque development in an Alzheimer’s disease model. Nat Commun. 2019;10(1):3758.
- Huang Y, Xu Z, Xiong S, et al. Repopulated microglia are solely derived from the proliferation of residual microglia after acute depletion. Nat Neurosci. 2018;21(4):530–540.
- Wang H, Hong LJ, Huang JY, et al. P2RX7 sensitizes Mac-1/ICAM-1-dependent leukocyte-endothelial adhesion and promotes neurovascular injury during septic encephalopathy. Cell Res. 2015;25(6):674–690.
- Tan C, Lu NN, Wang CK, et al. Endothelium-derived semaphorin 3G regulates hippocampal synaptic structure and plasticity via Neuropilin-2/PlexinA4. Neuron. 2019;101(5):920–937.
- Wu H, Liu C, Yang Q, et al. MIR145-3p promotes autophagy and enhances bortezomib sensitivity in multiple myeloma by targeting HDAC4. Autophagy. 2020;16(4):683–697.
- Lee H, Kim MN, Ryu KY. Effect of p62/SQSTM1 polyubiquitination on its autophagic adaptor function and cellular survival under oxidative stress induced by arsenite. Biochem Biophys Res Commun. 2017;486(3):839–844.
- Wang S, Ni HM, Chao X, et al. Impaired TFEB-mediated lysosomal biogenesis promotes the development of pancreatitis in mice and is associated with human pancreatitis. Autophagy. 2019;15(11):1954–1969.
- Yamamoto F, Taniguchi K, Mamada N, et al. TFEB-mediated enhancement of the autophagy-lysosomal pathway dually modulates the process of amyloid beta-protein generation in neurons. Neuroscience. 2019;402:11–22.
- Medina DL, Ballabio A. Lysosomal calcium regulates autophagy. Autophagy. 2015;11(6):970–971.
- Nitsch L, Schneider L, Zimmermann J, et al. Microglia-derived interleukin 23: a crucial cytokine in Alzheimer’s disease? Front Neurol. 2021;12:639353.
- Muller G, Lubow C, Weindl G. Lysosomotropic beta blockers induce oxidative stress and IL23A production in Langerhans cells. Autophagy. 2020;16(8):1380–1395.
- Liu B, Palmfeldt J, Lin L, et al. STAT3 associates with vacuolar H(+)-ATPase and regulates cytosolic and lysosomal pH. Cell Res. 2018;28(10):996–1012.
- Dubovy P, Hradilova-Svizenska I, Klusakova I, et al. Bilateral activation of STAT3 by phosphorylation at the tyrosine-705 (Y705) and serine-727 (S727) positions and its nuclear translocation in primary sensory neurons following unilateral sciatic nerve injury. Histochem Cell Biol. 2018;150(1):37–47.
- Montagne A, Nation DA, Sagare AP, et al. APOE4 leads to blood-brain barrier dysfunction predicting cognitive decline. Nature. 2020;581(7806):71–76.
- Nation DA, Sweeney MD, Montagne A, et al. Blood-brain barrier breakdown is an early biomarker of human cognitive dysfunction. Nat Med. 2019;25(2):270–276.
- Chang J, Mancuso MR, Maier C, et al. Gpr124 is essential for blood-brain barrier integrity in central nervous system disease. Nat Med. 2017;23(4):450–460.
- Martinez-Sanchez J, Palomo M, Torramade-Moix S, et al. The induction strategies administered in the treatment of multiple myeloma exhibit a deleterious effect on the endothelium. Bone Marrow Transplant. 2020;55(12):2270–2278.
- Chen Y, Langsish CL, McKenzie B, et al. Anti-IL-23 therapy inhibits multiple inflammatory pathways and ameliorates autoimmune encephalomyelitis. J Clin Invest. 2006;116(5):1317–1326.
- Komuczki J, Tuzlak S, Friebel E, et al. Fate-mapping of GM-CSF expression identifies a discrete subset of inflammation-driving t helper cells regulated by Cytokines IL-23 and IL-1beta. Immunity. 2019;50(5):1289–1304.
- Langowski JL, Zhang X, Wu L, et al. IL-23 promotes tumour incidence and growth. Nature. 2006;442(7101):461–465.
- Li H, Yao Q, Mariscal AG, et al. Epigenetic control of IL-23 expression in keratinocytes is important for chronic skin inflammation. Nat Commun. 2018;9(1):1420.
- Korbelin J, Dogbevia G, Michelfelder S, et al. A brain microvasculature endothelial cell-specific viral vector with the potential to treat neurovascular and neurological diseases. EMBO Mol Med. 2016;8(6):609–625.
- Vaquer-Alicea J, Diamond MI. Propagation of protein aggregation in neurodegenerative diseases. Annu Rev Biochem. 2019;88(1):785–810.
- La Spada AR. PPARGC1A/PGC-1alpha, TFEB and enhanced proteostasis in Huntington disease: defining regulatory linkages between energy production and protein-organelle quality control. Autophagy. 2012;8(12):1845–1847.
- Zhang YD, Zhao JJ. TFEB participates in the abeta-ind uced pathogenesis of Alzheimer’s Disease by regulating the autophagy-lysosome pathway. DNA Cell Biol. 2015;34(11):661–668.
- Konstantinou DM, Karvounis H, Giannakoulas G. Digoxin in heart failure with a reduced ejection fraction: a risk factor or a risk marker. Cardiology. 2016;134(3):311–319.
- Shi H, Mao X, Zhong Y, et al. Digoxin reduces atherosclerosis in apolipoprotein E-deficient mice. Br J Pharmacol. 2016;173(9):1517–1528.
- Jiang Q, Gao Y, Wang C, et al. Nitration of TRPM2 as a molecular switch induces autophagy during brain pericyte injury. Antioxid Redox Signal. 2017;27(16):1297–1316.
- Liu Y, Xue X, Zhang H, et al. Neuronal-targeted TFEB rescues dysfunction of the autophagy-lysosomal pathway and alleviates ischemic injury in permanent cerebral ischemia. Autophagy. 2019;15(3):493–509.
- Morioka M, Fukunaga K, Yasugawa S, et al. Regional and temporal alterations in Ca2+/calmodulin-dependent protein kinase II and calcineurin in the hippocampus of rat brain after transient forebrain ischemia. J Neurochem. 1992;58(5):1798–1809.
- Young K, Morrison H. Quantifying microglia morphology from photomicrographs of immunohistochemistry prepared tissue using ImageJ. J Vis Exp. 2018;136:e57648.
- Erny D, Hrabe de Angelis AL, Jaitin D, et al. Host microbiota constantly control maturation and function of microglia in the CNS. Nat Neurosci. 2015;18(7):965–977.
- Wang CK, Ahmed MM, Jiang Q, et al. Melatonin ameliorates hypoglycemic stress-induced brain endothelial tight junction injury by inhibiting protein nitration of TP53-induced glycolysis and apoptosis regulator. J Pineal Res. 2017;63(4):e12440.
- Yu T, Guo F, Yu Y, et al. Fusobacterium nucleatum promotes chemoresistance to colorectal cancer by modulating autophagy. Cell. 2017;170(3):548–563.e16.
- Li Y, Lopez-Huerta VG, Adiconis X, et al. Distinct subnetworks of the thalamic reticular nucleus. Nature. 2020;583(7818):819–824.
- Isakson BE, Ramos SI, Duling BR. Ca2+ and inositol 1,4,5-trisphosphate-mediated signaling across the myoendothelial junction. Circ Res. 2007;100(2):246–254.
- Chen DY, Sun NH, Chen X, et al. Endothelium-derived semaphorin 3G attenuates ischemic retinopathy by coordinating beta-catenin-dependent vascular remodeling. J Clin Invest. 2021;131(4):4.