
ABSTRACT
The selective autophagic degradation of mitochondria via mitophagy is essential for preserving mitochondrial homeostasis and, thereby, disease maintenance and progression in acute myeloid leukemia (AML). Mitophagy is orchestrated by a variety of mitophagy receptors whose interplay is not well understood. Here, we established a pairwise multiplexed CRISPR screen targeting mitophagy receptors to elucidate redundancies and gain a deeper understanding of the functional interactome governing mitophagy in AML. We identified OPTN (optineurin) as sole non-redundant mitophagy receptor and characterized its unique role in AML. Knockdown and overexpression experiments demonstrated that OPTN expression is rate-limiting for AML cell proliferation. In a MN1-driven murine transplantation model, loss of OPTN prolonged overall median survival by 7 days (+21%). Mechanistically, we found broadly impaired mitochondrial respiration and function with increased mitochondrial ROS, that most likely caused the proliferation defect. Our results decipher the intertwined network of mitophagy receptors in AML for both ubiquitin-dependent and receptor-mediated mitophagy, identify OPTN as a non-redundant tool to study mitophagy in the context of leukemia and suggest OPTN inhibition as an attractive therapeutic strategy.
Abbreviations: AML: acute myeloid leukemia; CRISPR: Clustered Regularly Interspaced Short Palindromic Repeats; CTRL: control; DFP: deferiprone; GI: genetic interaction; KD: knockdown; KO: knockout; ldMBM, lineage-depleted murine bone marrow; LFC: log2 fold change; LIR: LC3-interacting region; LSC: leukemic stem cell; MAGeCK: Model-based Analysis of Genome-wide CRISPR-Cas9 Knockout; MDIVI-1: mitochondrial division inhibitor 1; MOI: multiplicity of infection; MOM: mitochondrial outer membrane; NAC: N-acetyl-L-cysteine; OA: oligomycin-antimycin A; OCR: oxygen consumption rate; OE: overexpression; OPTN: optineurin; PINK1: PTEN induced putative kinase 1; ROS: reactive oxygen species; SEM: standard error of the mean; TCGA: The Cancer Genome Atlas; TEM: transmission electron microscopy; UBD: ubiquitin-binding domain; WT: wild type
Introduction
Acute myeloid leukemia (AML) is among the most aggressive malignancies of the hematopoietic system and is the most frequent acute leukemia in adults [Citation1]. Standard curative therapy consists of an intensive induction chemotherapy, followed by consolidation or allogeneic stem cell transplantation. Despite high response rates to initial chemotherapy, many patients eventually relapse [Citation2]. Hence, there is a medical need for additional strategies to expand the treatment options for AML patients.
Recently, we and others investigated several approaches targeting macroautophagy/autophagy in combination with antileukemic therapy [Citation3–6]. Many of these combinations induced an initial response in clinical trials but resulted in tumor progression due to emerging resistance [Citation7]. Leukemic stem cells (LSCs) require mitophagy, the selective autophagosomal degradation of mitochondria, to maintain self-renewal and survival capabilities [Citation8,Citation9]. The most studied mitophagy pathway is ubiquitin-dependent and requires PINK1 (PTEN induced kinase 1) and the E3 ubiquitin ligase PRKN (parkin RBR E3 ubiquitin protein ligase). Upon mitochondrial damage, PINK1 is stabilized on the mitochondrial outer membrane (MOM), where it recruits PRKN which ubiquitinates MOM proteins. Classical mitophagy receptors like SQSTM1/p62 (sequestosome 1) or OPTN (optineurin) can recognize these ubiquitinated mitochondria and recruit the forming autophagosomes via their LC3-interacting region (LIR) domains [Citation10]. Ubiquitin-independent mitophagy is mediated by mitophagy receptors that are directly located at the mitochondria [Citation11]. Previously, we demonstrated that the mitophagy receptor SQSTM1 is required for leukemia progression [Citation12]. Importantly, several studies [Citation13–15] have indicated redundancies between different mitophagy receptors, yet the majority of the network remains unexplored.
Here, we investigated the functional redundancies and unique roles of mitophagy receptors in a systematic approach using a multiplexed clustered regularly interspaced short palindromic repeats (CRISPR)-Cas9 (CRISPR-associated protein 9) screen. We propose a functional mitophagy receptor network and provide a detailed map of interdependencies in AML. Moreover, we identified OPTN as the most independent mitophagy receptor exhibiting the fewest number of genetic interactions (GIs). Therefore, we characterized the role of OPTN in both murine and human AML cells and showed that the proliferation of AML cells depends on OPTN abundance. Furthermore, we provide evidence that the selective autophagy function of OPTN is essential for OPTN-dependent mitophagy and its effect on proliferation. Importantly, we found delayed leukemia progression in an OPTN-deficient syngeneic leukemia model, which might be caused by impaired mitochondrial function. Our results suggest that targeting mitophagy might be a promising therapeutic approach for AML.
Results
Mapping the mitophagy receptor network for mitophagy in AML
To systematically investigate mitophagy receptors for ubiquitin-dependent and -independent mitophagy, we performed a multiplexed CRISPR screen with a library containing pairwise combinations of all hitherto known mitophagy receptors ( and Table S1). Additionally, we included PINK1 as positive control [Citation14] and NCOA4 (nuclear receptor coactivator 4) [Citation16], a ferritinophagy receptor. We transduced MV4–11 cells expressing Cas9 and the mitophagy reporter mt-mKEIMA [Citation17] () with lentivirus containing the multiplex library and selected them for 14 days. Mitophagy was induced by either oligomycin and antimycin A (OA) or deferiprone (DFP) treatment. OA inhibits the respiratory chain complexes III and V, and was shown to induce ubiquitin-dependent mitophagy [Citation18]. The iron chelator DFP induces iron loss triggering mitophagy independently of PINK1 [Citation19]. After mitophagy induction, cells with the 5% highest and lowest pH 4:pH 7 mt-mKEIMA ratio were sorted and subsequently underwent next-generation sequencing ( and Table S2).
Figure 1. Determining redundancies of canonical mitophagy receptors for mitophagy in AML. (A) Schematic illustration of multiplex mitophagy receptor CRISPR/Cas9 Screen in MV4–11 cells. (B) Schematic illustration of the mitophagy reporter mt-mKEIMA. (C) MAGeCK-derived log2-fold changes (LFCs) for inherent single screens of OA- and DFP-induced mitophagy. Significantly changed genes (p < 0.05) are marked with dark-filled circles. (D) Quantification of mitophagy induction shown in Figure S1D in MV4–11 cells upon shRNA-mediated knockdown of BNIP3 or FKBP8. Mitophagy was induced by treatment with 0.5 mM DFP for 16 h and quantified by mt-mKEIMA pH 4:pH 7 ratio. Data are normalized to DFP-treated CTRL cells (n = 3). (E) Proliferation analysis of expansion curves of MV4–11 cells upon shRNA-mediated knockdown of BNIP3 or FKBP8. Proliferation was determined by cell numbers after seven days of proliferation and normalized to control (CTRL) cells. (F) Heatmap of top 20 depleted combinations for multiplex screens of OA- and DFP-induced mitophagy. Significantly depleted combinations (p < 0.05) are marked in bold. (G) Schematic illustration of genetic interaction (GI) analysis for mitophagy using the additive model. (H) Number of GIs for DFP- or OA-induced mitophagy. (I) Heatmap of additive model-derived Delta log2-fold-change (ΔLFC) for all gene pairs from the multiplex mitophagy receptor screen. ΔLFC is calculated from the observed and expected LFC for each gene pair and plotted for OA treatment vs DFP treatment. (J) Functional interactome of synergistic mitophagy GIs calculated in (I). Node color describes receptor type (classic, mitochondrial membrane (MM) receptor or other). Edges describe the type of interaction (DFP only, OA only or common).
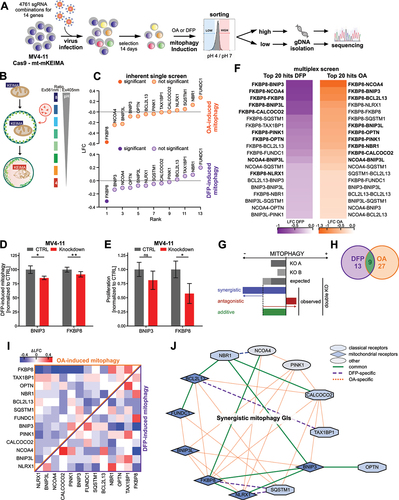
Since the library also included gRNAs for all genes paired with non-targeting controls, we determined dropouts for proliferation in the inherent single screen. As expected, gRNAs targeting the mitophagy receptor PHB2 (prohibitin 2), which is also an essential gene for proliferation [Citation20], were significantly depleted during proliferation (Fig. S1A and Table S3). We then analyzed high and low mitophagy populations for both treatments to identify receptors whose knockout impaired mitophagy (Table S4, S5). Single knockout of FKBP8 (FKBP prolyl isomerase 8) followed by NCOA4, BNIP3 (BCL2 interacting protein 3), BNIP3L (BCL2 interacting protein 3 like), and OPTN most severely affected mitophagy induction upon OA or DFP treatment, while FUNDC1 (FUN14 domain containing 1) and NBR1 (NBR1 autophagy cargo receptor) ranked last (). Validation experiments with shRNA-mediated knockdown of FKBP8 (Fig. S1C) confirmed both impaired mitophagy and proliferation upon depletion (, Fig. S1D).
Next, we analyzed the relative abundance of multiplexed gRNAs targeting mitophagy receptor combinations for both proliferation and mitophagy (Fig. S1B). Consistent with the single screen data, gRNA combinations targeting FKBP8 impaired both proliferation and mitophagy most significantly (). Correlating the log2 fold changes (LFCs) of single genes (Fig. S1E) and their combinations (Fig. S1F) of OA-induced mitophagy with DFP-induction, we found a high degree of correlation, especially for their combinations (r = 0.86). Interestingly, both mitophagy inductions also correlated highly with proliferation, although the correlation was distinctively higher for OA-induced mitophagy (r = 0.84) than DFP-induction (r = 0.76). This suggests that especially ubiquitin-dependent mitophagy might be linked to the proliferation of AML cells. Interestingly, BNIP3 was the only single gene whose knockout impaired mitophagy while not impacting proliferation, which also was confirmed by shRNA-mediated knockdown of BNIP3 (, Fig. S1C-D).
We investigated genetic interactions (GIs) between individual genes to find functional redundancies between mitophagy receptors. We determined the ΔLFC as the difference between the observed LFC and the expected LFC calculated using an additive model [Citation21,Citation22] ( and Table S6, S7). Gene pairs were considered synergistic or antagonistic GIs, if their absolute ΔLFC was greater than one standard deviation. We observed synergistic GIs for 17% and 35% of all gene combinations in DFP- or OA-induced mitophagy, respectively. Nine combinations were common for both treatments (). Especially in OA-induced mitophagy, most non-additive combinations interact synergistically (). We integrated the synergistic GIs into a functional interactome and identified FKBP8, CALCOCO2 (calcium binding and coiled-coil domain 2), BCL2L13 (BCL2 like 13), BNIP3, and NLRX1 (NLR family member X1) to have the most unique partners (). The function of these receptors seems to be highly intertwined and they can be considered hubs for mitophagy induction. As expected, PINK1 interacted with other receptors exclusively upon OA treatment, validating the integrity of our analysis [Citation18,Citation19] (). Notably, some of the mitophagy-enhancing interactions like the paralogs BNIP3-BNIP3L or CALCOCO2-TAX1BP1 (Tax1 binding protein 1) are known to interact physically (Fig. S1G). Most of the observed functional interactions have not yet been described as physical interactions. Interestingly, OPTN is a clear outlier in the mitophagy-enhancing interaction network, interacting exclusively with BNIP3 (). Of note, OPTN antagonistically interacted only with TAX1BP1 upon DFP-induced mitophagy (Fig. S1H). Therefore, the vast majority of interactions of OPTN with other genes were purely additive suggesting a mostly independent role for OPTN.
Given the postulated redundancy of the mitophagy receptor network, the aim of this experiment was to identify essential nodal points that lack redundancy. This identified a single candidate: OPTN. Taken together, our findings suggest that OPTN functions mostly independent of other mitophagy receptors. The impaired mitophagy flux due to loss of OPTN cannot be rerouted through other receptors in the network. The combinatorial screen revealed that the majority of mitophagy receptors are highly interconnected and many of them function as hubs. Therefore, these genes cooperate in inducing mitophagy in AML. In our screen, OPTN was the only mitophagy receptor whose knockout impaired both mitophagy induction and proliferation while being uniquely independent from the mitophagy receptor network. Consequently, based on this unique characteristic of OPTN, we further characterized OPTN as a non-redundant and independent mitophagy receptor in AML.
AML cells require OPTN to induce mitophagy upon mitochondrial stress
To further investigate mitophagy in AML cells, we targeted OPTN to modulate mitophagy flux levels. First, we validated the impaired mitophagy phenotype upon short hairpin RNA (shRNA) knockdown of OPTN in human AML cell lines MV4–11 and THP1 (Fig. S2A). We measured mitophagy flux using three complementary methods. First, we used the mt-mKEIMA reporter () to determine mitophagy induction. DFP-induced mitophagy was significantly reduced in MV4–11 and THP1 cells upon loss of OPTN (). OA-induced mitophagy was also reduced in both cell lines, but not as markedly as after DFP-induction (). Second, we measured mitochondrial degradation by western blotting of mitochondrial proteins upon DFP-induced mitophagy. Degradation of mitochondrial proteins TIMM23 (translocase of inner mitochondrial membrane 23) and COX4/COX IV (cytochrome c oxidase subunit 4) was abolished in THP1 OPTN-knockdown (KD) cells compared to control (CTRL) cells (Fig. S2B, C). In MV4–11 cells, degradation of mitochondrial proteins upon mitophagy induction was not reproducible (data not shown). Third, we used immunofluorescence to determine colocalization of mitochondrial with autophagosomal or lysosomal proteins for early or late stage mitophagy, respectively (). Both, early and late stage mitophagy were decreased in MV4–11 and THP1 OPTN-KD cells upon DFP treatment as shown by reduced colocalization ().
Figure 2. Loss of OPTN impairs mitophagy flux in AML cells. (A) Representative flow cytometry plots of mt-mKEIMA in MV4–11 and THP1 cells after knockdown of OPTN and treatment with 0.5 mM deferiprone (DFP) for 16 h. (B) Quantification of mitophagy induction from (A) and Figure S2E. Data are normalized to untreated control cells (n = 3). (C) Representative flow cytometry plots of mt-mKEIMA in MV4–11 and THP1 cells after knockdown of OPTN and treatment with 10 µM oligomycin/antimycin a (OA) for 4 h. (D) Quantification of mitophagy induction from (C) and Figure 2E. Data are normalized to untreated control cells (n = 3). (E) Schematic illustration of colocalization experiments for early- and late-stage mitophagy using immunofluorescent staining of TIMM23 or COX4/COXIV in combination with LC3 or LAMP1. (F) Representative immunofluorescent staining of early-stage mitophagy (see E) of CTRL and OPTN-KD human MV4–11 cells after 16 h of 0.5 mM DFP treatment for mitochondrial and autophagosomal markers TIMM23 and LC3, respectively. Arrows indicate colocalization of both markers. DAPI (4‘,6-diamidino-2-phenylindole) was used as a nuclear stain. Scale bar: 10 µm. Original magnification × 63. (G) Pearson’s coefficient for colocalization of TIMM23 and LC3 was analyzed using ImageJ for MV4–11 and THP1 cells (n = 3 with > 50 cells per replicate). Pearson’s coefficient was calculated between TIMM23 staining (channel A) and LC3 staining (channel B) in single cells upon automatic thresholding using moments algorithm [Citation23]. (H) Immunofluorescent staining of late-stage mitophagy (see E) of CTRL and OPTN-KD human THP1 cells after 16 h of 0.5 mM DFP treatment was performed with mitochondrial and lysosomal markers COX4 and LAMP1, respectively. Arrows indicate colocalization of both markers. DAPI (4‘,6-diamidino-2-phenylindole) was used as a nuclear stain. Scale bar: 10 µm. Original magnification × 63. (I) Pearson’s coefficient for colocalization of COX4 and LAMP1 was analyzed using ImageJ for THP1 cells (n = 3 with > 50 cells per replicate). Values are means ± SEM. Student‘s t-test was performed in (B, D, G, I). Note: *p < 0.05, **p < 0.01, ***p < 0.001.
![Figure 2. Loss of OPTN impairs mitophagy flux in AML cells. (A) Representative flow cytometry plots of mt-mKEIMA in MV4–11 and THP1 cells after knockdown of OPTN and treatment with 0.5 mM deferiprone (DFP) for 16 h. (B) Quantification of mitophagy induction from (A) and Figure S2E. Data are normalized to untreated control cells (n = 3). (C) Representative flow cytometry plots of mt-mKEIMA in MV4–11 and THP1 cells after knockdown of OPTN and treatment with 10 µM oligomycin/antimycin a (OA) for 4 h. (D) Quantification of mitophagy induction from (C) and Figure 2E. Data are normalized to untreated control cells (n = 3). (E) Schematic illustration of colocalization experiments for early- and late-stage mitophagy using immunofluorescent staining of TIMM23 or COX4/COXIV in combination with LC3 or LAMP1. (F) Representative immunofluorescent staining of early-stage mitophagy (see E) of CTRL and OPTN-KD human MV4–11 cells after 16 h of 0.5 mM DFP treatment for mitochondrial and autophagosomal markers TIMM23 and LC3, respectively. Arrows indicate colocalization of both markers. DAPI (4‘,6-diamidino-2-phenylindole) was used as a nuclear stain. Scale bar: 10 µm. Original magnification × 63. (G) Pearson’s coefficient for colocalization of TIMM23 and LC3 was analyzed using ImageJ for MV4–11 and THP1 cells (n = 3 with > 50 cells per replicate). Pearson’s coefficient was calculated between TIMM23 staining (channel A) and LC3 staining (channel B) in single cells upon automatic thresholding using moments algorithm [Citation23]. (H) Immunofluorescent staining of late-stage mitophagy (see E) of CTRL and OPTN-KD human THP1 cells after 16 h of 0.5 mM DFP treatment was performed with mitochondrial and lysosomal markers COX4 and LAMP1, respectively. Arrows indicate colocalization of both markers. DAPI (4‘,6-diamidino-2-phenylindole) was used as a nuclear stain. Scale bar: 10 µm. Original magnification × 63. (I) Pearson’s coefficient for colocalization of COX4 and LAMP1 was analyzed using ImageJ for THP1 cells (n = 3 with > 50 cells per replicate). Values are means ± SEM. Student‘s t-test was performed in (B, D, G, I). Note: *p < 0.05, **p < 0.01, ***p < 0.001.](/cms/asset/b920067f-058d-46d1-8418-40cbee424592/kaup_a_2230839_f0002_oc.jpg)
Additionally, we overexpressed human wild type (WT) OPTN in MV4–11 and THP1 cells (Fig. S2D) and measured mitophagy induction using mt-mKEIMA. Overexpression of OPTN enhanced mitophagy induction in both cell lines, especially upon DFP treatment (, Fig. S2E). In conclusion, especially DFP-induced mitophagy flux of human AML cells MV4–11 and THP1 correlates with OPTN expression.
OPTN expression modules proliferation of AML cells
Next, we assessed whether OPTN protein expression affects cellular growth of AML cells. We performed cellular expansion assays in MN1- or HOXA9-MEIS1-driven lineage-depleted mouse bone marrow (ldMBM) cells and in human MV4–11 and THP1 cells. OPTN-KD significantly decreased cell growth in all AML cells (). Consistently, overexpression of OPTN increased cell growth of human AML cells (). Likewise, colony-forming capacity was decreased upon knockdown and increased upon overexpression of OPTN ().
Figure 3. OPTN expression modulates proliferation of AML cells. (A) Quantification of cell proliferation of OPTN knockdown (KD) or overexpression (OE) cells normalized to corresponding control (CTRL) cells (n = 3). (B) Colony numbers were determined in colony-forming assays of OPTN-KD or OPTN-OE cells normalized to the corresponding CTRL cells (n = 3). (C) Quantification of cell proliferation of NTC + CTRL, OPTN-KO + CTRL, OPTN-KO + OPTN-WT, OPTN-KO + OPTNDF474, 475NA and OPTN-KO + OPTNF178A-transduced MV4–11 cells. Statistical significance was calculated to NTC-CTRL (n = 3). (D) BrdU/7AAD staining of CTRL and OPTN-KD murine MN1 or human MV4–11 cells analyzed by flow cytometry. The graph shows percentages of cells in each cell cycle phase (SubG1, < 2N DNA content; G0/G1, BrdU− 2N DNA content; S: BrdU+; G2/M, BrdU− 4N DNA content; n = 3). (E) Quantification of flow cytometry-based ANXA5-7AAD staining of OPTN-KD cells normalized to CTRL cells (n = 3). (F) Quantification of flow cytometry-based ANAX5-7AAD staining in NTC + CTRL, OPTN-KO + CTRL and OPTN-KO + OPTN-WT MV4–11 cells (n = 3). Values are means ± SEM. Student’s t-test was performed in (A-F). Note: *p < 0.05, **p < 0.01, ***p < 0.001.
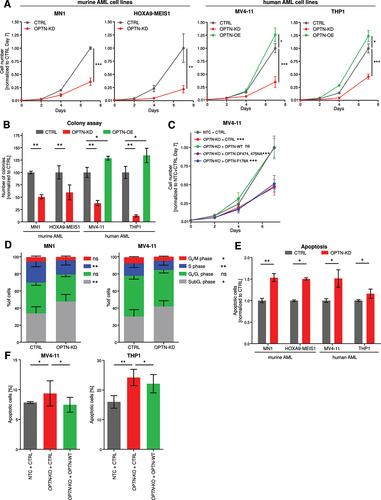
To study whether the proliferation phenotype depends on autophagy function of OPTN, we reconstituted MV4–11 OPTN-knockout (KO) cells with WT OPTN, a LIR-deficient OPTN mutant (OPTNF178A) or a ubiquitin-binding-deficient OPTN mutant (OPTNDF474,475NA) (Fig. S3A) [Citation24]. We found that the re-expression of WT OPTN rescued the mitophagy block of OPTN-KO cells while both mutants were unable to rescue (Fig. S3B, C). Furthermore, both OPTN mutants failed to rescue the block in proliferation of OPTN-KO cells while the re-expression of WT OPTN successfully reestablished normal cell growth comparable to the NTC+CTRL transduced cells ().
To further characterize the proliferation defect induced by loss of OPTN, we studied the percentage of cells in S-phase as measured by BrdU-7AAD staining (, Fig. S3D). OPTN-deficient cells proliferate less as demonstrated by significantly reduced cells in S-phase. Moreover, we investigated spontaneous apoptosis using flow cytometry and found that OPTN-KD induced apoptosis in all cell lines (, Fig. S3E). Re-expression of WT OPTN in OPTN-KO MV4–11 and THP1 cells rescued the increased apoptosis phenotype (, Fig. S3F). These findings suggest that impaired mitophagy caused by knockdown of OPTN significantly impairs cellular growth by inducing spontaneous apoptosis and decreasing proliferation.
Loss of OPTN impairs leukemia progression in a syngeneic MN1-driven leukemia model
As we demonstrated in vitro that knockdown of OPTN decreased proliferation of AML cells, we investigated the role of OPTN in leukemia progression in vivo. We used previously generated optn-KO mice [Citation25,Citation26] and implemented a MN1-driven leukemia model [Citation27] (). Genotyping of heterozygous and homozygous WT and optn-KO mice confirmed their genotypes (Fig. S4A). Lineage-depleted mouse bone marrow (ldMBM) cells of homozygous optn-KO and WT mice were transduced with the GFP-tagged oncogene MN1. Upon injection into lethally irradiated mice, both WT OPTN and OPTN-KO cells transformed with MN1 gave rise to leukemia (Fig. S4B-E). Importantly, OPTN-KO MN1-driven leukemic mice survived significantly longer than WT (median survival of 40 vs 33 days) ().
Figure 4. Loss of OPTN delays leukemia progression in murine AML model. (A) Schematic overview of the transplantation procedure. (B) Kaplan-Meier curve represents survival of WT (n = 7) and optn-KO (n = 11) MN1 leukemic mice after transplantation. (C) Colony numbers were determined in serial colony-forming unit assays of WT and OPTN-KO MN1-driven IdMBM leukemia cells isolated from the bone marrow of sick mice at time of death. Experiment was performed in triplicates with 500 LK cells (n = 3). (D) Representative flow cytometry plot of MitoSOX staining in WT and optn-KO MN1-driven IdMBM leukemia cells isolated from the bone marrow of sick mice at time of death. (E) Quantification of MitoSOX staining in (D) (n = 3). Gehan-Breslow-Wilcoxon Test was performed in (B). Student’s t-test was performed in (C, E). Values are means ± SEM. Note: *p < 0.05, **p < 0.01, ***p < 0.001.
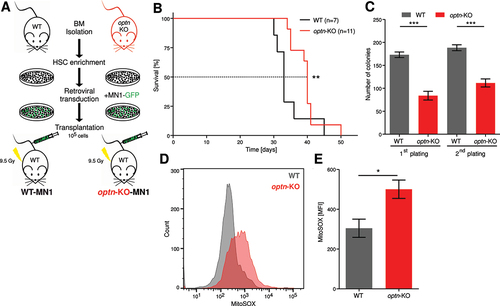
We isolated bone marrow cells from leukemic mice after death and assessed the clonogenic potential of lineage−cKit+ (LK) cells. Serial colony-forming assays revealed that OPTN-KO cells formed significantly fewer colonies (), consistent with the decreased clonogenic potential of OPTN-KO cells upon oncogenic transformation (Fig. S4F). Interestingly, mitochondrial reactive oxygen species (ROS) were significantly increased in OPTN-KO cells (), suggesting impaired mitochondrial function.
Mitochondrial function is impaired upon knockdown of OPTN in AML cells
Since mitochondrial ROS was increased in OPTN-KO cells isolated from leukemic mice at time of death, we investigated the mitochondrial phenotype upon knockdown of OPTN. Consistently, we found increased mitochondrial ROS in murine and human AML cells upon knockdown of OPTN (Fig. S5A-B). Mechanistically, we asked whether this increased mitochondrial ROS causes the proliferation defect upon loss of OPTN. To test this, we used the ROS scavenger N-acetyl-L-cysteine (NAC) in OPTN-KD cells and evaluated proliferation after 24 h. Interestingly, NAC treatment rescued the proliferation defect of OPTN-KD cells, while it did not increase proliferation of CTRL cells in MV4–11 and THP1 cells ().
Figure 5. Loss of OPTN impairs mitochondrial function in AML cells. (A) Proliferation of MV4–11 and THP1 cells treated with 200 µM N-acetyl-L-cysteine (NAC) for 24 h after OPTN-KD. Cells were counted using erythrosine B exclusion and cell numbers were normalized to CTRL + vehicle (n = 3). (B) Representative transmission electron microscopy (TEM) images from 50-nm thin sections of plastic embedded MV4–11 CTRL, OPTN-KD, and OPTN-OE cells. Scale bar: 2.5 µM or 0.5 µm. Black arrows indicate mitochondrial structures and red arrows indicate vacuoles, most likely representing autolysosomes. (C) Quantification of cellular structures observed in TEM images shown is (B). Data are percent of analyzed cells with the described structures (CTRL = 43 cells, OPTN-KD = 48 cells, OPTN-OE = 38 cells). P value by exact Poisson statistic, error bars indicate exact 95% confidence intervals assuming Poisson distribution. Experiment was repeated with highly similar results. (D) Quantification of mean fluorescence intensity (MFI) of MitoTracker Green staining in CTRL or OPTN-KD MV4–11 and THP1 cells shown in Figure S5E (THP1: n = 3, MV4–11: n = 4). (E) Quantification of pulse-labeled mitochondria in OPTN-deficient MN1 and (F) MV4–11 cells chased for 24 h after MitoTracker Green or Deep Red staining, respectively. Data are normalized to mean fluorescent intensity after pulse labeling. ΔT = chase time after pulse labeling of mitochondria in hours (n = 3) (G) Representative mitochondrial respiration of WT and optn-KO murine MN1-driven bone marrow cells from leukemic mice was determined by measuring oxygen consumption rate (OCR). (H) Quantification of basal and maximal respiration and ATP production in WT and optn-KO MN1 cells from (G) (n = 3). (I) Cell growth analysis of human MV4–11 and THP1 cells after knockdown of OPTN in presence or absence of 1 mM 2-deoxyglucose (2-DG), 1 µM oligomycin and antimycin a (OA), or 1 mM paraquat. Cells were incubated for 24 h with inhibitors and counted using erythrosine B exclusion. Cell numbers were normalized to DMSO controls (n = 3). (J) TCGA LAML data for adult patients with de novo AML were analyzed for survival and stratified by low (below median; red) and high (above median; black) OPTN mRNA expression. Student’s t-test was performed in (A, C-F, H and I). Values are means ± SEM. Note: *p < 0.05, **p < 0.01, ***p < 0.001.
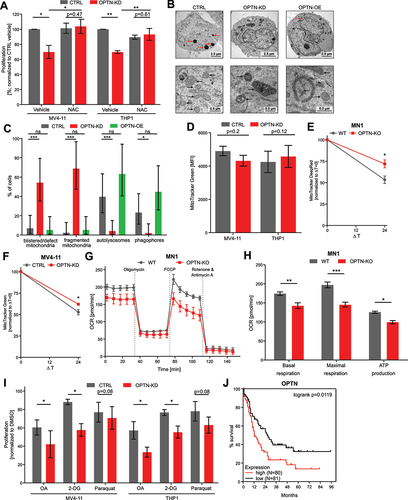
Next, we characterized mitochondrial morphology upon loss or overexpression of OPTN using transmission electron microscopy (TEM). In OPTN-KD cells, we found significantly more ruptured or aberrant mitochondria with fragmented and vesicularized cristae and blistered outer membranes (). Compared to OPTN-KD cells, mitochondrial morphology was normal in OPTN-OE cells. However, they showed a tendency of increased formation of very large phagophore structures, compared to CTRL cells (p = 0.25; ). Notably, we frequently observed darkly stained vacuoles, which are most likely autolysosomes in CTRL cells and slightly more in OPTN-OE cells (p = 0.35), while they were missing in OPTN-KD cells (). Next, we analyzed steady-state mitochondrial mass using flow-cytometry-based MitoTracker Green staining. Unexpectedly, OPTN-deficient cells did not show significant differences in mitochondrial mass (, Fig. S5C). Quantification of mitochondrial proteins TIMM23 and COX4 in OPTN-deficient cells confirmed these findings (Fig. S5D-E). Mitochondrial dynamics are highly complex and mitophagy is mechanism influencing total cellular content of mitochondria [Citation28]. We hypothesized that AML cells may compensate for impaired mitophagy after loss of OPTN by decreasing mitochondrial biogenesis, which could lead to similar cellular mitochondrial amounts. To address this hypothesis, we pulse-labeled mitochondria in human MV4–11 or murine MN1 cells with MitoTracker Green or Deep Red, respectively, followed by a 24 h chase [Citation29]. Pulse-labeled mitochondria were degraded more slowly in OPTN-deficient cells than in CTRL cells (). Moreover, this effect was consistently observed at different timepoints and a longer chase (Fig. S5F). These findings suggest that depletion of OPTN slows mitochondrial clearance, which is consistent with a defect in mitophagy. As total mitochondrial mass at steady state is unchanged after depletion of OPTN, we hypothesize that decreased mitochondrial biogenesis upon loss of OPTN may account for this. However, our data provides only indirect evidence, as we have not directly measured mitochondrial biogenesis in the presence or absence of OPTN.
Thus, we hypothesized that mitochondrial function might be impaired by loss of OPTN and therefore, we analyzed the oxygen consumption rate (OCR) in murine MN1-driven optn-KO cells. Loss of OPTN, caused significantly impaired basal and maximal respiration (). ATP production was significantly reduced in optn-KO cells while non-mitochondrial oxygen consumption and proton leakage were only slightly impaired (, Fig. S5G). Furthermore, spare respiratory capacity was abolished (Fig. S5G), which might sensitize OPTN-deficient cells to oxidative metabolic stress.
To test this hypothesis, we investigated the viability of OPTN-KD cells in presence of three different mitochondria-targeting agents. First, we used OA treatment to inhibit oxidative phosphorylation (OXPHOS). Second, we used 2-deoxyglucose (2-DG) to inhibit glycolysis, and lastly, we used mitochondrial ROS inducer paraquat [Citation30]. Both cell lines proliferated less upon loss of OPTN and OXPHOS-inhibition, glycolysis inhibition or ROS induction (), indicating that loss of OPTN sensitizes AML cells to oxidative metabolic stress.
Finally, we asked whether reduced OPTN expression might have clinical relevance. Therefore, we analyzed mRNA expression data for 161 patients from The Cancer Genome Atlas (TCGA) [Citation31]. Survival curves were stratified by median mRNA expression of OPTN. Low OPTN mRNA expression correlated significantly with better overall survival (). These findings in conjunction with our data on OPTN-dependent mitophagy in AML suggest that inhibition of mitophagy by targeting OPTN may be a promising therapeutic approach.
Discussion
Although the importance of mitophagy and mitochondrial homeostasis in cancer is increasingly being recognized, the contributions of different components have remained mostly unexplored [Citation9,Citation28,Citation32]. Here, we systematically unraveled the highly intertwined network of mitophagy receptors using a multiplexed CRISPR screen. Our results reveal previously unknown differences between ubiquitin-dependent and -independent mitophagy. We identified OPTN as a largely autonomous mitophagy receptor, thus making it a useful tool and potential target to tackle mitophagy as a process. We conclusively demonstrated that murine and human AML cells require OPTN for mitophagy and proliferation. Furthermore, murine leukemia progression was delayed by loss of OPTN. OPTN-deficiency led to impaired mitochondrial function and sensitized human AML cells to mitochondria-targeting drugs.
To our knowledge, this is the first study systematically investigating redundancies between all hitherto known mitophagy receptors in both ubiquitin-dependent and -independent mitophagy in leukemia. Previously, both genome-wide and autophagy-specific CRISPR screens have identified strong autophagy inhibition correlating negatively with proliferation upon knockout of core autophagy genes [Citation22,Citation33]. Similarly, in our specialized multiplex mitophagy receptor screen, we observed a significant growth disadvantage compared to controls. Only one mitophagy receptor, BNIP3, was found to affect mitophagy but not proliferation. Importantly, our findings demonstrate that particularly ubiquitin-dependent mitophagy correlates highly with proliferation, indicating a dependency of AML cells. Several CRISPR screens in artificial cell systems with PRKN-overexpression investigated ubiquitin-dependent mitophagy and identified classical mitophagy receptors such as OPTN, TAX1BP1, and CALCOCO2 [Citation34,Citation35]. In HeLa cells overexpressing PRKN, OPTN and CALCOCO2 were identified as primary yet redundant receptors for ubiquitin-dependent mitophagy [Citation14]. Here, we confirmed a highly interacting role of CALCOCO2 for ubiquitin-dependent mitophagy in AML cells. Importantly, OPTN was identified as the most independent receptor for mitophagy, outside of the highly intertwined interaction network. Nevertheless, further mitophagy receptors were discovered after the design of our multiplexed screen and thus not included: AMBRA1 (autophagy and beclin 1 regulator 1) [Citation36], cardiolipin [Citation37], NIPSNAP1 (nipsnap homolog 1), and NIPSNAP2 (nipsnap homolog 2) [Citation38]. Their contribution to our proposed interactome in AML cells remains to be clarified.
Even though it was shown that OPTN mediates ubiquitin-dependent mitophagy [Citation14,Citation39], we confirmed a greater role of OPTN for ubiquitin-independent mitophagy in our validation experiments in AML cells. This might be caused by unique functions of OPTN, since it is the only classical receptor that was shown to also be involved in autophagosome formation and maturation [Citation40]. OPTN might be able to potentiate mitophagy in a ubiquitin-independent manner by recruiting the ULK1 (unc-51 like autophagy activating kinase 1) and ATG12–ATG5-ATG16L1 complexes to autophagy initiation sites [Citation14,Citation41]. The increased mitophagy flux that we observed upon overexpression of OPTN is consistent with published data [Citation42,Citation43].
We determined that reduced mitophagy induced by OPTN knockdown blocks AML cell proliferation. This is in agreement with prior reports implicating ATG7 (autophagy related 7)-dependent macroautophagy in AML disease progression [Citation44]. However, some studies in established solid tumor models [Citation45,Citation46] show opposite effects of OPTN deficiency. In lung cancer cells, for example, OPTN has been described to be a tumor suppressor [Citation47,Citation48]. Our in vivo leukemia model showed delayed leukemia progression in mice upon loss of OPTN and further shows the dependency of AML cell proliferation on OPTN-mediated mitophagy. The MN1 leukemia model is a highly aggressive disease model, and the modest survival benefit needs to be judged in this context. Previous mouse experiments targeting selective or bulk autophagy achieved similar effect sizes [Citation12,Citation44]. However, our observed survival benefit remains modest. Further experiments in more clinically relevant models of AML will be required to firmly establish the clinical significance of OPTN.
Knockdown of OPTN increased mitochondrial ROS in AML cells. Importantly, scavenging excessive ROS with NAC rescued the proliferation defect caused by OPTN-KD. Although the precise mechanism has not been shown, this agrees well with prior data for mitophagy receptors SQSTM1 and BNIP3L [Citation12,Citation49]. Also, pharmacologic mitophagy inhibition using an SQSTM1 inhibitor XRK3F2 [Citation50] or the nonspecific mitophagy inhibitor MDIVI-1 (data not shown) resulted in increased ROS in various AML cells. Increased ROS may thus be a ubiquitous result of mitophagy inhibition in AML independent of the mechanism by which mitophagy is impaired. Interestingly, our data showed that depletion of OPTN significantly reduced mitophagy induction and mitochondrial clearance, but no changes in mitochondrial mass. Although we do not have direct evidence for this, we hypothesize that loss of OPTN may also reduce mitochondrial biogenesis [Citation51], leading to equal steady state mitochondrial mass. Mitochondrial biogenesis should be further investigated in this context.
Our data also demonstrated that mitochondrial function was impaired upon loss of OPTN. Both LSCs and HSCs require mitochondrial function for stem cell functions [Citation8,Citation52], and it has been shown that low spare respiration sensitized them to oxidative stress [Citation46,Citation53]. In line with this, our data indicate that loss of OPTN sensitized AML cells to mitochondria-targeting drugs. A similar sensitization has been shown for BNIP3L and SQSTM1 knockdown in other AML models [Citation49].
OPTN also possesses autophagy-independent functions [Citation40]. For example, OPTN and IKBKG/NEMO (inhibitor of nuclear factor kappa B kinase regulatory subunit gamma) share a substantial homology, and, therefore, OPTN is considered as a negative regulator of NFKB/NFκB signaling [Citation54]. Additionally, it has been shown that OPTN plays a crucial role in the maintenance of the Golgi apparatus [Citation40,Citation55] Importantly, our findings demonstrated that the mitophagy block induced by knockdown of OPTN depends on its selective autophagy function, since the phenotype was rescued by wild-type OPTN but not by LIR and UBAN mutants [Citation14,Citation24].
Our results suggest the preclinical development of OPTN inhibitors for AML therapy. Currently available strategies targeting mitophagy are promising yet rather nonspecific. The DNM1L (dynamin 1 like) inhibitor MDIVI-1 has recently been used in a myelodysplastic syndrome model [Citation56], where mice treated with MDIVI-1 survived significantly longer due to inhibition of excessive mitochondrial fragmentation [Citation57]. The SQSTM1 inhibitor XRK3F2 has been used in different cancer entities and neurodegenerative disease [Citation58–60]. As shown for XRK3F2 in AML cells [Citation50] as well as for MDIVI-1 in lung and breast cancer cells [Citation61,Citation62], both drugs increased mitochondrial ROS and impaired respiration. It was previously shown that XRK3F2 treatment impairs leukemia development in mice [Citation50].
Our data highlight the essential role of OPTN-induced mitophagy in progression and survival of leukemia cells and identify the mitophagy receptor OPTN as an independent functional node. Moreover, our data provide a rational to develop a specific mitophagy inhibitor targeting OPTN as promising novel strategy for AML therapy.
Materials and methods
Cells
Cells were cultured at 37°C with 5% CO2 in a humidified Heracell 150i incubator (Thermo Fisher Scientific). MV4–11 and THP1 cells (DSMZ, ACC 102 and ACC 16) were grown in RPMI 1640 medium (Gibco, Thermo Fisher Scientific, 21875–091) supplemented with 10% fetal bovine serum (FBS; Sigma-Aldrich, F7524) and 1% penicillin-streptomycin (Gibco, Thermo Fisher Scientific, P4333). Murine MN1- or HOXA9-MEIS1-driven IdMBM cells (generated as described in supplementary Materials and Methods) were cultured in Iscove Basal Medium (Gibco, Thermo Fisher Scientific, 21980032) supplemented with 10% FBS, 1% penicillin-streptomycin, 50 ng/mL murine stem cell factor (PeproTech, 250–03), 10 ng/mL murine IL3 (PeproTech, 213–13) and 10 ng/mL murine IL6 (PeproTech, 216–16). Plat-E (Cell Biolabs Inc., RV-101) and HEK293T cells (DSMZ, ACC 635) were grown in DMEM medium (Gibco, Thermo Fisher Scientific, 41965–062) supplemented with 10% FBS and 1% penicillin-streptomycin.
CRISPR-Cas9 mitophagy receptor screen
A multiplexed mitophagy receptor library was used, that contained gRNAs targeting CALCOCO2, NBR1, TAX1BP1, BNIP3L, BNIP3, FKBP8, PHB2, FUNDC1, BCL2L13, NLRX1, SQSTM1, NCOA4, and PINK1. The library was generated using 3CS technology [Citation63] and was fully sequenced after preparation. For lentivirus production, the library was co-transfected with the packaging vectors pMD2.G (Addgene, 12259) and psPAX2 (Addgene, 12260) into HEK293T cells using 4.5 µL PEI (polyethylenimine) per µg DNA. Medium was changed to DMEM supplemented with 5% FBS and 1% penicillin-streptomycin after 16 h of transfection. Supernatant containing the produced lentivirus was collected 48 h afterward. To determine virus titer, MV4–11 cells expressing Cas9 and mt-mKEIMA [Citation17] were transduced with serial virus dilutions and GFP expression was measured 48 h after transduction. For the following experiments, a virus dilution leading to an MOI of ~ 0.3 was chosen.
For transduction, MV4–11 cells expressing Cas9 and mt-mKEIMA were incubated with 8 µg/mL polybrene for 30 min. After the virus was added to the cells aiming for a coverage of 200 and an MOI of ~ 0.3, spinfection was performed for 1 h at 34°C and 235 × g. After 24 h, medium was changed to fresh RPMI, and 48 h after transduction the cells were selected with 2 µg/mL puromycin for 14 days. Mitophagy was induced by treating the cells with 0.5 mM DFP for 16 h and 10 µM OA for 4 h. After mitophagy induction, cells were sorted using a BD FACSAria III (BD Biosciences) for 5% highest and lowest mitophagy using the pH4:pH7 mt-mKEIMA ratio histogram resulting in three million cells per population. Cells were harvested and frozen for DNA isolation after 14 days of selection and after sorting.
For isolation of genomic DNA, cells were washed with PBS (Gibco, Thermo Fisher Scientific, 14040133) and lysed in 1 mL TEX buffer (10 mM Tris‐HCl, pH 7.5, 1 mM EDTA pH 7.9, 0.5% SDS, 250 μg/mL proteinase K [Carl Roth, 7528.4] and 10 µg/mL RNase A [Sigma Aldrich, 10109142001]) overnight at 37°C. For precipitation, 350 µL NaCl was added, vortexed and incubated for 30 min at 4°C. After centrifugation for 30 min at 12,000 × g and 4°C the supernatant was mixed with 2 mL ice-cold 100% EtOH, thoroughly vortexed and incubated for 60 min at 80°C. After centrifugation at 5,000 × g for 45 min at 4°C, the supernatant was discarded. The pellet was washed with 2 mL ice-cold 70% EtOH and centrifuged at 12,000 × g and 4°C for 30 min. The remaining pellet was dried and dissolved in DNase-free water. DNA concentration was determined using a NanoDrop 2000 spectrophotometer (Thermo Fisher).
Sample preparation for next generation sequencing was performed with two subsequent PCR reactions. For the first PCR reaction (PCR1), the total amount of genomic DNA was calculated as follows: coverage × number of guides/MOI × 6.6 pg DNA. For the final volume of 50 µL, 45 ng of plasmid DNA or 2 µg of genomic DNA, 2.5 µL of each 10 µM PCR1 forward and reverse primers and 25 µL Next High-Fidelity 2× PCR Master Mix (NEB, M0541L) was used. Thermal cycler protocol was applied as follows: Initial denaturation at 98°C for 2 min, 15 cycles of denaturation at 98°C for 2 min, annealing at 60°C for 55 s, extension at 72°C for 1 min, and final extension at 72°C for 10 min. For the second PCR reaction (PCR2) 5 µL from PCR-1 product was used in a total volume of 50 µL containing 25 µL Next High-Fidelity 2× PCR Master Mix and 2.5 µL of 10 µM PCR2 primers with i7 Illumina adaptors and 8 bp barcodes. Thermal cycler protocol was applied as follows: Initial denaturation at 98°C for 3 s, 15 cycles of denaturation at 98°C for 1 min, annealing at 68°C for 55 s, extension at 72°C for 55 s, and final extension at 72°C for 10 s. PCR2 products were purified from a 2% agarose gel using Nucleospin Gel and PCR Clean-up Kit (Macherey-Nagel, 740609.250).
Screening samples were denatured and pooled according to Illumina guidelines and sequenced at GeneWiz Inc. (www.genewiz.com) in presence of 5% PhiX control on an Illumina NovaSeq machine in paired-end mode with 2 × 150cycles, and 8 cycles of index reading. The target sequencing depth was 1,000-fold.
Raw sequencing data were demultiplexed using the bcl2fastq tool (v2.20.0.422) from Illumina, and enrichment analyses were performed using MAGeCK [Citation64]. MAGeCK was set up for median normalization, other parameters were left at default. For proliferation analysis, the day 14 data were compared to the library and for mitophagy analysis, the low mitophagy samples were compared to high mitophagy samples. gRNA combinations with p < 0.05 and log2 fold changes (LFC) ≤ −1 were accepted as statistically significant hits. Genetic interactions (GIs) were computed based on an additive model [Citation21,Citation22]. Briefly, for each gene pair, an expected double mutant phenotype for non-interacting genes was calculated by summing the individual single mutant LFCs. The deviation between observed and expected double mutant phenotypes was quantified with a delta log2 fold change (dLFC) [Citation65]. We assumed both possible combinations of two genes X and Y, (X,Y) and (Y,X), to show the same phenotype and, therefore, averaged (X,Y) and (Y,X) pairs.
Generation of stable knockdown cells by lentiviral shRNA transduction system and re-expression of OPTN wild type and different mutants
Stable knockdown was induced by shRNAs (murine OPTN: TRCN0000177595, Sigma-Aldrich, sequence: 5’-CCGGCTGAAAGAGAACAATGACATTCTCGAGAATGTCATTGTTCTCTTTCAGTTTTTTG-3’, human OPTN: TRCN0000083744, Sigma-Aldrich, Sequence: 5’- CCGGGCCAAGAATTACTTCGAACATCTCGAGAT GTTCGAAGTAATTCTTGGCTTTTTG-3’, human BNIP3: TRCN0000280311, Sigma-Aldrich, sequence: 5’- GCTTCTGAAACAGATACCCAT-3’, human FKBP8: TRCN0000422292, Sigma-Aldrich, sequence: 5’ AGGACTTCGAGGTACTGGATG-3’, human BCL2L13: TRCN0000229865, Sigma-Aldrich, sequence: 5’- AGCTCCCTTGCTTCCACATAT-3’). Non-targeting shRNA (SH SHC002, Sigma-Aldrich, sequence: 5’-CCGGCAACAAGATGAAGAGCACCAACTC-3’) was used as control. For virus production, shRNAs were co-transfected with the packaging vectors pMD2.G and psPAX2 into HEK293T cells using 4.5 µL polyethylenimine (PEI) per µg DNA. After 16 h of transfection, medium was changed and the supernatant containing lentivirus was collected 48 h afterward and stored at −80°C.
Murine shRNA lentivirus was concentrated using density gradient ultracentrifugation. For this, 20% sucrose was added underneath the collected viral supernatant and centrifuged for 2 h and 20 min at 20,200 × g at 4°C. The viral pellet was resuspended in IMDM medium overnight and stored at −80°C. MN1- and HOXA9-MEIS1-driven ldMBM leukemia cells were transduced with concentrated shOPTN and shCTRL lentiviruses by spinfection for 1 h at 235 × g and 34°C after incubation with 8 µg/mL polybrene for 30 min. Two days after transduction, MN1 and HOXA9-MEIS1 cells were selected with puromycin (10 µg/mL or 3 µg/mL, respectively) for at least 48 h.
Human AML cell lines were incubated with 8 µg/mL polybrene for 30 min followed by transduction with unconcentrated shRNA lentivirus in a 1:5 ratio by spinfection for 1 h at 34°C and 235 × g. Two days after transduction, cells were selected with 2 µg/mL puromycin for at least 48 h.
For rescue experiments, OPTN was knocked out in Cas9-expressing MV4–11 cells by spinfection with lentiviruses for sgRNAs targeting OPTN (5’-CTCGAGATTGAAACCCAGACAGAG-3’) or non-targeting ctrl (NTC, 5’-CTCGAACTATTTCCTTTTTGTTTA-3’). After puromycin selection, human OPTN-WT-venus, OPTNDF474,475NA-venus or OPTNF178A-venus or an empty control vector was transduced by spinfection as described previously. Then, venus-positive cells were sorted using a BD FACSAria III (BD Biosciences).
Flow cytometry
Flow cytometry measurements were performed using BD LSRFortessa™ Cell Analyzer (BD Biosciences). All stainings were performed according to the manufacturer’s instructions. To investigate apoptosis, cells were stained with APC-conjugated Annexin-V (BD Biosciences, 550474) and 7AAD (BD Biosciences, 559925). For cell cycle analysis, APC BrdU Flow Kit (BD Biosciences, 552598) was used. To measure mitochondrial superoxide levels, cells were stained with MitoSOX Red mitochondrial superoxide indicator (Thermo Fisher Scientific, M36008). To measure mitochondrial mass, cells were stained with 20 nM MitoTracker Green FM (Cell Signaling Technology, 9074), or 10 nM MitoTracker Deep Red FM (Cell Signaling Technology, 8778). For pulse labeling of mitochondria, cells were stained with MitoTracker dyes for 30 min, before washing and resuspension in normal cell culture medium. Data were analyzed using the FlowJo 10.8.1 (Tree Star).
Immunofluorescent staining
Cells were washed with PBS and spun at 300 × g for 5 min onto superfrost slides using a Cytospin 4 (Thermo Fisher Scientific). Cells were fixed in 4% PFA, washed and permeabilized with 0.5% Triton X. After washing, cells were incubated with Image-IT FX Signal Enhancer (Thermo Fisher Scientific, I36933), and blocked for 1 h in BlockAid solution (Thermo Fisher Scientific, B10710). Diluted primary antibodies were applied overnight at 4°C. Spots were stained with diluted secondary antibodies for 1 h and coverslips were mounted with Prolong Diamond Antifade Mountant with DAPI (4′,6-diamidino-2-phenylindole; Thermo Fisher Scientific, P36962).
For immunofluorescence staining of early-stage mitophagy, we used polyclonal rabbit anti-TIMM23 (Proteintech, 1123-I-AP), monoclonal mouse anti-LC3B (MBL Life Science, M152–3; clone 4E12) as primary antibodies in combination with goat anti-mouse IgG (H+L) Alexa Fluor 594 (Thermo Fisher Scientific, A32742), or goat anti-rabbit IgG (H+L) Alexa Fluor 647 (Thermo Fisher Scientific, A21244). For immunofluorescence staining of late-stage mitophagy we used rabbit monoclonal anti-COX4 conjugated to Alexa Fluor 488 (Cell Signaling Technology, 4853; clone 3E11) and monoclonal rabbit anti-LAMP1 conjugated to Alexa Fluor 647 (Cell Signaling Technology, 73589, clone D2D11).
Epifluorescent images were captured using a confocal microscope Leica TCS SP5 II with a 63× oil immersion objective and LAS AF Software (Leica Microsystems). ImageJ (v2.1.0, NIH Bethesda, MD, USA) was used for quantification of colocalization.
Growth assays
Cellular expansion was measured by counting viable cells using Erythrosine B exclusion at indicated timepoints after seeding 10,000 cells. At each time point, fresh medium was added to the cells.
Colony forming ability was analyzed by seeding 500 viable cells in methylcellulose medium (Stem Cell Technologies Inc., M3534 or M3231). Colonies were evaluated after seven days. For replating, cells were eluted from methylcellulose, and plated as described above.
For proliferation assays, 50,000 viable cells were cultivated for 24 h in presence of 1 µM OA, 1 mM 2-deoxyglucose (2-DG, MedChem Express, HY-13966), 1 mM paraquat (Sigma-Aldrich, 36541), or DMSO as vehicle control. Viable cells were counted after 24 h using Erythrosine B exclusion and cell numbers were normalized to DMSO.
Mice
We used the published optn-KO mice [Citation25,Citation26] that were kindly provided by Folma Buss (Cambridge Institute for Medical Research, University of Cambridge, Cambridge, UK) and Andrew Smith (Microbial Diseases, Eastman Dental Institute, UCL, London, UK). Wild type (WT) C57BL/6J mice were purchased from Janvier Labs (Mayenne, France). All mice were kept under pathogen-free conditions in the research animal facility of the University Hospital Frankfurt according to institutional guidelines. All animal experiments were approved (FK1112) by the official committee on animal experimentation (Regierungspräsidium Darmstadt, Germany).
Murine MN1-driven leukemia model
Bone marrow cells were isolated from C57BL/6J WT or optn-KO mice and lineage-negative cells were enriched using the Lineage Cell Depletion Kit (Miltenyi Biotec, 130-090-858). WT and optn-KO ldMBM cells were transduced with MN1 co-expressing GFP as described previously [Citation27]. Two days after transduction, 1 × 10⁵ MN1-GFP-positive cells were injected together with 2 × 10⁵ supporting WT mononuclear cells into the tail vein of 6- to 8-weeks-old, female recipient mice. In order to reduce risk of graft rejection, mice were lethally irradiated with 9.5 Gy 2 h prior to transplantation. Survival analysis was performed by the Kaplan-Meier method using GraphPad Prism (v5.01, GraphPad Software, Inc., San Diego, CA, USA) and the p value was obtained by Gehan-Breslow-Wilcoxon test. Detailed procedures of the analyses of leukemic mice are described in the supplemental Materials and Methods.
Transmission electron microscopy
Cells were washed twice with PBS and fixed using 2.5% glutaraldehyde in 0.1 M cacodylate buffer pH 7.2 for 2 h at RT and collected by sedimentation. Post-fixation was done with 1% reduced osmium tetroxide. Dehydration was performed by gradually increasing ethanol concentration. Samples were embedded using araldite. Ultrathin sections (50 nm) were cut using a Reichert Ultracut ultra-microtome and placed on a Pioloform coated slot grid. Grids were post-stained with uranyl acetate and lead citrate and analyzed using a digitalized Zeiss TEM 900 operated at 80 keV equipped with a Troendle 2K camera.
Cellular structures were quantified for individual cells. P value was determined by exact Poisson statistic, error bars indicate exact 95% confidence intervals assuming Poisson distribution.
Measurement of OCR
Mitochondrial respiration was measured by the oxygen consumption rate (OCR) using the XF Cell Mito Stress Test Kit (Agilent Technologies, 103015–100) on a 96-well Seahorse Bioscience Extracellular Flux Analyzer XF96 (Agilent Technologies) as described previously [Citation66]. Murine or human cells (5 × 10⁵ or 2 × 10⁵, respectively) were seeded in the stress assay medium as described by the manufacturer in XF96 Polystyrene Cell Culture Microplate for 1 h at 37°C without CO2. OCR was measured in the presence of 2 µM oligomycin A (Biomol, Cay11342–10), 0.25–5 µM carbonylcyanide 4-(trifluoromethoxy)phenylhydrazone (FCCP; Sigma-Aldrich, C2920) and 2 µM antimycin A (Sigma-Aldrich, A8674) and rotenone (Sigma-Aldrich, R8875). For every phase, a total of five four-minute measurements were taken after 2 min of mixing and 1 min waiting. Basal, maximal and spare respiration, ATP production, proton leakage, and non-mitochondrial oxygen consumption were determined according to the Mito Stress Test Kit manual.
In silico analyses of OPTN expression in patient data
Clinical and RNA sequencing data from the TCGA project were retrieved on 20 June 2022. Clinical data included in the analysis were vital status and time to event (equivalent to days to death if the patient is deceased or days to last follow-up if a patient is alive). Cases with right-censored data at the time of the event were included in the analysis. Data were analyzed with R (v4.1.1), and plots were generated with GraphPad Prism (v5.01, GraphPad Software, Inc.). The log-rank test was used to test for a difference in survival probability between groups and to calculate a p value.
Statistical analysis
All data are shown as mean value ± standard error of the mean (SEM). All statistical tests were performed in GraphPad Prism (v5.01, GraphPad Software, Inc.). Groups were compared using 2-tailed Student t-test with p values < 0.05 considered statistically significant.
Supplemental Material
Download MS Word (2.6 MB)Acknowledgements
The authors thank Folma Buss and Andrew Smith for kindly sharing the optn-KO mice.
Disclosure statement
The Goethe University provides an exclusive license of the 3Cs technology to Vivlion GmbH, for which Manuel Kaulich is a co-founder, shareholder, and chief officer. The other authors declare no conflict of interest.
Data availability statement
Read counts and MAGeCK outputs for CRISPR-Cas9 screen are provided as Supplementary Tables. Additionally, sequencing data are accessible from GEO (https://www.ncbi.nlm.nih.gov/geo/query/acc.cgi?acc= GSE211073; GSE211073; GSE211073, token: kbozwwekvbknfqd). For detailed information regarding CRISPR screen, lentiviral transduction, constructs, mouse experiments, and immunoblotting, see supplemental Materials and Methods.
Supplementary material
Supplemental data for this article can be accessed online at https://doi.org/10.1080/15548627.2023.2230839
Additional information
Funding
References
- Vetrie D, Helgason GV, Copland M. The leukaemia stem cell: similarities, differences and clinical prospects in CML and AML. Nat Rev Cancer. 2020;20(3):158–173. doi: 10.1038/s41568-019-0230-9 InternetAvailable from.
- Hackl H, Astanina K, Wieser R. Molecular and genetic alterations associated with therapy resistance and relapse of acute myeloid leukemia. J Hematol Oncol. 2017;10(1):1–16. doi: 10.1186/s13045-017-0416-0
- Dykstra KM, Fay HRS, Massey AC, et al. Inhibiting autophagy targets human leukemic stem cells and hypoxic AML blasts by disrupting mitochondrial homeostasis. Blood Adv. 2021;5(8):2087–2100. doi: 10.1182/bloodadvances.2020002666
- Pérez-Hernández M, Arias A, Martínez-García D, et al. Targeting autophagy for cancer treatment and tumor chemosensitization. Cancers. 2019;11(10):11. doi: 10.3390/cancers11101599
- Folkerts H, Hilgendorf S, Wierenga ATJ, et al. Inhibition of autophagy as a treatment strategy for p53 wild-type acute myeloid leukemia. Cell Death Dis. 2017;8(7):e2927–e2927. InternetAvailable from. doi: 10.1038/cddis.2017.317
- Koschade SE, Klann K, Shaid S, et al. Translatome proteomics identifies autophagy as a resistance mechanism to on-target FLT3 inhibitors in acute myeloid leukemia. Leukemia. 2022;36(10):2396–2407. doi: 10.1038/s41375-022-01678-y
- Rangwala R, Leone R, Chang YC, et al. Phase I trial of hydroxychloroquine with dose-intense temozolomide in patients with advanced solid tumors and melanoma. Autophagy. 2014;10(8):1369–1379. doi: 10.4161/auto.29118
- Pei S, Minhajuddin M, Adane B, et al. AMPK/FIS1-mediated mitophagy is required for self-renewal of human AML stem cells. Cell Stem Cell. 2018;23(1):86–100.e6. InternetAvailable from. doi: 10.1016/j.stem.2018.05.021
- Koschade SE, Brandts CH. Selective autophagy in normal and malignant hematopoiesis. J Mol Biol. 2019;432(1):261–282. doi: 10.1016/j.jmb.2019.06.025 InternetAvailable from.
- Youle RJ, Narendra DP. Mechanisms of mitophagy. Nat Rev Mol Cell Biol. 2011;12(1):9–14. doi: 10.1038/nrm3028 InternetAvailable from.
- Villa E, Marchetti S, Ricci JE. No Parkin zone: mitophagy without Parkin. Trends Cell Biol. 2018;28:882–895. InternetAvailable from. doi: 10.1016/j.tcb.2018.07.004
- Nguyen TD, Shaid S, Vakhrusheva O, et al. Loss of the selective autophagy receptor p62 impairs murine myeloid leukemia progression and mitophagy. Blood. 2019;133(2):168–179. doi: 10.1182/blood-2018-02-833475
- Zellner S, Schifferer M, Behrends C. Systematically defining selective autophagy receptor-specific cargo using autophagosome content profiling. Mol Cell. 2021;81(6):1337–1354.e8. doi: 10.1016/j.molcel.2021.01.009 InternetAvailable from.
- Lazarou M, Sliter DA, Kane LA, et al. The ubiquitin kinase PINK1 recruits autophagy receptors to induce mitophagy. Nature. 2015;524(7565):309–314. doi: 10.1038/nature14893
- Ajoolabady A, Aslkhodapasandhokmabad H, Aghanejad A, et al. Mitophagy receptors and mediators: therapeutic targets in the management of cardiovascular ageing. Ageing Res Rev [InternetAvailable from]. 2020;62:101129. doi: 10.1016/j.arr.2020.101129
- Mancias JD, Wang X, Gygi SP, et al. Quantitative proteomics identifies NCOA4 as the cargo receptor mediating ferritinophagy. Nature. 2014;509(7498):105–109. doi: 10.1038/nature13148
- Katayama H, Kogure T, Mizushima N, et al. A sensitive and quantitative technique for detecting autophagic events based on lysosomal delivery. Chem Biol [InternetAvailable from]. 2011;18:1042–1052. doi: 10.1016/j.chembiol.2011.05.013
- Vives-Bauza C, Zhou C, Huang Y, et al. PINK1-dependent recruitment of Parkin to mitochondria in mitophagy. Proc Natl Acad Sci U S A. 2010;107(1):378–383. doi: 10.1073/pnas.0911187107
- Allen GFG, Toth R, James J, et al. Loss of iron triggers PINK1/Parkin-independent mitophagy. EMBO Rep. 2013;14(12):1127–1135. InternetAvailable from. doi: 10.1038/embor.2013.168
- Dempster J, Rossen J, Kazachkova M, et al. Extracting biological insights from the project achilles genome-scale CRISPR screens in cancer cell lines. bioRxiv. 2019. doi: 10.1101/720243.
- Mani R, St. Onge RP, Hartman IJ, et al. Defining genetic interaction. Proc Natl Acad Sci U S A. 2008;105(9):3461–3466. doi: 10.1073/pnas.0712255105
- Diehl V, Wegner M, Grumati P, et al. Minimized combinatorial CRISPR screens identify genetic interactions in autophagy. Nucleic Acids Res. 2021;49(10):5684–5704. InternetAvailable from: https://academic.oup.com/nar/article/49/10/5684/6270805
- Tsai WH. Moment-preserving thresolding: a new approach. Comput Vision, Graph Image Process. 1985;29(3):377–393. doi: 10.1016/0734-189X(85)90133-1
- Wild P, Farhan H, McEwan DG, et al. Phosphorylation of the autophagy receptor optineurin restricts Salmonella growth. Science. 2011;333(6039):228–233. InternetAvailable from: doi: 10.1016/0734-189X(85)90133-1
- Skarnes WC, Rosen B, West AP, et al. A conditional knockout resource for the genome-wide study of mouse gene function. Nature. 2011;474(7351):337–342. InternetAvailable from. doi: 10.1038/nature10163
- Chew TS, O’Shea NR, Sewell GW, et al. Optineurin deficiency in mice contributes to impaired cytokine secretion and neutrophil recruitment in bacteria-driven colitis. Dis Model Mech. 2015;8:817–829. InternetAvailable from: doi: 10.1242/dmm.020362
- Heuser M, Argiropoulos B, Kuchenbauer F, et al. MN1 overexpression induces acute myeloid leukemia in mice and predicts ATRA resistance in patients with AML. Blood. 2007;110(5):1639–1647. doi: 10.1182/blood-2007-03-080523
- Wai T, Langer T. Mitochondrial dynamics and metabolic regulation. Trends Endocrinol Metab. 2016;27:105–117. InternetAvailable from. doi: 10.1016/j.tem.2015.12.001
- Twig G, Elorza A, Molina AJA, et al. Fission and selective fusion govern mitochondrial segregation and elimination by autophagy. Embo J. 2008;27(2):433–446. doi: 10.1038/sj.emboj.7601963
- Georgakopoulos ND, Wells G, Campanella M. The pharmacological regulation of cellular mitophagy. Nat Chem Biol. 2017;13(2):136–146. doi: 10.1038/nchembio.2287 InternetAvailable from.
- The Cancer Genome Atlas Research Network . Genomic and epigenomic landscapes of adult de novo acute myeloid Leukemia. N Engl J Med. 2013;368(22):2059–2074. doi: 10.1056/NEJMoa1301689
- Rodrigues T, Ferraz LS. Therapeutic potential of targeting mitochondrial dynamics in cancer. Biochem Pharmacol. 2020;182:114282. InternetAvailable from. doi: 10.1016/j.bcp.2020.114282
- Morita K, Hama Y, Izume T, et al. Genome-wide CRISPR screen identifies TMEM41B as a gene required for autophagosome formation. J Cell Bio. 2018;217(11):3817–3828. doi: 10.1083/jcb.201804132
- Heo JM, Harper NJ, Paulo JA, et al. Integrated proteogenetic analysis reveals the landscape of a mitochondrial-autophagosome synapse during PARK2-dependent mitophagy. Sci Adv. 2019;5(11): doi: 10.1126/sciadv.aay4624
- Hoshino A, Wang WJ, Wada S, et al. The ADP/ATP translocase drives mitophagy independent of nucleotide exchange. Nature. 2019;575(7782):375–379. doi: 10.1038/s41586-019-1667-4
- van Humbeeck C, Cornelissen T, Hofkens H, et al. Parkin interacts with ambra1 to induce mitophagy. J Neurosci. 2011;31(28):10249–10261. doi: 10.1523/JNEUROSCI.1917-11.2011
- Chu CT, Ji J, Dagda RK, et al. Cardiolipin externalization to the outer mitochondrial membrane acts as an elimination signal for mitophagy in neuronal cells. Nat Cell Biol. 2013;15(10):1197–1205 doi: 10.1038/ncb2837. InternetAvailable from:
- Princely Abudu Y, Pankiv S, Mathai BJ, et al. NIPSNAP1 and NIPSNAP2 act as “Eat Me” sgnals for mitophagy. Dev Cell. 2019;49(4):509–525.e12. doi: 10.1016/j.devcel.2019.03.013
- Moore AS, Holzbaur ELF. Dynamic recruitment and activation of ALS-associated TBK1 with its target optineurin are required for efficient mitophagy. Proc Natl Acad Sci. 2016;113(24):E3349–E3358. InternetAvailable from. doi: 10.1073/pnas.1523810113
- Qiu Y, Wang J, Li H, et al. Emerging views of OPTN (optineurin) function in the autophagic process associated with disease. Autophagy. 2021;18(1):73–85. InternetAvailable from. doi: 10.1080/15548627.2021.1908722
- Bansal M, Moharir SC, Sailasree SP, et al. Optineurin promotes autophagosome formation by recruiting the autophagy-related Atg12-5-16L1 complex to phagophores containing the Wipi2 protein. J Biol Chem. 2018;293(1):132–147. doi: 10.1074/jbc.M117.801944
- Chen K, Dai H, Yuan J, et al. Optineurin-mediated mitophagy protects renal tubular epithelial cells against accelerated senescence in diabetic nephropathy article. Cell Death Dis. 2018;9(2):1–18. InternetAvailable from. doi: 10.1038/s41419-017-0127-z
- Heo JM, Ordureau A, Paulo JA, et al. The PINK1-PARKIN mitochondrial ubiquitylation pathway drives a program of OPTN/NDP52 recruitment and TBK1 activation to promote mitophagy. Mol Cell. 2015;60(1):7–20. InternetAvailable from. doi: 10.1016/j.molcel.2015.08.016
- Sumitomo Y, Koya J, Nakazaki K, et al. Cytoprotective autophagy maintains leukemia-initiating cells in murine myeloid leukemia. Blood. 2016;128(12):1614–1624. doi: 10.1182/blood-2015-12-684696
- Qu X, Yu J, Bhagat G, et al. Promotion of tumorigenesis by heterozygous disruption of the beclin 1 autophagy gene. J Clin Invest. 2003;112(12):1809–1820. doi: 10.1172/JCI20039
- Panina SB, Pei J, Kirienko NV. Mitochondrial metabolism as a target for acute myeloid leukemia treatment. Cancer Metab. 2021;9(1):1–25. doi: 10.1186/s40170-021-00253-w
- Ryan TA, Tumbarello DA. Optineurin: a coordinator of membrane-associated cargo trafficking and autophagy. Front Immunol. 2018;9:1–16. InternetAvailable from: doi: 10.3389/fimmu.2018.01024/full
- Liu Z, Chen P, Gao H, et al. Ubiquitylation of autophagy receptor optineurin by HACE1 activates selective autophagy for tumor suppression. Cancer Cell. 2014;26(1):106–120. doi: 10.1016/j.ccr.2014.05.015
- Rodrigo R, Mendis N, Ibrahim M, et al. Knockdown of BNIP3L or SQSTM1 alters cellular response to mitochondria target drugs. Autophagy. 2019;15(5):900–907. InternetAvailable from. doi: 10.1080/15548627.2018.1558002
- Li Y, Li Y, Yin J, et al. A mitophagy inhibitor targeting p62 attenuates the leukemia-initiation potential of acute myeloid leukemia cells. Cancer Lett [InternetAvailable from]. 2021;510:24–36. doi: 10.1016/j.canlet.2021.04.003
- Palikaras K, Lionaki E, Tavernarakis N. Balancing mitochondrial biogenesis and mitophagy to maintain energy metabolism homeostasis. Cell Death Differ. 2015;22(9):1399–1401. doi: 10.1038/cdd.2015.86
- Ito K, Turcotte R, Cui J, et al. Self-renewal of a purified Tie2 + hematopoietic stem cell population relies on mitochondrial clearance. Science. 2016;354(6316):1156–1160. doi: 10.1126/science.aaf5530
- Sriskanthadevan S, Jeyaraju DV, Chung TE, et al. AML cells have low spare reserve capacity in their respiratory chain that renders them susceptible to oxidative metabolic stress. Blood. 2015;125(13):2120–2130. doi: 10.1182/blood-2014-08-594408
- Slowicka K, Vereecke L, van Loo G. Cellular functions of Optineurin in health and disease. Trends Immunol. 2016;37:621–633. InternetAvailable from. doi: 10.1016/j.it.2016.07.002
- Rezaie T, Child A, Hitchings R, et al. Adult-onset primary open-angle glaucoma caused by mutations in optineurin. Science. 2002;295(5557):1077–1079. doi: 10.1126/science.1066901
- Sperling AS, Gibson CJ, Ebert BL. The genetics of myelodysplastic syndrome: from clonal hematopoiesis to secondary leukemia. Nat Rev Cancer. 2017;17(1):5–19. doi: 10.1038/nrc.2016.112
- Aoyagi Y, Hayashi Y, Harada Y, et al. Mitochondrial fragmentation triggers ineffective hematopoiesis in myelodysplastic syndromes. Cancer Discov. 2022;12(1):250–269. InternetAvailable from: https://aacrjournals.org/cancerdiscovery/article/12/1/250/675593/Mitochondrial-Fragmentation-Triggers-Ineffective
- Teramachi J, Myint KZY, Feng R, et al. Blocking the ZZ domain of sequestosome 1/p62 suppress the enhancement of myeloma cell growth and osteoclast formation by marrow stromal cells. Blood. 2011;118(21):888–888. InternetAvailable from. doi: 10.1182/blood.V118.21.888.888
- Silbermann R, Zhou D, Teramachi J, et al. The p62-ZZ domain inhibitor XRK3F2 alters myeloma-induced suppression of osteoblast differentiation and is highly cytotoxic to myeloma cells in combination with Bortezomib. Blood. 2014;124(21):2083–2083. InternetAvailable from. doi: 10.1182/blood.V124.21.2083.2083
- Zhang L, Fang Y, Cheng X, et al. Interaction between TRPML1 and p62 in regulating autophagosome-lysosome fusion and impeding neuroaxonal dystrophy in Alzheimer’s disease. In: Lloret A, editor. Oxid med cell longev; 2022. p. 1–20. Available from: https://www.hindawi.com/journals/omcl/2022/8096009/
- Dai W, Wang G, Chwa J, et al. Mitochondrial division inhibitor (mdivi-1) decreases oxidative metabolism in cancer. Br J Cancer. 2020;122(9):1288–1297. InternetAvailable from. doi: 10.1038/s41416-020-0778-x
- Peiris-Pagès M, Bonuccelli G, Sotgia F, et al. Mitochondrial fission as a driver of stemness in tumor cells: mDIVI1 inhibits mitochondrial function, cell migration and cancer stem cell (CSC) signalling. Oncotarget. 2018;9(17):13254–13275. doi: 10.18632/oncotarget.24285
- Wegner M, Diehl V, Bittl V, et al. Circular synthesized CRISPR/Cas gRnas for functional interrogations in the coding and noncoding genome. Elife. 2019;8:1–31. doi: 10.7554/eLife.42549
- Li W, Xu H, Xiao T, et al. MAGeCK enables robust identification of essential genes from genome-scale CRISPR/Cas9 knockout screens. Genome Biol. 2014;15(12):554. doi: 10.1186/s13059-014-0554-4
- Najm FJ, Strand C, Donovan KF, et al. Orthologous CRISPR–Cas9 enzymes for combinatorial genetic screens. Nat Biotechnol. 2018;36(2):179–189. InternetAvailable from. doi: 10.1038/nbt.4048
- Baker F, Polat IH, Abou‐el‐Ardat K, et al. Metabolic rewiring is essential for AML cell survival to overcome autophagy inhibition by loss of ATG3. Cancers (Basel). 2021;13(23):1–19. doi: 10.3390/cancers13236142