
ABSTRACT
Despite the great advances in macroautophagy/autophagy research in the last years, the in vivo role of the different members of the four mammalian orthologs of yeast Atg4 protease (ATG4A-D) remain unclear. To gain further insights into the functional relevance of Atg4 orthologs, we have generated mutant mice deficient in Atg4c. These mice are viable and fertile, and do not display any obvious abnormalities, indicating that they are able to develop the autophagic response required during the early neonatal period. However, they show tissue-specific autophagy alterations, including reduced autophagic flux in diaphragm and show decreased breathing and locomotor activity after fasting. In addition, atg4c-/- mice show reduced number of circulating T and B lymphocytes, which is associated with accumulation of apoptotic cells in the spleen and an increased susceptibility to develop chemically-induced fibrosarcomas. Moreover, through the analysis of cells and mice simultaneously deficient for ATG4C and ATG4D proteases we also reveal a role for ATG4C in mATG8 proteins delipidation.
Abbreviations
ATG4 (autophagy related 4 cysteine peptidase); ATG4A (autophagy related 4A cysteine peptidase); ATG4B (autophagy related 4B cysteine peptidase); ATG4C (autophagy related 4C cysteine peptidase); ATG4D (autophagy related 4D cysteine peptidase); Atg8 (autophagy related 8); GABARAP (GABA type A receptor-associated protein); GABARAPL1(GABA type A receptor-associated protein like 1); GABARAPL2 (GABA type A receptor-associated protein like 2); MAP1LC3A/LC3A (microtubule associated protein 1 light chain 3 alpha); MAP1LC3B/LC3B (microtubule associated protein 1 light chain 3 beta); mATG8 (mammalian Atg8); PE (phosphatidylethanolamine); PS (phosphatydylserine); SQSTM1/p62 (sequestosome 1).
Introduction
The importance of autophagy for the maintenance of cell and organismal homeostasis, as well as a major catabolic process has become evident in the last two decades. First described in yeast as a pro-survival response triggered by starvation, autophagy has been linked to several pathologies such as cancer, inflammation and aging [Citation1–3]. Currently, more than 40 genes are known to be involved in autophagy in mammalian cells, in which this process has gained complexity through evolution [Citation4]. In yeast, one of the essential components for the elongation and expansion of nascent autophagosomes is the Atg8 ubiquitin-like conjugation system, in which the cytoplasmic protein Atg8 (autophagy related 8) must be activated upon cleavage of a Gly residue by the cysteine proteinase Atg4 (autophagy related 4) [Citation5]. This enables Atg8 conjugation with a molecule of phosphatidylethanolamine (PE) or phosphatydylserine (PS) in autophagic and autophagy-related membranes, which allows autophagosomes formation, closure and maturation. Once Atg8 is not further required at the autophagosomal membranes, Atg4 is also responsible for its delipidation, allowing its reincorporation into newly formed autophagic structures.
Several mammalian autophagy genes, as ATG3 (autophagy related 3), ATG5, ATG7, AMBRA1 (autophagy and beclin 1 regulator 1) or RB1CC1/FIP200 (RB1 inducible coiled-coil 1), among others, operate in non-redundant way in central hubs of the autophagic pathway [Citation6]. By contrast to the former cases, mammals possess several orthologs of yeast Atg4 protease that together form the ATG4 protein family, composed of ATG4A (autophagy related 4A cysteine peptidase), ATG4B, ATG4C and ATG4D [Citation7]. The Atg8 ubiquitin-like conjugation system has also gained complexity throughout evolution. In fact, several Atg8 orthologs (mATG8s) have been described in mammals, organized in two different subfamilies named as MAP1LC3/LC3 and GABARAP, which in mice are composed of LC3A (microtubule associated protein 1 light chain 3 alpha), LC3B, GABARAP (gamma-aminobutyric acid receptor associated protein), GABARAPL1 (gamma-aminobutyric acid (GABA) A receptor-associated protein-like 1) and GABARAPL2, with additional LC3 proteins in humans, LC3B2 and LC3C [Citation8]. The finding that the above-mentioned ubiquitin-like system is composed of four proteinases that may target at least six distinct substrates in mammals [Citation9–11] contrasts with the simplified yeast system involving a single proteinase with a specific substrate, and indicates that this conjugation system has evolved to acquire a larger complexity during eukaryote evolution. Several works have shed some light on the involvement of mammalian ATG4s in the C-terminal processing and membrane-deconjugation of mATG8 proteins [Citation11–13]. However, to date, the in vivo roles of this family of cysteine proteinases remains to be fully characterized. Similarly, it is unclear if the complexity of mammalian ATG4s and their substrates simply derives from functional redundancy in this system, as described for other protease families [Citation14,Citation15] or, by contrast, it corresponds to a different scenario in which some components of this proteolytic system have evolved to accomplish other functions distinct from autophagy.
In an attempt for understanding the precise physiological functions of this family of proteases, we have previously generated and studied mutant mice deficient for ATG4B [Citation16]. The analysis of atg4b-/- mice has shown that this protease is the main responsible for the initial proteolytical activation of mammalian ATG8s in vivo. Thus, disruption of Atg4b gene in mice leads to a reduced cellular content of autophagic structures and increased SQSTM1/p62 (sequestosome 1) accumulation due to reduced availability of activated mATG8 proteins. Ultimately, these alterations result in a marked balance disorder, impaired intestinal homeostasis linked to Paneth cell abnormalities, and also to higher susceptibility to obesity-related disorders, among other features [Citation16–19]. Recently, we have also generated mice deficient for Atg4d [Citation20]. Characterization of these mice has revealed that ATG4D protease is the main delipidating enzyme for mATG8 proteins in mammalian cells and protects against cerebellar neurodegeneration [Citation20].
In this work, we report the generation and phenotype analysis mice deficient in Atg4c. We show that these mice exhibit tissue-specific alterations in LC3A and LC3B lipidation and also an impairment of autophagic flux in diaphragm tissue in response to fasting, which is linked to decreased locomotor activity and respiration after prologued fasting. Moreover, Atg4c deficiency also leads to a reduced number of circulating T- and B-cells, which is associated with a higher incidence of splenic apoptosis. Studies of cancer susceptibility in these mutant mice also show that Atg4c deficiency leads to increased propensity to develop chemically-induced fibrosarcomas, which show reduced lymphoid infiltration. Finally, through the analysis of mice simultaneously deficient for Atg4b Atg4c and Atg4c Atg4d, we show that ATG4C contributes to mATG8 proteins delipidation in the absence of ATG4D.
Results
Generation of atg4c-deficient mice
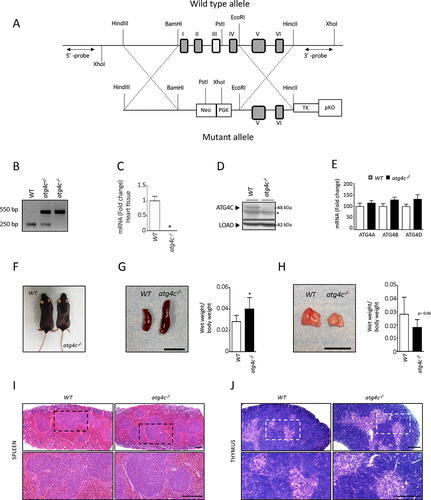
To analyze the in vivo role for ATG4C, we generated mice with a targeted mutation in Atg4c gene through a homologous recombination strategy (). Heterozygous mice from the F1 generation were identified by PCR analysis and then crossed to obtain atg4c-/- mice (). Real time-PCR analysis of total RNA from diverse tissues of wild-type and knockout animals showed Atg4c transcript absence in atg4c-/- mice (). The absence of ATG4C protein was also assessed by immunoblotting analyses () confirming the generation of an atg4c-null allele. Interestingly, real time qPCR analyses revealed no significant compensatory increase in the mRNA expression of Atg4a, Atg4b and Atg4d genes in the absence of Atg4c (). Despite ATG4C deficiency, atg4c-null mice had normal embryonic development and reached adulthood, with males and females being fertile (). This suggests that ATG4C protein is not required for the induction of the requested levels of autophagy essential for neonate mice viability, as reported for most autophagy-deficient mice that result in perinatal or embryonic lethality [Citation21]. Moreover, atg4c-/- mice showed no alterations in their levels of circulating amino-acids when compared to age-matched WT mice (Figure S1A-B). Anatomical analyses of tissues from adult atg4c-/- animals revealed no observable alterations, with the exception of increased spleen size and a tendency to show reduced thymus weight/body weight ratio (1 G and S1). Despite the abnormal size of these organs, histological examination of thymi and spleens from mutant mice revealed no structural alterations when compared to those from age-matched WT animals. Spleen anatomy is well preserved in atg4c-/- animals, with red and white pulps showing a normal distribution with an evident marginal layer at the periphery of the small white nodules of lymphatic tissue (). Similarly, thymic architecture is well-preserved in atg4c-deficient mice, being medullary and cortical zones well distinguished and the amount of epithelioreticular cells comparable to those found in sections from WT animals (). Taken together, these data demonstrate that ATG4C is mostly dispensable for embryonic and adult mouse development as well as for normal growth and fertility.
Figure 1. Generation and characterization of atg4c-deficient mice. (A) Up, schematic representation of the WT Atg4c locus, with coding exons represented as numbered boxes. Bottom, schematic representation of the mutant allele, showing the insertion of a PGK-Neo cassette between 1 and exon 4, disrupting the transcription of the gene. (B) PCR analysis of genomic DNA from WT, heterozygous and atg4c-null mice. (C) Real-time PCR analysis of RNA of heart tissue from control and atg4c-/-animals showing the absence of full-length Atg4c mRNA expression in knockout mice. (D) Representative immunoblots of ATG4C protein in extracts of brain tissue from control and atg4c-/-animals showing the absence of the protein in mutant mice. (E) Real time PCR analysis of RNA of liver tissue from control and atg4c-/- animals showing the compensation of each ATG4 at the level of mRNA expression in knockout mice. (F) Representative images of wild-type and atg4c-/- mice. (G) Left, representative images of spleens from WT and mutant mice. Right, quantification of the data. (H) Left, representative images of thymus from WT and mutant mice. Right, quantification of the data. Scale bars: 1 cm. Bars represent means ± SEM. (C) and (E), n = 6 mice per genotype. G and H, n = 8 mice per genotype. *P < 0.05, 2-tailed unpaired student’s t test. (I-J) Representative light microscopy images of H&E-stained spleens (I) and thymi (F) from WT and mutant mice. n = 4 mice per genotype. Spleens; scale bar: 100 μm. Thymus; scale bar: 200 μm.
Autophagy flux analysis in the absence of ATG4C
To evaluate the consequences of ATG4C loss in the process of autophagy, we first focused on mATG8 proteins, the physiological substrates for ATG4 proteases in mammalian cells. These proteins are organized in two different subfamilies, namely LC3 and GABARAP, which in mice are composed by LC3A, LC3B, GABARAP, GABARAPL1 and GABARAPL2. All mATG8 proteins are synthesized as inactive pro-forms that must be proteolytically activated by ATG4 proteases, in order to be conjugated to a molecule of PE or PS in autophagic and autophagy-related membranes. The membrane-bound forms (mATG8s-II) can be distinguished from the cytosolic ATG4-processed forms (mATG8s-I) by immunoblotting, due to their different electrophoretic mobility in SDS-PAGE [Citation22]. The unprocessed forms (pro-mATG8s) may show similar (LC3s) or different (GABARAPs) electrophoretic mobility than the mATG8-I forms. Once activated, mATG8s proteins can remain at the cytosol (mATG8s-I) or be conjugated to autophagosomal membranes (mATG8s-II). Due to the degradative nature of the autophagic process, lysosomal inhibitors have to be used to measure the precise amount of mATG8s-II incorporated to autophagosomal membranes in a determined period. This strategy focused on measuring autophagic flux [Citation23] is considered an accurate method to measure autophagic activity [Citation24]. Thus, we first performed bafilomycin A1-based autophagic flux experiments in murine embryonic fibroblasts (MEFs) extracted from atg4c-/- and WT mice. As shown in and S3, immunoblotting analyses of mATG8 proteins revealed no significant differences in the amount of membrane-bound forms of any of the mATG8 proteins in any of the conditions analyzed. Moreover, SQSTM1/p62 levels were also comparable in all the conditions analyzed, suggesting that autophagy-dependent SQSTM1/p62 degradation was not altered due to ATG4C loss in MEFs. Consistently, quantitative immunofluorescence analyses with cultured MEFs showed that the number of positive puncta for all LC3 and GABARAPs was comparable between WT and atg4c KO MEFs either in control or upon nutrient deprivation (). Accordingly, analysis of radio-labeled long-lived proteins degradation showed comparable levels of starvation-induced lysosomal-dependent proteolysis between WT and atg4c-deficient cells (). Thus, no major alterations in autophagy dynamics are derived from ATG4C loss in MEFs when cultured in vitro. To extend these analyses and check for any possible tissue-specific effect of ATG4C loss, we performed leupeptin-based in vivo autophagic flux analyses [Citation25] in a wide variety of mouse tissues (diaphragm, brain, spleen, heart, skeletal muscle, liver, thymus, lung and kidney) from either ad libitum-fed or 24-h-starved animals (, S2 and S3). As shown in , we could observe some tissue-specific alterations in the status of mATG8 proteins in atg4c-/- mice samples, which were restricted to diaphragm, brain and spleen. Specifically, the amount of membrane-bound forms of LC3A and LC3B proteins was reduced in diaphragm tissue extracts from atg4c-/- mice after 24 h starvation, either in the absence or presence of leupeptin (, and S3B). By contrast, increased levels of lipidated LC3A and LC3B were observed in brain extracts from mutant mice after 24 h of fasting, both in the absence and presence of leupeptin ( and S3C). In spleen tissue, total levels of LC3s proteins were higher in mutant mice protein extracts, being both cytosolic and membrane-bound forms of these proteins higher, either in control conditions or upon 24 h of fasting ( and S3D). For the rest of the tissues analyzed (liver, kidney, heart, skeletal muscle, thymus and lungs) the total levels or lipidation status of mATG8 proteins was comparable between WT and atg4c-/- mice in all of the conditions analyzed (, S2 and S5E-J). Moreover, the levels of SQSTM1/p62 (a specific autophagy substrate whose levels are inversely related with autophagic activity) in spleen and diaphragm tissues were increased in atg4c-/- mice both in fed mice or after 24 h of starvation, although our results for this protein showed some degree of intersample variability. In this regard, it has to be considered that although stimuli able to activate autophagy rapidly induce SQSTM1/p62 degradation, a continued autophagy activation (such as prolonged fasting) may lead to a restoration of SQSTM1/p62 expression levels in a tissue-dependent fashion, hence complicating data interpretation [Citation26]. Finally, it is worth to mention that the loss of ATG4C did not lead to any significant alteration in the protein levels of ATG4A, ATG4B or ATG4D in the tissues analyzed in this experiment, neither at control conditions nor upon 24 h of fasting, with the exception of ATG4D, whose levels were slightly higher in the diaphragms of mutant mice, although again a high degree of intersample variability was observed (Figure S4A-F).
Figure 2. Autophagy flux analysis in atg4c-/- MEFs. (A) Representative immunoblots against mATG8 proteins in WT and atg4c-/- MEFs. β-actin was used as sample processing controls. Torin1 was used as autophagy inducer and BafA1 was used to inhibit lysosomal degradation of mATG8-membrane bound forms. (B) Representative immunofluorescence images of endogenous mAtg8s in WT and knockout MEFs. Cells were cultured in full medium as a control, torin1 and BafA1 were used in the same conditions that in western blot analysis. Scale bars: 10 µm. (C) Quantification of the data shown in (B). Bars represent means ± SEM. N > 85 cells per genotype and condition. *P < 0.05, 2-tailed unpaired student’s t test. (D) Left, long-lived protein degradation rates were determined in WT and atg4c-/- MEFs cultured in nutrient-rich, complete medium (CM) plus vehicle control (CM+DMSO) or exposed to amino acid starvation (EBSS) for 4 h in the absence or presence of BafA1. Bars represent means ± SEM (N = 3 independent experiments). Right, BafA1-sensitive degradation of long-lived proteins in WT and atg4c-/- MEFs exposed to amino acid starvation for 4 h. The BafA1-sensitive degradation rates (indicating lysosomal LLPD) were calculated by subtracting the degradation rate measured in BafA1-treated cells, from that measured in DMSO vehicle control-treated cells. Bars represent means ± SEM (N = 3 independent experiments). *P < 0.05, 2-tailed paired student’s t test.
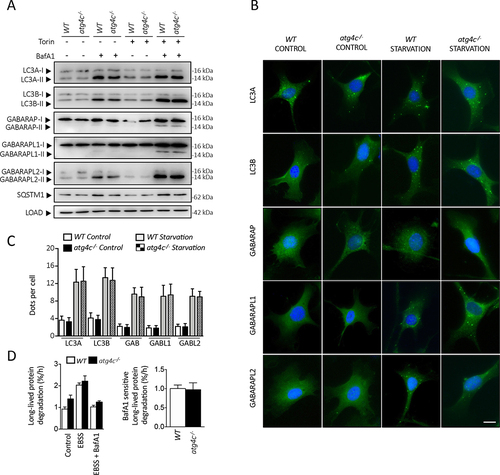
Figure 3. Autophagy flux analysis in atg4c-/- mice. Immunoblotting analyses against mATG8 proteins in diaphragm (A), brain (B), spleen (C), heart (D), skeletal muscle (E) and liver (F) tissue extracts from WT and atg4c-/- mice either under fed ad libitum or after 24 h of fasting, in the presence or absence of leupeptin. ACTB/β-actin was used as sample processing controls. N = 3 mice per genotype and condition.
Together, these results show that ATG4C loss leads to alterations in the lipidation status of some mATG8 proteins in a tissue-specific fashion, mainly affecting the degree of LC3 proteins lipidation in tissues such as diaphragm, brain and spleen.
atg4c−/− mice show reduced locomotor activity and fail to increase their respiration rate after fasting
In the course of the different starvation treatments performed to induce autophagy, we could observe a reduced resistance to prolonged starvation in mice deficient in ATG4C as compared with wild-type animals. In fact, mutant mice showed a less healthy appearance and a reduced mobility than wild-type animals subjected to the same conditions. Thus, we decided to characterize locomotor activity, oxygen consumption, CO2 production, energy expenditure and respiratory exchange ratio (RER) of atg4c-/- mice when fed ad libitum and after 24 h of fasting. Interestingly, fasting induced an increase in O2 consumption, CO2 production, energy expenditure and locomotor activity in WT mice, but not in atg4c-/- mice (). Consistently, fasting increased respiratory rate in WT mice, but it failed to do so in mutant animals, as shown by pletismography analyses (). All these differences were restricted to fasted animals, as WT and atg4c-deficient mice showed comparable values of O2 consumption, CO2 production, energy expenditure, locomotor activity, respiratory rate, inspiratory/expiratory times, minute ventilation or tidal volume when fed ad libitum (Figure S5A-H). Given these results, and the pivotal role of diaphragm muscle in respiration, we speculated that the reduction in autophagic flux that atg4c-/- mice show in this tissue could impact diaphragm performance upon fasting. Given that autophagy is required to maintain ATP production in starved cells [Citation27], we hypothesized that the energy balance in this tissue could be compromised in mutant mice after fasting. In this regard, diaphragmatic endurance is determined by the balance between energy supply and demand [Citation28]. Thus, we analyzed the activity of AMP-activated protein kinase (AMPK), a major sensor of cellular energy status [Citation29]. As shown in , atg4c-/- mice show increased phosphorylation and total levels of AMPK in diaphragm, which likely derives from a reduced ATP availability. Moreover, when diaphragm muscle fiber composition was analyzed, we found a shift toward slower fiber types, with a significant increase in the percentage of type I fibers, together with a reduction of fast type IIb fibers (). Additionally, we found that the average cross-sectional area (CSA) of diaphragm muscle fibers was significantly higher in atg4c-/- mice than in their age-matched WT littermates (). This increased percentage of slow-twitch fibers could be an adaptation to reduced energy supply, as slow-twitch fibers have a reduced capacity for power output and show a lower energy consumption than fast fibers [Citation30]. Interestingly, a shift toward slow-twitch fibers has been observed in human patients suffering from chronic obstructive pulmonary disease and also in murine models of muscular distrophy, as an adaptation to reduced energy supply [Citation31,Citation32]. Furthermore, an increase in diaphragm fibers CSA has been documented in murine models of muscular dystrophy [Citation33].
Figure 5. Analysis of diaphragm alterations in atg4c-deficient mice. (A) Left, quantification of respiratory frequency in fed and fasted WT and atg4c-null mice. Right, effect of fasting in ventilation rate as measured as % of the average values when mice are fed ad libitum (A). N = 7 WT and 6 atg4c-/- mice (B) Immunoblotting analyses against PRKAA/AMPK protein in diaphragm tissue extracts from WT and atg4c-/- mice either fed ad libitum and upon 24 h of fasting. (C) Densitometry of immunoblots in . Bars represent means ± SEM. (N = 3 mice per genotype and condition). *P < 0.05, 2-tailed unpaired Student’s t-test. (D) Representative images of ATPase-stained diaphragm sections. Serial sections of the diaphragm from a WT and atg4c-/- mice are shown. For ATPase activity, after a pre-incubation at pH 4.6, type I fibers stain dark (*), type IIa fibers stain intermediate (#) and type IIb fibers stain pale (&). (E) Quantification of data shown in (C). The distribution and cross-sectional area (μm2) of individual fiber types were determined for ~ 100 fibers per transverse section of diaphragm from all animals in each group (n = 3 per group). Scale bars: 100 µm. p-values were determined by unpaired student´s t-test, *p < 0.05.
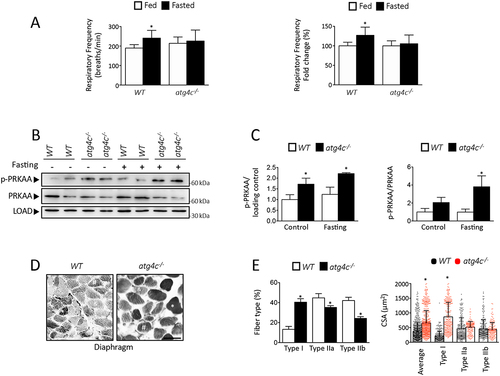
Figure 4. Analysis of locomotor activity, respiration and energy expenditure in WT and atg4c-deficient mice. (A). Left, locomotor activity in fed WT and atg4c-null mice during light phase (day) and dark phase (night). Right, graph depicting the area under the curves of locomotor activity chart in each genotype. (B) Equivalent analyses than in (A) after 24 h of fasting, during dark phase. (C) Graph depicting the area under the curves of locomotor activity chart in each genotype during light phase upon fed and fasted regimen. D-E) Analyses of O2 consumption (mL/Kg/h) for the conditions shown in (A and B). (F) Graph depicting the area under the curves of O2 consumption in each genotype during light phase upon fed and fasted regimen. (G and H) Analyses of CO2 production (mL/Kg/h) for the conditions shown in (A and B). (I) Graph depicting the area under the curves of CO2 consumption in each genotype during light phase upon fed and fasted regimen. (J and K) Analyses of energy expenditure (Kcal/Kg/h) for the conditions shown in (A and B). (L) Graph depicting the area under the curves of energy expenditure in each genotype during light phase upon fed and fasting conditions. (M and N) Analyses of respiratory exchange ratio (RER) for the conditions shown in (A and B). O) Graph depicting the area under the curves of RER in each genotype during light phase upon fed and fasted regimen. Data represent mean ± SEM. *p < 0.05. n = 8 WT and 7 mutant mice upon fed regimen and n = 6 mice per genotype upon fasted regimen.
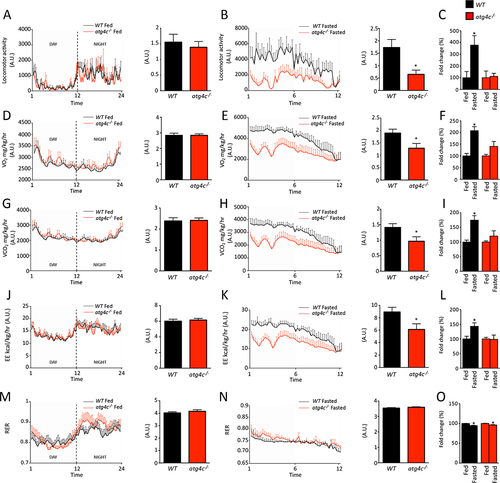
Thus, it is possible that the observed autophagy alterations in diaphragms of atg4c-/- mice would reduce energy supply for this tissue, which in turn would limit their ability to adapt to demanding situations such as prolonged fasting, thus affecting both respiratory and locomotor activities.
atg4c−/− mice show altered lymphocyte populations
To further characterize the consequences of ATG4C loss, we decided to perform an exhaustive analysis of publicly available expression datasets to check for the differential expression of the four ATG4 genes to extend our analyses to possible additional tissues/cellular types with high ATG4C expression. In this regard, it is noteworthy that the expression of ATG4C in most tissues is very low when compared to that of other ATG4 genes, especially ATG4B and ATG4D (). However, we could observe that the highest ATG4C expression occurs in white blood cells (), being the most expressed ATG4 gene in B-lymphocytes, dendritic cells and basophils (). This prompted us to perform hematologic analyses in order to characterize the abundance of different blood cell populations in age-matched WT and atg4c-deficient mice. As shown in , the count of red blood cells, granulocytes and platelets was comparable between WT and atg4c-/- mice, although mutant mice showed a reduced total number of circulating lymphocytes. When specifically assessed by means of flow cytometry, we could observe a significant reduction of B-lymphocytes, NK-cells and cytotoxic T lymphocytes populations in blood samples from atg4c-/- mice, whereas the number of non-cytotoxic T cells was comparable between WT and knockout mice (). Despite these differences, we could not find any alteration in the status of basal or starvation-induced autophagy (as measured by immunofluorescence against all mATG8 proteins and SQSTM1/p62) in purified lymphocytes from age-matched WT and atg4c-/- mice, either in control conditions or upon starvation (). Consistently, we could not find any difference in the lipidation status of any mATG8 proteins in thymus, as measured by immunoblotting analyses (Figure S4A and S5G). Moreover, the number of subcellular structures positive for mATG8 proteins in thymocytes was comparable between age-matched WT and atg4c-/- mice (Figure S5I), as was the number of apoptotic TUNEL+ thymocytes (Figure S5J). Interestingly, we could observe a higher number of cellular structures positive for either LC3A or LC3B (likely autophagosomes) in mutant mice spleens, as measured by immunofluorescence analyses (), which is in agreement with our immunoblotting results showing increased levels of lipidated LC3 proteins in spleen extracts of atg4c-/- mice (). Additionally, atg4c-/- mice showed an increase in the number of apoptotic TUNEL+ cells in the spleen (), which could contribute to explain the observed reduction in the number of circulating lymphocytes in these animals. It is possible that the increased number of positive structures for LC3 proteins and their increased lipidation in knockout mice spleens could be signs of increased apoptosis, given that autophagy induction usually precedes (and sometimes prevents) this type of cell death [Citation34,Citation35]. However, it could also be possible that additional factors, such as the existence of autophagy-unrelated functions of ATG4C, could explain the increased splenic apoptosis and reduced lymphocyte count of atg4c-/- mice. Irrespectively of these mechanistic considerations, the reduced lymphocyte count of atg4c-deficient mice might contribute to explain their increased susceptibility to chemically-induced carcinogenesis. In fact, upon injection of the carcinogen MCA, which promotes the transformation of mesenchymal fibroblasts into fibrosarcomas and induces the appearance of infiltrating tumor-specific T cells [Citation36–39], atg4c-/- mice showed an increased tumor incidence, and with tumors from mutant mice being significantly larger (). Interestingly, atg4c-deficient tumors showed reduced immune T-cell infiltration, as revealed by anti-CD3 immunohistochemistry (). Histological analyses of fibrosarcomas revealed that atg4c-/- tumors showed a poorly defined border with dermis, intratumoral edema and reduced extracellular matrix, which was predominantly amorphous and rich in acid mucopolysaccharides, as revealed by Gomori staining (). By contrast, fibrosarcomas from WT mice showed a well-defined border with the dermis, with collagen-rich stroma inside the tumor region closest to its border ().
Figure 6. atg4c−/- mice show alterations in lymphocyte populations. (A and B) Analysis of the expression of each ATG4 in different tissues (A) an in several white cells subpopulations (B) from human samples. Data obtained from https://www.proteinatlas.org. (C) Cell counts of peripheral blood from WT and atg4c-/- mice. Gra, granulocytes; Lym, lymphocyte; Plt, platelet; RBC, red blood cells. N = 8 mice per genotype. Bars represent means ± SEM. (D) Representative FACs analyses of CD19 and CD3 expression in peripheral blood cells from WT and mutant mice. (E) Quantification of CD19+, NK+, CD3+ and CD8+ and CD3− and CD8− subpopulations in blood from WT and atg4c-deficient mice. N = 6 per genotype. Bars represent means ± SEM. (F) Representative images of immunofluorescence analysis of endogenous mATG8 proteins in lymphocytes subpopulation from WT and atg4c-/- mice upon the indicated conditions. Scale bars: 8 μm. (G) Quantification of the data shown in (F). Bars represent means ± SEM. N > 85 cells per genotype and condition. (H) Representative images of immunofluorescence against the endogenous mATG8 proteins in spleen sections from WT and atg4c-/- mice. Scale bars: 10 µm (I) Quantification of the data shown in H. Bars represent means ± SEM. N = 4 mice per genotype. (J) Left, representative images of TUNEL assay in spleen sections from WT and atg4c-/- mice. Right, quantification of the positive nuclei for TUNEL assay per tissue area in WT and atg4c-/- mice. Bars represent means ± SEM. N = 6 mice per genotype. (K) Left, percentage of mice with tumors upon MCA administration. N = 8 mice per genotype. Right, quantification of tumor size from WT and atg4c-/- mice. (L) Left, representative images of immunohistochemistry against CD3 in tumors generated after MCA injection. Scale bars: 200 µm. Right, quantification of the data. Bars represent means ± SEM. N = 4 mice per genotype. (M) Up, representative images of H&E-stained tumor sections from WT and atg4c-/- tumors. Scale bars: 400 µm. Bottom, representative images of gomori-stained tissue sections from WT and atg4c-/-tumors. Scale bars: 400 µm. *P < 0.05, 2-tailed unpaired student’s t test.
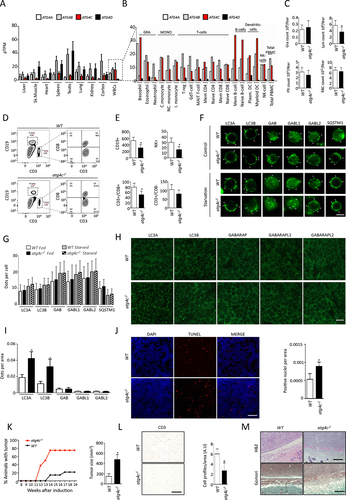
Together, these results show that ATG4C loss in mice leads to a reduction in circulating cytotoxic T-cells, B-cells and NK cells, together with increased splenic apoptosis, LC3s proteins lipidation and accumulation of LC3s-positive structures. Moreover, atg4c-/- mice show a higher incidence of chemically-induced fibrosarcomas with a reduction in immune T-cell infiltration. More detailed analyses should be performed to fully understand the molecular basis of these alterations and if they derive from autophagy-dependent or independent ATG4C functions.
ATG4C participates in mATG8 proteins delipidation in the absence of ATG4D
Given the apparent functional redundancy of the ATG4 family of proteases, we decided to evaluate if ATG4C could have additional roles for the priming/delipidation of mATG8 proteins in vivo when other ATG4 proteins are not present. Thus, we first decided to generate mice double deficient for ATG4C and ATG4B, the main ATG4 protease for the priming of mATG8 proteins [Citation16]. As previously reported, atg4b-/- mice show defects in the priming of all mATG8 proteins with the exception of GABARAPL2 [Citation16,Citation19]. Thus, we analyzed the priming/lipidation status of LC3 and GABARAP proteins as well as the levels of SQSTM1/p62 in tissue extracts from double knockout atg4b-/- atg4c-/- mice (atg4b atg4c DKO mice). As shown in Figure S6A-B, atg4b-/- atg4c-/- mice showed almost an identical priming/lipidation status of all 5 murine ATG8 proteins as compared with those in atg4b-/- mice, either in ad libitum fed or starved mice. SQSTM1/p62 levels in tissue extracts from atg4b-/- atg4c-/- mice were mostly comparable to those observed in atg4b-/- mice [Citation16], both under control conditions and after 24 h of fasting, although a high degree of intersample variability was observed (Figure S6A). Moreover, when autophagic flux was analyzed in atg4b atg4c DKO MEFs, the priming/lipidation status of mATG8 proteins was also identical to that observed in MEFs deficient for ATG4B (Figure S6C-D) and the cellular levels SQSTM1/p62 were comparable to those found in atg4b-/- cells (Figure S6C-D) in any of the conditions analyzed. These results show that in the absence of ATG4B (the main ATG4 protease for mATG8 priming), additional ATG4C loss neither impacts SQSTM1/p62 levels, nor alters priming/delipidation of LC3s and GABARAPs.
In mammalian cells, ATG4D is the main ATG4 protease for the delipidation of mATG8 proteins from autophagic membranes [Citation20,Citation40]. Thus, we also generated mice double deficient for ATG4C and ATG4D (atg4c atg4d DKO), in order to analyze if ATG4C could play a role in mATG8s delipidation in the absence of ATG4D. To do so, we first analyzed the lipidation status of LC3s and GABARAPs proteins in tissue extracts from these mice ( and S7A-C). Interestingly, we observed an increase in the amount of most mATG8 proteins lipidated forms in tissues from atg4c atg4d DKO as compared to atg4d-/- mice samples. These differences were tissue dependent, being less marked in liver tissue than in the other tissues analyzed. This increase in lipidation was more evident for some mATG8 proteins, such as LC3A and GABARAPL2, although we could detect some variability among mice and also tissue dependency ( and S7A-C). These results were confirmed in MEFs, in which autophagic flux was also analyzed by immunoblotting ( and S7D). Consistent with our results with tissue extracts, a clear increase in lipidation was observed for most of mATG8 proteins either in control conditions or upon nutrient deprivation. Consistently, we could also observe an increase in the levels of SQSTM1/p62, especially upon BafA1 treatment ( and S7D). Notably, despite the effect of the simultaneous loss of ATG4C and ATG4D in mATG8s lipidation, the combined overexpression of ATG4C and ATG4D proteases (or that of ATG4C alone) did not have any effect on the lipidation status of mATG8 proteins (Figure S4G).
Figure 7. Autophagy analyses in atg4c atg4d DKO cells and mice. (A) Immunoblotting analyses against mATG8 proteins in heart, liver and muscle tissues from WT, atg4d−/− and atg4c atg4d DKO mice under basal conditions and upon 24 h of fasting. ACTB/β-actin was used as sample processing controls. (B) Autophagic flux analyses in WT, atg4d-/-, atg4c-/- and atg4c atg4d DKO MEFS cultured in rich medium (control) of starved during 4 h either in the presence or absence of bafilomycin A1.
As previously described [Citation20], a delipidation defect leads to an increased presence of mATG8 proteins at the cytosolic leaflet of the autolysosomal membrane after autophagosome-lysosome fusion. The expression of the coral-derived fluorescent protein mKeima, which shows a dual excitation/emission pattern for neutral and acidic pH fused with any mATG8 protein can be used to monitor its relative abundance between the lumen (acidic pH) and the cytosolic leaflet of the autolysosomal membrane (neutral pH) [Citation41]. In the case of a delipitation defect, an increased presence of mKeima-mATG8s at the cytosolic leaflet of autolysosomal membranes would lead to a higher relative fluorescence associated to cytosolic neutral pH in autophagic structures (). Thus, we generated WT, atg4c-/-, atg4d−/− and atg4c atg4d DKO cells stably expressing mKeima-LC3B and analyzed the distribution of both acidic and neutral pH-associated signals in mKeima-LC3B puncta, either at basal or upon autophagy-inducing conditions. As previously reported [Citation20], the fluorescence intensity ratio between acidic and neutral pH associated signals (Ex586/Ex440) was very close to 2 in WT cells, suggesting that the majority of mKeima-LC3B molecules were present in the lumen of acidic vesicles positive for this reporter (). As expected, atg4d−/− cells showed a significant reduction in the ratio between acidic and neutral pH associated signals was very close to 1. This is indicative of an even distribution of mKeima-LC3B between lumen and the cytosolic membrane leaflet of these acidic vesicles (presumably autolysosomes), caused by a delipidation defect of LC3B proteins at the cytosolic leaflet of the autolysomal membrane [Citation20]. Interestingly, whereas atg4c-/- cells showed a comparable Ex586/Ex440 signal distribution to that of WT cells, atg4c atg4d DKO cells showed a fluorescence ratio significantly lower than that of atg4d-deficient cells (), which suggests that delipidation of LC3B is significantly more impaired in atg4c atg4d DKO cells than in those only deficient for ATG4D. Moreover, when the processed form of LC3B (LC3G120), which does not need to be proteolytically activated by ATG4 proteases (specially ATG4B), was fused to mKeima and expressed in ATG4C-only MEFs (triple deficient for ATG4A ATG4B and ATG4D), the ratio between acidic and neutral pH associated signals was significantly higher than that observed in cells deficient for all four ATG4 proteases (QKO) expressing mKeima-LC3G120, in which there is likely no delipidating activity (Fig. S8). These results suggest that despite ATG4D being the main delipidating ATG4, the delipidating activity of ATG4C toward LC3B in the absence of ATG4D is substantial.
Figure 8. Combined deficiency of Atg4c and Atg4c leads to increased defects in LC3B delipidation than those present in atg4d-/- cells. (A) schematic representation of the different possible autophagosome-related structures containing mKeima-LC3B. (B) Representative images for MEFs stably expressing Keima-LC3B, cultured in the indicated conditions (Starvation stands for serum and amino-acids starvation: EBSS for 3 h) (C) Representative images showing the fluorescence intensity ratio from both mKeima-LC3B signals (E x 586-Em620)/(Ex440-Em620). Scale bars: 10 μm, 3 μm in insets. (D) Quantification of mKeima-LC3B ratio from (E x 586-Em620)/(Ex440-Em620) signals. Each point value represents the average ratio of mKeima-LC3B positive structures of a single cell. n ≥ 60 cells per genotype and treatment. (E) Schematic strategy of the SNAP-tag®/LC3B assay developed to specifically monitor LC3B present at the cytosolic leaflet of the autolysosomal membrane. Right, schematic representation of the expected results for either normal or defective LC3 delipidation. (F) Representative pictures of MEFs stably expressing SNAP-PhosSTOP™/LC3B and double-stained with MIL (green) and Alexa Fluor 594®-conjugated anti-LAMP1 antibody (red) in the indicated conditions. Graphs show intensity profiles for fluorescent signals along the direction indicated in the insets (a-w). Scale bars: 10 μm. (G) quantification of the data depicted in (F). The percentage of LAMP1-positive dots which are also positive for MIL labeling is shown. Measurements were done with more than 45 cells per genotype and treatment. p-values were determined by unpaired student´s t-test, *p < 0.05.
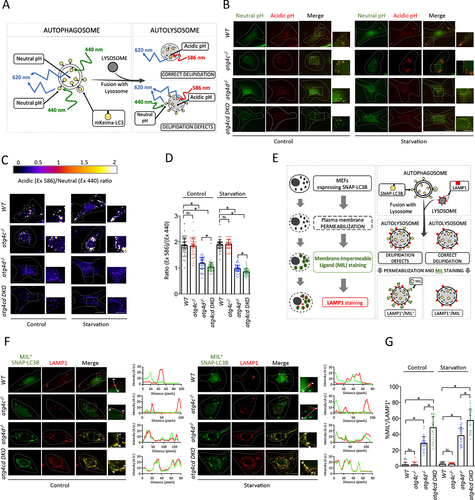
To complement mKeima-based results, we specifically monitored the pool of lipidated LC3B by specific labeling of the pool of LC3B attached to the cytosolic leaflet of autolysosomal membrane, as previously reported [Citation20]. Specifically, WT, atg4c-/-, atg4d-/- and atg4c atg4d DKO MEFs stably-expressing SNAP-PhosSTOP™-LC3B were subjected to selective permeabilization of the plasma membrane (without permeabilization of other cellular membranes), stained against LAMP1 and simultaneously labeled with a fluorescent Membrane Impermeable SNAP-cOmplete™ Ligand (MIL) which binds to the accessible pool of SNAP-LC3B-II [Citation20]. This technique allows us monitoring the relative abundance of SNAP-LC3B/MIL and LAMP1 double-positive structures, which represent autolysosomes showing SNAP-LC3B-II at their cytosolic membrane leaflet (). Consistent with our previous studies [Citation20], atg4d−/− cells showed an increased number of subcellular structures positive for both SNAP-LC3B/MIL and LAMP-1 in atg4d−/− MEFs, both in control conditions and upon nutrient deprivation (). These structures were hardly detected in WT cells ad atg4c-/-, which suggests that mATG8s delipidation -or at least that of LC3B- normally precedes autophagosome-lysosome fusion. Interestingly, atg4c atg4d DKO MEFs even show a higher number of LAMP-1+ MIL+ structures than that observed in atg4d−/− MEFs (). This indicates that the combined absence of ATG4C and ATG4D leads to a further delipidation defect of LC3B than that observed in atg4d−/− cells. Interestingly, when SNAP-LC3G120 was expressed in QKO MEFs, we could observe a high percentage (≈80%)of MIL+ LAMP1+ structures, as QKO cells likely have no delipidating activity toward LC3B (Figure S8A-J). In contrast, when SNAP-LC3BG120 was expressed in ATG4C-Only MEFs, the percentage of MIL+ LAMP1+ structures significantly decreased to values similar to those observed in atg4d KO MEFs expressing SNAP-LC3B (), which confirms the importance of ATG4C for LC3B delipidation in the absence of ATG4D.
All these results show that ATG4C participates in the delipidation of LC3B (and presumably in that of the other mATG8 proteins) when ATG4D, the main delipidating ATG4D, is absent. Interestingly, the increased delipidation defect of atg4c atg4d DKO cells do neither lead to any significant change in autophagic flux (), nor exacerbate the ataxic phenotype of atg4d−/− mice [Citation20], as the number and characteristics of cerebellar Purkinje Cells from atg4c atg4d DKO mice are comparable to those observed in atg4d−/− mice [Citation20] (Figure S9A-B). Consistently, atg4c atg4d DKO mice performance in motor coordination functional tests, including hind-limb clasping test (Figure S9C-D), raised beam test (Figure S9E) and Rotarod test (Figure S9F-G) is equivalent to that of atg4d−/− mice. By contrast, atg4c atg4d DKO mice show a more severe lymphopenia than atg4c KO mice, as their populations of NK and noncytotoxic T cells are even more reduced than in atg4c-deficient animals (Figure S9H). In addition, atg4c atg4d DKO mice show several other phenotypic features, such as cardiac fibrosis, increased pancreatic periductal and perivascular fibrosis, a reduction of dermis thickness with irregular distribution of hair follicles, as well as a higher presence of mast cells in skin tissue (Figure S9I). All these interesting phenotypic alterations could be either derived from the severe mATG8s delipidation defect of atg4c atg4d DKO mice or by different non-autophagic functions of ATG4 proteases and will be addressed in future works focused on the specific characterization of the atg4c atg4d DKO mice model.
Together, our results show that although ATG4C is dispensable for correct development and fertility in mice, its deletion leads to tissue specific alterations in the lipidation pattern of LC3A and LC3B proteins in several tissues. In adult mice, ATG4C loss leads to decreased locomotor activity and reduced respiration rate after fasting, as well as to a reduction in several lymphocyte populations and increased chemically-induced carcinogenesis. Moreover, through the analysis of mice and cells double deficient for ATG4C and ATG4D proteases, we have shown a significant role for ATG4C in the delipidation of mATG8 proteins when ATG4D is absent.
Discussion
To date, the precise in vivo role of the four members of the mammalian Atg4 family of cysteine proteinases remains to be fully characterized. So far, it is not known whether the existence of four mammalian orthologs of the yeast protease Atg4 corresponds to a functional redundancy or, by contrast, the components of this proteolytic system have acquired new other functions distinct from autophagy during eukaryote evolution. Previous works have addressed the physiological roles of ATG4 family members through the generation of atg4b- and atg4d-deficient mice [Citation16,Citation20]. atg4b-deficient mice have been widely studied, as they show partial autophagy flux blockade [Citation16]. In fact, analysis of atg4b-/- mice has shown that ATG4B is the main ATG4 protease for the initial proteolytic activation of mammalian ATG8s in vivo. Thus, disruption of Atg4b gene in mice leads to a reduced cellular content of autophagic structures and increased SQSTM1/p62 accumulation due to reduced availability of activated ATG8 proteins. Ultimately, these alterations result in a marked balance disorder, impaired intestinal homeostasis linked to Paneth cell abnormalities, and also to higher susceptibility to obesity-related disorders, among other features Recently, it has been shown that ATG4D is the main delipidating enzyme for mammalian mATG8s, which accumulate in their membrane-bound form in the absence of this protease. Disruption of Atg4d gene in mice leads to cerebellar neurodegeneration linked to a progressive decline in motor coordination. These features are associated with alterations in the trafficking/clustering of different GABAA receptors subunits, as a result of altered interaction between GABARAP and GABRG2/GABAA γ2-subunit in the absence of ATG4D [Citation20,Citation42].
Here, we have advanced in the characterization of the in vivo roles of the ATG4 family by the generation and analysis of atg4c-/- mice. The study of these mice reveals that ATG4C activity is not as important as those of ATG4B and ATG4D regarding the priming/delipidation of mATG8 proteins. However, Atg4c disruption in mice leads to some tissue-specific alterations in the levels/lipidation pattern of LC3A and LC3B proteins, which occurs in brain, spleen and diaphragm. In brain, mutant mice show an alteration in the status of LC3 proteins after 24 h of fasting. In this regard, the ability of fasting to induce autophagy in neuronal cells is a matter of controversy. Although certain studies have reported fasting-induced LC3B puncta formation in neurons [Citation43], an increase in LC3 proteins lipidation in brain tissue extracts is hardly observed, even after 48 h of fasting [Citation44]. In our experiments, the total amount of LC3 proteins in brain tissue from WT mice extracts was reduced after fasting, which may be indicative of increased autophagosome degradation. By contrast, the lipidation status and total levels of LC3 proteins did not significantly change upon fasting in atg4c-/- mice brains, which suggests that ATG4C loss might specifically impact LC3 proteins activity in this tissue. In our studies, we used leupeptin to inhibit lysosomal degradation and thus analyze autophagic flux in vivo (, S2 and S3). However, this treatment was not effective in brain, due to leupeptin inability to cross the blood-brain barrier. Thus, additional studies will be required to understand the cause of the slight but significant alterations in LC3 proteins in atg4c-/- mice brains. Irrespectively of these considerations, atg4c-/- mice do neither show any sign of autophagy impairment (such as SQSTM1/p62 accumulation) in brain, nor any sign of neurodegeneration, which suggests that the impact of ATG4C loss in this tissue is minor. In spleen, the rise in the total levels of LC3 proteins in atg4c-/- mice might correspond with the observed increased apoptosis in this tissue (), as autophagy normally precedes apoptosis and often serves as a line of defense against stress before cellular dismantlement [Citation34,Citation35]. In diaphragm, lipidation of LC3A and LC3B proteins is diminished in response to fasting in atg4c-/- mice, as compared with that of WT mice. This may indicate that even when priming of LC3s works efficiently under normal circumstances in the absence of ATG4C, this protease contributes to ensure maximal availability of activated LC3 proteins in diaphragm when a higher amount of cleaved LC3s is required (as during fasting). In this regard, our leupeptin-based measurements in vivo ( and S3B) confirm a decrease in the autophagic flux of this tissue in atg4c-deficient mice. The fact that atg4c-/- mice show increased AMPK activation in diaphragm points to a deficit in energy supply, which could be a consequence of the observed decrease in autophagic flux upon fasting. In fact, inhibition of autophagic flux during nutrient deprivation leads to decreased ATP and elevated AMP and is associated with AMPK activation in cultured cells [Citation45]. Thus, it is likely that the observed impairment in fasting-induced autophagy in atg4c-/- mice diaphragms could functionally compromise the activity of this muscle, which would impact breathing ability, affecting both respiration and locomotor activity, as reported for both mice models and human patients of muscular dystrophy [Citation33,Citation46–48]. The fact that atg4c-/- mice show alterations in diaphragm muscle fiber composition could also contribute to explain their reduced respiration upon prolonged fasting. Interestingly, a shift in diaphragm fiber composition toward type I fibers, coupled with an increase in CSA, is a characteristic of MDX mice, which are a model of Duchenne Muscular Dystrophy (DMD) and show a reduced diaphragm contractile force
Apart from these tissue-specific alterations, ATG4C seems not to be essential for autophagic flux in any other tissue. However, atg4c-/- mice show reduced populations of B-lymphocytes, NK-cells and cytotoxic T lymphocytes, which are not related with any autophagy-related alterations in these cell types (). Thus, the observed lymphopenia of atg4c-deficient mice is probably linked to autophagy-independent functions of ATG4C in these specific cell types. Although we do not currently have any mechanistic explanation for these alterations, the increase in splenic apoptosis in atg4c-/- mice could be responsible (at least in part) for the observed alterations, as reported for other pathological contexts such as during sepsis-induced lymphopenia [Citation49]. Irrespective of these mechanistic details, atg4c-knockout mice show a higher incidence of MCA-induced fibrosarcomas, in which a significant reduction in immune T-cell infiltration was observed (). Thus, the reduced lymphocyte count of atg4c-deficient mice could hamper the effectiveness of antitumor immunosurveillance, contributing to explain their increased susceptibility to chemically-induced carcinogenesis.
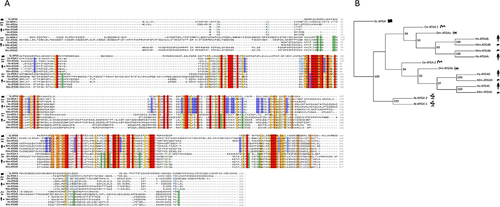
In mammals, most of the essential autophagy genes, such as Atg3, Atg5, Atg7, Ambra1, Rb1cc1 and Becn1, among others, have remained as single copy genes throughout evolution, from yeast to mammals [Citation50]. By contrast, the yeast Atg4/Atg8 system has gained a high evolutionary complexity. Although the exact reasons for the evolutionarily-linked gene amplification of these protease(s)/substrate(s) are not totally understood, recent works with animal and cell models deficient for different ATG4 proteases have shed some light into the degree of redundancy and specialization for each ATG4 family member in terms of their substrate specificity and their selective involvement in either priming or delipidation of mATG8 proteins [Citation51]. Currently, it is established that ATG4B is the main protease for the priming of mATG8 proteins, with the exception of GABARAPL2, whose priming is not affected by ATG4B loss [Citation16]. Interestingly, while Atg4 yeast protease is able to efficiently perform both Atg8 priming and delipidation, this last function is mainly carried out by ATG4D in mammalian cells [Citation20]. Thus, one of the reasons behind the gene amplification of ATG4 family might be functional specialization. Our work strengthens this idea by showing that ATG4C complements ATG4D activity in relation to mATG8s delipidation from autophagic membranes. In fact, cells simultaneously deficient for both ATG4D and ATG4C show a higher accumulation of lipidated mATG8s than that displayed by cells deficient for ATG4D only. Consistently, tissue extracts from atg4c atg4d DKO also show increased amounts of membrane-bound forms of mATG8s both under control conditions and upon fasting. These results contrast with the fact that loss of ATG4C in the context of ATG4B deficiency (as in atg4b atg4c DKO cells and tissues) has no additional effects on mATG8s priming, which shows a comparable status in both atg4b KO and atg4b atg4c DKO cells and tissues. In this regard, it is remarkable that ATG4D and ATG4C share a 46% of amino-acid identities, which is higher than those between ATG4C and ATG4A (30%) or ATG4C and ATG4B (28%) and also than those between ATG4D and ATG4A (32%) or ATG4D and ATG4B (30%) (). In fact, computational phylogenetic tree analysis including species harboring only two ATG4 proteases, such as C. elegans or D. melanogaster, revealed that the ATG4 family can be subdivided into two subfamilies of closely related members. ATG4A and ATG4B should be grouped together with CeAtg4.1 and DmAtg4a, as they are more evolutionarily related, whereas ATG4C and AG4D are closer to CeAtg4.2 and DmAtg4b (). Consistently, it has been reported that disruption of CeAtg4.1 leads to similar defects as those observed in atg4b-deficient mice [Citation52], whereas loss of CeAtg4.2 leads to a similar phenotype as what we have observed upon simultaneous tg4d/Atg4c targeting [Citation52,Citation53]. These lines of evidence support the idea that gene amplification in the ATG4 family may reflect an evolutionary specialization of the two main functions of yeast Atg4 protease into the two ATG4 subfamilies.
Figure 9. Sequence and phylogenetic analyses of ATG4 proteins. (A) Amino acid sequence of yeast, D. melanogaster, C. elegans, human and mouse ATG4 proteins. The multiple alignment was performed with the ClustalX program. Gaps are indicated by hyphens. The analysis of the alignment was performed with jalview (version 2.2). Coloring was applied according to both amino-acid identity percentage and conservation (threshold value = 7.5). Amino-acids highlighted in red represent conserved residues with 100% of identity among all depicted species. Amino-acids highlighted in orange represent residues with a high degree of similarity involving only conservative substitutions. Amino-acids highlighted in yellow show residues in which a high degree of similarity is found, even when non-conservative substitutions occur in some species. Dark blue and dark green represent residues with 100% of identity in the ATG4AB and ATG4C ATG4D subfamilies, respectively. Light blue and light green represent residues which high degree of conservation (involving only conservative substitutions) in the ATG4AB and ATG4C ATG4D subfamilies, respectively. (B) Phylogenetic tree of the ATG4 family. Amino acid sequences of the different A. thaliana, C. elegans, D. melanogaster, human and mouse ATG4 proteins were aligned using the Phylip program package (version 3.6). Numbers represent reliability values after bootstrapping the data. Percentage of identity between the different ATG4s members: ATG4A vs ATG4B: 57%; ATG4A vs ATG4C: 30%; ATG4A vs ATG4D: 32.76%; ATG4B vs ATG4C: 28.38%; ATG4B vs ATG4D: 30.73 and ATG4C vs ATG4D: 46.39%.
In summary, in this work, we show that the activity of ATG4C is not essential for autophagy under normal conditions in vivo, although its loss leads to tissue specific alterations in the lipidation status of LC3A and LC3B proteins, including a decrease of autophagic flux in diaphragm, which likely influences the reduced resistance of atg4c-/- mice to prolonged fasting. In addition, mutant mice show a reduced number of circulating B-lymphocytes, NK-cells and cytotoxic T lymphocytes, which could contribute to explain the higher susceptibility of these mice to MCA-induced carcinogenesis. Finally, through analysis of mice and cells double deficient for ATG4B ATG4C and ATG4C ATG4D, we have shown that ATG4C plays a role in the delipidation of mATG8 proteins when ATG4D (the main delipidating ATG4 enzyme) is absent.
Materials and methods
Targeting vector construction
A genomic DNA clone was isolated from a mouse 129-SV/J genomic DNA library (Stratagene, La Jolla, CA), using a murine Atg4c cDNA fragment as probe. The genomic organization was determined by restriction analysis and subsequent subcloning of these fragments into pBluescript or pUC18. Plasmid pPN2T-Hgterm (kindly provided by Dr. C. Paszty, Lawrence Berkeley National Laboratory, Berkeley, USA) containing the pgk-neo and two pgk-tk (thymidine-kinase) selection markers was used to construct the Atg4c targeting vector. A 3.4 kb HindIII-BamHI fragment from the 5’-flanking region was used as the 5’-homologous region whereas a 4.7 kb EcoRI-HincII fragment containing exons 5 and 6 was used as the 3´-region of homology. The 2.4-kb neo-cassette was used as a positive marker and replaced a 10 kb fragment containing exons 1 to 4 of the Atg4c gene ().
Generation of atg4c-deficient mice
The targeting vector was linearized by digestion with NotI, electroporated into HM1 embryonic stem cells (ES), and selected for homologous recombination with G418 and ganciclovir. Positive clones were screened by Southern blot following PstI digestion of genomic DNA and probed with a radiolabeled 5’-external probe (). A 12-kb fragment was detected from the wild-type allele and a 8-kb fragment from the corresponding mutant allele. The targeted ES cell clones were expanded and subsequently injected into blastocysts to generate chimeras. Chimeric males were mated with C57BL/6 female mice and the offspring heterozygous for Atg4c were used to generate homozygous null mice. In all experiments, homozygous atg4c-/- mice and their corresponding wild-type mice were littermates derived from interbreeding of heterozygotes with a mixed background of C57Bl6/129 Sv.
RT-PCR
Total RNA was isolated from mouse tissues according to the method of Chomczynski and Sacchi About half of the obtained product was reverse-transcribed using the RNA-PCR Core kit® from Perkin-Elmer (Roche Applied Science, 03531252103). A PCR reaction was then performed with mouse Atg4c-specific primers for 25 cycles of denaturation (94°C, 20 s), annealing (62°C, 20 s), and extension (72°C, 30 s). As a control, Actb was PCR-amplified from all samples under the same conditions.
Fibroblasts extraction and culture
MEFs were extracted from E13 embryos. Briefly, embryos were sterilized with ethanol, washed with PBS (Sigma, 806552) and triturated with razor blades. Samples were then incubated in DMEM (Gibco, overnight at 37°C and 5% CO2. The next day, cultured cells were trypsinized, filtered and washed. Finally, MEFs were incubated at 37°C and 5% CO2 and used for the corresponding experiments. For immunofluorescence analyses of MEFs, cells were grown 96-well black clear tissue culture treated plates, washed in PBS and fixed in 4% paraformaldehyde in PBS at room temperature for 10 min. Primary antibody was diluted 1:100 in PBS, incubated overnight at 4°C. Samples were washed 3 times in PBS during 15 min each. Secondary antibody was diluted 1:300 in PBS, incubated at RT for 1 h. Samples were washed 3 times in PBS during 15 min each and analyzed by fluorescence microscopy.
Lentiviral transduction of MEF cells
For lentivirus generation, HEK293T cells (ATCC, CRL-11268) were co-transfected using branched polyethyleneimine (bPEI25; Sigma, 408727) with pLEMIR-SNAPf-EGFP-LC3B, hmKEIMA-LC3B, pCDH-SNAP-GFP-LC3Bactive or Lentihuman-KEIMA-LC3Bactive with the packaging and envelope plasmids HLpsPAX2 (Addgene, 35002; deposited by Didier Trono) and HLpMD2g (Addgene, 12259; deposited by Didier Trono). Briefly, bPEI25 was prepared as a 100× stock solution to be diluted and stored at −80°C as a pH 10.6 1X solution. HEPES-based buffer (20 mM HEPES pH 7.4 + 150 mM NaCl) was prepared and filtered through a 0.22-µm PES filter (polyether sulfone) after its use. HEK293T cells were seeded in 6-well plates in “DMEM complete”: Dulbecco’s modified Eagle’s medium (Sigma, D5796) supplemented 50 mL heat-inactivated (30 min at 56°C) fetal bovine serum (Invitrogen, 10270106), 5 mL penicillin-streptomycin-glutamine (Invitrogen, 10378–016; 100X), 5 mL antibiotic antimycotic (Invitrogen, 15240–062; 100X) to 80% confluence. The final transfection volume per well was 1 mL: 2 3 µg of each plasmid were all together incubated in 100 µL of HEPES based buffer at 37°C for 5 min. The ratio PEI:DNA (v:v) is 3:1, so PEI was added three times the total volume of DNA mixture (the combination of plasmids needed to get infectious virions in each particular case) and left at 37°C for 15 min. Opti-MEM (Opti-MEM Reduced Serum Media; Gibco, 31985062) was added thereafter up to the final volume and incubated for another fifteen min. Cells were prepared by a gently washed with Opti-MEM before the PEI-DNA mixture was slowly dropped. After an incubation of 8–12 h at 37°C and 5% CO2, cells were seeded in fresh DMEM and during 96 h supernatants were filtered at different times through 0.45 μm PES filters (VWR, 28145–505) to collect formed virions, supplemented with 0.8 µg/mL of polybrene (Santa Cruz Biotechnology, sc -134,220) and dropped into already prepared host cell cultures of immortalized mouse embryonic fibroblasts in DMEM supplemented with 5 mL MEM NEAA (Invitrogen 11,140–035; 100X), 5 mL HEPES buffer (Invitrogen, 15630–056; 1 M), 5 mL sodium pyruvate (Invitrogen, 11360–039; 100X) and 800 µL 2-mercaptoethanol (Invitrogen, 31350–010; 50 mM). Separation by cell sorting was performed 96 h after the first infection.
MEFs immortalization
For immortalization, pLOX-Ttag-iresTK (Addgene, 12246; deposited by Didier Trono) plasmid was used. Briefly, primary MEFs between passage 3 and 4 were split into 6 well dishes with 2 ml MEF culture medium and grown overnight in a 37°C incubator with 5% CO2. Once the MEFs reached ~ 70% confluence, cells were considered ready for infection. The viral supernatant was removed after 48 h and replaced with 2 ml MEF culture medium then incubated at 37°C until just confluent, ~48–72 h after infection. Once confluent, the MEFs were sub-cultured into a 10 cm tissue culture dish with 10 ml MEF culture medium this was considered passage one (P1). The MEFs were split every 3–4 days for 10–15 days after P1 until its immortalization. An uninfected Primary MEFs (negative control) is used to know which passage implies immortalization.
Protein extract preparation
Tissues were snap frozen immediately after dissection and stored at −80°C. For western blotting analysis, small pieces (10 30 mg) of the corresponding tissues were placed in reinforced tubes with 6 ceramic beads (zirconium oxide) and RIPA buffer (100 mM TRIS, pH 7.4, 10 mM EDTA, pH 7.4, 150 mM NaCl, 1% TRITON X-100 [Thermo Scientific, 13444259], 0.1% SDS, PhosSTOP™ [Roche, 4906845001] and cOmplete™ [Roche, 4693116001; 200 µL/10 mg of tissue]). Tissues were homogenized in a Precellys 24 tissue homogenizer (Bertin Instruments, P000669-PR240-A) at 6500 rpm for 1 or 2 cycles of 20 s, and further placed on ice for 0.5–1 hour. Tubes were centrifuged at 4°C and 16,200 g for 10 min and the resulting supernatants were collected in microcentrifuge tubes and stored at −80°C until further analysis. Cells extracts were obtained from trypsinized cultures. After washing pellets with DPBS (Sigma, D1283), they were resuspended in RIPA buffer and immediately placed on ice for a 10-min incubation period. Samples were then centrifuged at 10,000 g and 4°C for 10 min and supernatants transferred to microcentrifuge tubes and stored at −80°C until further analysis. Protein concentration was determined by Pierce™ BCA Protein Assay Kit (Thermo Scientific, 23227) according to the manufacturer’s protocol. Samples were then normalized (usually, 15 µg/10 µL/lane) with Laemmli buffer (60 mM TRIS-HCl, pH 6.8, 2% SDS, 10% glycerol, 8% 2-mercaptoethanol and 0.005% bromophenol blue) before a boiling step (95°C for 5 min), to be afterward stored at −80°C until gel loading or, in some cases, loaded shortly after.
Immunoblotting
Mini sodium dodecyl sulfate-polyacrylamide gel electrophoresis gels in a discontinuous buffer system and under reducing conditions with stacking and resolving layers 8% or 15% polyacrylamide (30% acrylamide:bisacrylamide solution, 37.5:1 [2.7% crosslinker]), were performed to estimate relative molecular weight and distribution of proteins among our 20 µg-15 µg/lane normalized tissue and cell extracts. After electrophoresis, resolving layers were electrotransferred to PVDF membranes (polyvinylidene difluoride, Immobilon® -P; Merck Millipore, IPVH00010) in transfer buffer (10 mM CAPS [Sigma, C2632], 4 mM sodium hydroxide, 10–20% methanol, pH 11). After the transferring step, membranes were rinse in milliQ water and directly incubated at room temperature for one hour in blocking solution according to the information provided on each primary antibody datasheet. Then, once rinsed in TBS-T buffer (20 mM TRIS-HCl pH 7.4, 150 mM NaCl and 0.05% Tween-20) they were left in gentle agitation overnight at 4°C with the appropriate diluent and primary antibody dilution: [anti-SQSTM1/p62 (Abnova, H00008878-M01), anti GAPDH (R&D Systems, 1AF5718), anti-LC3B (Novus Biologicals, NB600–1384), anti-LC3A (ProteinTech, 12135–1-AP), anti-GABARAP (MBL, PM037), anti-GABARAPL1 (ProteinTech, 11010–1-AP), anti-GABARAPL2 (MBL, PM038), anti-ACTB/beta-actin (Sigma A2228), anti PRKAA/AMPK (Cell Signaling Technology, 2532), anti phospho-PRKAA/AMPK (Cell Signaling Technology, 2531), anti ATG4A (Arigo, ARG54904 and Thermo Scientific, PA557632), anti ATG4B (Sigma A2981-200UL), anti ATG4C (Cell Signaling Technology, 5262 and ProteinTech, 20382–1-AP) and anti ATG4D (Novus Biologicals, NBP1–36939 and Invitrogen, PA576282)]. Membranes were then washed with TBS-T buffer to remove unbound and/or inespecific primary antibody. After incubation with the appropiate secondary antibody (following manufacturer´s instructions [usually at a 1:10000 v:v dilution in fresh 1.5% nonfat dried milk (TBS-T) for 1 h at room temperature in gentle shaking], membranes were again carefully washed before proceeding with chemiluminescent analysis using an Odyssey® Fc imaging system (LI-COR Biosciences, model number 2000). Datasheet considerations for the chemiluminescent substrate reagent [Immobilon® Forte Western HRP substrate (Merck Millipore, WBLUF0500)] and the user´s manual of the device were carefully read, which let us adjust specific and individualized exposure times (usually 0.5–10 min) to each membrane in order to obtain accurate signal intensities without saturation monitorizing the chemiluminescent reaction through the Image StudioTM Lite 5.2 software (LI-COR Biosciences). Images were saved for densitometric analysis and figures editing: densitometric quantification of protein levels were based on chemiluminescence intensity, and they were performed using Image StudioTM Lite 5.2 software (LI-COR Biosciences) or ImageJ software (NIH). Unless otherwise specified, immunoblotting against beta- actin was used as sample processing control (LOAD) for the immunoblots shown in this article.
Long-lived protein degradation (LLPD)
LLPD was assessed as described previously [Citation54]. Briefly, WT and atg4c-/- MEFs were seeded in 24-well plates in 0.5 ml RPMI 1640/10% FBS (complete medium; “CM”) containing 0.1 µCi/ml 14C-labeled L-valine (Vitrax, VC 308), and labeled for 3 days in a humidified incubator at 37°C and 5% CO2. Next, cells were washed once with 0.5 ml CM supplemented with 10 mM cold (nonradioactive) L-valine (Sigma, V0513) (“CM-V”), and incubated in 0.5 ml CM-V for 18 h (“the chase period”). Subsequently, the cells were washed once with 0.5 ml CM-V or EBSS (Earle’s balanced salt solution; Gibco, 24010043) amino acid starvation medium supplemented with 10 mM L-valine (“EBSS-V”), and thereafter incubated in either 0.25 ml CM-V containing 0.1% DMSO or 0.25 ml EBSS-V containing 0.1% DMSO or 100 nM bafilomycin A1 (BafA1; Enzo, BML-CM110-0100) for 4 h (“the LLPD sampling period”). Cellular proteins were precipitated by placing the plates on ice for 2 min and adding 50 µl ice-cold PBS, 2% BSA (Thermo Scientific, BP9706) and 200 µl ice-cold 25% trichloroacetic acid (TCA) to each well. After overnight shaking at 4°C, the solutions from each well were transferred to microcentrifuge tubes and centrifuged at 5,000 × g for 10 min at 4°C. The supernatants (TCA-soluble fractions) were transferred to scintillation tubes with 5 ml Opti-Fluor scintillation liquid (PerkinElmer Life Sciences) and mixed by vortexing. The pellets and insoluble material left in the wells (together making up the TCA-insoluble fractions) were solubilized by adding 250 µl 0.2 M KOH to each and agitating on roller/shaker for 1 h at room temperature. The resulting solutions were merged and mixed with 5 ml Opti-Fluor scintillation liquid by vortexing. Radioactivity was measured with a liquid scintillation counter (Packard Tri-Carb 2100TR). LLPD rate was calculated as the percentage of radioactivity in the TCA-soluble fraction relative to the total radioactivity in the TCA-soluble and -insoluble fractions, divided by the LLPD sampling period incubation time. BafA1-sensitive LLPD (indicating lysosomal LLPD) was calculated by subtracting the LLPD rates measured in cells that had been incubated with EBSS-V containing 100 nM BafA1 from that measured in cells that had been incubated with EBSS-V containing 0.1% DMSO.
Quantitative real-time PCR
Total RNA was extracted from mouse tissues using the RNeasy kit (QIAGEN, Valencia, CA) according to the manufacturer’s protocol. cDNA was synthesized using 1 to 5 μg of total RNA, 0.14 mM oligo(dT) (22-mer) primer, 0.2 mM concentrations of each deoxynucleoside triphosphate, and Superscript II reverse transcriptase (Invitrogen, Carlsbad, CA). Quantitative reverse transcription-PCR (qRT-PCR) was carried out in triplicate for each sample using 20 ng of cDNA, TaqMan® Universal PCR master mix (Applied Biosystems, San Francisco, CA), and 1 μL of the specific TaqMan® custom gene expression assay for Atg4a, Atg4b, Atg4c and Atg4d (Applied Biosystems). To quantitate gene expression, PCR was performed at 95°C for 10 min, followed by 40 cycles of 95°C for 15 s, 60°C for 30 s, and 72°C for 30 s using an ABI Prism 7700 sequence detector system. As an internal control for the amount of template cDNA used, gene expression was normalized to the mouse GAPDH gene using the Mouse GAPD (Gapdh) Endogenous Control (VIC® MGB Probe, Primer Limited) TaqMan® Gene expression assay (Applied Biosystems). Relative expression of the distinct Atg4 genes was calculated according to manufacturer’s instructions. Briefly, Atg4a, Atg4b, Atg4c and Atg4d expression was normalized to GAPDH in wild-type or atg4c-/- derived samples, using the following formula: the mean values of 2ΔCTgene (Atg4a, Atg4b, Atg4c or Atg4d)–ΔCTgene (Gapdh) for three different wild-type animals were considered 100% for each Atg4 gene and the same values for atg4c-/- mouse tissues were referred to those values according to Livak and Schmittgen [Citation55].
Isolation of PBMCs
Isolation of PBMCs was done from peripheral blood of 6 mice per genotype. Blood is diluted with 2–4 volumes phosphate-buffered saline (PBS) pH-7.2. Then we added 1 volume of a density gradient medium with ρ = 1.077 g/ml at the bottom of the tube before centrifugation at 400×g for 25 min at 20°C in a swinging bucket rotor without brake. After centrifugation, we aspirated most of the upper layer leaving the mononuclear cells at the interphase. In this moment, we transferred the mononuclear cells to a new 50 ml tube, fill the tube with PBS, mix and centrifuge at 300×g for 10 min at 20°C. We removed the supernatant completely and resuspended the cells in a small volume of PBS before diluting the cell suspension with 10 ml PBS and centrifuged at 200×g for 15 min at 20°C. Then, we resuspended the cells in complete RPMI.
Flow cytometry analyses
BD trucountTM tubes (BD Biosciences, USA) was used for determining absolute counts of leukocytes in blood, briefly appropriate monoclonal antibody cocktail and whole blood were added directly to the trucount tube. The lyophilized pellet in the tube vas dissolved and released a known number of fluorescent beads. During analysis, the absolute number (cells/μl) of positive cells could be determined by dividing cellular events to bead events and multiplying by BD Trucount bead concentration according lot number. All the antibodies used in the study were from BioLegend: (PE-CD3, 100205; PE/Cy7-NK1.1, 108713; APC-CD19, 152409).
Lc3B-Keima analyses
For LC3B-Keima ratio analysis, cells were grown on 96-well plates with the appropriate culture medium. When cells present a confluence around 70%, the medium was removed, and the appropriate culture medium was added. Starvation medium stands for serum and amino-acids starvation. Cells were incubated during 3 h at 37°C and 5% CO2 and the experiment was observed using a fluorescence microscope. LC3B-Keima ratio determination (Ex586/Ex440) were measured with Spots colocalization (ComDet) ImageJ plugin.
Specific labeling of SPhosSTOP™-LC3B at the cytosolic leaflet of the outer autophagosomal/autolysosomal membrane
SNAPtag®-LC3B expressing cells were grown in “iMEFs DMEM”: DMEM supplemented with 5 mL MEM NEAA (Invitrogen 11,140–035, 100X), 5 mL HEPES buffer (Invitrogen 15,630–056, 1 M), 5 mL sodium pyruvate (Invitrogen 11,360–039, 100X) and 800 uL 2-mercaptoethanol (Invitrogen 31,350–010, 50 mM). For staining, cells were washed with 1× MAS buffer (220 mM mannitol, 70 mM sucrose, 10 mM KH2PO4, 5 mM MgCl2, 2 mM HEPES, 1 mM EGTA) and then treated for 10 min at 37°C and 5% CO2 with 1× MAS buffer with 5 nM Seahorse XF Plasma Membrane Permeabilizer (Agilent Technologies 102,504–100) to permeabilize the plasma membrane (PM) and release SNAPtag®-LC3B-I from the cytosol. Cells were then incubated for 15 min at 37°C and 5% CO2 in 1X MAS buffer with 5 µM of SNAP-Surface® 649 (New England Biolabs S9159), a fluorescent Membrane Impermeable Ligand (MIL hereafter) to stain membrane-bound SNAPtag®-LC3B-II facing the cytosol. After being carefully washed, cells were fixed in 4% PFA in DPBS and immunostained for LAMP-1 lysosomal protein (Alexa Fluor 594 anti mouse CD107a Clone 1D4B, Biolegend 121,622) to detect autolysosomes positive for SNAPtag®-LC3B-II at their cytosolic membrane leaflet (MIL+ LAMP1+). This colocalization was measured with Spots colocalization (ComDet) ImageJ plugin.
Immunofluorescence analyses
For immunofluorescence analyses cells were grown 96-well black clear tissue culture-treated plates, washed in PBS, and fixed in 4% paraformaldehyde in PBS at room temperature for 10 min. Primary antibody was diluted 1:100 in PBS, incubated overnight at 4°C. Samples were washed three times in PBS for 15 min each. Secondary antibody was diluted 1:300 in PBS, incubated at RT for 1 h. Samples were washed three times in PBS for 15 min each and analyzed by fluorescence microscopy. For the quantification of the images, it was used MorphoLibJ ImageJ plugin and a mask of morphological filters using the correction of white top hat.
Autophagic induction of PBMCs
PBMCs from each genotype of mice were cultured during 1 h in a 96-well plate with RPMI medium. Then, the medium was replaced, and the appropriated medium was added according to these conditions: Control: RPMI medium and bafilomycin A1 (50 nM, Enzo Life Science); Starvation: RPMI medium, bafilomycin A1 (50 nM, Enzo Life Science) and torin (Selleckchem, at 250 nM). After 2 h of treatment, PBMCs were fixed in 4% paraformaldehyde.
Autophagic flux in vivo
Mice used in this experiment were previously synchronized. For this purpose, mice were fasted for 12 h. Then, they spent 3 h in normal conditions of food. After this time, mice were fasted during 12 h again. For the experiment, there were 4 independent groups: Control: they spent 3 h in normal conditions and then they were sacrificed; Control + Leu: they spent 3 h in normal conditions and mice received i.p. injection of 30 mg/kg leupeptin (Sigma Aldrich, L2884). Then they were sacrificed; Starvation: They were sacrificed after fasting; Starvation + Leu: The mice received i.p. injection of 30 mg/kg leupeptin and they were sacrificed after 3 h.
Terminal deoxynucleotidyl transferase (TdT)-mediated dUTP nick end labeling (TUNEL) staining
The tissues were fixed in 4% paraformaldehyde, regularly embedded in OCT (Tissue Tek, Sakura Finetek, 4583) and then were sliced into 4-μm thick frozen sections. Subsequently, TUNEL staining was performed according to the TUNEL assay kit manufacturer’s instructions (Roche Diagnostics Corp., 12156792910). The number of TUNEL-positive cells in the different tissues were counted in 6 randomly selected mice from each group. Images were collected using an automatic fluorescence microscope and analyzed using ImageJ software.
Myofibrillar ATPase staining
Transverse sections of 10 μm were cut from frozen diaphragm samples using a cryostat microtome and adhered to Superfrost1Plus slides. Myofibrillar ATPase staining was used to charactered type I (slow-oxidative), type IIa (fast-oxidative) and type IIb (fast-glycolytic) fibers. Sections were pre-incubated in acetate buffer (100 mM sodium acetate and 50 mM HCl, pH adjusted to 4.6 using NaOH) for 10 min (pH 4.6), then incubated for 40 min in ATPase solution (20 mM CaCl2, 20 mM sodium barbitone [Sigma, C4901 and Sigma, B0500], 3 mM ATP [Sigma A5394], pH 9.4) at 37°C. Then, sections were rinsed in distilled water during 2 min, immersed in 1% CaCl2 (2 min), rinsed 2 min again in dH2O, immersed in 2% CoCl2 (3 min), rinsed 2 min; ddH2O, immersed in 5% ammonium persulfate (30 s) and rinsed again (2 min: ddH2O). Before diaphragm sections were dehydrated with ethanol (70%, 2 × 100%; 2 min each). Sections were then mounted using DPX mounting medium and allowed to dry for 24 h. Using this protocol, type I fibers stain dark brown, type IIa stain intermediate, and type IIb remain pale.
Whole animal plethysmography
Ventilatory Parameters as tidal volume (mL/kg), respiratory frequency (breaths/min; bpm) and the product of these two variables, the minute ventilation (mL/min/kg) were monitored in conscious unrestrained mice by whole body plethysmography as previously described [Citation56]. Methacrylate chambers continuously fluxed (1.0 L/min) with air were used (Emka Technologies, Paris, France; BUXCO Research Systems, Wilmington, NC, United States). Mice, control or fasted for 24 h, were placed in the plethysmography chamber and allowed to breathe room air until achieving a standard resting behavior (~45 min). The chamber temperature was maintained within the thermo‐neutral range (22–24°C) and animal temperature was constant during the experiment. Pressure modifications inside the chamber reflecting TV were calculated with a high-gain differential pressure transducer. Amplitude of pressure fluctuations is proportionally correlated to TV; a calibration of the system by injections of 1 mL air into the chamber allowed a direct estimation of TV.
Alignment of ATG4s amino-acid sequences
The multiple alignment was performed with the ClustalX program. The analysis of the alignment was performed with the Jalview (version 2.2) using a conservation method with 7.5 value of threshold.
Phylogenetic tree of the ATG4 family
Amino acid sequences of the different human and mouse ATG4s and of related proteins identified in Arabidopsis thaliana, C. elegans, and D. melanogaster were aligned using the Phylip program package (version 3.6). Numbers represent reliability values after bootstrapping the data. GenBankTM accession numbers for A. thaliana, C. elegans, and D. melanogaster autophagins are BAB88384 BAB88383, Z68302, AL110500, CG6194, and CG4428, respectively.
Human RNA expression of ATG4 genes
Data from human samples were obtained in https://www.proteinatlas.org. For RNA expression in tissues, we used the data from consensus dataset in which we obtained the normalized expression (nTPM) levels for different tissue types created by combining the HPA and GTEx transcriptomics datasets. For RNA expression in immune cell types, we used the data from HPA dataset in which we obtained the nTPM levels for different immune cell types.
Carcinogenesis protocols and analysis of tumors
Mouse experimentation was done in accordance with the guidelines of the Universidad de Oviedo (Spain), regarding the care and use of laboratory animals. For methylcholanthrene (MCA) chemical carcinogenesis, groups of mice were injected subcutaneously with a freshly prepared solution of MCA in olive oil (100 μg in 100 μl per mouse). Mice were weekly monitored for tumor development over the course of 8–20 weeks. Tumors larger than 5 mm and showing progressive growth were counted as positive and confirmed thereafter by histological analysis. Mice were sacrificed when they had an overt tumor mass or they look moribund. After conventional staining with hematoxylin and eosin, cells were morphologically identified by an expert pathologist and counted with no previous knowledge of mice phenotypes.
Immunofluorescence and histology analyses of mice tissue sections
Tissue cryo-sections were pretreated for 30 min in 1% H2O2/PBS, followed by 1 h in blocking solution and incubated overnight with mouse anti-calbindin D28K (Santa Cruz Biotechnology, sc -365,360). The peroxidase activity was developed with the Elite Vectastain kit (Vector Laboratories, PK-6100) using diaminobenzidine (Abcam, ab236466). Sections were cover slipped with PermaFluor Aqueous Mounting Medium (Thermo Scientific, 12685925). Digital images were captured with a Nikon eclipse 80i optical microscope using the software NIS-Elements Basic Research. For paraffin sections, slides were deparaffinized and rehydrated. Slides or wells were blocked in 10% goat serum (Thermo Scientific, 50197Z) for 10 min, incubated with primary antibodies overnight at 4°C, washed in PBS, incubated for 40 min with secondary antibodies, thoroughly washed in PBS and stained with DAPI for nuclear staining. Histological analyses were performed on formalin-perfused, paraffin-embedded sections. Hematoxylin – eosin (H&E), and Gomori’s Trichrome staining were performed to examine collagen deposition. RBFOX3/NeuN staining (anti-RBFOX3/NeuN (A60; Millipore, MAB377) was performed to analyze the size of positive Purkinje nuclei profiles. CALB (calbindin) staining (anti-CALB/calbindin D28K (D-4; Santa Cruz Biotechnology, sc -365,360) was performed to quantify the number of positive Purkinje cells.
Fluorescence microscopy
Fluorescence microscopy images were acquired on an Axio Observer Z1 platform with a Plan-Apochromat 40X/1.3, (working distance, 0,21 mm) equipped with an ApoTome.2 system and an Axiocam MRm camera (from Carl Zeiss, Jena, Germany). Zeiss Immersol® immersion oil was used for all microscopic analyses. mKeima-LC3B ratio determination and colocalization of mKeima-LC3B (Ex586/Ex440) were measured with Spots colocalization (ComDet) ImageJ plugin.
Metabolic measurements
Metabolic parameters such as VO2, VCO2 and energy expenditure were obtained using the comprehensive lab animal monitoring system (Oxymax CLAMS, Columbus Instruments, Columbus, OH, USA) and analyzed following manufacturer’s instruction. Mice were monitored for the specific period time indicated in each case and the first 24 h were discarded in the analysis, considering them as acclimation period.
Stereological quantification of the number of neuronal nucleus profiles per unit of area
Quantification of Purkinje cell number was performed by using the following method, as previously described [Citation42]. Briefly, NA = (∑Q)/(n × a/f) = (∑Q)/(n × 0,001) = mm2; ∑Q: Number of positive Purkinje (NeuN) nuclei profiles that fall within the counting frames; n: Number of counting frames used to count the nuclear profiles of positive Purkinje neurons (NeuN);a/f (area associated with each frame): (∆X x ∆X)/M2 = (441)/302500 = 0,001 mm2; M (magnification): (11 mm)/20microns = M (magnification): (11 mm)/(0,02 mm) = 550; ∆x: 21 mm.
Statistical analysis
All data acquisition and analyses were performed by investigators blinded to experimental group. For biochemical analyses, a minimum of four samples per genotype were used for each analysis, while in vivo analyses included at least six mice per genotype. These sample sizes are sufficient to determine whether there is a biologically meaningful difference between different genotypes, given the known mouse-to-mouse variation in autophagy assessments in previous studies published over the past decade. As for in vitro studies, a sufficient large number of cells/areas were analyzed to ensure the description of biologically meaningful differences, also following the methods from studies cited throughout the paper. Moreover, results obtained in cells were reliably reproduced in at least three independent experiments. All experimental data are reported as mean ± SEM unless otherwise mentioned. The data from the analyses met the assumptions of the tests and the variance was similar between the experimental groups. Unpaired or paired (when appropriate) two-tailed Student´s t tests were used when comparing two experimental groups. The Prism program version 7.0 (Graph-Pad Software Inc.) was ugsed for calculations and P values lower than 0.05 were considered significant.
Supplemental Material
Download MS Word (39.6 MB)Acknowledgements
We thank Dr. Javier Rodríguez-Carrio for his help in mice lymphocyte extraction and culture. We thank Dr. Guillermo M. Albaiceta and Margarita Fernández Rodríguez for their help with diaphragm muscle fiber characterization. We specially thank Dr. Asunción Rocher for her kind help with pletismography analyses.
Disclosure statement
No potential conflict of interest was reported by the authors.
Supplementary material
Supplemental data for this article can be accessed online at https://doi.org/10.1080/15548627.2023.2234799
Additional information
Funding
References
- Deretic V, Saitoh T, Akira S. Autophagy in infection, inflammation and immunity. Nat Rev Immunol. 2013 Oct;13(10):722–737. doi: 10.1038/nri3532
- Rubinsztein DC, Marino G, Kroemer G. Autophagy and aging. Cell. 2011 Sep 2;146(5):682–695.
- Levine B, Kroemer G. Biological functions of autophagy genes: a disease perspective. Cell. 2019 Jan 10;176(1–2):11–42.
- Klionsky DJ, Abdelmohsen K, Abe A, et al. Guidelines for the use and interpretation of assays for monitoring autophagy (3rd edition). Autophagy. 2016;12(1):1–222. doi: 10.1080/15548627.2015.1100356
- Ichimura Y, Kirisako T, Takao T, et al. A ubiquitin-like system mediates protein lipidation. Nature. 2000 Nov 23;408(6811):488–492.
- Wu X, Won H, Rubinsztein DC. Autophagy and mammalian development. Biochem Soc Trans. 2013 Dec;41(6):1489–1494. doi: 10.1042/BST20130185
- Fernandez AF, Lopez-Otin C. The functional and pathologic relevance of autophagy proteases. J Clin Invest. 2015 Jan;125(1):33–41. doi: 10.1172/JCI73940
- Lopez-Otin C, Marino G. Tagged ATG8-coding constructs for the in vitro and in vivo assessment of ATG4 activity. Methods Enzymol. 2017;587:189–205.
- Tanida I, Tanida-Miyake E, Ueno T, et al. The human homolog of Saccharomyces cerevisiae Apg7p is a protein-activating enzyme for multiple substrates including human Apg12p, GATE-16, GABARAP, and MAP-LC3. J Biol Chem. 2001 Jan 19;276(3):1701–1706.
- He H, Dang Y, Dai F, et al. Post-translational modifications of three members of the human MAP1LC3 family and detection of a novel type of modification for MAP1LC3B. J Biol Chem. 2003 Aug 1;278(31):29278–29287.
- Hemelaar J, Lelyveld VS, Kessler BM, et al. A single protease, Apg4B, is specific for the autophagy-related ubiquitin-like proteins GATE-16, MAP1-LC3, GABARAP, and Apg8L. J Biol Chem. 2003 Dec 19;278(51):51841–51850.
- Scherz-Shouval R, Sagiv Y, Shorer H, et al. The COOH terminus of GATE-16, an intra-golgi transport modulator, is cleaved by the human cysteine protease HsApg4A. J Biol Chem. 2003 Apr 18;278(16):14053–14058.
- Tanida I, Sou YS, Ezaki J, et al. HsAtg4B/HsApg4B/autophagin-1 cleaves the carboxyl termini of three human Atg8 homologues and delipidates microtubule-associated protein light chain 3- and GABAA receptor-associated protein-phospholipid conjugates. J Biol Chem. 2004 Aug 27;279(35):36268–36276.
- Puente XS, Sanchez LM, Overall CM, et al. Human and mouse proteases: a comparative genomic approach. Nat Rev Genet. 2003 Jul;4(7):544–558.
- López-Otín C, Overall CM. Protease degradomics: a new challenge for proteomics. Nat Rev Mol Cell Biol. 2002 Jul;3(7):509–519. doi: 10.1038/nrm858
- Marino G, Fernandez AF, Cabrera S, et al. Autophagy is essential for mouse sense of balance. J Clin Investig. 2010 Jul;120(7):2331–2344.
- Fernandez AF, Barcena C, Martinez-Garcia GG, et al. Autophagy couteracts weight gain, lipotoxicity and pancreatic beta-cell death upon hypercaloric pro-diabetic regimens. Cell Death Dis. 2017 Aug 3;8(8):e2970.
- Cabrera S, Fernandez AF, Marino G, et al. Atg4b/autophagin-1 regulates intestinal homeostasis and protects mice from experimental colitis. Autophagy. 2013 Aug;9(8):1188–1200.
- Cabrera S, Marino G, Fernandez AF, et al. Autophagy, proteases and the sense of balance. Autophagy. 2010 Oct;6(7):961–963.
- Tamargo-Gomez I, Martinez-Garcia GG, Suarez MF, et al. ATG4D role in mAtg8s delipidation and neuroprotection. Autophagy. 2021 Jun;17(6):1558–1560.
- Kuma A, Komatsu M, Mizushima N. Autophagy-monitoring and autophagy-deficient mice. Autophagy. 2017 Oct 3;13(10):1619–1628.
- Kabeya Y, Mizushima N, Ueno T, et al. LC3, a mammalian homologue of yeast Apg8p, is localized in autophagosome membranes after processing. The EMBO J. 2000 Nov 1;19(21):5720–5728.
- Tanida I, Minematsu-Ikeguchi N, Ueno T, et al. Lysosomal turnover, but not a cellular level, of endogenous LC3 is a marker for autophagy. Autophagy. 2005 Jul;1(2):84–91.
- Rubinsztein DC, Cuervo AM, Ravikumar B, et al. In search of an “autophagomometer”. Autophagy. 2009 Jul;5(5):585–589.
- Haspel J, Shaik RS, Ifedigbo E, et al. Characterization of macroautophagic flux in vivo using a leupeptin-based assay. Autophagy. 2011 Jun;7(6):629–642.
- Sahani MH, Itakura E, Mizushima N. Expression of the autophagy substrate SQSTM1/p62 is restored during prolonged starvation depending on transcriptional upregulation and autophagy-derived amino acids. Autophagy. 2014 Mar;10(3):431–441. doi: 10.4161/auto.27344
- Lum JJ, DeBerardinis RJ, Thompson CB. Autophagy in metazoans: cell survival in the land of plenty. Nat Rev Mol Cell Biol. 2005 Jun;6(6):439–448. doi: 10.1038/nrm1660
- Smith-Blair N. Mechanisms of diaphragm fatigue. AACN Clin Issues: Advanc Pract Acute Critical Care. 2002 May;13(2):307–319. doi: 10.1097/00044067-200205000-00014
- Tamargo-Gomez I, Marino G. AMPK: regulation of metabolic dynamics in the context of autophagy. Int J Mol Sci. 2018 Nov 29;19(12):3812.
- Crow MT, Kushmerick MJ. Chemical energetics of slow- and fast-twitch muscles of the mouse. J Gen Physiol. 1982 Jan;79(1):147–166. doi: 10.1085/jgp.79.1.147
- Levine S, Kaiser L, Leferovich J, et al. Cellular adaptations in the diaphragm in chronic obstructive pulmonary disease. N Engl J Med. 1997 Dec 18;337(25):1799–1806.
- Petrof BJ, Stedman HH, Shrager JB, et al. Adaptations in myosin heavy chain expression and contractile function in dystrophic mouse diaphragm. Am J Physiol. 1993 Sep;265(3 Pt 1):C834–41.
- Burns DP, Roy A, Lucking EF, et al. Sensorimotor control of breathing in the mdx mouse model of duchenne muscular dystrophy. J Physiol. 2017 Nov 1;595(21):6653–6672.
- Shen S, Kepp O, Kroemer G. The end of autophagic cell death? Autophagy. 2012 Jan;8(1):1–3. doi: 10.4161/auto.8.1.16618
- Marino G, Niso-Santano M, Baehrecke EH, et al. Self-consumption: the interplay of autophagy and apoptosis. Nat Rev Mol Cell Biol. 2014 Feb;15(2):81–94.
- Pendas AM, Folgueras AR, Llano E, et al. Diet-induced obesity and reduced skin cancer susceptibility in matrix metalloproteinase 19-deficient mice. Mol Cell Biol. 2004 Jun;24(12):5304–5313.
- Balbin M, Fueyo A, Tester AM, et al. Loss of collagenase-2 confers increased skin tumor susceptibility to male mice. Nat Genet. 2003 Nov;35(3):252–257.
- Matsushita H, Vesely MD, Koboldt DC, et al. Cancer exome analysis reveals a T-cell-dependent mechanism of cancer immunoediting. Nature. 2012 Feb 8;482(7385):400–404.
- DuPage M, Mazumdar C, Schmidt LM, et al. Expression of tumour-specific antigens underlies cancer immunoediting. Nature. 2012 Feb 8;482(7385):405–409.
- Durgan J, Lystad AH, Sloan K, et al. Non-canonical autophagy drives alternative ATG8 conjugation to phosphatidylserine. Mol Cell. 2021 May 6;81(9):2031–2040 e8.
- Katayama H, Kogure T, Mizushima N, et al. A sensitive and quantitative technique for detecting autophagic events based on lysosomal delivery. Chem Biol. 2011 Aug 26;18(8):1042–1052.
- Tamargo-Gomez I, Martinez-Garcia GG, Suarez MF, et al. ATG4D is the main ATG8 delipidating enzyme in mammalian cells and protects against cerebellar neurodegeneration. Cell Death Differ. 2021 Sep;28(9):2651–2672.
- Alirezaei M, Kemball CC, Flynn CT, et al. Short-term fasting induces profound neuronal autophagy. Autophagy. 2010 Aug;6(6):702–710.
- Mizushima N, Yamamoto A, Matsui M, et al. In vivo analysis of autophagy in response to nutrient starvation using transgenic mice expressing a fluorescent autophagosome marker. Mol Biol Cell. 2004 Mar;15(3):1101–1111.
- Guo JY, Teng X, Laddha SV, et al. Autophagy provides metabolic substrates to maintain energy charge and nucleotide pools in ras-driven lung cancer cells. Genes Dev. 2016 Aug 1;30(15):1704–1717.
- Barnard AM, Lott DJ, Batra A, et al. Imaging respiratory muscle quality and function in duchenne muscular dystrophy. J Neurol. 2019 Nov;266(11):2752–2763.
- Hawkins EC, Bettis AK, Kornegay JN. Expiratory dysfunction in young dogs with golden retriever muscular dystrophy. Neuromuscul Disorders. 2020 Nov;30(11):930–937. doi: 10.1016/j.nmd.2020.09.027
- Fajardo VA, Chambers PJ, Juracic ES, et al. Sarcolipin deletion in mdx mice impairs calcineurin signalling and worsens dystrophic pathology. Hum Mol Genet. 2018 Dec 1;27(23):4094–4102.
- Girardot T, Rimmele T, Venet F, et al. Apoptosis-induced lymphopenia in sepsis and other severe injuries. Apoptos. 2017 Feb;22(2):295–305.
- Zhang S, Hama Y, Mizushima N. The evolution of autophagy proteins – diversification in eukaryotes and potential ancestors in prokaryotes. J Cell Sci. 2021 Jul 1;134(13). doi: 10.1242/jcs.233742
- Agrotis A, Pengo N, Burden JJ, et al. Redundancy of human ATG4 protease isoforms in autophagy and LC3/GABARAP processing revealed in cells. Autophagy. 2019 Jun;15(6):976–997.
- Wu F, Li Y, Wang F, et al. Differential function of the two Atg4 homologues in the aggrephagy pathway in caenorhabditis elegans. J Biol Chem. 2012 Aug 24;287(35):29457–29467.
- Hill SE, Kauffman KJ, Krout M, et al. Maturation and clearance of autophagosomes in neurons depends on a specific cysteine protease isoform, ATG-4.2. Dev Cell. 2019 Apr 22;49(2):251–266 e8.
- Luhr M, Saetre F, Engedal N. The long-lived protein degradation assay: an efficient method for quantitative determination of the autophagic flux of endogenous proteins in adherent cell lines. Bio Protoc. 2018 May 5;8(9):e2836.
- Livak KJ, Schmittgen TD. Analysis of relative gene expression data using real-time quantitative PCR and the 2(-delta delta C(T)) method. Methods. 2001 Dec;25(4):402–408. doi: 10.1006/meth.2001.1262
- Gonzalez-Obeso E, Docio I, Olea E, et al. Guinea pig oxygen-sensing and carotid body functional properties. Front Physiol. 2017;8:285. doi: 10.3389/fphys.2017.00285