
ABSTRACT
Sarcopenia is a major contributor to disability in older adults, and thus, it is key to elucidate the mechanisms underlying its development. Increasing evidence suggests that impaired macroautophagy/autophagy contributes to the development of sarcopenia. However, the mechanisms leading to reduced autophagy during aging remain largely unexplored, and whether autophagy activation protects from sarcopenia has not been fully addressed. Here we show that the autophagy regulator TP53INP2/TRP53INP2 is decreased during aging in mouse and human skeletal muscle. Importantly, chronic activation of autophagy by muscle-specific overexpression of TRP53INP2 prevents sarcopenia and the decline of muscle function in mice. Acute re-expression of TRP53INP2 in aged mice also improves muscle atrophy, enhances mitophagy, and reduces ROS production. In humans, high levels of TP53INP2 in muscle are associated with increased muscle strength and healthy aging. Our findings highlight the relevance of an active muscle autophagy in the maintenance of muscle mass and prevention of sarcopenia.
Abbreviation: ATG7: autophagy related 7; BMI: body mass index; EIF4EBP1: eukaryotic translation initiation factor 4E binding protein 1; MAP1LC3/LC3: microtubule associated protein 1 light chain 3; ROS: reactive oxygen species; TP53INP2: tumor protein p53 inducible nuclear protein 2; WT: wild type
Introduction
Aging is a biological process associated with a time-dependent functional decline leading to tissue dysfunction and failure. Skeletal muscle is affected by aging through a process known as sarcopenia, which refers to the loss of muscle mass and function. The development of sarcopenia leads to disability in the elderly, thereby substantially decreasing their quality of life. In this context, a full understanding of its molecular determinants is of vital importance for the design of novel and efficient therapeutic approaches. Alterations in autophagy have been associated with aging in several tissues [Citation1–3]. In addition, interventions that extend lifespan and healthspan, such as calorie restriction and exercise, drive their beneficial effects at least in part through activating autophagy [Citation1]. In fact, modulation of autophagy has an impact in lifespan in murine models. Mice that ubiquitously overexpress ATG5 (autophagy related 5) exhibit enhanced autophagy, are lean, and show an extended lifespan [Citation4]. In addition, mice with a point mutation in BECN1/Beclin 1, that disrupts the interaction between BECN1 and BCL2 (BCL2 apoptosis regulator), show a constitutively active autophagy, leading to prolonged lifespan [Citation5].
Links between reduced muscle autophagy and sarcopenia have also been described in mice [Citation6–8] and humans [Citation9]. Muscle ablation of the core autophagy protein ATG7 reduces muscle mass and causes neuromuscular junction degeneration in adult mice [Citation7,Citation8]. Consistently, muscle-specific ablation of ATG7 in old mice again caused muscle atrophy and denervation, whereas overexpression of ATG7 in old mice reduced the level of denervation, and ameliorated muscle mass loss [Citation8]. Therefore, unraveling strategies that enable the fine-tuning of autophagy in muscle could provide a new approach to combat sarcopenia, and hence, promote healthy aging.
In this study we focused on the autophagy modulator TP53INP2 (TRP53INP2 in mice, referred to hereafter as TP53INP2 for simplicity) [Citation10–14]. TP53INP2 binds through a LIR motif to autophagic adapters of the MAP1LC3/GABARAP family and activates autophagy in cells and in tissues [Citation10,Citation13,Citation15]. Its loss of function reduces autophagic flux but does not cancel autophagic activity [Citation10,Citation12], indicating that TP53INP2 is a non-essential autophagy activator. In the context of skeletal muscle, TP53INP2 controls muscle mass in adult mice, and its overexpression in muscle leads to enhanced autophagy and a moderate reduction in muscle fiber size [Citation16]. Based on these observations, we have explored whether activation of muscle autophagy driven by the autophagy protein TP53INP2 could mitigate the development of sarcopenia and promote healthy aging. Given the impact of adequate autophagy in preserving muscle mass and function, we sought to evaluate whether TP53INP2 plays a role in muscle aging and whether a sustained or acute increase in muscle autophagy by TP53INP2 overexpression can protect against sarcopenia.
Results and discussion
The autophagy regulator TP53INP2 is decreased in aged muscle and is associated with healthy aging in humans
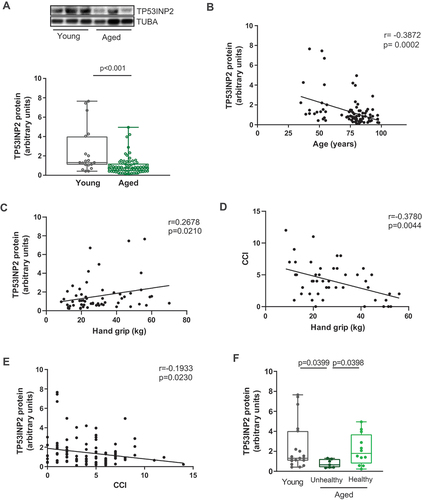
We analyzed TP53INP2 protein expression in muscle biopsies from young and aged subjects from a previously described cohort [Citation17]. The anthropometric parameters of the participants of this study are detailed in Table S1. Average TP53INP2 protein levels were decreased in aged subjects () and correlated negatively with age (). The relationship between age and TP53INP2 was analyzed by bivariate and multivariate regression models. A negative correlation was found in both models, independently of sex and body mass index (BMI; Figure S1A, S1B, Table S2). To determine the role of TP53INP2 on muscular function during aging, we evaluated its association with muscle strength. TP53INP2 protein levels showed a positive correlation with hand-grip strength (), suggesting that decreased levels of TP53INP2 in aged subjects could be associated with a reduced muscular function. To further address whether TP53INP2 protein levels were associated with increased probability of either developing sarcopenia or undergoing healthy aging, we used the Charlson comorbidity index (CCI), which categorizes comorbidities of patients based on the International Classification of Diseases and has been associated with skeletal muscle mass and physical performance in aged individuals [Citation18]. Indeed, in the human cohort studied here, CCI values were negatively correlated with hand-grip strength (). Of note, a negative correlation was also observed between TP53INP2 protein levels and CCI (). Overall, these data indicate that high TP53INP2 proteins levels are associated with greater muscle strength, physical performance, and healthy aging in humans. Interestingly, we have recently identified a similar expression pattern for BNIP3, a protein involved in mitophagy. In that study, we described a healthy aging group characterized by high BNIP3 levels, low CCI values, and low inflammatory and denervation markers [Citation17]. In agreement with a possible role of TP53INP2 promoting healthy aging, muscles biopsies from the healthy aged population showed similar levels of TP53INP2 protein compared to the young group, and higher levels of the protein compared to the unhealthy aged group (). These results suggest that TP53INP2 could be used as a molecular biomarker of healthy aging.
Figure 1. TP53INP2 protein expression decreases during aging and is associated with sarcopenia and unhealthy aging in humans. (a) quantification of TP53INP2 protein expression in muscle biopsies from young and aged human subjects. (b) correlation of muscle TP53INP2 protein expression with age in human subjects. (c) correlation of muscle TP53INP2 protein expression with hand grip strength in human subjects. (d) correlation of Charlson comorbidity index (CCI) values and hand grip strength in human subjects. (e) correlation of muscle TP53INP2 protein expression with CCI in human subject. (f) TP53INP2 protein expression in aged unhealthy and healthy subjects. Data are expressed as box and whiskers showing minimum to maximum data. Statistical analyses were performed by mann-whitney t-test (A), spearman correlation analysis (B, C, D and E) and ANOVA followed by Krustal-Wallis test (F).
Activation of autophagy in muscle during life protects from sarcopenia and promotes healthy aging
Consistently with human data, expression of TP53INP2 was reduced in old mice compared to young counterparts (, Figure S1C). To assess the functional role of TP53INP2 in muscle during aging, we used wild-type (WT) and skeletal muscle-specific TP53INP2 transgenic mice [Citation16]. Given that TP53INP2 is a modulator of autophagy, and based on the human data described above, we hypothesized that the overexpression of this protein potentially impacts muscle fitness during aging. In both young and old transgenic mice, TP53INP2 protein and mRNA levels remained higher compared to WT mice (Figure S1D-S1E), and analysis of the autophagic marker MAP1LC3/LC3-II showed that the age-induced accumulation of this protein was prevented in TP53INP2 transgenic mice (Figure S1F), as well as the number of autophagosomes quantified in muscle sections (Figure S1G). These data indicate that autophagy was increased in old transgenic animals. Supporting this idea, muscle from old TP53INP2 transgenic mice showed a higher autophagic flux compared to WT counterparts (). No significant changes were observed in the expression of autophagy genes (Figure S1H). Interestingly, although TP53INP2 overexpression reduced muscle mass and cross-sectional area (CSA) in young mice (Figure S2A-S2D), it protected from age-associated loss of muscle mass () and decreased CSA (), with no changes in the proportion of type I and type IIa/IIb fibers (Figure S2E). Importantly, muscle performance was preserved in old TP53INP2 transgenic mice, whereas a substantial reduction was detected in the control group in response to aging (, Figure S2F-2 G). This occurred without affecting the weight of other tissues (Figure S2H), and the expression of atrophy-related genes (atrogenes, Figure S2I), and denervation markers (Figure S2J). Levels of p-EIF4EBP1 and K48-ubiquitinated proteins were not different between genotypes, suggesting no changes in protein synthesis or degradation (Figure S2K-2 L).
Figure 2. Overexpression of TP53INP2 in mouse muscle enhances autophagy and protects against sarcopenia and age-related metabolic disease. (a) Representative western blot (WB) and quantification of TP53INP2 protein expression in gastrocnemius muscle from young (4–6-months old) and old (22–24-months old) mice (n = 11). (b) Representative WB and quantification of the autophagy marker LC3-II in gastrocnemius muscle from old WT and TP53INP2 transgenic mice untreated or treated with colchicine (n = 5–6). (c) quantification of the percentage of age-induced reduction in the weight of the quadriceps, gastrocnemius and tibialis muscles in WT and TP53INP2 transgenic mice (n = 9–12). (d) quantification of the percentage of age-induced reduction in cross-sectional area (CSA) in gastrocnemius from WT and TP53INP2 transgenic mice (n = 8–10). (e) quantification of the percentage of age-induced loss of muscle performance in WT and TP53INP2 transgenic mice (n = 5–7). (f) glucose tolerance test (GTT) in old WT and TP53INP2 transgenic mice (n = 5–7). (g) Representative WB image and quantification of LC3-II protein levels in muscle mitochondria from old WT and TP53INP2 transgenic mice untreated or treated with colchicine (n = 4–6). Data are expressed as mean ± SE. *p < 0.05. Statistical analyses were performed by t-test (A, C, D and E), and two-way ANOVA (B, F and G).
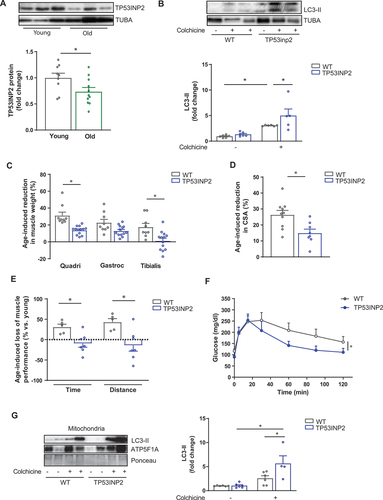
Alterations in autophagy in the skeletal muscle play a role in age-associated metabolic dysregulation [Citation6,Citation19,Citation20]. TP53INP2 transgenic mice, either young or old, did not show any alterations in body weight or food intake (Figure S3A-3B). However, reduced fasting glycemia and improved glucose tolerance were observed in old transgenic mice (, Figure S3C), without changes in insulin levels during the glucose tolerance test (GTT) or insulin tolerance (Figure S3D-3E). No changes in oxygen consumption or energy expenditure were detected between genotypes (Figure S3F-3 G). These data contrast with those observed in muscle-specific atg7 KO mice, in which a complete blockage of autophagy in muscle was linked to improved metabolic homeostasis in diet-induced obese mice, potentially due to an FGF21 (fibroblast growth factor 21)-dependent compensatory mechanism [Citation21]. Taken together, our studies in WT and TP53INP2 transgenic mice indicate that increased autophagy in muscle during life protects against loss of muscle mass and function and improves age-associated metabolic dysregulation.
Alterations in mitochondrial function are associated with the development of sarcopenia [Citation22] and are key for the progression of age-related metabolic diseases [Citation6]. In this regard, we have previously shown that alterations in mitophagy and accumulation of damaged mitochondria are central contributors to sarcopenia and age-associated metabolic alterations [Citation6,Citation17]. Given these observations, we analyzed several parameters of mitochondrial homeostasis in old WT and TP53INP2 transgenic mice. Mitochondrial respiration in isolated muscle fibers remained unaltered between genotypes (Figure S3H), although a significant decrease in ROS levels was detected in transgenic animals (Figure S3I). These data point to an improvement in mitochondrial function and/or quality. TOMM20 (translocase of outer mitochondrial membrane 20) protein levels and mitochondrial DNA copy number, two markers of mitochondrial mass, were reduced in TP53INP2 transgenic (Figure S3J-3K), which was confirmed by measuring mitochondrial density in tissue sections by electron microscopy (Figure S3L). Mitophagy flux, monitored by measuring protein levels of LC3-II in mitochondrial fractions (Figure S3M), revealed increased mitophagy in transgenic mice compared to WT counterparts (). In all, these results suggest that the overexpression of TP53INP2 increases mitophagy, leading to a reduced mitochondrial mass and ROS production, that sustains the same mitochondrial respiration per amount of muscle as in the control group. This enhanced mitochondrial quality could explain the improved metabolic homeostasis observed in old transgenic animals.
Activation of autophagy in old mice improves muscle atrophy
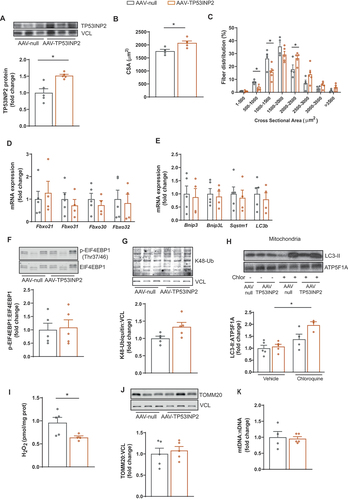
To evaluate whether activation of autophagy could be targeted to reverse muscle atrophy in the elderly, we decided to acutely overexpress TP53INP2 in 24-months-old mice by using adeno-associated viral vectors (AAV). We injected control viruses (AAV-null) in the gastrocnemius muscle of one hindlimb, and viruses containing overexpression vectors encoding for TP53INP2 (AAV-TP53INP2) in the contralateral gastrocnemius muscle of the same mouse. After three weeks of their administration, AAV-TP53INP2 led to an increase in TP53INP2 protein levels in gastrocnemius compared to AAV-null injected muscles (). Of note, acute overexpression of TP53INP2 was sufficient to increase muscle CSA () and shift the myofiber size distribution toward larger fibers compared to controls (). These alterations were not associated with changes in gene expression of atrogenes (), autophagy-related genes () and markers of protein synthesis or degradation (). Importantly, acute AAV-mediated TP53INP2 overexpression promoted mitophagic flux () and reduced ROS levels (). In contrast to TP53INP2 transgenic mice, no changes in mitochondrial mass were observed in AAV-TP53INP2 transduced muscles (), probably due to the shorter time of TP53INP2 overexpression in this model.
Figure 3. Acute overexpression of TP53INP2 in old mice improves muscle atrophy. (a) Representative WB and quantification of TP53INP2 protein expression in gastrocnemius muscle from old mice (24 months old) injected with control (AAV-null) or TP53INP2 overexpressing (AAV-TP53INP2) adeno-associated viruses (n = 5). (b) quantification of cross-sectional area (CSA) of gastrocnemius muscle from old mice injected with AAV-null or AAV-TP53INP2 adeno-associated viruses (n = 5). (c) fiber CSA distribution from old mice injected with AAV-null or AAV-TP53INP2 adeno-associated viruses (n = 5). (d) mRNA expression of atrophy-related genes in gastrocnemius from old mice injected with AAV-null or AAV-TP53INP2 adeno-associated viruses (n = 5). (e) mRNA expression of autophagy-related genes in gastrocnemius from old mice injected with AAV-null or AAV-TP53INP2 adeno-associated viruses (n = 5). (F) Representative WB and quantification of p-EIF4EBP1/EIF4EBP1 in gastrocnemius from old mice injected with AAV-null or AAV-TP53INP2 adeno-associated viruses (n = 5). (G) Representative WB and quantifiation of K48-ubiquitinated proteins in gastrocnemius from old mice injected with AAV-null or AAV-TP53INP2 adeno-associated viruses (n = 5) (H) Representative WB and quantification of LC3-II in mitochondrial fractions from gastrocnemius from old mice transduced with AAV-null or AAV-TP53INP2 adeno-associated viruses and untreated or treated with chloroquine (n = 3–5). (I) Quantification of H2O2 levels in gastrocnemius muscle from old mice injected with AAV-null or AAV-TP53INP2 adeno-associated viruses (n = 5). (J) Representative WB and quantification of TOMM20 in gastrocnemius from old mice injected with AAV-null or AAV-TP53INP2 adeno-associated viruses (n = 5). (K) Quantification of mitochondrial DNA (mtDNA) levels in gastrocnemius from old mice injected with AAV-null or AAV-TP53INP2 adeno-associated viruses (n = 5). Data are expressed as mean ± SE. *p < 0.05. Statistical analyses were performed by t-test (A-G, I-K), and two-way ANOVA (H).
Here, we show that aging is associated with a decrease of the autophagy modulator TP53INP2 in skeletal muscle in humans and mice, which could be a mechanism responsible for the reduction in autophagy associated to aging. In addition, low levels of this protein are associated with muscle dysfunction and unhealthy aging in humans. Importantly, the specific increase in muscle autophagy induced by overexpression of TP53INP2 protects against sarcopenia and age-related metabolic disease in mice. The induction of TP53INP2 expression in already old mice improves muscle atrophy, suggesting that this protein could be targeted to combat sarcopenia in aged people. Altogether, we propose that TP53INP2 is key in the maintenance of autophagy during aging, and interventions stimulating muscle TP53INP2 expression or inducing muscle autophagy emerge as potential therapeutic approaches to prevent sarcopenia and promote healthy aging.
Material and methods
Human muscle biopsies
In this study, a previously described cohort of young (48.3 ± 8.2 years old) and aged subjects (83.3 ± 6.0 years old) was used [Citation17] (Table S1). Subjects suffering from either myopathy or peripheric polyneuropathy, or treated with corticoids were excluded. Muscle biopsies (gluteal muscle) were obtained as described previously [Citation17]. Charlson comorbidity index (CCI) was used for comorbidity assessment and calculated as described [Citation23]. All patients enrolled in this study gave their written consent to participate. All the protocols were approved by the Ethical Committee of the Fundació Sant Joan de Déu.
Handgrip strength determination
The subject holds the dynamometer in the hand to be tested, with the arm at right angles and the elbow by the side of the body. The handle of the dynamometer is adjusted if required – the base should rest on the first metacarpal (heel of palm), while the handle should rest on the middle of the four fingers. When ready, the subject squeezes the dynamometer with maximum isometric effort for about 5 s. No other body movement is allowed. The best result from three trials for each hand is recorded, with at least 15 s recovery between each attempt.
Animals
Transgenic mice overexpressing TP53INP2 in skeletal muscle (Mlc1-Tp53inp2) were used. Mice (C53BL/6J pure genetic background) were generated as described [Citation16]. Young (4–6-months old) and old mice (22–24-months old) were used. Mice were kept in 12-hour dark-light periods in a specific pathogen-free animal facility and provided with a standard chow diet (SDS diets 801,151; 75% energy from carbohydrates, 17.5% from protein and 7.5% from fat) and water ad libitum. For autophagic flux experiments, colchicine (Merck, C9754) was injected intraperitoneally at 0.4 mg/kg for two days. For acute TP53INP2 overexpression, 24-months-old C57Bl/6J mice were used. At the indicated time, mice were anesthetized using isofluorane and sacrificed by cervical dislocation. All animal experiments were done in compliance with the guidelines established by the Institutional Animal Care and Use Committee of the Barcelona Science Park and University of Barcelona.
Adeno-associated viral transduction in mouse muscle
Adeno-associated viruses were generated in Viral Vector Production Unit from the Autonomous University of Barcelona. Viral transduction in old mice was performed by injecting purified control (AAV8-CMV-Null) and TP53INP2 (AAV8-CMV-TP53INP2) adeno-associated viruses at 2.5 × 10¹¹ gc in a total volume of 75 μl of saline into gastrocnemius muscle. Three different areas of gastrocnemius muscle were injected to assure the maximal transduction efficiency. Control adenoviruses were injected in the right muscle and TP53INP2 adeno-associated viruses in the left muscle. Muscles were collected three weeks after viral administration.
Protein extraction and western blotting
Mouse muscle and human muscle biopsies were homogenized in lysis buffer (50 mM Tris, pH 7.5, 150 mM NaCl, 1 mM EDTA, 2 mM sodium orthovanadate (Merck, S6508), 100 mM NaF (Merck, S7920), 20 mM sodium pyrophosphate (Merck, P8010), 1% NP-40 (Thermo Scientific 15,875,388), and protease inhibitors tablet (Roche 11,836,153,001) with a mini-beadbeater (Biospec, NC0493733) twice for 30 s, incubated for 1 h at 4°C in an orbital shaker, and then centrifuged for 15 min at 10,000 × g at 4°C. Supernatants were aliquoted and kept at −20°C.
Mitochondria-enriched fractions from gastrocnemius muscle were obtained in homogenization buffer [0.25 M sucrose (Merck, S8501), 50 mM KCl, 5 mM EDTA, 1 mM sodium pyrophosphate (Merck, P8010), 5 mM MgCl2, pH 7.4 and protease inhibitors tablet]. Homogenates were centrifuged at 740 × g for 5 min at 4°C. Supernatant was centrifuged at 9,000 × g for 15 min at 4°C. The supernatant was the cytosolic fraction, and the pellet (mitochondria-enriched fraction) was washed in homogenization buffer and resuspended in lysis buffer.
The following antibodies were used: TUBA/α-tubulin (1:5000; Sigma, T5168 RRID:AB_477579); VCL/vinculin (1:5000; Santa Cruz Biotechnology, sc -73,614 RRID:AB_1131294); TOMM20 (1:1000, Santa Cruz Biotechnology, sc -17,764 RRID:AB_628381); LC3 (1:1000, MBL, PM036 RRID:AB_2274121); TP53INP2 (1:500, generated in our laboratory); TP53INP2 (1:1000, LSBio, LS-C119137 RRID:AB_10798029); p-EIF4EBP1 (1:1000, Cell Signaling Technology, #2855 RRID:AB_560835), EIF4EBP1 (1:1000, Cell Signaling Technology, 9644, RRID:AB_2097841); K48-ubiquitin (1:1000, Cell Signaling Technology, 4289 RRID:AB_10557239); GAPDH (1:5000, Abcam, ab128915 RRID: AB_11143050); ATP5F1A (1:5000, Thermo Fisher Scientific 459,240, RRID:AB_2532234); CANX (1:1000, Santa Cruz Biotechnology, sc -23,954, RRID:AB_626783); GOLGA2 (1:1000, Cell Signaling Technology 12,480, RRID:AB_2797933); anti-mouse (715-035-150, RRID:AB_2340770), and anti-rabbit (711-035-152, RRID:AB_10015282) HRP-conjugated antibodies (Jackson Laboratories) were used as secondary antibodies.
Band quantification from scanned films was performed using Quantity One (Bio-Rad), normalizing the expression for TUBA/tubulin, VCL or Ponceau staining as protein loading controls. Independent quantification of tubulin and vinculin across all the experiments showed no differences between experimental groups.
Histological sample preparation and analysis
For light microscopy, muscles were removed and fixed in formalin. 10 μm cryosections of gastrocnemius muscles were used. Sections were stained with hematoxylin and eosin following standard protocols to check tissue architecture and cross-sectional area (CSA). CSA was quantified in 200–250 fibers/mouse using ImageJ software. For fiber typing analysis, immunofluorescence using the mouse monoclonal IgG2b MYH6/MyHC1 (DSHB, BA-F8) at 1:25, the mouse monoclonal IgG1 MYH2/MyHC2a (DSHB, SC-71) at 1:20 and the mouse monoclonal IgGM MYH4/MyHC2b (DSHB, BF-F3) at 1:10 were incubated overnight at 4°C and was performed manually. Previously starting the staining, samples were fixed with 10% of neutral buffer formalin, 10 min, at room temperature. Blocking was performed with 3% fetal bovine serum for 120 min. Secondary antibodies used were the Alexa Fluor® 568 goat anti-mouse IgG2b (γ2b) (Invitrogen, A-21144) the Alexa Fluor™ 350 goat anti-mouse IgG1 (γ1) (Invitrogen, A-21120) and the Alexa Fluor 488 Goat anti-mouse IgGM (Invitrogen, A21042) diluted at 1:500 for 60 min and mounted with Fluorescence mounting medium (Dako, S3023).
Fluorescent images were acquired using a NanoZoomer-2.0 HT C9600 scanner (Hamamatsu, Photonics, France) with the 20X objective and coupled to a mercury lamp unit L11600–05 and using NDP.scan3.3 software U10074–03 (Hamamatsu, Photonics, France). Slides were evaluated in blind manner, using QuPath 0.4.43 software. Selection of the region of interest was performed automatically and manually revised. Tissue artifacts (e.g. tissue folds, broken areas, frozen artifacts, non-transversal oriented areas) were excluded. Specifically, the QuPath Cellpose/Omnipose extension2 with the WholeSlideImageAnalysisWithQuPath/script/muscleFiberDetection_fluo.groovy was used to segment the muscular fibers. The QuPath counter trained to segment positive SC-71 [type IIa fibers] (in red − 647) fibers.
Measurement of reactive oxygen species (ROS)
H2O2 levels were measured in muscle homogenates using Amplex Red (ThermoFisher Scientific, A22188), as described previously [Citation6].
Mitochondrial DNA copy number
Genomic DNA was isolated from gastrocnemius muscle by using the Genelute Mammalian Genomic DNA Kit (Sigma-Aldrich, G1N70-1KT), following the manufacturer’s instructions. The following primers were used: specific primers to amplify mouse mitochondrial DNA in positions 1,212 and 1,352: Fwd ACCGCAAGGGAAAGATGAAAG, and Rev AGGTAGCTCGTTTGGTTTCGG; and the primers used to amplify nuclear DNA (Gapdh) were: Fwd: CATGGCCTTCCGTGTTCCTA, Rev: GCGGCACGTCAGATCCA. We calculated the mitochondrial DNA copy number using Gapdh amplification as a reference for nuclear DNA content.
DNA and RNA extraction and real time-PCR
Mice were sacrificed by cervical dislocation and tissues were immediately frozen. RNA was isolated using the Trizol reagent (Thermo Fisher Scientific 15,596–018) followed by purification with PureLink RNA Mini Kit (Invitrogen 12,183,025). RNA was reverse-transcribed by using the Q-Script cDNA SuperMix (QuantaBio, QUNT95048). Quantitative real-time PCR was performed using the QuantStudio 6 Real-Time PCR system (ThermoFisher) and the SYBR® Green PCR Master Mix (Applied Biosystems, A25741). All measurements were normalized to Actb/β-actin and Gapdh. The following primers were used:
Actb/β-actin, Fwd: GGTCATCACTATTGGCAACGA, Rev: GTCAGCAATGCCTGG
Gapdh: Fwd: CATGGCCTTCCGTGTTCCTA, Rev: GCGGCACGTCAGATCCA
Bnip3, Fwd: CACCTTTATCACTCTGCTGAATTCTCT, Rev: GATTTTGTTTTTCATTTCCAGTCTTTTAA
Bnip3l: Fwd: AGTTTTGCCATTTTTGAAAGTATTAGTAAA, Rev: GTTTCACCCAACAAGAATCTGTGTA
Sqstm1/p62: Fwd: CCCAGTGTCTTGGCATTCTT, Rev: AGGGAAAGCAGAGGAAGCTC
Lc3b: Fwd: AGCTCTTTGTTGGTGTGTAACTGTCT, Rev: TTGTCCTCACAGCTGACATGTATG
Ncam, Fwd: CCCAGCCAAGGAGAAATCAG, Rev: TGGCGTTGTAGATGGTGAGG
Musk, Fwd: TACAGAGGGGAGGTGTGTGA, Rev: TCCCGGTAGGAGGTGTTGAA
Erbb2, Fwd: GAGACAGAGCTAAGGAAGCTGA, Rev: ACGGGGATTTTCACGTTCTCC
Gadd45a, Fwd: CCGAAAGGATGGACACGGTG, Rev: TTATCGGGGTCTACGTTGAGC
Fbxo32/Atrogin1, Fwd: GCAAACACTGCCACATTCTCTC, Rev: CTTGAGGGGAAAGTGAGACG;
Trim63/MuRF1, Fwd: CATTGTGTGACTGGCGATTGT, Rev: TCTCTAGGCCACCGAGTGAGA;
Fbxo21/Smart, Fwd: TCAATAACCTCAAGGCGTTC, Rev: GTTTTGCACACAAGCTCCA;
Fbxo30/Musa1, Fwd: TCGTGGAATGGTAATCTTGC, Rev: CCTCCCGTTTCTCTATCACG;
Fbxo31, Fwd: GTATGGCGTTTGTGAGAACC, Rev: AGCCCCAAAATGTGTCTGTA
Respiration measurements in permeabilized muscle fibers
Respiration of permeabilized fibers from the tibialis muscle was measured at 37°C by high-resolution respirometry using an Oxygraph-2k (OROBOROS INSTRUMENTS, Innsbruck, Austria) as previously described [Citation24].
Assessment of oxygen consumption in mouse by indirect calorimetry
Oxygen consumption (VO2) and CO2 production (VCO2) were measured using an indirect calorimetry system (Oxymax, Columbus Instruments). Mice (n = 6 per group) were individually housed in the chamber for 72 h with lights on from 6 am to 6 pm and at a temperature of 22–24°C. Mice were acclimated for 24 h and the final 48-h period was used for measurements. Animals had free access to food and water during the dark and light cycles, and food intake was monitored every day. Gas exchange was measured every 20 min with room air composed of 20.5% O2 and 0.05% CO2.
In vivo metabolic measurements
Serum samples were taken between 10 and 12 am after an overnight fast, or at the same time in fed conditions. Blood glucose was assayed with an Accu-Chek glucose monitor (Roche Diagnostics Corp.). Plasma was immediately separated by centrifugation at 4°C and stored at −80°C until the assay. A glucose tolerance test (GTT) was performed on mice fasted for 16 h overnight. Glucose was measured at time 0, followed by intraperitoneal (i.p.) injection of 2 g/kg D-glucose. Blood glucose concentrations were also measured at 5, 15, 30, 60, 90, and 120 min after injection. Plasma insulin was measured at 0, 15, 30 and 60 min after injection. An insulin tolerance test (ITT) was performed on mice fasted for 4 h. Glucose was measured at time 0 and followed by an i.p. injection of 0.75 U/kg insulin (Humalog; Lilly, vl7510). Blood glucose concentrations were measured 15, 30, 45, 60 and 90 min after injection. Plasma insulin was determined using the Ultra-Sensitive Mouse Insulin Elisa Kit (Crystal Chem Inc., 90080).
Evaluation of muscle performance
Muscle performance was evaluated by an exhaustion protocol using a treadmill. Prior to the exercise performance test, mice were accustomed to the treadmill through a 10-min run at a fixed speed of 14 cm/s once per day for two alternate days. On the day of the experiment, each mouse was placed into a lane of the treadmill on a test regimen of 14 cm/s for 8 min, after which the speed was increased by 2 cm/s every 2 min. The maximum speed was set at 46 cm/s. Exhaustion was defined when mice were unable to stand on the treadmill without avoiding repetitive electric shocks. At that point, the time and distance ran on the treadmill were recorded.
Transmission electron microscopy
Quadriceps muscles were cut into pieces of about 1 mm3 and transferred to glass vials filled with 2% parafomaldehyde and 2.5% glutaraldehyde in phosphate buffer (0.1 M, pH 7). They were kept in the fixative solution for 24 h at 4°C. They were then washed with the same buffer and post-fixed with 1% osmium tetroxide in the same buffer containing 0.8% potassium ferricyanide at 4°C. Next, the samples were dehydrated in acetone, infiltrated with Epon resin (Agilent, G7426–85001) for 2 days, embedded in the same resin orientated for longitudinal sectioning and polymerized at 60°C during 48 h. Semi-thin sections were performed under the light microscope to corroborate that the orientation was satisfactory. When such orientations were found, ultrathin sections were obtained using a Leica Ultracut UC6 ultramicrotome (Leica Microsystems, Vienna, Austria) and mounted on Formvar-coated copper grids. They were stained with 2% uranyl acetate in water and lead citrate and then observed under a JEM-1010 electron microscope (Jeol, Japan) equipped with a CCD camera SIS Megaview III and the AnalySIS software. Quantification of autophagosome and mitochondrial number was performed in at least 20 different TEM images/sections from two mice per genotype.
Statistical analysis
The data presented here were analyzed using an appropriate normality test to assess whether they fit a Gaussian distribution. An F-test of equality of variances was performed to demonstrate that the variance between groups was not different. Statistical significance was determined using the Student t-test or analysis of variance (ANOVA) with an appropriate post-hoc test. Data are presented as mean ± SEM. Significance was established at p < 0.05. A Spearman’s test was performed for correlation analyses.
In the study with human samples, some patients presented missing values in the independent variables (BMI = 12) and were excluded from the analysis. To evaluate the potential impact of age on the expression of TP53INP2, a bivariate linear regression model was fitted, where TP53INP2 was the dependent variable and age the independent variable. To control for the effect of gender and BMI, which were not equally distributed across age groups, a multivariate linear regression model was fitted where TP53INP2 was the dependent variable and age, gender and BMI the independent variables. The p-value and 95% confidence interval were estimated.
Sebastian et al Supplementary R4.docx
Download MS Word (514 KB)Acknowledgements
We thank the Histopathology Facility at IRB Barcelona, the Electron Cryomicroscopy Unit and Flow Cytometry Unit at the CCiTUB, University of Barcelona, and Jorge Manuel Seco for technological assistance. We thank Dr. Paloma Solá and Dr. Salvador Aznar-Benitah for providing old mice. M.B was the recipient of a Fellowship for Abroad Post-Doc from Fondazione AIRC (ID 27923). A.I was the recipient of a fellowship from the University of Barcelona, Spain. This study was supported by research grants from MINECO (SAF2016-75246 R), MICINN (PID2021-124645OB-100), the Generalitat de Catalunya (Grant 2017SGR1015), INFLAMES (PIE-14/00045) from the Instituto de Salud Carlos III, CIBERDEM (“Instituto de Salud Carlos III”), the Fundación Ramon Areces (CIVP18A3942), the Fundación BBVA, the Fundació Marató de TV3 (20132330), the European Foundation for the Study of Diabetes (EFSD) and AFM Téléthon. A.Z. is a recipient of an ICREA “Academia” Award (Generalitat de Catalunya). We gratefully acknowledge institutional funding from MINECO through the Centres of Excellence Severo Ochoa Award, and from the CERCA Programme of the Generalitat de Catalunya.
Disclosure statement
No potential conflict of interest was reported by the author(s).
Data availability statement
The data that support the findings of this study are available from the corresponding author upon reasonable request.
Supplementary material
Supplemental data for this article can be accessed online at https://doi.org/10.1080/15548627.2024.2333717
Additional information
Funding
References
- Aman Y, Schmauck-Medina T, Hansen M, et al. Autophagy in healthy aging and disease. Nat Aging. 2021;1(8):634–650. doi: 10.1038/s43587-021-00098-4
- Liang W, Moyzis AG, Lampert MA, et al. Aging is associated with a decline in Atg9b-mediated autophagosome formation and appearance of enlarged mitochondria in the heart. Aging Cell. 2020;19(8):e13187. doi: 10.1111/acel.13187
- Ott C, König J, Höhn A, et al. Macroautophagy is impaired in old murine brain tissue as well as in senescent human fibroblasts. Redox Biol. 2016;10:266–273. doi: 10.1016/j.redox.2016.10.015
- Pyo JO, Yoo SM, Ahn HH, et al. Overexpression of Atg5 in mice activates autophagy and extends lifespan. Nat Commun. 2013;4(1):2300. doi: 10.1038/ncomms3300
- Fernández ÁF, Sebti S, Wei Y, et al. Disruption of the beclin 1–BCL2 autophagy regulatory complex promotes longevity in mice. Nature. 2018;558(7708):136–140. doi: 10.1038/s41586-018-0162-7
- Sebastián D, Sorianello E, Segalés J, et al. Mfn2 deficiency links age-related sarcopenia and impaired autophagy to activation of an adaptive mitophagy pathway. EMBO J. 2016;35(15):1677–1693. doi: 10.15252/embj.201593084
- Masiero E, Agatea L, Mammucari C, et al. Autophagy is required to maintain muscle mass. Cell Metab. 2009;10(6):507–515. doi: 10.1016/j.cmet.2009.10.008
- Carnio S, LoVerso F, Baraibar MA, et al. Autophagy impairment in muscle induces neuromuscular junction degeneration and precocious aging. Cell Rep. 2014;8(5):1509–1521. doi: 10.1016/j.celrep.2014.07.061
- Aas SN, Hamarsland H, Cumming KT, et al. The impact of age and frailty on skeletal muscle autophagy markers and specific strength: a cross-sectional comparison. Exp Gerontol. 2019;125:110687. doi: 10.1016/j.exger.2019.110687
- Mauvezin C, Orpinell M, Francis VA, et al. The nuclear cofactor DOR regulates autophagy in mammalian and drosophila cells. EMBO Rep. 2010;11:37–44. doi: 10.1038/embor.2009.242
- Romero M, Sabaté-Pérez A, Francis VA, et al. TP53INP2 regulates adiposity by activating β-catenin through autophagy-dependent sequestration of GSK3β. Nat Cell Biol. 2018;20(4):443–454. doi: 10.1038/s41556-018-0072-9
- Sabaté-Pérez A, Romero M, Sànchez-Fernàndez-de-Landa P, et al. Autophagy-mediated NCOR1 degradation is required for brown fat maturation and thermogenesis. Autophagy. 2023;19(3):904–925. doi: 10.1080/15548627.2022.2111081
- Nowak J, Archange C, Tardivel-Lacombe J, et al. The TP53INP2 protein is required for autophagy in mammalian cells. Mol Biol Cell. 2009;20(3):870–881. doi: 10.1091/mbc.e08-07-0671
- Ivanova S, Polajnar M, Narbona‐Perez AJ, et al. Regulation of death receptor signaling by the autophagy protein TP53INP2. EMBO J. 2019;38(10):e99300. doi: 10.15252/embj.201899300
- Sancho A, Duran J, García-España A, et al. DOR/Tp53inp2 and Tp53inp1 constitute a metazoan gene family encoding dual regulators of autophagy and transcription. PloS One. 2012;7(5):e34034. doi: 10.1371/annotation/f2e121d7-0878-44b1-a5c2-994231626fe1
- Sala D, Ivanova S, Plana N, et al. Autophagy-regulating TP53INP2 mediates muscle wasting and is repressed in diabetes. J Clin Invest. 2014;124(5):1914–1927. doi: 10.1172/JCI72327
- Irazoki A, Martinez-Vicente M, Aparicio P, et al. Coordination of mitochondrial and lysosomal homeostasis mitigates inflammation and muscle atrophy during aging. Aging Cell. 2022;21(4):e13583. doi: 10.1111/acel.13583
- Gong G, Wan W, Zhang X, et al. Correlation between the Charlson comorbidity index and skeletal muscle mass/physical performance in hospitalized older people potentially suffering from sarcopenia. BMC Geriatr. 2019;19:1–8. doi: 10.1186/s12877-019-1395-5
- Kitada M, Koya D. Autophagy in metabolic disease and ageing. Nat Rev Endocrinol. 2021;17(11):647–661. doi: 10.1038/s41574-021-00551-9
- Potes Y, de Luxán-Delgado B, Rodriguez-González S, et al. Overweight in elderly people induces impaired autophagy in skeletal muscle. Free Radic Biol Med. 2017;110:31–41. doi: 10.1016/j.freeradbiomed.2017.05.018
- Kim KH, Jeong YT, Oh H, et al. Autophagy deficiency leads to protection from obesity and insulin resistance by inducing Fgf21 as a mitokine. Nat Med. 2013;19(1):83–92. doi: 10.1038/nm.3014
- Marzetti E, Calvani R, Cesari M, et al. Mitochondrial dysfunction and sarcopenia of aging: from signaling pathways to clinical trials. Int J Biochem Cell Biol. 2013;45(10):2288–2301. doi: 10.1016/j.biocel.2013.06.024
- Charlson ME, Pompei P, Ales KL, et al. A new method of classifying prognostic comorbidity in longitudinal studies: development and validation. J Chronic Dis. 1987;40(5):373–383. doi: 10.1016/0021-9681(87)90171-8
- Sebastián D, Hernández-Alvarez MI, Segalés J, et al. Mitofusin 2 (Mfn2) links mitochondrial and endoplasmic reticulum function with insulin signaling and is essential for normal glucose homeostasis. Proc Natl Acad Sci U S A. 2012;109(14):5523–5528. doi: 10.1073/pnas.1108220109