
Abstract
Context: Kinetic models could assist clinicians potentially in managing cases of lead poisoning. Several models exist that can simulate lead kinetics but none of them can predict the effect of chelation in lead poisoning. Our aim was to devise a model to predict the effect of succimer (dimercaptosuccinic acid; DMSA) chelation therapy on blood lead concentrations.
Materials and methods: We integrated a two-compartment kinetic succimer model into an existing PBPK lead model and produced a Chelation Lead Therapy (CLT) model. The accuracy of the model’s predictions was assessed by simulating clinical observations in patients poisoned by lead and treated with succimer. The CLT model calculates blood lead concentrations as the sum of the background exposure and the acute or chronic lead poisoning. The latter was due either to ingestion of traditional remedies or occupational exposure to lead-polluted ambient air. The exposure duration was known. The blood lead concentrations predicted by the CLT model were compared to the measured blood lead concentrations.
Results: Pre-chelation blood lead concentrations ranged between 99 and 150 μg/dL. The model was able to simulate accurately the blood lead concentrations during and after succimer treatment. The pattern of urine lead excretion was successfully predicted in some patients, while poorly predicted in others.
Conclusions: Our model is able to predict blood lead concentrations after succimer therapy, at least, in situations where the duration of lead exposure is known.
Introduction
In lead intoxications, questions raised by physicians often relate to whether the patient needs treatment with chelation. If so, which chelation therapy is the most effective, and how many chelation therapy courses may be needed. Clearly, the first step is to halt lead exposure. Chelation therapy is indicated in cases with severe symptoms and/or markedly elevated blood lead concentrations.[Citation1] Many chelating agents exist but succimer (dimercaptosuccinic acid; DMSA) is one of the preferred chelators for adults.[Citation2,Citation3]
A continuous subject of discussion is whether to perform chelation therapy after chronic exposure.[Citation4–6] The length of exposure to lead (acute, sub-acute or chronic) influences the distribution of lead within the body. Over time, lead accumulates in bone and teeth. Lead stored in bone and teeth is not directly accessible to succimer, which is mainly present and active in the extra-cellular volume. After the lead–succimer complex has left the body, lead stored in bone continues to slowly redistribute into the rest of the body. This redistribution can result in a rebound in the blood lead concentration.
Toxicokinetic models exist that describe the complex biological and kinetic behavior of lead in the body.[Citation7–10] The International Commission for Radiation Protection (ICRP) model, the Integrated Exposure Uptake Biokinetic (IEUBK) model developed by the US-EPA [Citation7,Citation11] and the O’Flaherty kinetic models [Citation8,Citation12,13] are the three most important biokinetic models for lead exposure. Only the O’Flaherty model incorporates bone as an explicit compartment. The volume of the bone compartment, the composition, and the metabolic activity are age-dependent (Physiologically Based Pharmacokinetic, or PBPK modeling approach). The O’Flaherty model can therefore take into account the life-long complex kinetics of lead in bone, which is related to bone formation and remodeling, and an individual’s exposure to lead in soil, dust, and water. These lead models are unable to predict the effect of chelation therapy on lead kinetics. In order to evaluate chelation therapy, we upgraded the model developed by O’Flaherty to predict the effect of chelation therapy on lead kinetics with different chelators. Such a model could assist clinical toxicologists to decide whether chelation therapy might be useful and to choose the best dose regimen in cases of lead poisoning in humans. As a first step, the succimer kinetic model which we developed previously has been combined with the PBPK model already developed by O’Flaherty.[Citation8]
Materials and methods
Modeling strategy
The lead model developed by O’Flaherty is a PBPK model, which simulates the life-time disposition of lead in humans.[Citation8,Citation12] The compartments are liver, kidneys, well and poorly perfused tissues, blood, and bone (, O’Flaherty part). As is usual in the PBPK approach, all compartments are characterized by volume, flow/diffusion constants and tissue-to-blood partition coefficients, and are linked through the bloodstream.
Figure 1. Schematic diagram of the CLT model. In grey, on the right side of the diagram, the succimer kinetic model has been combined with the PBPK lead model developed by O’Flaherty.
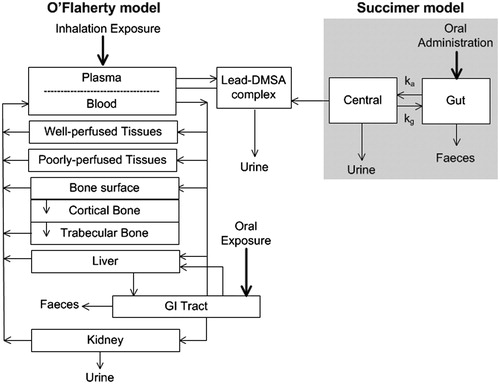
Lead transfer rates between blood and tissues are related to plasma lead only, i.e., lead can only move into tissues from plasma. However, lead in blood is mainly present in erythrocytes. Therefore, the exchange of lead between blood and plasma is modeled as a capacity-limited binding associated with erythrocytes. Lead-exchanges between plasma and soft tissues (i.e., well and poorly perfused tissues, liver, and kidney) are simulated as flow-limited processes.
The bone compartment, due to its importance in lead storage, is subdivided into three sub-compartments: bone surface, cortical bone, and trabecular bone (, O’Flaherty model). Transfer of lead from plasma to bone and vice versa, is modeled in three steps. First, flow-limited exchange of lead takes place between plasma and the bone surface layer. From this layer, lead diffuses to regions where new bone is built (cortical bone), where it is incorporated with calcium into the bone matrix. Thereafter, lead migrates gradually throughout the bone and finally returns (from trabecular bone) to the blood following recycling of bone tissue.
The O’Flaherty model can be used for oral and inhalation exposure. It has already been validated for the human setting.[Citation13] It runs in ACSL and its code was kindly made available by the author, Dr E. O’Flaherty. For this study, the ACSL code was converted into acslX code (www.acslx.com) because the ACSL software is no longer available.
In a previous study, we developed a succimer pharmacokinetic model.[Citation14] The model comprises a gut compartment and a systemic compartment, and assumes a continuous bile flow from the system to the gut (, succimer model). It is unknown whether the succimer parent compound or its metabolites chelate lead.[Citation15–17] Therefore, the succimer model does not make any distinction between the parent succimer compound or its metabolites. The model was validated using volunteer studies in which a 10 mg/kg bodyweight succimer oral dose was administered.
We integrated the succimer kinetic model with the lead PBPK model, forming the Chelation Lead Therapy (CLT) model (). This was achieved by implementing additional codes for succimer kinetics in the PBPK lead model. The CLT model can calculate the effect of orally administered succimer during and after therapeutic sessions after multiple routes of exposure to lead, over a period of days to years. The CLT model solves a system of ordinary differential equations accounting for background exposure, additional exposure (occupational or traditional remedies), and chelation with succimer. The differential equations define the relationship between the blood (or urine) lead concentration and its rate of change. The background exposure relates to lead exposure in childhood and subsequently before substantial additional lead exposure from ingestion of traditional remedies or occupational exposure to lead-polluted ambient air. At every time point, the lead–succimer complex formation was modeled by linking the calculated succimer plasma concentrations to the calculated lead plasma concentrations. We assumed that the complex formation took place in the plasma because succimer does not enter erythrocytes. Once the lifetime lead exposure has been calculated, together with additional exposure leading to lead intoxication, the CLT model can model the effects of regular courses of succimer.
After combining both models, two parameters of interest were still unknown in individual cases: firstly, a lead–succimer apparent association constant (kapp) that characterizes the in vivo chemical binding of succimer to lead and secondly, the exposure dose, which is often unknown in clinical practice. For all patients considered in this study, the period of toxic exposure to lead (start and end time of the additional exposure) was known. Note that the lead–succimer apparent association constant is expected to be similar for all subjects. The exposure dose, however, varied between patients.
Clinical data set and parameter estimation
Clinical data from a previously published study were used to estimate the two unknown parameters of the CLT model.[Citation18] In this study, 17 adult patients presented with lead poisoning and blood lead concentrations ≥50 μg/dL were admitted to the West Midlands Poison Unit, City Hospital, Birmingham, UK, and received succimer chelation. Succimer was administered at a dose of 30 mg/kg/day, p.o., in different courses for at least five consecutive days per course. Data were routinely collected and data processed anonymously by attributing a unique case code number before any analyses. For 7 of these 17 patients, the exposure history was detailed enough to be valuable for the parameter estimation process, i.e., the start and end times of their exposure to lead was known. The individual data of these seven patients are presented in .
Table 1. Patients’ demographics (patients used to fit the parameters in this study).
Five patients were adults who ingested traditional remedies over a period of 3 days to 3 months and two patients were occupationally exposed primarily through inhalation over several months. For each patient, data on blood and urine lead concentrations were available. We present two of the seven patients to illustrate our model’s output. Patient A was a 44-year-old male who ingested a traditional remedy for diarrhea, for three days, during a visit to India. In the following two weeks, he experienced increasing lethargy and abdominal pain. He was admitted to hospital with an increased blood lead concentration (90 μg/dL). Two successive courses of succimer 30 mg/kg were administered, respectively lasting for eight and five days with 23 days in between. Patient B was a 57-year-old male who was exposed to two occasions to lead. One year before his admission to the West Midlands Poison Unit, he worked for 2 months on renovation of a derelict Victorian property, and 7 months later, he also worked for 3.5 months, stripping paint containing lead from a Victorian property, using “blow lamps”. He became increasingly unwell with a sore throat, constipation, chest pains and memory loss, and was finally admitted to hospital with an increased blood lead concentration (59 μg/dL) where he received two courses of succimer 30 mg/kg, lasting respectively for five and four days, with 23 days in between. For this patient, we assumed the exposure had taken place only during the last event. An unequivocal estimate of exposure was, otherwise, unfeasible.
The clinical data were used to estimate, for each patient, the lead–DMSA apparent association constant and the additional daily lead dose during the toxic lead exposure period. Parameter value estimations were obtained by optimizing the log-likelihood function, which is a standard statistical technique for estimating model parameters.[Citation19]
Sensitivity analyses of the model
After estimating the values of the lead–succimer apparent association constant and the exposure dose for each patient, the sensitivity of the CLT model was evaluated by varying the lead–succimer apparent association constant or the lead exposure dose. We investigated the extent of variation in blood lead concentration caused by the variation of these model parameters. A higher lead–succimer apparent association constant lowers the blood lead concentrations and vice versa. On the other hand, increasing the exposure dose will increase the blood lead concentrations in a non-linear way. Sensitivity analyses were performed separately for each individual, given their estimated apparent association constant and exposure dose as basic values.
Effect of chelation treatment
Subsequently, blood and urine lead concentrations were calculated in the absence of chelation therapy. The results of these calculations were compared to calculations with chelation therapy. This yields an indication of the efficacy of succimer treatment and its effects on lead concentrations in various tissues. The two patients A and B are presented as examples of these calculations.
Model predictions based on a single pre-chelation blood lead concentration
In clinical practice, the dose and duration of lead exposure are often unknown. Generally, only a few blood lead concentrations are available at hospital presentation. To show the robustness of the model, calculations were performed to mimic a clinical situation in which the period of toxic exposure to lead is known, the exposure dose is unknown, and only the one blood sample taken at hospital presentation is available. For these calculations, the highest and the lowest value of the individual lead–succimer apparent association constants, determined in the seven patients in this study, were used.
Results
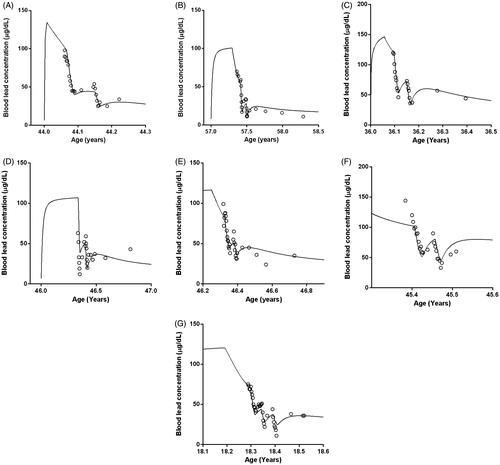
shows the simulation with the CLT model, for two patients: one with an acute lead intoxication by traditional remedies (Patient A) and the other by a chronic occupational lead exposure (Patient B). shows the predicted blood lead concentrations. These figures show different phases, which were observed in all patients. The blood lead concentrations, measured by the laboratory and simulated by the CLT model, are shown as a function of the patient’s age. Whether the exposure occurred by ingestion of traditional remedies or by occupational exposure (predominantly by inhalation), the simulated blood lead concentration (continuous line) rose when exposure took place. After exposure, the blood lead concentration decreases steadily, due to redistribution of lead to other compartments and a very slow elimination of lead from the body. The first arrow indicates the start of the first course of chelation and the second one, its end. During therapy, the blood lead concentration decreases relatively fast, due to the additional elimination of lead through the renal clearance of the lead–succimer complex. After discontinuing the first chelation treatment, a slight rebound in the blood lead concentration is observed. The last two arrows indicate the beginning and end of the second chelation therapy, which induces another relatively fast drop in blood lead concentration, after which rebound occurs again.
Figure 2. Simulations of the blood [Patient A (panel 2A) and Patient B (panel 2B)] and urine [Patient A (panel 2C) and Patient B panel 2D)] lead concentrations by the CLT model, in two patients. Patient A is an example of acute lead intoxication by traditional remedies and Patient B an example of chronic occupational lead exposure. Symbols represent the measured values (“○” for blood lead concentrations) and “∇” for urine lead concentrations) and the continuous lines represent the predictions of the CLT model. The arrows indicate the start and end of each chelation course.
![Figure 2. Simulations of the blood [Patient A (panel 2A) and Patient B (panel 2B)] and urine [Patient A (panel 2C) and Patient B panel 2D)] lead concentrations by the CLT model, in two patients. Patient A is an example of acute lead intoxication by traditional remedies and Patient B an example of chronic occupational lead exposure. Symbols represent the measured values (“○” for blood lead concentrations) and “∇” for urine lead concentrations) and the continuous lines represent the predictions of the CLT model. The arrows indicate the start and end of each chelation course.](/cms/asset/6d9c7720-e4b1-4f9b-a58f-f310bfc7cbbf/ictx_a_1263855_f0002_b.jpg)
The blood lead concentrations measured in each patient were used to calculate the individual lead–succimer apparent association constant and the daily additional dose of lead. These results are shown in . Apart from the calculation of the blood lead concentration, we also calculated the concentration of lead in the urine (). As expected, the sharp peak in urine lead concentrations is present only during the chelation therapy. For patient A, the urine lead concentrations calculated by the model were far less accurate than his actual urine lead concentration. For Patient B, the calculated urine lead concentration by the CLT model was reasonably accurate.
Table 2. Results of the parameter estimation.
shows the results of the sensitivity analyses for the lead–succimer apparent association constant for patients A and B ( for blood lead concentrations, for urine lead concentrations). We separately used varying lead–succimer apparent association constants and studied their impact on model predictions. Predictions with larger values for the lead–succimer apparent association constant (between +10 and +50%) resulted in lower blood lead concentrations, whereas predictions with smaller values (between −10 and −50%) resulted in higher blood lead concentrations. For Patient A, when the apparent association constant varied by 50%, blood lead concentration predictions changed by 20% and urine lead excretion varied by 30%.
Figure 3. Sensitivity analyses of the CLT model for Patients A and B. The graphs show the dependency of the blood [Patient A (panel 3A) and Patient B (panel 3B)] and urine [Patient A (panel 3C) and Patient B (panel 3D)] lead concentrations on the accuracy of the chosen lead–succimer apparent association constant (kapp). Predictions with the individually fitted lead–succimer apparent association constant are indicated by the continuous line. Predictions by varying the lead–succimer apparent association constant are indicated by dotted lines.
![Figure 3. Sensitivity analyses of the CLT model for Patients A and B. The graphs show the dependency of the blood [Patient A (panel 3A) and Patient B (panel 3B)] and urine [Patient A (panel 3C) and Patient B (panel 3D)] lead concentrations on the accuracy of the chosen lead–succimer apparent association constant (kapp). Predictions with the individually fitted lead–succimer apparent association constant are indicated by the continuous line. Predictions by varying the lead–succimer apparent association constant are indicated by dotted lines.](/cms/asset/16842306-2a6b-49ce-92ee-ae6fd368dcfe/ictx_a_1263855_f0003_b.jpg)
A variation by 50% in lead dose led to a change of 20% in blood concentration predictions and a 50% change in urine excretion. Determined and predicted blood lead concentrations of all seven patients are presented in . The results were consistent in all the seven patients.
Figure 4. Determined (symbols) and predicted (continuous line) blood lead concentrations of the seven patients included in the present study. Predictions were made with the CLT model.
Effect of chelation treatment
shows the impact of lead chelation therapy on blood lead concentrations. Two separate simulations were performed with the CLT model: with and without chelation therapy. The figures indicate that lead chelation therapy initially leads to a sharp drop in blood lead concentrations, although, later on, a rebound is found due to lead redistribution from bone tissue. If Patient A had not been chelated, the lead stores in the bone compartment would have been 15% higher than when the patient was treated.
Figure 5. Panels (A) and (B) show the predicted blood lead concentration with (—) and without (- - -) succimer chelation therapy. Panels (C) and (D) show the difference between the situation in which blood lead concentrations have been measured several times (continuous line, “Ideal Fit”) and the situation in which only the first blood lead concentration is available before starting the chelation therapy (dotted lines). In the ideal fit, the lead–succimer apparent association constant was fitted individually. In the situation where only one blood concentration is known, predictions were performed with the lowest and the highest fitted value of the lead–succimer apparent association constant determined among the seven patients included in this study (respectively, 6.0 × 10³/mmol and 20 × 103/mmol).
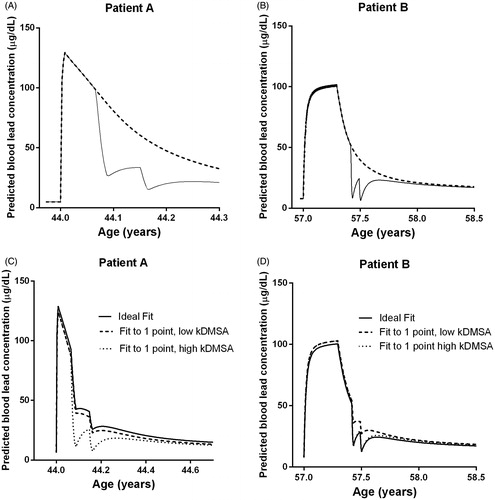
) shows the consequences of making predictions of blood lead concentrations based on a single blood sample available at hospital presentation (for Patients A & B). The daily dose of lead in a patient was calculated on the basis of the exposure history and the first blood lead concentration available. In these simulations, the highest and lowest values for the lead–succimer apparent association constant determined in the seven patients analyzed were applied in order to obtain an idea of the uncertainty associated with such an approach. Calculating the daily dose of lead for a patient with just one blood lead concentration, together with the maximum and minimum values of the lead–succimer apparent association constant, provided a curve reasonably similar to the one based on all available actual blood lead concentrations (designed as “Ideal Fit” in ). Therefore, even with limited information on the lead exposure dose of a patient, the CLT model can provide some preliminary calculations. As time progresses and more blood lead measurements become available during the chelation treatment, these can be used to achieve more accurate predictions of blood lead concentrations.
Predictions with the CLT model for all the other patients are shown in the Supplementary Material Section (Figures 6–13). Figure 6 (Supplementary) shows the urine lead concentrations calculated by the model for the seven patients. Sensitivity analyses with varying lead–succimer apparent association constant are shown in Figures 7 and 8 (Supplementary); sensitivity analyses with varying lead exposure dose are shown in Figures 9 and 10 (Supplementary). Figures 11 and 12 (Supplementary) show the effect of chelation treatment for all seven patients and Figure 13 (Supplementary) shows the model predictions based on a single pre-chelation blood lead concentration.
Discussion
Combining a succimer kinetic model and the lead PBPK model developed by O’Flaherty,[Citation8] allowed us to predict the effect of succimer therapy on lead kinetics. This study represents a first attempt to model the interaction of lead and succimer during lead intoxications, by using PBPK modeling techniques. Our simulations showed that the resulting model, the CLT model, could adequately predict blood lead concentrations in humans during and after succimer chelation therapy. The pattern of urinary excretion was successfully predicted in some patients, poorly in others.
Human volunteer studies with relevant lead doses would be unethical. We therefore used data from patients poisoned by lead. We illustrated the output of our model in detail for two patients: Patient A with acute lead intoxication after using traditional remedies for three days, and Patient B with chronic occupational exposure to lead. The subjects’ heterogeneity was large but reflected clinical toxicology practice. The model’s performance was better in some patients than in others. Considering all patients, the model simulated blood lead concentrations well, for both inhalation and oral exposure, indicating that the model has an adequate structure and realistic parameter values.
Inter-individual variability and/or uncertainty about the lead–succimer apparent association constant were present and difficult to model. While similar values may be expected, this parameter varied by a factor of three among the seven patients, which could be explained by differences in individual succimer blood concentrations and blood lead concentrations. Note that in the CLT model, the PBPK model for lead in humans contains many physiological parameters concerning human physiology. Standard values are given for men and women, for both Caucasian and Negroid race (but not for Mongoloid race). Although all these parameters can basically be varied, this is impractical for application in hospital practice. Moreover, standard values are given for life-long oral and inhalation background exposure, leading to background lead concentrations in blood. Again, it would be impracticable to vary these for each patient, simply because such information is unavailable.
Also note that in the CLT model a standard kinetic model for succimer in plasma is applied, without any consideration of human inter-variability. Again, it would be unfeasible to vary all these standard parameter values, as the patients’ succimer kinetics in plasma are unknown before the application of the CLT model. It might be that differences in succimer plasma kinetics for different patients can be relevant for lead kinetics. Inter-individual variability may give a partial explanation of the differences in the lead–succimer apparent association constant.
Sensitivity analyses were performed to visualize the effect of possible uncertainties in the daily dose of lead and the lead–succimer apparent association constant. These analyses showed that calculated blood concentrations were relatively insensitive to shifts in the value of the lead–succimer apparent association constant and the daily dose of lead. Note that there is saturable binding of lead to erythrocytes. Doubling the lead exposure dose will not double blood lead concentrations, because red blood cells are already saturated with lead. Higher lead concentrations in plasma will increase renal excretion and redistribution to other tissues. We observed that the predicted urine lead concentrations changed more than the blood lead concentrations in response to changes in exposure dose and lead–succimer apparent association constant. In practice, blood lead concentrations remain the most widely used marker for inorganic lead poisoning as they are easier to measure than urine lead concentrations, even though they do not reflect the amount of lead stored in the body. Furthermore, the daily dose could be reasonably calculated, based only on the lead exposure history and one single blood concentration.
Clinical practitioners could benefit from the model mainly in situations of chronic poisoning. After a chelation treatment cycle, the blood lead concentration will decrease. However, lead stored in bone continues slowly to redistribute into the rest of the body (“rebound”). Therefore, the blood lead level must be checked some weeks after the end of the treatment cycle. The model could help predict how many chelation sessions are necessary and whether additional treatment sessions are indicated at the end of the first chelation treatment cycle. Furthermore, before starting treatment, the disadvantages of prolonged chelation therapy should be weighed against the benefits. Predicting the possible benefit of chelation therapy would support decision making in clinical practice.
Before using the CLT model in clinical practice, it is important to perform an external validation of it. This may prove to be difficult due to the scarcity of well-documented lead intoxications, particularly in children, as the exposure dose of lead is almost always unknown. Nevertheless, our succimer kinetic model and the lead PBPK model developed by O’Flaherty have been externally, separately and successfully validated. The interaction of lead with succimer in plasma, represented by the value of the lead–succimer apparent association constant, is the only aspect that has not been previously validated. However, the sensitivity tests discussed above indicated that the lead blood concentration calculated by the CLT model is relatively insensitive to inaccuracies of this parameter.
The presentation of the model itself will be the next point of interest once the description of the mathematical technique used to develop the model and the model performance have been evaluated. Further research on the applicability of the model into clinical practice is therefore needed.
In short, we upgraded an existing lead PBPK model to predict the effect of succimer chelation on blood and urine lead concentrations in patients intoxicated with lead. In future, we aim to extend our CLT model with kinetic models for other lead-chelating agents. This would help to determine the effect of different chelating agents on the distribution of lead throughout the body.
Supplementary Figure 13
Download PDF (63.2 KB)Supplementary Figure 12
Download PDF (48.5 KB)Supplementary Figure 11
Download PDF (51.4 KB)Supplementary Figure 10
Download PDF (117.9 KB)Supplementary Figure 9
Download PDF (135.7 KB)Supplementary Figure 8
Download PDF (110.6 KB)Supplementary Figure 7
Download PDF (115.6 KB)Supplementary Figure 6
Download PDF (39.3 KB)Acknowledgements
We thank Dr E. O’Flaherty very warmly for making her lead PBPK model codes available to us.
Disclosure statement
The authors report no declarations of interest.
Additional information
Funding
References
- Nelson LS, Lewin NA, Howland MA, et al. Goldfrank’s toxicologic emergencies. 9th ed. New York: McGraw-Hill; 2011.
- Bradberry S, Vale A. Dimercaptosuccinic acid (succimer; DMSA) in inorganic lead poisoning. Clin Toxicol. 2009;47:617–631.
- Bradberry S, Vale A. A comparison of sodium calcium edetate (edetate calcium disodium) and succimer (DMSA) in the treatment of inorganic lead poisoning. Clin Toxicol. 2009;47:841–858.
- Kosnett MJ. Chelation for heavy metals (arsenic, lead, and mercury): protective or perilous? Clin Pharmacol Ther. 2010;88:412–415.
- Canfield RL, Henderson CR Jr, Cory-Slechta DA, et al. Intellectual impairment in children with blood lead concentrations below 10 μg per deciliter. N Engl J Med. 2003;348:1517–1526.
- Lanphear BP, Dietrich K, Auinger P, et al. Cognitive deficits associated with blood lead concentrations <10 microg/dL in US children and adolescents. Public Health Rep. 2000;115:521–529.
- Leggett RW. An age-specific kinetic model of lead metabolism in humans. Environ Health Perspect. 1993;101:598–616.
- O'Flaherty EJ. Physiologically based models for bone-seeking elements: IV. Kinetics of lead disposition in humans. Toxicol Appl Pharmacol. 1993;118:16–29.
- Rabinowitz M. Historical perspective on lead biokinetic models. Environ Health Perspect. 1998;106:1461–1465.
- Environmental Protection Agency. Review of adult lead models evaluation of models for assessing human health risks associated with lead exposures at non-residential areas of superfund and other hazardous waste sites [Internet]. Washington; 2001. [cited 2016 May 18]. Available from: http://www.epa.gov/superfund/lead/products/adultreview.pdf.
- White PD, Van Leeuwen P, Davis BD, et al. The conceptual structure of the integrated exposure uptake biokinetic model for lead in children. Environ Health Perspect. 1998;106:1513–1530.
- O'Flaherty EJ. Physiologically based models for bone-seeking elements. V. Lead absorption and disposition in childhood. Toxicol Appl Pharmacol. 1995;131:297–308.
- O'Flaherty EJ. A physiologically based kinetic model for lead in children and adults. Environ Health Perspect. 1998;106:1495–1503.
- van Eijkeren JCH, Olie JDN, Bradberry SM, et al. Modelling dimercaptosuccinic acid (DMSA) plasma kinetics in humans. Clin Toxicol. 2016;54:833–839.
- Asiedu P, Moulton T, Blum CB, et al. Metabolism of meso-2,3-dimercaptosuccinic acid in lead-poisoned children and normal adults. Environ Health Perspect. 1995;103:734–739.
- Aposhian HV, Aposhian MM. Meso-2, 3-dimercaptosuccinic acid: chemical, pharmacological and toxicological properties of an orally effective metal chelating agent. Annu Rev Pharmacol Toxicol. 1990;30:279–306.
- Maiorino RM, Aposhian MM, Xu ZF, Li Y, et al. Determination and metabolism of dithiol chelating agents. XV. The meso-2, 3-dimercaptosuccinic acid-cysteine (1:2) mixed disulfide, a major urinary metabolite of DMSA in the human, increases the urinary excretion of lead in the rat. J Pharmacology Exp Ther. 1993;267:1221–1226.
- Bradberry S, Sheehan T, Vale A. Use of oral dimercaptosuccinic acid (succimer) in adult patients with inorganic lead poisoning. QJM. 2009;102:721–732.
- Harrell FE Jr, editor. Regression modeling strategies with applications to linear models, logistic regression, and survival analysis. In: Overview of maximum likelihood estimation. New York: Springer-Verlag New York Inc; 2001. p. 179–213.