
Abstract
Past population dynamics play a key role in integrated models of socio-cultural change in Polynesia. A key aspect of these models is the interplay between food production and population growth. Located on the margins of Polynesia, New Zealand presented considerable challenges to traditional Polynesian food production, many crops were not successfully established and those that were produced greatly reduced yields. However, despite the hurdles to food production and the likely influence on population, little empirical analysis of Māori population has been carried out in New Zealand. Here, we use summed probability distributions of radiocarbon dates (SPDRD) to show clear regional and local variation population dynamics. Specifically, we find population in the optimal horticultural zone follows a logistic pattern of growth, while in the sub-optimal zone both a modified logistic curve, representing slower growth than the north, or a “stepped” pattern are supported. In the non-horticultural south our results concur with previous studies that suggest population rapidly grew and then declined as faunal resources diminished. Finally, our analysis of local-scale growth showed considerable heterogeneity within the horticultural zone and homogeneity in the southern hunting region. This suggests that population trends were similar in southern areas, but finer-grained models are required for horticultural communities. Crucially, our results are empirically derived and can be placed within an absolute chronological context allowing further investigation of key trends.
Introduction
Population size, density, and dynamics have long occupied a central stage in the anthropological and archaeological debates, from early conflicts between Malthusian and Boserupian views on carrying capacities (Lee Citation1986), to the more recent dispute on their role in explaining cumulative cultural evolution (see Henrich et al. Citation2016 and Vaesen et al. Citation2016). Demography has also been identified as a catalyst for a wide range of social behaviors, including group fission/fusion dynamics, changes in land tenure systems, and inter-group conflict (Crema Citation2014; Kelly Citation2013; Turchin Citation2005). Reconstructing past demographic patterns thus is an important component in developing integrated explanations of long-term change in the archaeological record (Shennan Citation2000).
Polynesia is a region in which the importance of population dynamics in socio-cultural change is well recognized (e.g., Kirch Citation1984; Kirch and Rallu Citation2007 [and references therein]; Puleston and Tuljapurkar Citation2008). Kirch (Citation1984:103) proposed a range of population growth scenarios for Polynesian islands from which a generalized logistic pattern is most widely applied (). This pattern consists of a small founding population, which underwent rapid demographic expansion, fueled by the exploitation of pristine environments rich in wild resources (Anderson Citation2002; Walter et al. Citation2006). These resources supplemented limited returns during the establishment and transition to food-producing economies (Kennett et al. 2006). Agricultural expansion and intensification led to further population growth, investment in landesque capital (Ladefoged and Graves Citation2007), and expansion of production into marginal zones (Kirch Citation1984, Citation2007b). Ultimately, when productive and spatial expansion was exhausted, environmental constraints and/or social processes imposed by emerging socio-political hierarchies led to a reduction in growth and leveling-off of populations (Kirch Citation1984).
Figure 1. Population growth scenarios (adapted from Kirch Citation1984).
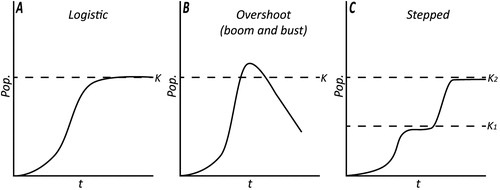
Despite the applicability of this model at a broad scale, it is widely recognized that feedback loops between ecological, demographic, and cultural factors led to unique regional-scale variation in population growth and related cultural patterns (Kirch Citation2007b; ). In particular, the suitability of regional environments for Polynesian food production and the level of friction associated with establishing these systems were key contributors to population growth patterns (Anderson Citation2001; Kirch Citation2007a; Kirch et al. Citation2004; Lee and Tuljapurkar Citation2008; Thomas Citation2008). Because of this, the construction of palaeodemographic models at a local and regional scale is a key step in developing a finer-grained understanding of the past. Such an exercise is imperative in New Zealand where conditions bare sharp contrast to elsewhere in Polynesia and where no reliable, empirically based models of population growth currently exist.
New Zealand is an isolated landmass lying across the sub-Tropical to sub-Antarctic zones, well outside the tropical climes familiar to its first colonists. New Zealand’s relatively cool climate was hostile to tropically adapted Polynesian domesticates; many crops species were not successfully established and those that were produced greatly reduced yields (Leach Citation1984; Walter et al. Citation2006). The major impact of such conditions appears to be on the maximum size of population in New Zealand, argued to be around 90,000 people ( Pool Citation2015; but see Chapple Citation2017), which represents a population density at least 10 times smaller than Hawai’i (Kirch Citation1984). This low population density, coupled with a relatively short sequence has been suggested as a potential cause of lower levels of socio-political organization in pre-contact New Zealand (Kirch Citation1988).
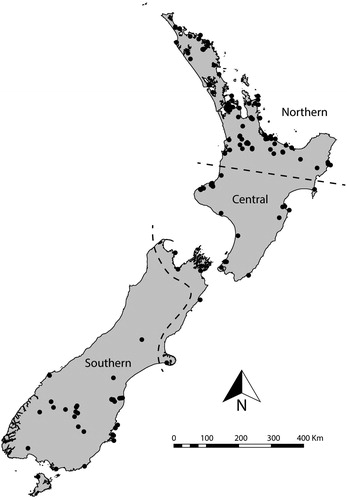
The large latitudinal range and varied topography also created differential conditions for crops. Northern New Zealand () is warmer, less susceptible to frosts, and is generally regarded as the optimal horticulture zone in the country (Walter et al. Citation2006). Central New Zealand presented cooler, harsher conditions for tropically adapted cultigens, which necessitated a greater focus on supplementary foraging activities throughout the pre-contact sequence and southern New Zealand has limited or no evidence for horticultural activity (Basset et al. 2004; Leach Citation1984; Walter et al. Citation2006). These patterns led to an extremely uneven distribution of Māori population, concentrated in the northern regions, which is indicative of variation in population history (Davidson Citation1984).
Figure 2. Distribution of sites yielding radiocarbon dates for this analysis and the three economic sub-regions of New Zealand used in this analysis.
Despite these differences, the current understanding of Māori population growth is relatively limited, with generic models borrowed from tropical Polynesia typically used. The horticultural zone is treated as homogeneous in terms of population dynamics, with a logistic pattern of growth favored (Davidson Citation1984; McGlone et al. Citation1994). The application of the logistic model is based on two strands of evidence. The first is an analysis of osteological material by Brewis et al. (Citation1990), which is highly problematic due to its use of variables (e.g., starting population size, length of prehistoric sequence) and methods (e.g., counting bone pitting associated with pregnancy) that, since publication, have been revised or rejected (Anderson Citation1991; Ubelaker and De La Paz Citation2012). The second is indirect evidence, such as the development of pā. Pā are fortified sites connected with defense, group identity, and status signaling (Barber Citation1996; Walton Citation2001). Their emergence is regarded as a marker of increased resource competition bought on by a population at carrying capacity (Anderson Citation2016; Davidson Citation1984; Groube Citation1970). Thus, the appearance of pā around AD 1500 (Schmidt Citation1996) is used as a temporal marker for the onset of the “leveling-off” period of logistic population growth.
Similar indirect evidence is also used to infer patterns of population in the non-horticultural southern zone. Here, archaeological evidence suggests early sites were located in rich resource patches where high-ranking resources (e.g., seals [Arctocephalus forsteri] and moa [Aves: Dinornithiformes]) formed the basis of the local economy and fueled early growth (Anderson and Smith Citation1996; Smith Citation2011). Continued hunting led to decreasing foraging efficiency and eventual abandonment of one patch for another until resources were exhausted within the region (Anderson and Smith Citation1996; Nagaoka Citation2002). The inability to grow tropical Polynesian crops in the southern region (Basset et al. 2004) meant that this faunal collapse was potentially catastrophic for local populations (Anderson and Smith Citation1996; Jacomb et al. Citation2010). Thus, archaeologists argue that the pattern of population change may consist of an initial “boom”, followed by a “bust” after the collapse of faunal resources (Jacomb et al. Citation2010).
While indirect evidence allows the inference of generic patterns of growth anchored to key events in the sequence, its weakness is the inability to identify specific spatio-temporal variations, which provide a nuanced view of past population. Such variation is not only possible but likely given variation in economic conditions present in New Zealand and the evidence from historical sources and recent modeling of a disparity in the spatial density of populations (Davidson Citation1984; McCoy Citation2017). This paper uses summed probability distributions of radiocarbon dates (SPDRD) to develop empirical models of Māori population growth in the southern Polynesian islands of New Zealand. Using recently developed quantitative methods (Crema et al. Citation2016, Citation2017; Shennan et al. Citation2013; Timpson et al. Citation2014) we assess the veracity of the logistic growth model at a national and regional scale. We then investigate spatial variation in population growth both with and without the imposition of a priori regional divisions to develop a multi-scalar understanding of population growth over time in New Zealand.
Summed Probability Distributions of Radiocarbon Dates in New Zealand
This research uses SPDRD to develop proxies for Māori population. The basis of this method is the assumption that a relationship exists between the number of dates and population size (Rick Citation1987; Shennan et al. Citation2013). While the reliability of SPDRD as a proxy for population change has been questioned (e.g., Torfing Citation2015; but see Timpson et al. Citation2015), and ideally they should be part of a suite of independent proxies (see Downey et al. Citation2014; Palmisano et al. Citation2017), their construction within an absolute chronological framework makes them exceptionally well suited for cross-regional studies (see Crema et al. Citation2017 for review). Moreover, in the absence of other data (e.g., house floors) in the New Zealand context, SPDRD are the best method available to investigate Māori population. One of the major issues in the use of SPDRD has been the reliance on visual interpretation of curves, which is problematic and potentially misleading given the idiosyncrasies of the calibration process (Contreras and Meadows Citation2014). To overcome this issue a number of quantitative approaches have been recently developed (e.g., Crema et al. Citation2016; Shennan et al. Citation2013; Timpson et al. Citation2014), which provide a statistical framework for comparing observed SPDRD against a variety of null models selected to address specific research questions (see below).
Data
To produce our SPDRD a large body of radiocarbon dates were collected from the online New Zealand Radiocarbon database (http://www.waikato.ac.nz/nzcd/) and from published and gray literature. We have taken a conservative approach to date selection, focusing only on charcoal or wood dates. These materials represent the remains of activities that occurred consistently throughout the sequence thus avoiding bias caused by changing cultural behavior (see ESM for more detail). Available wood and charcoal dates were screened for reliability prior to analysis. The 334 dates included in this analysis were derived from species with a small to medium inbuilt age (McFadgen et al. Citation1994) and secure archaeological context, single dates from sites were retained for the purposes of this research. Rejected dates included those derived from species with high inbuilt age (McFadgen et al. Citation1994) and/or dubious context (see ESM for more information).
While a minimum sample size of 500 dates has been proposed in the past (Williams Citation2012), this estimate does not take into account spatial and temporal scale (the estimate was based on the assessment of a ca. 40,000 year sequence in Australia), nor it is based on formal power analysis associated with specific statistical tests and null hypotheses. While we are not able to estimate the precise power of our analysis (and hence cannot estimate the probability of accepting a false null hypothesis) we regard the reduction of type-I error (i.e., incorrect rejection of a true null hypothesis) as more closely aligned with our objectives. Therefore we consider a sample of 334 radiocarbon dates across the ca. 500-year pre-contact sequence as sufficient.
Regions
To investigate if population dynamics vary across the economic regions discussed above we formalized the boundaries of these regions based on the occurrence and density of horticultural features (e.g., food storage pits), which provide a reasonable—if coarse—proxy for levels of horticultural food production (). The northern region is defined here as the area containing approximately 80 percent of recorded pit sites in New Zealand. The central region is defined as the remaining areas where evidence of horticulture is present while the Southern region is defined by the absence of horticultural features (Basset et al. 2004). Any bias introduced by the regional classification is offset by the use of the spatial permutation test (outlined below), which does not use a priori regional divisions.
Methods
This paper draws on a range previously published methods developed to quantitatively assess SPDRD (Crema et al. Citation2016, Citation2017; Shennan et al. Citation2013; Timpson et al. Citation2014). These methods are outlined in detail in these publications and in the ESM; here we provide a basic description of the techniques we employed and their relationship to the goals of this research.
Creating SPDRD
The creation of SPDRD and subsequent analyses were carried out in the R Statistical environment (R Core Team Citation2017) using the rcarbon package (Bevan and Crema Citation2017). Multiple dates from a single context were “binned” to reduce “wealth bias” (i.e., significant inter-site and inter-context differences in sampling intensity); samples from the same site separated by more than 100 radiocarbon years were grouped into separate bins (). Dates were then calibrated and pooled within the bins to ensure archaeological context contributed only a single date distribution to the overall SPDRD (see Timpson et al. Citation2014; Figure S2). Calibration was carried out using the southern hemisphere 13 calibration curve (Hogg et al. Citation2013); dates were not normalized in order to avoid artificial peaks in the SPRD (see Weninger et al. Citation2015). Finally, the pooled mean probabilities from the bins were summed to produce an empirically based SPDRD, which was smoothed using a 50-year rolling mean.
Table 1. Breakdown of radiocarbon dates and “bins” used in this analysis.
Model Testing
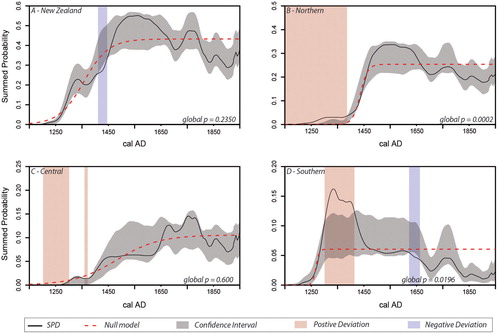
Our first analysis tests the hypothesis that Māori population growth at both a national and regional scale conforms to a logistic pattern. Following the procedures outlined in ESM (Section 2) we statistically compare the observed SPDRD to the simulation envelopes generated from fitted logistic models (the null models). Null model envelopes for the first two analyses were based on 5,000 random permutations. Instances where the observed SPDRD falls outside the envelope (red and blue areas in and Figure S3) are regarded as significant local departures, while the extent to which the observed SPDRD differs from the null is assessed using a global p-value.
Permutation Testing
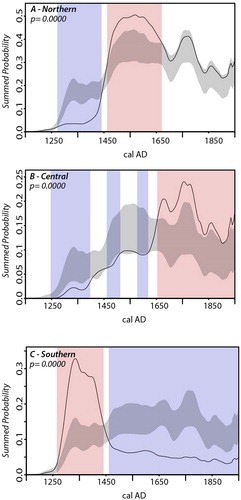
The second analysis focuses on understanding regional variation in population dynamics (ESM—Section 3). To do this we compare each region's SPDRD to a null model representing a proxy of New Zealand wide Māori population dynamics. Here, the null hypothesis is that all regional SPDRD will have the same shape, indicating they are derived from the same underlying pattern of population growth. Thus, any deviation from the null model (red or blue areas in , Figure S4) can be interpreted as regional variation in population dynamics.
Figure 3. Model tests showing the similarity between observed data and fitted logistic models of growth. Observed SPDRD for each region shown with a solid black line, fitted null model (logistic growth) shown with the red dashed line, gray areas represent the confidence envelope derived from the null model. Red and blue bands represent areas where the observed SPD significantly deviates from the null model (e.g., red areas are those where regional population exceeds the expectations of the null, blue areas are those where population is beneath expectations).
Spatial Permutation Test
Finally, in recognition of the potential impact of applying a priori regional divisions in our analysis, we apply the spatial extension of SPDRD analysis proposed by Crema et al. (Citation2017). The spatial permutation test develops local growth models using a spatial bandwidth of 100 km (see ESM for sensitivity analysis) and compares this to a null model representing the growth rate across New Zealand. As in the previous analysis, the null model is that growth is spatially homogeneous and therefore significant deviations from the trend are represented by either hot spots (greater than expected growth) or cold spots (lower than expected growth). Hot and cold spots are derived using p-values; however, due to potential inflation of type I error derived by multiple testing, we also provide q-values (false discovery rates; see Crema et al. Citation2017 for details).
Results
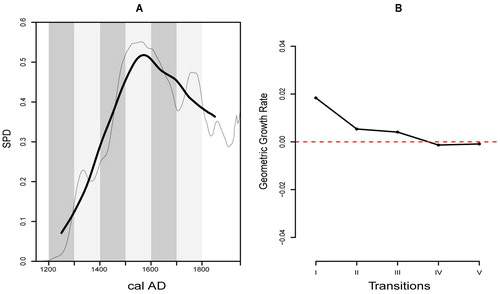
Before discussing the specific results we wish to highlight a key trend that aids in the interpretation of the and . Using the observed New Zealand SPDRD () as an example, we can see a pattern of growth until ca. AD 1500–1550 at which point growth “levels off” and appears to decline later in the sequence. We regard this pattern as spurious based on evidence from the null models, where the underlying date distribution (dashed red line ) is known to be stable between AD 1500 and 1900, yet the calibrated date distribution (gray envelope ) displays peaks and a decline matching the observed SPDRD. Thus, we argue this pattern is the outcome of the calibration process (see McFadgen et al. Citation1994) and not as a sign of a weakening Māori population at the end of the sequence (but see the discussion of the southern region below).
Figure 4. Permutation tests showing variation between regional population growth. Observed SPDRD for each region shown with a solid black line. Gray areas represent the confidence envelope for the null model, red and blue bands represent areas where the observed SPD significantly deviates from the null model (e.g. red areas are those where regional population exceeds the expectations of the null, blue areas are those where population is beneath expectations).
Model testing
The model testing approach was employed to test if regional population trends were consistent with a pattern of logistic growth. The results of this analysis were mixed. The New Zealand wide SPDRD () conforms to the confidence envelope developed from the fitted logistic model (global p-value = 0.2350), which is characterized by rapid growth until it levels off around AD 1500. Thus, at the national scale, we cannot reject the hypothesis that Māori population growth followed such a logistic trend.
The northern SPDRD () closely follows the envelope derived from the fitted logistic model; however, the global deviation between the observed and null models is regarded as significant by the test (global p-value = 0.0002). This is caused primarily by the higher than expected probability density of the observed curve before AD 1400, although it is worth noting that the remaining portions of the SPDRD fit comfortably within the simulation envelope predicted by the logistic growth model, suggesting this result probably represents a false rejection of the null.
No significant variation between the observed data and the null logistic model is present in the central region (global p-value = 0.0600). However, in this region, the fitted logistic model has a slower growth pattern with “leveling off” occurring around AD 1650–1700 (). Therefore, while we cannot reject the logistic model, it is important to understand that the shape of logistic growth is very different between the northern and central regions. Inspecting the central SPDRD, it also appears to form a “stepped” pattern where population grows to a point, levels off and then grows again (Kirch Citation1984:103). However, because these fluctuations are contained within the confidence envelope, we cannot regard them as significant in this instance. It is worth noting that this region has the smallest number of bins, and hence we cannot exclude the possibility that the lack of a significant deviation from the null is the result of low power.
The southern region significantly deviates from the null (global p-value = 0.0196). Given a qualitative assessment of the SPDRD suggests a “boom and bust” pattern is more likely, this result is unsurprising. However, the result reveals a difficulty with the model fitting process. Here, in order to optimize the fit to the data, the null model (dotted red line ) splits the difference between the early peak and later lower density in the SPDRD and does not rise to peak population (ca. AD 1350) and then level off as we would expect. Were it to do so it seems certain that much more of the later end of the SPDRD would fall outside the simulation envelope.
Permutation Tests
The permutation testing approach compares regional population growth with a model representing general growth trends in New Zealand (i.e., not an idealized model as in the previous analysis). shows that all regions significantly deviate from the null model (global p-value = 0.0000 for all). This confirms that, despite support for the logistic model at the national scale, there are significant regional differences in the timing and nature of population change.
The northern region () exhibits a significantly lower density of dates in the early phase until approximately AD 1450–1500 at which point it either exceeds or is on trend with the pattern New Zealand wide. This suggests that population density was relatively low in the early period and was instead concentrated in the period after AD 1450 where it was much denser than elsewhere in New Zealand.
The central SPDRD () has a lower than expected density of dates early, although it is closer to the null model than the northern region. The initial growth peaks and levels off at AD 1450 until ca. AD 1650 where it rapidly grows and levels off at a greater than predicted density. The model testing using a smoothed logistic curve found this pattern could be attributed to logistic growth; however, the permutation test shows that a mid-sequence “flattening” of growth, as well as the rise in population after ca. AD 1650, is significant. Thus, a stepped pattern of growth can also be regarded as a reasonable model for central New Zealand.
Finally, the southern region shows a higher density of dates in the early period of the sequence with a sharp decline after approximately AD 1450 followed by a leveling off of the population at a greatly reduced density than that predicted by the null (). This result is consistent with a boom and bust scenario, albeit one where small populations remain in the region (Hamel Citation1982).
Spatial Permutation Test
Our final analysis assesses spatial variation in population growth without the use of a priori regional classifications, which we note are coarse and may obscure finer-grained patterns. shows the pattern of geometric population growth in New Zealand and the five transitions at which we measure growth (I: AD 1200–1300 to 1300–1400; II: AD 1300–1400 to 1400–1500; III: AD 1400–1500 to 1500–1600; IV: AD 1500–1600 to 1600–1700; and V: AD 1600–1700 to 1700–1800). highlights the general growth rate at each of these transitions. The results are consistent with the expected patterns of logistic growth—initial rapid growth followed by a reduction of growth towards zero once carrying capacity is reached.
Figure 5. A, the observed SPDRD for New Zealand (thin black line) with a 50-year rolling mean (thick black line) showing the growth trajectory across each of the transitions (I-V). B, observed rate of growth at each transition computed from the SPDRD in A.
Assessment of the raw local growth rates across the five-time slices () shows a clear variation, although, at this point, the results may be influenced by the calibration phenomena discussed above. To overcome this we compare the local growth patterns to a null model based on national growth trends (). The purpose of this analysis is to identify significant positive or negative deviations (hot and cold spots) from this trend.
Figure 6. Local geometric growth rate for each transition.
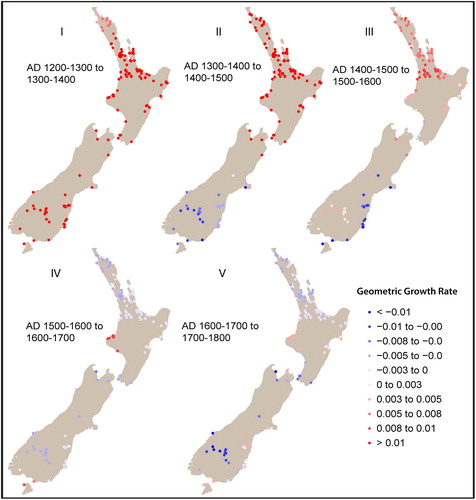
Figure 7. Spatial permutation test showing areas where growth is significantly higher or lower than the null. Significance is shown in terms of q-values (more robust against false positives) and p-values.
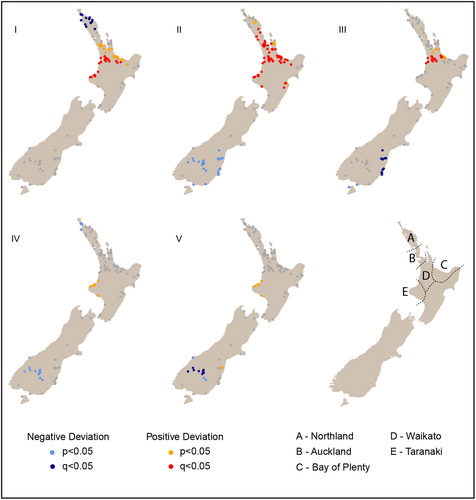
Our results () suggest there is significant spatial heterogeneity in the growth rates within and between the three areas defined in previous analyses, although there is little evidence of spatial heterogeneity within the southern region. This may suggest that population growth in the non-horticultural zone generally followed the same trend, but varied significantly in the horticultural zone, such that a basic optimal/sub-optimal division does not sufficiently capture the variation, particularly during early transitions.
Over the first three transitions, population growth is strongest in the northern half of the North Island, with hot spots consistently present in the Western Bay of Plenty, Waikato, and Auckland areas (). Interestingly, while Northland displays growth (), it is lower than expected in transition I (AD 1200–1300 to 1300–1400; ) despite presenting optimal climatic conditions for crops. This result may also explain the pattern of growth in the northern regional SPDRD; hot spots and on-trend growth areas may have been significantly tempered by the Northland cold spot producing a slower growth pattern than expected. In the final two transitions (IV: AD 1500–1600 to 1600–1700; and V: AD 1600–1700 to 1700–1800) North Island population appears to have stabilized, with one area of divergence. This is a hot spot in Taranaki () which may account for the later growth of population in the central region SPDRD. The specific causes of such local-scale patterns are beyond the scope of this paper, but should form the basis of future research.
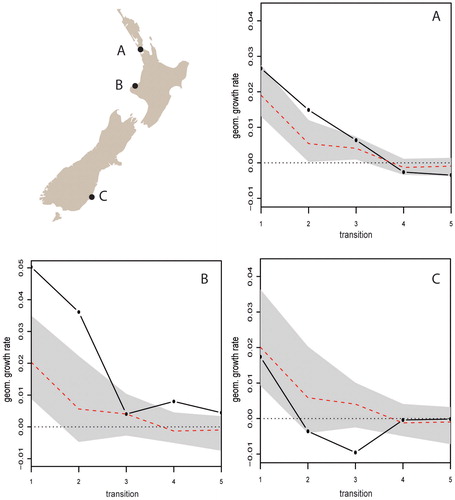
As already mentioned, the non-horticultural zone (southern region) exhibits relatively homogeneous population dynamics, with on-trend growth in transition I (AD 1200–1300 to 1300–1400) followed by significant decreases in the remaining transitions. This homogeneity may relate to the low sample size in the region, but it is also generally consistent with population growth followed by decline. These results suggest an absence of a “boom” or hot spot in southern New Zealand during transition I or transition II (AD 1300–1400 to 1400–1500) as observed in our regional models. Interrogating this result further we find that, on average, the southern region does exhibit higher geometric growth in transition I (e.g., northern = 0.0103 v. southern = 0.0179). However, as demonstrates, the lower density of sites in the bandwidth creates a wider significance band that incorporates the variation of the individual local SPDRD leading the model to regard it as insignificant. Here we see that growth in the first transition is higher than the theoretical expectations (dashed red line) in the three sites but the simulation envelopes are substantially wider for sites B and C because of the smaller sample size (i.e., smaller number of sites in the local bandwidth). This can be overcome by increasing the spatial bandwidth; however, this effectively returns us to large-scale regional analysis.
Figure 8. Observed geometric growth rates at three locations in New Zealand. Where growth at a transition falls outside the gray confidence envelope it is regarded as a significant local deviation from the null.
Discussion
This research has developed the first empirical models of pre-contact Māori population dynamics in New Zealand. Using advanced quantitative methods we have tested established ideas about the shape of population growth and their variation across different economic regions. The development of local SPDRD has revealed a diversity of population trajectories within the horticultural zone that contributes to a fine-grained picture of spatio-temporal variation in population dynamics. This can contribute directly to integrated models of cultural change in New Zealand.
As outlined earlier, while the logistic model of population growth is widely applicable to Polynesian societies, it requires testing due to context-specific feedback between people, culture, and environment (Kirch Citation2007b). The established population models in New Zealand have undergone no such scrutiny, therefore our first analysis sought to test if logistic growth was a reasonable model of growth at a national and regional scale. Taking the difficulties associated with the model fitting process into account, our results largely confirmed established ideas of Māori population growth. Specifically, that logistic growth was a reasonable model nationally and in the northern and central regions, which make up the horticultural zone. Despite a smaller sample size, logistic growth can be statistically rejected in the southern region where the SPDRD shows a “boom and bust” pattern consistent with what is suggested by the archaeological literature (Jacomb et al. Citation2010).
The non-rejection of logistic growth in the central region provides an interesting case study of one of the limitations of our approach. Specifically, we find that a modified logistic curve with relatively gradual growth and population peak around AD 1650 cannot be rejected. However, we note that the smooth growth of the null model is not replicated in the SPDRD where a “stepped” pattern is observed. Therefore, the reason for the non-rejection of the null may lie in the wide simulation envelope produced as a result of fewer data points in this region. Thus, while our analyses allow the rejection of specific null models, it does not provide a means to select the “best” model from a range of options as offered by other quantitative approaches (e.g., model selection methods).
While the above results are a useful contribution to New Zealand archaeology, the greater value in our results is the ability to provide a fine-grained understanding of spatio-temporal variations in Māori population growth. Focusing first on the southern region, a clear contrast with the other zones can be seen. While qualitatively based, our results appear consistent with the established “boom and bust” model (Anderson and Smith Citation1996; Hamel Citation1982; Jacomb et al. Citation2010). The rapid “boom” was probably fueled by access to big game species. During this period serial over-exploitation led to resource pressure (Anderson and Smith Citation1996; Nagaoka Citation2002). Decreasing foraging efficiency at sites was mitigated by the movement to new patches, so the length of the boom likely reflects the time it took to “hunt out” patches within the region. The “bust” around AD 1400 is broadly consistent with the timing of faunal collapse in the region. Smith (Citation2005) suggests seals were extirpated in southern New Zealand within 200 years of settlements, while detailed analysis of moa extinction suggests lowland species, which were more easily exploited, were hunted out within decades and that the total extinction of all moa in the South Island occurred by AD 1450 at the latest (Holdaway et al. Citation2014). This supports the idea that resource depression drove population decline or widespread abandonment of the southern region with some low-level occupation maintained (Anderson and Smith Citation1996; Jacomb et al. Citation2010).
Cross-referencing the growth curves it is apparent that the northern region exhibits growth during the period of decline in the south, which could be the result of endogenous growth and/or migration from the southern region. The arrival of even a few thousand immigrants (see Holdaway et al. Citation2014) could have had a significant impact on the competition for resources in the north and may have contributed to the appearance of pa. However, our data cannot differentiate endogenous growth from that which arises as a result of immigration, and more evidence is required before firm inferences can be made about the nature of population decline in the south and its impact elsewhere in New Zealand.
In the horticultural zone, the two regions present distinct patterns of growth. The northern region exhibits a pattern consistent with the generic logistic model outlined earlier in this paper. Unpacking this further, the regional model suggests exponential population growth until ca. AD 1500 after which growth levels off. The growth is relatively slow compared to the southern region where peak density is reached ca. AD 1350. This pattern is consistent with established scenarios of population growth (Davidson Citation1984; McGlone et al. Citation1994) and the expected economic model of the north. It is argued that northern populations were less reliant or had a lower degree of access to high-ranking wild resources, such as New Zealand fur seal and moa (Allen Citation2012; Walter et al. Citation2006), which fueled population growth in the other regions. Instead, higher temperatures, good rainfall and fewer frost days per annum—the optimal environment for horticulture in New Zealand—likely led to an early focus on establishing crops (Walter et al. Citation2006). While optimal in New Zealand, conditions in the north were still relatively harsh compared to Polynesia and it is likely that there was a significant period of experimentation (Barber Citation2010) and an associated lag in returns during the early period. Moreover, more optimal returns from food production are likely to be achieved through positive economies of scale (i.e., with increasing workforce) and with productive investment (Kennett et al. 2006), both of which may lead to a slower growth but ultimately denser populations.
The second part of the logistic model involves a decrease in growth rate as the population reaches carrying capacity. Established models of population growth in New Zealand infer this leveling-off from around AD 1500 based on the emergence of pā (fortifications) at this time (Davidson Citation1984; McCoy Citation2017; McGlone et al. Citation1994). Our model confirms the established frameworks in terms of timing and estimated higher density in the northern zone. Understanding exactly what this density was for analytical purposes (e.g., as a check of productive capacity estimates) is complicated by uncertainty around projections of Māori population size, which, as Chapple (Citation2017) points out, are currently based on estimates or methods with little empirical basis.
The central region provides the greatest deviation from established population models in New Zealand. While we cannot reject the logistic model in this region, we suspect the lower sample size, and therefore wider simulation envelope may obscure more subtle patterns. Indeed the permutation test suggests a “stepped” pattern of growth is also reasonable model for the region. The initial growth period in the central region follows a similar pattern to the north but levels off earlier and at a much lower density. Walter et al. (Citation2006) suggest the horticultural economy in this zone was marginal and was supplemented with wild resources. It is possible that, like the southern region, the loss of game resources by around AD 1450 (Holdaway et al. Citation2014) may have caused growth to stall, though the presence of horticulture in this region sustained population, albeit at a reduced density to optimal zones, after the loss of big game species. Another possibility is that climatic deterioration during the middle period of the New Zealand sequence led to the large-scale abandonment of gardens in central New Zealand as the southern extent of the horticultural zone retreated north (Anderson Citation2014). While some populations were lost, those in the northern central region continued, with the combined pattern leading to the observed mid-sequence leveling-off of growth. It is worth noting that these scenarios are not mutually exclusive.
A particularly interesting aspect of the central model is the second growth phase, which occurs around AD 1650. This growth may reflect the resurgence of populations in the northern central region after successfully adjusting their horticultural practices to the sub-optimal conditions. Alternatively and perhaps more convincingly given the rapid nature of the change, the population growth could be the result of an influx of people from within the densely populated and contested northern region. This later interpretation is supported by the permutation test, which shows the greater density of dates in the central region following a drop in density in the north (). It also matches oral traditions of population movements to the South Island and lower North Island during the latter part of the sequence (Anderson Citation2016), and is consistent with emerging narratives about the complexity of Māori settlement history (Maxwell et al. Citation2018) and patterns of population expansion from optimal to marginal environments in Polynesia (Kirch Citation2007a). Ultimately, whether a relatively gradual logistic model or stepped model is preferred, it is clear the pattern of population growth in the central region varies significantly from the optimal zone, particularly with respect to the timing of “peak” population.
The central population model demonstrates the possible implications of greater demographic understanding in New Zealand. For instance, it is generally accepted that pā emerge as a behavioral outcome of population density reaching carrying capacity, which leads to resource competition and greater inter-group conflict (Anderson Citation2014). Our northern model suggests maximum population density was reached around the same time as the commencement of pā construction in AD 1500 (Schmidt Citation1996). Yet, in the central region, peak population density occurs around AD 1650. Therefore, if we are to connect pā with populations at carrying capacity, this result raises the possibility that they were a later phenomenon in the central region.
McCoy’s (Citation2017) spatial analysis of pā dates, hints at some degree of southern progression of pā, but in his model pā appear concurrently across the North Island, although this may be due to the use of unfiltered dates in the analysis. The clearest hurdle to this interpretation is the AD 1500 date advanced by Schmidt (Citation1996). However, while Schmidt collected radiocarbon dates from pā across New Zealand, his reliability criteria reduced the number of dates down to 60, all of which were from within the northern region. Thus, a later date for pā construction in the central region is entirely possible given the current evidence.
Alternatively, the “flat” period of growth in the central region between AD 1450 and AD 1650 indicates some form of carrying capacity was met, which may have elicited a similarly competitive social arena and the development of pā around the same time as in the northern region. While this extinguishes the possibility of a later construction period it leads to the no less interesting question: by what mechanism did carrying capacity increase in the central region?
To this point we have discussed population dynamics according to economic regions; however, given the diversity of environments within some of these regions and the relatively coarse means by which the regions are defined, it was useful to investigate growth at a local scale. The application of the spatial permutation test (Crema et al. Citation2017) allows a greater understanding of intra-regional growth and the assessment of the regions as analytical units. With respect to intra-regional growth, the southern region does not seem to exhibit spatial heterogeneity in growth. While we cannot dismiss the fact that this is due to smaller sample sizes it is worth noting that such pattern would be consistent with the economically driven model of population growth discussed above, whereby food gathering and faunal collapse presented similar conditions throughout the region. For the horticultural zone, our results suggest the broad optimal/sub-optimal divisions of the northern and central regions obscure variation in population dynamics, particularly during the early centuries and within select areas, such as Taranaki, which exhibits a population hot spot during the later phase. The exact causes of these variations are beyond the scope of this paper; however, there is a clear need for greater understanding of the local-scale patterns and their underlying processes, particularly in terms of the establishment of horticulture and subsequent human/landscape interactions.
Conclusion
Population is widely recognized as a key component of socio-cultural change in the past. While widely researched elsewhere in Polynesia, the ephemeral nature of New Zealand’s archaeological record has made it difficult to achieve anything beyond generalized demographic reconstructions using traditional methods. Our results reveal broad agreement with established population models: optimal horticultural areas display logistic growth with denser population and probably more complex socio-political organization, while the non-horticultural southern region underwent relatively rapid growth before faunal collapse led to population decline or large-scale abandonment of the region. While the horticultural central region is often conceived as a whole in terms of population dynamics, our results showed clear divergence within the zone, which we argue relates to the suitability of environments for horticulture . Finally, our spatial permutation tests revealed local-scale variation both between and within regions. This suggests that, despite their explanatory utility, large-scale regional divisions obscure varied regional trajectories of growth that have the potential to elucidate more fully Māori cultural change in New Zealand. The investigation of these variations within the context of broader studies of human-landscape interaction during the settlement phase should be a key goal of New Zealand archaeology.
SUPPLEMENTAL
Supplemental content is available for this article at http://dx.doi.org/10.1080/15564894.2019.1605429.
Supplemental Material
Download PDF (1 MB)Acknowledgements
The authors wish to thank two anonymous reviewers, Atholl Anderson, Aimee Foster, Tim Thomas, and Mark McCoy for providing valuable feedback on early drafts of this paper. Andrew Bevan and Stephen Shennan played a key role during the early phase of this research.
FUNDING
AB was funded by the Leverhulme Trust project grant (ECF2016-355).
References
- Allen, M. 2012. Molluscan foraging efficiency and patterns of mobility amongst foraging agriculturalists: A case study from northern New Zealand. Journal of Archaeological Science 39(2):295–307.
- Anderson, A. 1991. The chronology of colonisation in New Zealand. Antiquity 65:767–795.
- Anderson, A. 2001. No meat of that beautiful shore: The prehistoric abandonment of subtropical Polynesian Islands. International Journal of Osteoarchaeology 11(1):14–23.
- Anderson, A. 2002. Faunal collapse, landscape change and settlement history in Remote Oceania. World Archaeology 33(3):375–390.
- Anderson, A. 2014. Emerging societies, AD 1500-1800. In Tangata Whenua: An Illustrated History (A. Anderson, J. Binney, and A. Harris, eds.). Wellington: Bridget Williams Books.
- Anderson, A. 2016. The making of the Māori middle ages. Journal of New Zealand Studies 23:2–18.
- Anderson, A. and I. W. G. Smith. 1996. The transient village in southern New Zealand. World Archaeology 27(3):359–371.
- Barber, I. 1996. Loss, change, and monumental landscaping: towards a new interpretation of the ‘Classic’ Māori emergence. Current Anthropology 37:868–880.
- Barber, I. 2010. Diffusion or innovation? Explaining lithic agronomy on the southern Polynesian margins. World Archaeology 42(1):74–89.
- Bassett, K., H. Gordon, D. Nobes, and C. Jacomb. 2004. Gardening at the edge: Documenting the limits of tropical Polynesian kumara horticulture in southern New Zealand. Geoarchaeology 19:185–218.
- Bevan, A., and E. Crema. 2017. rcarbon: Calibration and Analysis of Radiocarbon Dates. R package version 1.0.0.
- Brewis, A., M. Molloy, and D. Sutton. 1990. Modelling the prehistoric Māori population. American Journal of Physical Anthropology 81:343–356.
- Chapple, S. 2017. New Zealand numbers from nearly nowhere: 80,000 to 100,000 Māori circa 1769. New Zealand Journal of History 51(2):104–121.
- Contreras, D., and J. Meadows. 2014. Summed radiocarbon calibrations as a population proxy: A critical evaluation using a realistic simulation approach. Journal of Archaeological Science 52:591–608.
- Crema, E. 2014. A simulation model of fission-fusion dynamics and long-term settlement change. Journal of Archaeological Method and Theory 21:385–404.
- Crema, E., A. Bevan, and S. Shennan. 2017. Spatio-temporal approaches to archaeological radiocarbon dates. Journal of Archaeological Science 87:1–9.
- Crema, E., J. Habu, K. Kobayashi, and M. Madella. 2016. Summed probability distribution of 14C dates suggests regional divergences in the population dynamics of the Jomon Period in eastern Japan. PLOS ONE 11(4):e0154809.
- Davidson, J. 1984. The Prehistory of New Zealand. Auckland: Longman Paul.
- Downey, S., E. Bocaege, T. Kerig, K. Edinborough, and S. Shennan. 2014. The Neolithic demographic transition in Europe: Correlation with juvenility index supports interpretation of the Summed Calibrated Radiocarbon Date Probability Distribution (SCDPD) as a valid demographic proxy. PLOS ONE 9:e105730.
- Groube, L. 1970. The origin and development of earthwork fortifications in the Pacific. In Studies in Oceanic Culture History, Vol. 1 (R. Green and M. Kelly, eds.):133–164. Honolulu: Bishop Museum Press.
- Hamel, J. 1982. South Otago. In The First Thousand Years (N. Prickett, ed.):129–150. New Zealand Archaeological Association Monograph 13. Palmerston North: Dunmore Press.
- Henrich, J., R. Boyd, M. Derex, M. A. Kline, A. Mesoudi, M. Muthukrishna, A. Powell, S. Shennan, and M. Thomas. 2016. Understanding cumulative cultural evolution. Proceedings of the National Academy of Sciences 113(44):6724–6725.
- Hogg, A., Q. Hua, P. Blackwell, M. Niu, C. Buck, T. Guilderson, T. Heaton, et al. 2013. SHCal13 Southern Hemisphere calibration, 0–50,000 years cal BP. Radiocarbon 55(4):1889–1903.
- Holdaway, R., M. Allentoft, C. Jacomb, C. Oskam, N. Beavan, and M. Bunce. 2014. An extremely low-density human population exterminated New Zealand moa. Nature Communications 5:5436 doi:https://doi.org/10.1038/ncomms6436.
- Jacomb, C., R. Walter, and C. Jennings. 2010. Review of the archaeology of Foveaux Strait, New Zealand. Journal of the Polynesian Society 110(1):25–59.
- Kelly, R. 2013. The Lifeways of Hunter-Gatherers: The Foraging Spectrum, 2nd ed. Cambridge: Cambridge University Press.
- Kennet, D., A. Anderson, and B. Winterhalder. 2006. The ideal free distribution, food production, and the colonization of Oceania. In Behavioural Ecology and the Transition to Agriculture (D. Kennet and B. Winterhalder, eds.). Berkeley: University of California Press.
- Kirch, P. 1984. The Evolution of the Polynesian Chiefdom. Cambridge: Cambridge University Press.
- Kirch, P. 1988. Circumscription theory and sociopolitical evolution in Polynesia. American Behavioural Scientist 31(4):416–427.
- Kirch, P. 2007a. Paleodemography in Kahikinui, Maui. In The Growth and Collapse of Pacific Island Societies: Archaeological and Demographic Perspectives (P. Kirch and J. Rallu, eds.):90–107. Honolulu: University of Hawai’i Press.
- Kirch, P. 2007b. “Like Shoals of Fish”: Archaeology and population in pre-contact Hawaii. In The Growth and Collapse of Pacific Island Societies: Archaeological and Demographic Perspectives (P. Kirch and J. Rallu, eds.):52–69. Honolulu: University of Hawai’i Press.
- Kirch, P., A. Hartshorn, O. Chadwick, P. Viousek, D. Sherrod, J. Coil, L. Holm, and W. Sharp. 2004. Environment, agriculture, and settlement patterns in a marginal Polynesian landscape. Proceedings of the National Academy of Sciences 101(26):9936–9941.
- Kirch, P., and J. Rallu. 2007. The Growth and Collapse of Pacific Island Societies: Archaeological and Demographic Perspectives. Honolulu: University of Hawaii Press.
- Ladefoged, T., and M. Graves. 2007. Modelling agricultural development and demography in Kohala, Hawai’i. In The Growth and Collapse of Pacific Island Societies: Archaeological and Demographic Perspectives (P. Kirch and J. Rallu, eds.):70–89. Honolulu: University of Hawai’i Press.
- Leach, H. 1984. 1,000 Years of Gardening in New Zealand. Wellington: Reed.
- Lee, C., and S. Tuljapurkar. 2008. Population and prehistory I: Food-dependent population growth in constant environments. Theoretical Population Biology 73(4):473–482.
- Lee, R. 1986. Malthus and Boserup: A dynamic synthesis. In The State of Population Theory (D. Coleman and R. Schofield, eds.):96–130. Oxford: Blackwell.
- Maxwell, J., M. McCoy, M. Tromp, A. Hoffman, and I. Barber. 2018. The difficult place of deserted coasts in archaeology: New archaeological research at Cooks Beach (Pukaki), Coromandel, New Zealand. Journal of Island and Coastal Archaeology 13(1):1–20.
- McCoy, M. 2017. Geospatial Big Data and archaeology: Prospects and problems too great to ignore. Journal of Archaeological Science 84:74–94.
- McFadgen, B., F. Knox, and T. Cole. 1994. Radiocarbon curve variations and their implications for the interpretation of New Zealand prehistory. Radiocarbon 36:221–236.
- McGlone, M., A. Anderson, and R. Holdaway. 1994. An ecological approach to the Polynesian settlement of New Zealand. In The Origin of the First New Zealanders (D. Sutton, ed.):136–163. Auckland: Auckland University Press.
- Nagaoka, L. 2002. Explaining subsistence change in southern New Zealand foraging theory models. World Archaeology 34:84–102.
- Palmisano, A., A. Bevan, and S. Shennan. 2017. Comparing archaeological proxies for long-term population patterns: An example from central Italy. Journal of Archaeological Science 87:59–72.
- Pool, I. 2015. Colonization and Development in New Zealand between 1769 and 1900: The seeds of Rangiatea. Demographic Transformation and Socio-economic Development 3. Switzerland: Springer International. doi:https://doi.org/10.1007/978-3-319-16904-0
- Puleston, C., and S. Tuljapurkar. 2008. Population and prehistory II: Space-limited human populations in constant environments. Theoretical Population Biology 74(2):147–160.
- R Core Team. 2017. R: A language and environment for statistical computing. Vienna: R Foundation for Statistical Computing.
- Rick, J. 1987. Dates as data: An examination of the Peruvian preceramic radiocarbon record. American Antiquity 52:55–73.
- Schmidt, M. 1996. The commencement of pā construction in New Zealand prehistory. Journal of the Polynesian Society 105:441–460.
- Shennan, S. 2000. Population, culture history, and the dynamics of culture change. Current Anthropology 41(5):811–835.
- Shennan, S., S. Downey, A. Timpson, K. Edinborough, S. Colledge, T. Kerig, K. Manning, and M. Thomas. 2013. Regional population collapse followed initial agriculture booms in mid-Holocene Europe. Nature Communications 4:2486. doi:https://doi.org/10.1038/ncomms3486.
- Smith, I. W. G. 2005. Retreat and resilience: Fur seals and human settlement in New Zealand. In The Exploitation and Cultural Importance of Sea Mammals (G. Monks, ed.):6–18. Oxford: Oxbow Books.
- Smith, I. W. G. 2011. Pre-European Māori exploitation of marine resource in two New Zealand case study areas: Species range and temporal change. Journal of the Royal Society of New Zealand. doi:https://doi.org/10.1080/03036758.2011.574709.
- Thomas, T. 2008. The long pause and the last pulse: Mapping East Polynesian colonisation. In Islands of Inquiry: Colonisation, Seafaring and the Archaeology of Maritime Landscapes (S. O'Connor, G. Clark, and F. Leach, eds.):97–112. Canberra: ANU E Press.
- Timpson, A., S. Colledge, E. Crema, K. Edinborough, T. Kerig, K. Manning, M. Thomas, and S. Shennan. 2014. Reconstructing regional population fluctuations in the European Neolithic using radiocarbon dates: A new case-study using an improved method. Journal of Archaeological Science 52:549–557.
- Timpson, A., K. Manning, and S. Shennan. 2015. Inferential mistakes in population proxies: A response to Torfing’s “Neolithic population and summed probability distribution of 14C-dates.” Journal of Archaeological Science 63:199–202.
- Torfing, T. 2015. Neolithic population and summed probability distribution of 14C dates. Journal of Archaeological Science 63:193–198.
- Turchin, P. 2005. Dynamical feedbacks between population growth and sociopolitical instability in agrarian states. Structure and Dynamics 1(1). http://escholarship.org/uc/item/0d17g8g9.
- Ubelaker, D. and J. De La Paz. 2012. Skeletal indicators of pregnancy and parturition: A historical review. Journal of Forensic Sciences 57(4):866–872.
- Vaesen, K., M. Collard, R. Cosgrove, and W. Roebroeks. 2016. Population size does not explain past changes in cultural complexity. Proceedings of the National Academy of Sciences 113(16):2241–2247.
- Walter, R., I. Smith, and C. Jacomb. 2006. Sedentism, subsistence and socio-political organisation in prehistoric New Zealand. World Archaeology 38(2):274–290.
- Walton, A. 2001. The burden of defence in prehistoric New Zealand. Archaeology in New Zealand, 44(1):47–57.
- Weninger, B., L. Clare, O. Joris, R. Jung, and K. Edinborough. 2015. Quantum theory of radiocarbon calibration. World Archaeology 47:543–566.
- Williams, A. 2012. The use of summed radiocarbon probability distributions in archaeology: A review of methods. Journal of Archaeological Science 39:578–589.