
 ?Mathematical formulae have been encoded as MathML and are displayed in this HTML version using MathJax in order to improve their display. Uncheck the box to turn MathJax off. This feature requires Javascript. Click on a formula to zoom.
ABSTRACT
Global warming causes an increase in the average ambient temperatures worldwide, resulting in a further increase in the cooling load demand of indoor spaces such as buildings and agricultural greenhouses; both are critically important for humans and other living creatures. While fulfilling the cooling needs of such, there has also been a crucial constraint to reducing the energy consumption and carbon emissions associated with cooling systems. Alternative cooling approaches are being developed in hopes of replacing conventional refrigeration systems. This study first presents findings of a comprehensive comparative literature review and analysis of various active cooling cycles in three main categories: Vapor-compression cycles (vapor-compression with different hydrofluorocarbon, hydrochlorofluorocarbon, and eco-friendly refrigerants), thermally-driven cycles (absorption, adsorption, and ejector), and emerging cycles (elastocaloric, electrocaloric, magnetocaloric, thermoacoustic, thermoelectric, and thermotunneling). Then, it presents investigations on the development of a sustainability performance index to comprehensively compare different cooling approaches. The sustainability performance is derived from several parameters obtained from the environmental, economic, and energy impact of cooling. Vapor-compression cycles joined with two emerging technologies (i.e. electrocaloric and magnetocaloric) achieved high sustainability scores, where vapor-compression-R510A obtained the highest sustainability score of 76.77%, followed by electrocaloric and vapor-compression-RE170, scoring 75% and 73.3%, respectively.
GRAPHICAL ABSTRACT
Introduction
Energy consumption, hence, the associated harmful emissions for all living creatures, all over the world, is increasing rapidly as the global population, consumption, and production grow and expand continuously. The primary energy source that powers current cycles of economic growth depending on consumption and production is fossil fuels (e.g., coal, oil, and natural gas) (Lincoln Citation2005). Conventional energy generation systems that rely on burning fossil fuels release immense amounts of greenhouse gases (GHGs), which contribute to air pollution, global warming, and climate change resulting in extensive shifts in weather patterns and threatening the sustainability of humans and wildlife. The energy consumption in residential and commercial buildings has increased significantly, reaching 40% in some developed countries due to the growing demand for building services and increased comfort. The most energy-intensive system in buildings is the heating, ventilation, and air conditioning (HVAC) system (Nalley and LaRose Citation2022), which represents approximately half of the energy consumption in buildings in many developed countries (Pérez-Lombard, Ortiz, and Pout Citation2008). Therefore, energy efficiency in buildings has caught global attention, and many countries have applied policies to reduce energy consumption and related harmful emissions (EC Citation2011). Vapor-compression (VC) air-conditioning systems dominated the HVAC systems market in the last 100 years. VC systems are desirable for their simple installation, adequate size, acceptable performance, and adaptability to a wide range of refrigerants (Goetzler et al. Citation2014). However, VC suffers from the absence of a safe, efficient, cost-effective, and environmentally friendly refrigerant, high energy consumption, and the necessity of regular maintenance. VC systems traditionally utilized chlorofluorocarbons (CFCs) and hydrochlorofluorocarbons (HCFCs) as refrigerants, which contain high global warming potential (GWP) and ozone layer depletion potential (ODP). Their destructive effects on the stratospheric ozone layer have led to their gradual elimination starting from the year 1996 as well as their use ban since 2010 (MPCA Citation2021). Currently, Hydrofluorocarbons (HFCs) refrigerants are substituting CFCs and HCFCs as they do not harm the ozone layer. Nevertheless, HFCs have high GWP (Hodnebrog et al. Citation2020).
The demand for energy-efficient and sustainable cooling technologies cannot be overstated, as current space cooling systems consume enormous amounts of energy and harm the environment significantly. Therefore, it is necessary to investigate the performance of alternative cooling technologies in terms of energy efficiency (i.e., coefficient of performance (COP)), suitability for integration with renewable energy systems, GHG emissions, cooling capacities, and capital cost.
Alternative cooling methods
Alternative or not-in-kind (NIK) cooling technologies attracted the interest of many research institutes due to the focus on transforming to more environmentally friendly cooling technologies or refrigerants rather than empowering the status of conventional VC systems.
The past research examined NIK cooling systems COP, exergy efficiency, environmental impact, compatibility with renewable energy systems, maturity, cooling capacity, working material, and cost/complexity. Fischer, Tomlinson, and Hughes (Citation1994) was one of the first studies to examine ten alternative cooling technologies that were being developed in the same time period of the report. The report aimed to replace CFCs and HCFCs that harm the ozone layer with ozone-friendly HFCs in a conventional VC cycle. Also, they investigated the potential of many cooling cycle alternatives such as Stirling, absorption (AB), adsorption (AD), magnetic, and thermoelectric (TE) refrigeration cycles. However, the current research aims to replace high GWP refrigerants with eco-friendly refrigerants while maintaining acceptable efficiency or to adopt alternative cooling cycles of environmental advantage. A comparison between three cooling technologies: VC, AB, and TE cooling, in terms of environmental friendliness level, COP, and cost was made by (Riffat and Qiu Citation2004). That paper ranked VC as the most efficient, followed by AB and TE, respectively. A review of thermally-driven cooling technologies’ performance and major developments was done in (Best and Rivera Citation2015). That paper provided a comprehensive description of the theoretical and experimental studies performed with AB, AD, EJ, desiccants, and hybrid cooling systems. The study showed that single and double-effect (DE) LiBr/water AB has the most potential when considering small and medium-size capacity cooling systems. Currently, research on thermal cooling systems focuses on reducing the systems’ size and minimizing parasitic power. Qian et al. (Citation2016) investigated four solid-state technologies: Elastocaloric (ES), magnetocaloric (MG), electrocaloric (EL), and TE, and showed that the only energy-effective technology is MG compared to VC considering the same operating conditions. A comprehensive assessment of 14 space-cooling technologies suitable for residential and commercial applications was done in (Fil et al. Citation2021). The study investigated the performance of these technologies in terms of primary-energy COP, exergetic efficiency, and power density. The investigated space-conditioning technologies are VC, AB, AD, ejector (EJ), membrane, TE, thermionic/thermotunneling (TT), ES, MG, EL, Stirling, Brayton, Bernoulli, vortex tube, and thermoacoustic (TA) refrigeration. The study showed that VC has a superior performance over all alternative cooling technologies. Islam et al. (Citation2021) performed the thermodynamic analysis of a wide range of refrigerants utilized in a VC refrigeration system. The refrigerants are divided into three categories: Conventional refrigerants (R12, R22, R134a, R152a, R410A), low GWP refrigerants (R32, R1234yf, R1234ze(E)), and natural refrigerants (R600a and R744 (CO2)). In terms of energetic and exergetic efficiencies, the best performances were achieved by R600a, R152a, R1234ze(E), and R1234yf, respectively. Moreover, the total equivalent warming impact (TEWI) produced from the direct impact of refrigerant leakage and the indirect impact of electricity consumption clearly shows that eco-friendly refrigerants of high energy efficiency performance reduce carbon dioxide equivalent emissions substantially in comparison with conventional refrigerants.
This study thoroughly investigates the performance of many selected alternative cooling cycles that showed an environmental advantage over conventional ones. Furthermore, a comprehensive sustainability assessment of the selected cooling cycles was executed based on their environmental, economic, and efficiency impacts. The main objectives of this study are to (1) highlight alternative cooling technologies with superior efficiency and environmental performance, (2) analyze the effectiveness of eco-friendly refrigerants for VC systems, and (3) assess the sustainability performance of alternative space-cooling technologies compared to conventional VC cycles.
Research methodology
VC cooling systems have been studied and implemented extensively. In contrast, NIK cooling technologies research’s notable start was in the 1990s, when the environmental effects of VC systems and the utilized refrigerants were first recognized (Renaldi et al. Citation2021). Since then, many experimental and theoretical studies have been done. Nevertheless, few extensive studies comparing the different alternative cooling technologies were published. In this study, the first task was to examine the recent research papers analyzing the performance of alternative cooling cycles. The databases with the most focus on this topic were chosen (i.e., ScienceDirect, Google Scholar, Taylor & Francis, and Scopus). The inserted keywords in the search are: (not-in-kind OR alternative OR emerging OR eco-friendly) AND (cooling OR refrigeration OR heat pump). After that, the publications that didn’t discuss the performance of the cooling systems were eliminated from the study scope. The filtered publications were read fully and reported their main findings to develop the sustainability assessment of the different cooling cycles. This research, however, is subject to several limitations: The cooling cycles comparison includes well-established cooling systems that are available commercially and have been studied extensively as well as cooling technologies that are still being developed in research centers and laboratories. The investigated cooling cycles have different temperature lifts and cooling capacities.
Cooling technologies
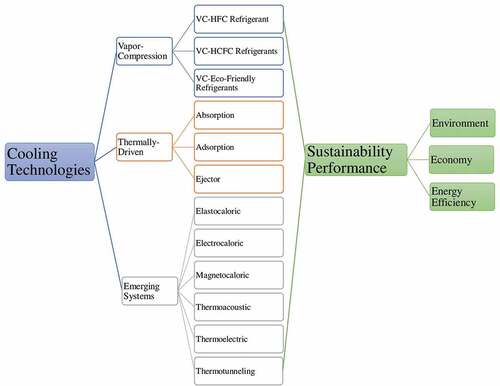
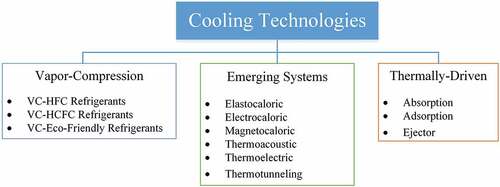
The examined cooling technologies and their categories are demonstrated in . VC includes systems with different refrigerants: HFC, HCFC, and eco-friendly refrigerants. The three selected thermally-driven cooling cycles are AB, AD, and EJ. Also, several emerging cooling technologies were studied: ES, EL, MG, TA, TE, and TT. The principle of operation, advantages, and drawbacks, and some recent studies of each cooling technology are presented in this section.
Figure 1. Investigated cooling systems.
VC cooling
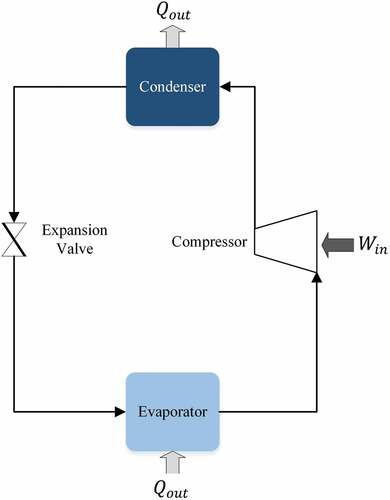
VC cooling cycle simplicity and compactness are the main reasons for its wide adaptability. The basic VC cooling cycle has four main components: Compressor, condenser, expansion valve, and evaporator, as shown in . The cooling cycle starts from an external work input (typically electricity), where the saturated refrigerant vapor is compressed to high temperature and pressure refrigerant vapor. Then, the condenser rejects refrigerant vapor heat to the ambient and cools it down to be condensed. After that, liquid refrigerant is throttled through the expansion valve to turn into a low-temperature liquid and vapor mixture. Finally, the low-temperature refrigerant flows through the evaporator to absorb heat from the cooled medium. The refrigerant exits the evaporator as a saturated vapor, and the cycle is repeated.
Figure 2. Basic vapor-compression cooling system schematic diagram.
Eco-friendly natural refrigerants were found to be a promising substitute for HFCs, possessing similar thermodynamic properties. Some of the natural refrigerants can be utilized in the existing VC systems with minimum modifications in the system operation. Bolaji and Huan (Citation2012) utilized two hydrocarbon (HC) refrigerants: RE170 and R510A, which have zero ODP and minimal GWP. The thermodynamic analysis of refrigerants RE170, R510A, and R134a for a VC model has shown that RE170 and R510A achieved average COPs better than conventional R134a average COP by 13.1% and 20.7%, respectively. Accordingly, energy needs were reduced by 14.1% and 20.4% for RE170 and R510A, respectively. Bolaji (Citation2011) also investigated the performance of two ozone-friendly refrigerants (R404A and R507) utilized for a window air-conditioner (retrofitted) compared to conventional environmentally-harmful R22. It was found that the lowest energy consumption was achieved using R507. In terms of average cooling capacity, R507 was the highest (4.7% higher than R22), while R404A was the lowest (8.4% lower than R22). Ust, Akkaya, and Safa (Citation2011) performed the analysis attributed to the exergetic performance coefficient (EPC) for different refrigerants utilized in a VC cooling cycle. The refrigerants analyzed in this study are R32, R125, R143A, R404A, and R410A. R32 recorded the best EPC and evaporator exergy heat transfer within the selected refrigerants. While, R125 had the highest COP at max EPC.
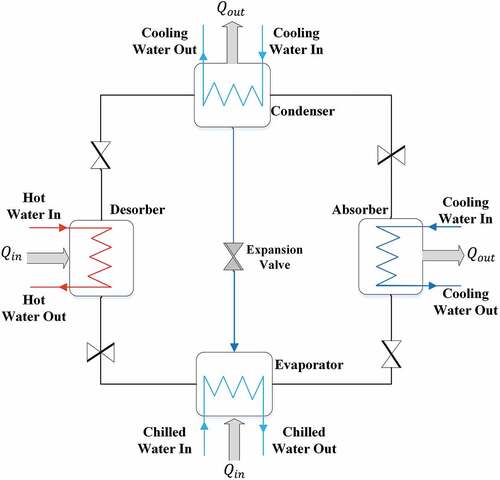
AB cooling
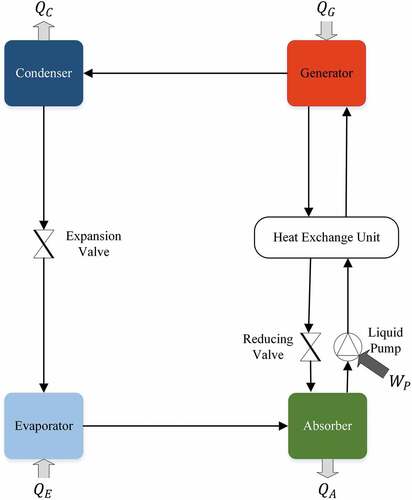
The invention of the AB cooling cycle dates back to the 19th century (Bogart Citation1982). However, its development and applications were halted due to the superior performance of VC cycles. After the 1960s, AB refrigeration system advancement was initiated once again for its distinguished ability to be driven using low-grade heat sources (Gaur, Fitiwi, and Curtis Citation2021), and simple integration with renewable energy systems (Lin et al. Citation2020). Consequently, it became an option to reduce carbon emissions associated with cooling buildings. The single-effect (SE) AB chiller comprises the absorber, generator, condenser, evaporator, two expansion valves, and pump, as illustrated in . The AB cooling cycle operation is initiated in the generator, where high temperature and pressure are applied to split the refrigerant from the refrigerant-absorbent mixture. Then, in the condenser, the refrigerant vapor turns into liquid. After that, the liquid refrigerant becomes a low-temperature and pressure liquid-vapor mixture by passing through an expansion valve. Later, the mixture runs in the evaporator, absorbing heat from the air and producing a cooling effect. Finally, the mixture exits the evaporator as a low-temperature refrigerant vapor to the absorber, in which a weak solution absorbs it. In consequence, the cycle commences again when the rich mixture flows to the generator.
Figure 3. Basic absorption cooling system schematic diagram.
Low-cost solar collectors and thermal energy storage are integrated into the AB cooling cycle to form a standalone solar AB cooling system. Argiriou et al. (Citation2005) illustrated that utilization of AB cooling could save a minimum of 20% of energy consumption in comparison with conventional VC cycles. Alobaid et al. (Citation2017) provided a review of solar AB cooling systems that are powered by photovoltaic thermal (PVT) systems. The study showed that solar AB systems could save 50% of energy input compared to VC systems. The recorded required solar panels area to produce 1 kWc from an AB chiller is 2.72 m2 and 3.1 m2 for concentrated PVT (CPVT) and PVT, respectively. Ibrahim et al. (Citation2020) simulated a solar-driven DE water-lithium bromide (H2O-LiBr) AB cooling system for the weather conditions of Dhahran, Saudi Arabia. That system utilized an AB energy storage which transforms excess solar energy during the day into chemical energy to be consumed later. Consequently, the integrated system was able to run daily for fourteen hours, achieving an average COP of 1.35 and an exergy efficiency of 25%. High solar radiation and longer sun hours correspond to the high cooling load in hot summer months, giving an obvious advantage for solar-driven cooling cycles.
AD cooling
The AD phenomenon has various types of processes, which can be categorized into physical and chemical AD. The physical AD represents the refrigerant condensation into the adsorbent, which typically occurs on the adsorbent’s surface caused by Van der Waals forces to combine molecules. Chemical AD is based on a chemical reaction between the adsorbent and adsorbate, which will result in producing new types of molecules. Usually, the chemical adsorbent reacts with the adsorbate’s monolayer. After that, the chemical adsorbent is not able to adsorb additional layers. Unlike physical AD, chemical AD decomposes new molecules during desorption. illustrates the basic components of an AD cooling system, namely, a condenser, an evaporator, an expansion valve, and two adsorbent beds. The cooling cycle starts when the refrigerant bed is saturated. Solar collectors convert solar irradiation to heat to release refrigerant vapor from the refrigerant bed. Then, the refrigerant vapor rejects heat and turns into liquid in the condenser. After that, the liquid refrigerant throttles through the expansion valve and absorbs heat in the evaporator, and the refrigerant becomes vapor. Afterward, the refrigerant vapor is transferred to the other adsorber bed to be adsorbed once again. This process is repeated until the second adsorber bed becomes saturated. Accordingly, the heating and cooling sections switch, so the second adsorber bed is heated, and cooling water is provided to the second adsorber bed.
Figure 4. Adsorption cooling system schematic diagram.
The effect of the AD time on the AD cooling system performance was studied by (Liu et al. Citation2021); two types of systems were experimented with: Silica gel and SAPO-34 zeolite. The silica gel system achieved a maximum COP of 0.258 when the AD time was 45 minutes, while the SAPO-34 zeolite system obtained a maximum COP of 0.133 for 60 minutes of AD time.
The primary advantages of AD cooling systems are: AD cooling systems are more potent through temperature changes, no crystallization occurs, low electrical energy consumption, AD cooling utilizes environmentally friendly materials such as zeolite and silica gel, and reduced maintenance as few moving parts exist. While the disadvantages of lower COP compared to AB cooling systems and commercially available systems are costly (White Citation2013).
EJ cooling
The standard EJ refrigeration system is composed of six main parts: The EJ, generator, condenser, evaporator, pump, and expansion valve, as illustrated in . In the generator, low-grade heat is utilized to convert the working pair into vapor. When saturation is acquired, high-pressure refrigerant vapor from the generator is combined with low-pressure vapor from the evaporator in the nozzle. The two streams mix, and the mixture exits the EJ to enter the condenser, where its heat is rejected, and the vapor mixture is turned into liquid. Then, the refrigerant liquid is divided into two flows; the first flow goes through an expansion valve and is provided to the evaporator to produce cooling, while the second flow is fed back to the generator using a pump. The main objectives of the EJ are mixing vapor streams and recompressing the vapor mixture before entering the condenser.
Figure 5. Ejector cooling system schematic diagram.
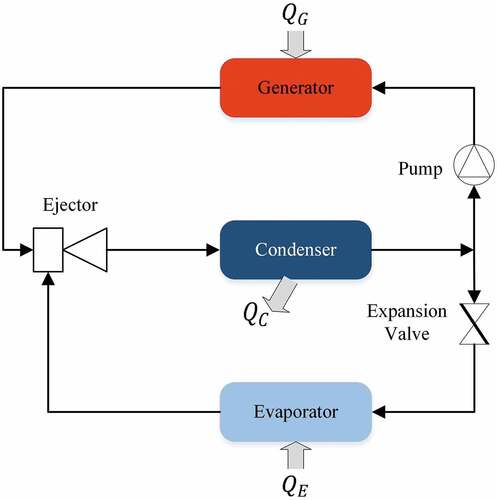
Adopting a solar EJ cooling system has many benefits: It has a simple formation, insignificant electrical energy consumption, high-level robustness, and relatively low maintenance expenses. Nevertheless, solar EJ cooling systems face the major obstacle of small COP (Besagni, Mereu, and Inzoli Citation2016). The performance analysis of two solar-driven EJ cooling cycles was done in (Yadav, Sarkar, and Ghosh Citation2022). The study proposed two novel solar-powered EJ cooling cycles that utilized an additional two-phase EJ as well as a flash chamber that reuses the energy from expansion in the condenser to the evaporator, improving the efficiency. Cycle-1 and Cycle-2 obtained COPs of 0.2453 and 0.2637, respectively. In contrast, the basic cycle has a lower COP of 0.2238.
Solid-State cooling cycles
ES, EL, and MG cooling are solid-state cooling cycles of similar operating principles. In the three cooling systems, the working material possesses properties that can be identified as ES, EL, or MG material that produced the three types of solid-state cooling systems. The operation of these cycles starts with an external source of energy (electric field, magnetic field, and tensile pressure) applied to the working material, resulting in an increase in the material’s temperature. Then, heat is discarded from the working material to the lower temperature environment while the external field is still applied. Afterward, the external field is removed, and the working material temperature reduces to the desired low temperature. Lastly, the low-temperature material absorbs heat from the cooled environment.
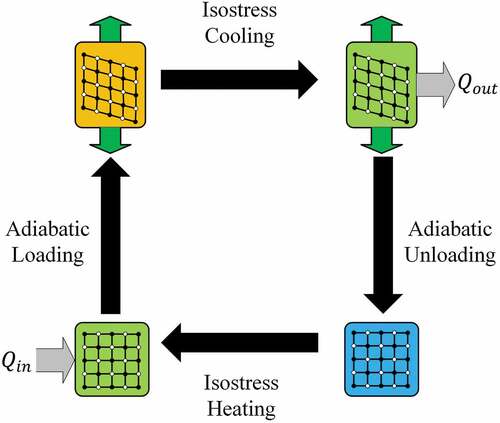
ES cooling
ES cooling operation relies on the latent heat transfer resulting from the martensitic phase transformation that was discovered in shape memory alloys (SMAs). At the same time, they undergo a cycle of loading and unloading stresses (Mañosa et al. Citation2009). shows the stages of the ES cooling cycle. Firstly, the SMA is in a stress-free state condition, and it is at ambient temperature. Then, stress is applied to the SMA to become higher than the saturation stress, discharging heat to the ambient. After that, the SMA enters a phase of unloading, decreasing below the saturation stress level, and absorbing heat from the ambient, producing the needed cooling effect. ES cooling future research focuses on developments in material and engineering heat transfer (Qian et al. Citation2016).
Figure 6. Elastocaloric regenerator cycle.
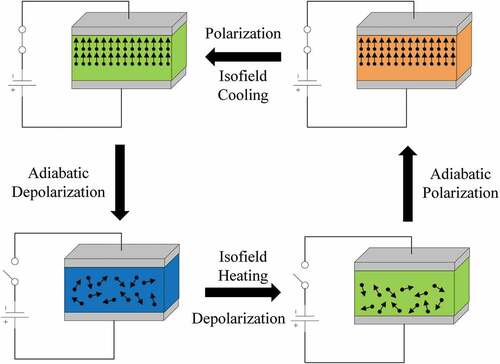
EL Cooling
EL is an emerging technology that has a high potential for the applications of air conditioning, refrigeration, and electronics cooling. EL cooling is desirable for its high energy efficiency, compactness, containing few moving parts, and elimination of environmentally harmful refrigerants. The EL regenerator cycle is displayed in . Ožbolt et al. (Citation2014) provided a constructive investigation of the perspectives of EL cooling systems. The article reviewed research outcomes of EL materials and cooling, and it was stated that EL cooling suffers from several drawbacks: The complexity of producing EL material and electrodes, the absence of a small size and high energy system, and great cost. One of the complexities of manufacturing this system is the customization of thin-film layers and electrodes to be formed as foils or plates. A high-performance EL cooling device that utilized PbSc0.5Ta0.5O3 multilayer ceramic capacitors was demonstrated in (Y. Wang et al. Citation2020), achieving a maximum heat flux of 135 mW/cm2 and a temperature span of 5.2°C. Also, very high COP can be achieved using EL cooling systems, as in the case of a cooling system that utilized a flexible EL polymer film with electrostatic actuation, obtaining an unprecedented COP of 13 (Rujun et al. Citation2017). Furthermore, a substantial decrease in the TEWI can be achieved by eliminating harmful conventional VC refrigerants with EL material while maintaining a similar material COP (COPmat) (Junye et al. Citation2019).
Figure 7. Electrocaloric regenerator cycle.
MG cooling
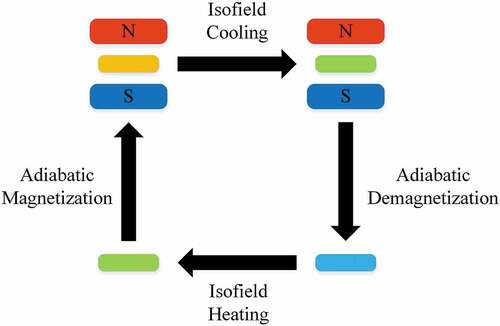
The temperature change caused by the existence of magnetic field variation is defined as the MG effect. The magnetic field spins the electron orientation in a solid, modifying its magnetic entropy. As illustrated in , applying a magnetic field increases the MG material’s temperature, which releases heat into the ambient. Then, the magnetic field is removed, which causes a reduction in the temperature of MG material in a phase known as “adiabatic demagnetization,” producing the cooling effect (Lyubina Citation2017). In 2008, Gschneidner and Pecharsky (Citation2008) provided an updated status of the performance of MG cooling, major challenges for commercialization, and possible solutions. While VC refrigeration reaches a maximum Carnot efficiency of 40%, MG cooling cycles can achieve Carnot efficiencies higher than 60%, representing a significant increase in the energy efficiency for cooling systems (Engelbrecht et al. Citation2007; Zimm et al. Citation1998).
Figure 8. Magnetocaloric regenerator cycle.
TA cooling
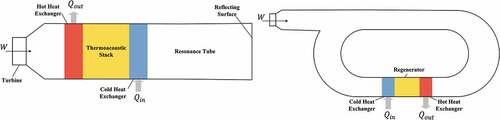
Conversion of thermal power to acoustic power is done through TA heat engines. TA applications depend on the heat exchanges between the acoustically excited gas and the porous medium, as well as a temperature gradient applied in the wave propagation direction (Rayleigh Citation1896). TA refrigeration systems utilize environment-friendly working material, typically noble gases characterized as nonflammable and nontoxic (Swift and Steven Citation2003). This system has no moving parts (i.e., reduced maintenance costs) and can be driven by low-grade heat sources (de Blok Citation2010). The diagram of a standing wave TA refrigeration system is displayed in . In this cooling unit, a temperature gradient is created along the stack utilized to transfer heat from the low-temperature side to the high-temperature side (Prashantha et al. Citation2018). The working gas undergoes a high-frequency oscillation, producing maximum compression and expansion at the hot and cold sides. Consequently, these hot and cold sides are utilized to provide cooling by absorbing heat from the cooled space. In comparison with the standing wave design, traveling wave TA refrigeration allows the sound waves to circulate in the cooling unit rather than reflect from a wall, as illustrated in (Swift, Gardner, and Backhaus Citation1999). The main obstacles to TA cooling becoming commercial are its low power output and the high cost.
Figure 9. Thermoacoustic refrigerator (left) standing wave (right) traveling wave.
TE cooling
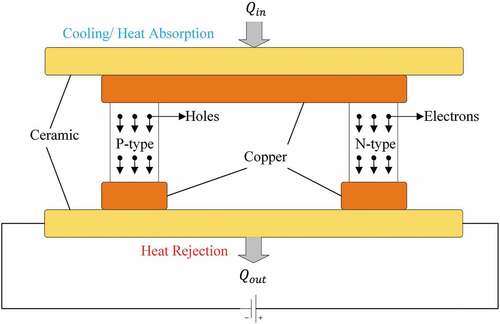
TE cooling excludes any moving parts and is produced by applying an electrical field to form a temperature gradient. Heat is rejected at one side and absorbed at the other side in a continuous cycle. A typical TE cooler is composed of N-type and P-type semiconductor junctions that are connected electrically in series and thermally in parallel. The semiconductors are mounted between two ceramic surfaces. The ceramic surfaces provide electrical insulation and a medium for thermal conduction from the elements to the heat sinks. A cooling effect develops at the cold junction, and the heat is rejected at the hot junction. The schematic diagram of a TE cooling system is demonstrated in . Direct current runs from the N-type to the P-type junction. Consequently, the copper conductor temperature drops, and it cools down the attached ceramic plate. Thus, it absorbs heat from the surrounding air. In this process, electrons are transferred through the conductor from the low energy intensity of the P-type junction to the high energy intensity of the N-type junction.
Figure 10. Thermoelectric cooling system.
The development of TE material created an opportunity to increase ZT (i.e., dimensionless figure-of-merit) value by implementing nanotechnology (Zhao and Tan Citation2014). Two major techniques significantly enhanced the ZT factor: Utilizing nanoscale material and including nanoscale material in bulk samples. In the latter method, research outcomes indicated that phonon-glass electron-crystal (PGEC) is a high-quality TE material (Nolas, Poon, and Kanatzidis Citation2006; Snyder and Eric Citation2010). It has high mobility electrons that move to heat and transfer charge, while the phonons are not able to transfer heat beyond the atomic scale. For the optimum TE operation, semiconductor material should be of high Seebeck coefficient difference, high electrical conduction, and minimal thermal transmission.
TT cooling
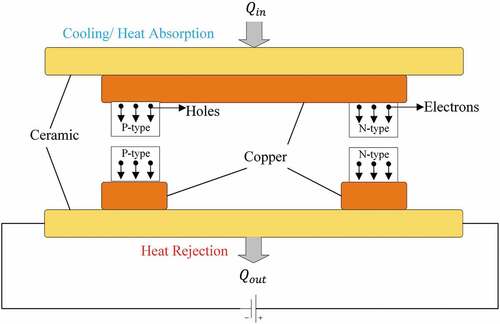
TT cooling, unlike TE cooling, eliminates the heat transfer done in the junctions, which gives the technology a slight advantage (Bansal, Vineyard, and Abdelaziz Citation2012; Qian et al. Citation2016). TT cooling operation relies on the flow of electrons through a small gap between the two electrodes (anode and cathode), as shown in the schematic diagram of the TT cooling cycle demonstrated in . The electrons transfer in a ballistic electron transport way. This implies that no collision occurs when electrons move from the cathode to the anode. Consequently, the electric and thermal energy transfer relationship is nonlinear with the voltage supply and temperature gradient (Fil et al. Citation2021). Hishinuma et al. (Citation2003) experimented with the cooling of a TT device that had a nanometer gap at room temperature to record the relations between current, voltage, gap length, and cooling capacity. The study confirmed that TT systems could operate at room temperature, but it is not energy efficient.
Figure 11. Thermionic cooling system.
To define and compare the sustainability of the different cooling cycles, specific characteristics were investigated, including the working principle, energetic and exergetic efficiencies, simplicity, refrigerants’ environmental impact, cost, and maturity. Therefore, it was necessary to examine the literature to acquire the sustainability parameters and produce a comprehensive comparison. A general outline of the advantages and disadvantages of the investigated cooling cycles is listed in .
Table 1. Main pros and cons of cooling cycles.
Cooling technologies sustainability comparison
The environmental indicators of sustainability assessment methods developed by (Singh et al. Citation2009) are mainly based on resource consumption and emissions harming the atmosphere, while economic indicators are derived from value, profit, and investments. Abu-Rayash and Dincer (Citation2019) developed an innovative sustainability assessment model that was derived from the energetic and exergetic efficiencies, environmental impacts, economic impacts, and sizes of the energy systems. In this study, environmental impact is estimated through the GWP and ODP produced from the system, while the economic impact is obtained from the operation and maintenance costs. In this section, the sustainability score calculation method is demonstrated. The input parameters for the calculation of the sustainability performance are cooling COP, scalability, technology maturity level, working material environmental-friendliness, complexity, energy cost, carbon emissions, and power consumption per unit cooled volume. The cooling COP, scalability, maturity level, and complexity level for each cooling cycle were derived from the literature. Working material environmental friendliness was estimated based on the ODP and GWP of each working material. lists the scales of the sustainability parameters set for the cooling technologies and their scoring percentage. Scalability of cooling technology is defined as the range extent of cooling capacity of the cooling system. High scalability corresponds to cooling cycles produced at low, medium, and large cooling capacity systems, while medium scalability is categorized for cooling systems that are restricted in their cooling capacity range of manufactured systems. Finally, low scalability is labeled for small cooling systems that are still at the research level (laboratory scale systems). The maturity level of cooling technology was divided into three categories: Very mature for cooling cycles that are available abundantly in the markets, market entry for heat pumps that have a small share of the market at the time being. In contrast, cooling systems at the research level were given the lowest scale for the maturity level parameter. In order for the cooling cycles to be sustainable, they are required to be of simple operation, fewer number of components, and manufactured from high availability raw materials for HVAC companies to adopt these technologies and emerge as an alternative to the conventional VC cycle. A low complexity system is the most desirable and was given the highest score.
Table 2. Cooling technology sustainability parameters’ scale.
Furthermore, cooling operation cost, carbon emissions, and power consumption per unit cooled volume of each cooling cycle were calculated using equations 1–3 (Dinçer Citation2020; Paula et al. Citation2021; Todd, Taylor, and Phelan Citation2012).
where is the cost of cooling operation of the investigated cooling system ($/kWhc),
is the estimated average price of electricity generation ($/kWhele), and
is the COP of the investigated cooling cycle (kWc/kWele). The average price for electricity generation was estimated by calculating the average generation costs from 31 countries on different continents and regions with different economic conditions. Consequently, the computed average global price of one kWh of electricity is 0.176 USD (Statista Citation2021).
where is cooling carbon emissions rate of the investigated cooling cycle (kg CO2 eq./kWhc), and
is the electricity generation median carbon emissions rate (kg CO2 eq./kWhele). The selected type of electricity generation is combined cycle gas turbine, which has an average carbon emissions rate of 0.413 kg CO2 eq./kWhele. This type of electricity generation was considered as it being median in terms of electricity generation carbon emissions (IEA Citation2021; Ozturk and Dincer Citation2019; US EIA Citation2021).
where is power consumption per unit cooled volume of the investigated cooling cycle (kWele/m3),
is the assumed cooled volume (m3). A cooling capacity of one tonne-refrigeration is assumed for every 12 m2 in buildings, which typically have a height of 3 m. Thus, the volume of cooling is 36 m3. This is the cooling load estimation considered for hot climate zones (0A, 0B, 1A, 1B, 2A, and 2B) as per ASHRAE standards (ASHRAE Citation2019).
The below equation was used to compute the overall sustainability score for each cooling technology (Bicer and Khalid Citation2021; Bragança, Mateus, and Koukkari Citation2010):
where represents the weight factor of each sustainability parameter,
is the normalized sustainability parameter of the investigated cooling cycle, and
is sustainability parameter scale of the investigated cooling cycle. Normalized COP, working material environmental friendliness, cost of cooling operation, carbon emissions, and power consumption per unit volume for each cooling cycle were found by implementing equations 5-9:
where is the maximum COP of all studied cooling cycles.
where and
are investigated cooling cycle working material ODP and GWP, respectively, and
and
are the maximum ODP and GWP of examined cooling technologies’ working materials, respectively.
where ,
, and
are investigated cooling system cost of cooling operation, carbon emissions, and power consumption per unit cooled volume, respectively, and
,
,
are examined cooling cycles’ minimum cost of cooling operation, carbon emissions, and power consumption per unit cooled volume, respectively.
The WFs for each assessment parameter was estimated based on their role in the transition to sustainably cool buildings, considering the three main characteristics of a sustainable technology (i.e., environment, economic, and efficiency). The environmental impact of cooling technologies is mainly the cooling operation’s contribution to global warming, resource depletion, and depletion of the ozone layer (Hughes, Nasarullah Chaudhry, and Abdul Ghani Citation2011). In contrast, energy costs and market maturity are the main aspects in determining the feasibility and applicability of the cooling system (i.e., economic impact). Finally, the energy efficiency of the cooling system is primary in defining the size and costs of the power system infrastructure (i.e., power plants, transmission lines, substations, and cables) requirements for cooling. shows the investigated cooling technologies sustainability score weighting schemes for three assessment perspectives: Environment, economic, and efficiency, and an overall balanced weighting scheme that considers the three perspectives evenly. In the environment dominant weighting scheme, the weightage was given based on importance. Therefore, the majority of the weightage is put into working material impact on global warming and ozone layer as well as the rate of carbon emissions from cooling operation. In the economic dominant sustainability assessment, it is essential to consider the economic viability of the cooling system. This means that the cooling system should be energy efficient to reduce energy costs, can be manufactured to different cooling capacities, and the technology should be mature enough so that manufacturing facilities and markets are profitable for investors and companies. The efficiency dominant weighting scheme highlights the importance of improving the energy efficiency of cooling cycles and thus reducing power consumption, which is crucial to preserve resources for future generations.
Table 3. Sustainability score perspective weighting schemes.
The randomness of the weighting factors and the given scales result in an uncertainty in the overall sustainability score. Therefore, it is crucial to quantify the uncertainties of the sustainability score results to identify the bias of the developed sustainability assessment method. The calculation of the uncertainty of the sustainability score is based on the variation of the weighting factors and is given as:
where is the uncertainty of the sustainability score of the investigated cooling cycle,
is the standard deviation of the sustainability scores of the investigated cooling cycle, and
is the number of sustainability scores when varying the weighting factor of each sustainability parameter.
A comprehensive sustainability comparison covering all the selected assessment parameters and the calculated overall sustainability score of each investigated cooling cycle is listed in . demonstrates the sustainability performance percentage of the investigated cooling technologies for the different weighting schemes (balanced, environment dominant, economic dominant, and efficiency dominant). The error bars indicate the uncertainty of each sustainability score. According to the balanced weighting scheme, the sustainability score is sorted in descending order. It shows that the VC cooling cycle that utilized eco-friendly refrigerant R510A (VC-R510A) achieved the highest sustainability performance, followed by EL, VC-RE170, VC-R134a, and MG cooling, respectively. Cooling systems with low COP are in the bottom ranks as COP directly affects energy conversion efficiency, energy costs, and rate of carbon emissions. For the environment dominant case, EL and MG cooling cycles obtained the highest and second-highest sustainability scores, respectively, succeeded by VC heat pumps of environment-friendly refrigerants (i.e., VC-510A and VC-RE170). VC systems scored the highest sustainability scores in terms of economic prospects as the cooling technology is very mature, highly scalable, and cost-effective. The efficiency dominant weighting scheme shows the variations in energy conversion efficiency and rate of power consumption between the investigated cooling cycles.
Figure 12. Sustainability performance of the investigated cooling cycles for different weighting schemes.
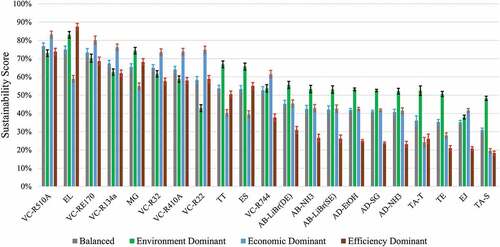
Table 4. Sustainability comparison of investigated cooling technologies (balanced).
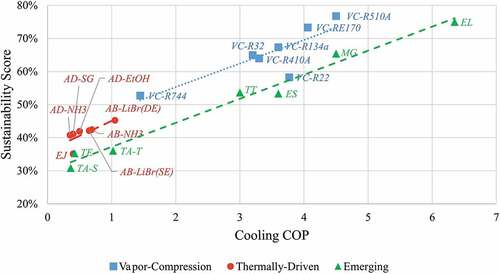
shows the effect of cooling COP on the cooling technology sustainability score for the three different investigated cooling technologies categories. The relation between cooling COP and sustainability performance is almost linear, indicating a high correlation. VC systems have high cooling COP and, therefore, high sustainability scores. In contrast, thermally-driven cooling cycles have a low COP range and low sustainability. However, emerging technologies COPs are spread along with the graph, having both high and low cooling COPs.
Figure 13. Cooling COP impact on the overall sustainability score of the different investigated cooling systems’ categories.
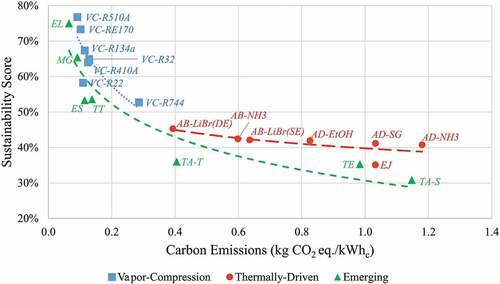
The sustainability score for each cooling technology was plotted against the cost of cooling operation in . The sustainability score increases with the decrease in operating costs. As cooling becomes more affordable, more and more cooling systems are installed to thermally endure the higher average ambient temperatures in the future caused by global warming. VC cycles remain the most cost competitive. shows the carbon emissions impact on the sustainability score of the investigated cooling technologies, which obviously illustrates the inverse relation between emissions and sustainability. Two emerging cooling technologies: EL and MG, have high potential in reducing cooling carbon emissions, while VC systems utilizing eco-friendly refrigerants are currently the most environment-friendly and sustainable among commercially available cooling systems.
Figure 14. Cost of cooling operation impact on the overall sustainability score of the different investigated cooling systems’ categories.
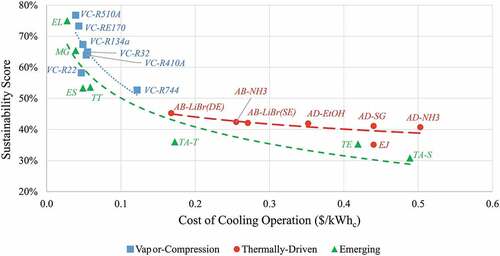
Figure 15. Carbon emissions impact on the overall sustainability score of the different investigated cooling systems’ categories.
Conclusions and future directions in the field
Efficient cooling technologies and approaches are in dire need in the face of continuously increasing space cooling demand due to population growth under the broader implications of global warming and climate change. Increasing cooling demand, on the other hand, triggers energy use, hence the emissions, which in turn pollute the air and cause warming that requires further cooling demand, and this vicious cycle continues growing perpetually. This study presented the following crucial points for the sustainable transition of cooling systems:
An investigation of recent developments in cooling cycles was conducted, mainly advancements in emerging systems.
An assessment of the energy efficiency performance of eco-friendly refrigerants in VC systems was done.
The environmental impact of alternative and clean cooling technologies was reviewed.
A sustainability assessment index for cooling technologies was developed, and the overall sustainability score of 21 different selected cooling methods was calculated.
The sustainability assessment results showed that VC cycles with eco-friendly refrigerants showed the highest potential for a sustainable transition of cooling cycles. Also, some emerging cycles have high environmental and energy efficiency performance.
In the years to come, it is expected that alternative cooling systems to acquire a larger market share, particularly in electronics refrigeration applications. However, for buildings’ air-conditioning, VC is likely to remain dominant due to the high costs, low energy efficiencies, and low maturity of other alternative cooling systems. Therefore, the recent optimum solutions to reduce the environmental impacts of cooling are either retrofitting existing VC systems of harmful refrigerants with eco-friendly refrigerants that show high energetic and exergetic efficiencies or integrating conventional and NIK cooling cycles with renewable energy systems. Nevertheless, major technological advancements are necessary to improve the market potential of alternative cooling cycles.
Subscripts
| CM | = | complexity |
| c | = | cooling |
| CC | = | cost of cooling operation |
| CE | = | carbon emissions |
| COP | = | coefficient of performance |
| ele | = | electricity |
| i | = | investigated cooling cycle |
| ML | = | maturity level |
| PC | = | power consumption per unit cooled volume |
| S | = | scalability |
| WM | = | working material environmental friendliness |
Nomenclature
| AB | = | Absorption |
| AD | = | Adsorption |
| EJ | = | Ejector |
| ES | = | Elastocaloric |
| EL | = | Electrocaloric |
| MG | = | Magnetocaloric |
| TA | = | Thermoacoustic |
| TE | = | Thermoelectric |
| TT | = | Thermionic/Thermotunneling |
| VC | = | Vapor-Compression |
| AB-LiBr(DE) | = | Absorption-H2O+LiBr (DE) |
| AB-LiBr(SE) | = | Absorption-H2O+LiBr (SE) |
| AB-NH3 | = | Absorption-NH3+H2O |
| AD-EtOH | = | Adsorption-AC+EtOH |
| AD-NH3 | = | Adsorption-AC+NH3 |
| AD-SG | = | Adsorption-SG+H2O |
| TA-S | = | Thermoacoustic-Standing |
| TA-T | = | Thermoacoustic-Traveling |
| VC-Refrigerant | = | Vapor-Compression-Refrigerant |
Acknowledgment
The authors acknowledge the support provided by Hamad Bin Khalifa University, Qatar Foundation, Qatar (210033742). This publication was made possible by NPRP grant NPRP12S-0123-190011 from the Qatar National Research Fund (a member of Qatar Foundation). The findings achieved herein are solely the responsibility of the authors. Open Access funding provided by the Qatar National Library.
Disclosure statement
No potential conflict of interest was reported by the authors.
Additional information
Funding
Notes
1. ACF: Activated Carbon Fiber, EtOH: Ethanol.
2. AC: Activated Carbon.
References
- Abu-Rayash, A., and I. Dincer. 2019, March. Sustainability assessment of energy systems: A novel integrated model. ( Elsevier) Journal of Cleaner Production 212:1098–116. doi: 10.1016/J.JCLEPRO.2018.12.090.
- Aimi, M., M. Arik, J. Bray, T. Gorczyca, D. Michael, and S. Weaver. 2007. Thermotunneling based cooling systems for high efficiency buildings. Pittsburgh, PA, and Morgantown: WV (United States). doi:10.2172/921025.
- Ali, A. H. H., P. Noeres, and C. Pollerberg. 2008. Performance assessment of an integrated free cooling and solar powered single-effect lithium bromide-water absorption chiller. Solar Energy 82(11):1021–30. Pergamon. doi:10.1016/J.SOLENER.2008.04.011.
- Alobaid, M., B. Hughes, J. Kaiser Calautit, D. O’Connor, and A. Heyes. 2017, September. A review of solar driven absorption cooling with photovoltaic thermal systems. ( Pergamon) Renewable and Sustainable Energy Reviews 76:728–42. doi: 10.1016/J.RSER.2017.03.081.
- Argiriou, A. A., C. A. Balaras, S. Kontoyiannidis, and E. Michel. 2005. Numerical simulation and performance assessment of a low capacity solar assisted absorption heat pump coupled with a sub-floor system. Solar Energy 79 (3):290–301. doi:10.1016/j.solener.2004.11.001.
- ASHRAE. 2019. Energy standard for buildings except low-rise residential buildings, ANSI/ASHRAE/IES standard 90.1. New York, NY, USA:ASHRAE.
- Babu, K. A., and P. Sherjin. 2017. A critical review on thermoacoustic refrigeration and its significance. https://www.researchgate.net/profile/Augustine-Babu/publication/319151705_A_Critical_Review_on_Thermoacoustic_Refrigeration_and_its_Significance/links/59951484458515c0ce653ee5/A-Critical-Review-on-Thermoacoustic-Refrigeration-and-its-Significance.pdf International Journal of Chemical and Technica Research 10:540–52. August
- Bansal, P., E. Vineyard, and O. Abdelaziz. 2012. Status of not-in-kind refrigeration technologies for household space conditioning, water heating and food refrigeration. International Journal of Sustainable Built Environment 1(1):85–101. Elsevier. doi:10.1016/J.IJSBE.2012.07.003.
- Besagni, G., R. Mereu, and F. Inzoli. 2016, January. Ejector refrigeration: A comprehensive review. ( Pergamon) Renewable and Sustainable Energy Reviews 53:373–407. doi: 10.1016/J.RSER.2015.08.059.
- Best, R., and W. Rivera. 2015, January. A review of thermal cooling systems. ( Pergamon) Applied Thermal Engineering 75:1162–75. doi: 10.1016/J.APPLTHERMALENG.2014.08.018.
- Bicer, Y., and F. Khalid. 2021. Sustainability assessment of renewable energy-based hydrogen and ammonia pathways. Renewable-Energy-Driven Future, January Academic Press: 435–68. doi:10.1016/B978-0-12-820539-6.00014-5.
- Bogart, M. J. P. 1982. Pitfalls in ammonia absorption refrigeration. International Journal of Refrigeration 5 (4):203–08. doi:10.1016/0140-7007(82)90020-2.
- Bolaji, B. O. 2011. Performance investigation of ozone-friendly R404A and R507 refrigerants as alternatives to R22 in a window air-conditioner. Energy and Buildings 43(11):3139–43. Elsevier. doi:10.1016/J.ENBUILD.2011.08.011.
- Bolaji, B. O., and Z. Huan. 2012. “Energy performance of eco-friendly RE170 and R510A refrigerants as alternatives to R134a in vapour compression refrigeration system.” In Proceedings of the 9th Conference on the Industrial and Commercial Use of Energy, ICUE 2012, 139–46. Stellenbosch, South Africa.
- Boman, D. B., D. C. Hoysall, D. G. Pahinkar, M. J. Ponkala, and S. Garimella. 2017. Screening of working pairs for adsorption heat pumps based on thermodynamic and transport characteristics. Applied Thermal Engineering 123 (August):422–34. doi:10.1016/j.applthermaleng.2017.04.153.
- Bragança, L., R. Mateus, and H. Koukkari. 2010. Building sustainability assessment. Sustainability 2 (7):2010–23. doi:10.3390/su2072010.
- de Blok, K. 2010. “Novel 4-stage traveling wave thermoacoustic power generator.” In ASME 2010 3rd Joint US-European Fluids Engineering Summer Meeting: Volume 2, Fora, 73–79. ASMEDC. doi:10.1115/FEDSM-ICNMM2010-30527.
- Dechang, W., J. Zhang, Q. Yang, N. Li, and K. Sumathy. 2014, January. Study of adsorption characteristics in silica gel–water adsorption refrigeration. ( Elsevier) Applied Energy 113:734–41. doi: 10.1016/J.APENERGY.2013.08.011.
- de Paula, W. M. Duarte, T. T. M. Rocha, C. Henrique, W. Moreira Duarte, T. Torres Martins Rocha, R. N. de Oliveira, and A. Augusto Torres Maia. 2020, May. Optimal design and environmental, energy and exergy analysis of a vapor compression refrigeration system using R290, R1234yf, and R744 as alternatives to replace R134a. ( Elsevier) International Journal of Refrigeration 113:10–20. doi:10.1016/J.IJREFRIG.2020.01.012.
- Dinçer, İ. 2020. Thermodynamics: A Smart Approach. Hoboken, NJ, USA: John Wiley & Sons.
- EC. 2011. Communication from the Commission to the European Parliament, the Council, the European Economic and Social Committee and the Committee of the Regions – Energy Roadmap 2050 (COM (2011), Brussels 8852.
- Engelbrecht, K., G. Nellis, S. Klein, and C. Zimm. 2007. Review article: Recent developments in room temperature active magnetic regenerative refrigeration. HvaC&R Research 13 (4):525–42. doi:10.1080/10789669.2007.10390970.
- Fil, E., D. B. B. Bachir, M. J. Tambasco, and S. Garimella. 2021. A comparative assessment of space-conditioning technologies. Applied Thermal Engineering 182 (January):116105. doi:10.1016/j.applthermaleng.2020.116105.
- Fischer, S. K., J. J. Tomlinson, and P. J. Hughes. 1994. Energy and global warming impacts of not-in-kind and next generation CFC and HCFC alternatives.
- Gaur, A. S., D. Z. Fitiwi, and J. Curtis. 2021. Heat pumps and our low-carbon future: A comprehensive review. Energy Research & Social Science 71 (January):101764. doi:10.1016/j.erss.2020.101764.
- Goetzler, W., R. Zogg, J. Young, and C. Johnson. 2014. Energy savings potential and RD&D opportunities for non-vapor-compression HVAC technologies. Washington, DC, USA: Navigant Consulting Inc.; US Department of Energy.
- Govindaraju, V. R., D. M. Vilathgamuwa, and R. V. Ramanujan. 2014, July. Modelling of a magnetocaloric system for cooling in the kilowatt range. ( Elsevier) International Journal of Refrigeration 43:143–53. doi: 10.1016/J.IJREFRIG.2014.03.007.
- Greco, A., and C. Masselli. 2020. Electrocaloric cooling: A review of the thermodynamic cycles, materials, models, and devices. Magnetochemistry 6 (4):67. doi:10.3390/magnetochemistry6040067.
- Gschneidner, K. A., and V. K. Pecharsky. 2008. Thirty years of near room temperature magnetic cooling: where we are today and future prospects. International Journal of Refrigeration 31(6):945–61. Elsevier. doi:10.1016/J.IJREFRIG.2008.01.004.
- Heredia-Aricapa, Y., J. M. Belman-Flores, A. Mota-Babiloni, J. Serrano-Arellano, and J.-G.-P. Juan. 2020, March. Overview of low GWP mixtures for the replacement of HFC refrigerants: R134a, R404A and R410A. ( Elsevier) International Journal of Refrigeration 111:113–23. doi: 10.1016/J.IJREFRIG.2019.11.012.
- Hishinuma, Y., T. H. Geballe, B. Y. Moyzhes, and T. W. Kenny. 2003. Measurements of cooling by room-temperature thermionic emission across a nanometer gap. Journal of Applied Physics 94 (7):4690–96. doi:10.1063/1.1606852.
- Hodnebrog, Ø., B. Aamaas, J. S. Fuglestvedt, G. Marston, G. Myhre, C. J. Nielsen, M. Sandstad, K. P. Shine, and T. J. Wallington. 2020. Updated global warming potentials and radiative efficiencies of halocarbons and other weak atmospheric absorbers. Reviews of Geophysics 58 (3):3. doi:10.1029/2019RG000691.
- Hughes, B. R., H. Nasarullah Chaudhry, and S. Abdul Ghani. 2011. A review of sustainable cooling technologies in buildings. Renewable and Sustainable Energy Reviews 15(6):3112–20. Pergamon. doi:10.1016/J.RSER.2011.03.032.
- Hwang, Y., X. Xu, R. Radermacher, and H.M. Pham. 2012. “Performance measurement of R32 vapor injection heat pump system.” In International Refrigeration and Air Conditioning Conference. https://docs.lib.purdue.edu/iracc/1261/
- Ibrahim, N. I., F. A. Al-Sulaiman, A. Saat, S. Rehman, and F. Nasir Ani. 2020, June. Charging and discharging characteristics of absorption energy storage integrated with a solar driven double-effect absorption chiller for air conditioning applications. ( Elsevier) Journal of Energy Storage 29:101374. doi: 10.1016/J.EST.2020.101374.
- IEA. 2021. World energy outlook 2021. Paris. https://www.iea.org/reports/world-energy-outlook-2021.
- Islam, M. A., S. Mitra, K. Thu, and B. Baran Saha. 2021, November. Study on thermodynamic and environmental effects of vapor compression refrigeration system employing first to next-generation popular refrigerants. ( Elsevier) International Journal of Refrigeration 131:568–80. doi: 10.1016/J.IJREFRIG.2021.08.014.
- Jin, T., R. Yang, Y. Wang, Y. Feng, and K. Tang. 2016, September. Acoustic field characteristics and performance analysis of a looped travelling-wave thermoacoustic refrigerator. ( Pergamon) Energy Conversion and Management 123:243–51. doi: 10.1016/J.ENCONMAN.2016.06.041.
- Junye, S., D. Han, Z. Li, L. Yang, L. Sheng Guo, Z. Zhong, Q. M. Z. Jiangping Chen, X. Qian, and X. Qian. 2019. Electrocaloric cooling materials and devices for zero-global-warming-potential, high-efficiency refrigeration. Joule Cell Press. 3 (5):1200–25. doi:10.1016/J.JOULE.2019.03.021.
- Kim, S. G., and M. S. Kim. 2002. Experiment and simulation on the performance of an autocascade refrigeration system using carbon dioxide as a refrigerant. International Journal of Refrigeration 25(8):1093–101. Elsevier. doi:10.1016/S0140-7007(01)00110-4.
- Lincoln, S. F. 2005. Fossil fuels in the 21st century. Ambio: JSTOR 34 (8):621–27. doi:10.1579/0044-7447-34.8.621.
- Lin, L., Y. Tian, Y. Luo, C. Chen, and L. Jiang. 2020. A novel solar system integrating concentrating photovoltaic thermal collectors and variable effect absorption chiller for flexible co-generation of electricity and cooling. Energy Conversion and Management 206 (February):112506. doi:10.1016/j.enconman.2020.112506.
- Liu, Y. M., Z. X. Yuan, X. Wen, and C. X. Du. 2021, January. Evaluation on performance of solar adsorption cooling of silica gel and SAPO-34 Zeolite. ( Pergamon) Applied Thermal Engineering 182:116019. doi: 10.1016/J.APPLTHERMALENG.2020.116019.
- Lyubina, J. 2017. Magnetocaloric materials for energy efficient cooling. Journal of Physics D: Applied Physics 50(5):53002. IOP Publishing. doi:10.1088/1361-6463/50/5/053002.
- Mañosa, L., A. Planes, E. Vives, E. Bonnot, and R. Romero. 2009. The use of shape-memory alloys for mechanical refrigeration. Functional Materials Letters 2 (2):73–78. doi:10.1142/S1793604709000594.
- Modi, B., A. Mudgal, and B. Patel. 2017, March. Energy and exergy investigation of small capacity single effect lithium bromide absorption refrigeration system. ( Elsevier) Energy Procedia 109:203–10. doi: 10.1016/J.EGYPRO.2017.03.040.
- Mohammadi, K., and K. Powell. 2020, January. Thermodynamic and economic analysis of different cogeneration and trigeneration systems based on carbon dioxide vapor compression refrigeration systems. ( Pergamon) Applied Thermal Engineering 164:114503. doi: 10.1016/J.APPLTHERMALENG.2019.114503.
- Mota-Babiloni, A., J. Navarro-Esbrí, P. Makhnatch, and F. Molés. 2017, December. Refrigerant R32 as lower GWP working fluid in residential air conditioning systems in Europe and the USA. ( Pergamon) Renewable and Sustainable Energy Reviews 80:1031–42. doi: 10.1016/J.RSER.2017.05.216.
- MPCA. 2021. “Chlorofluorocarbons (CFCs) and Hydrofluorocarbons (HFCs).” https://www.pca.state.mn.us/air/chlorofluorocarbons-cfcs-and-hydrofluorocarbons-hfcs.
- Nalley, S., and A. LaRose. 2022. Annual energy outlook 2022 (AEO2022).
- Nolas, G. S., J. Poon, and M. Kanatzidis. 2006. Recent developments in bulk thermoelectric materials. MRS Bulletin 31 (3):199–205. doi:10.1557/mrs2006.45.
- O’Dwyer, M. F., T. E. Humphrey, R. A. Lewis, and C. Zhang. 2009. Efficiency in nanometre gap vacuum thermionic refrigerators. Journal of Physics D: Applied Physics 42 (3):035417. doi:10.1088/0022-3727/42/3/035417.
- Ožbolt, M., A. Kitanovski, J. Tušek, and A. Poredoš. 2014. Electrocaloric refrigeration: Thermodynamics, state of the art and future perspectives. International Journal of Refrigeration 40 (April):174–88. doi:10.1016/j.ijrefrig.2013.11.007.
- Ozturk, M., and I. Dincer. 2019. Comparative environmental impact assessment of various fuels and solar heat for a combined cycle. International Journal of Hydrogen Energy 44(10):5043–53. Pergamon. doi:10.1016/J.IJHYDENE.2019.01.003.
- Paula, B., F. da Silva, T. Cruz, M. Mistry, E. Vasquez-Arroyo, L. Magalar, E. De Cian, A. F. P. Lucena, and R. Schaeffer. 2021, March. Impacts of a warmer world on space cooling demand in Brazilian households. ( Elsevier) Energy and Buildings 234:110696. doi: 10.1016/J.ENBUILD.2020.110696.
- Pérez-Lombard, L., J. Ortiz, and C. Pout. 2008. A review on buildings energy consumption information. Energy and Buildings 40 (3):394–98. doi:10.1016/j.enbuild.2007.03.007.
- Prashantha, B. G., M. S. Govinde Gowda, S. Seetharamu, and G. S. V. L. Narasimham. 2018. Design and analysis of acoustically-driven 50 W thermoacoustic refrigerators. Sadhana - Academy Proceedings in Engineering Sciences 43(6): doi:10.1007/S12046-018-0860-8. Springer India.
- Qian, S., Y. Geng, Y. Wang, J. Ling, Y. Hwang, R. Radermacher, I. Takeuchi, and J. Cui. 2016, April. A review of elastocaloric cooling: materials, cycles and system integrations. ( Elsevier) International Journal of Refrigeration 64:1–19. doi: 10.1016/J.IJREFRIG.2015.12.001.
- Qian, S., D. Nasuta, A. Rhoads, Y. Wang, Y. Geng, Y. Hwang, R. Radermacher, and I. Takeuchi. 2016. Not-In-Kind cooling technologies: A quantitative comparison of refrigerants and system performance. International Journal of Refrigeration 62 (February):177–92. doi:10.1016/j.ijrefrig.2015.10.019.
- Qian, S., L. Yuan, H. Hou, and I. Takeuchi. 2018. Accurate prediction of work and coefficient of performance of elastocaloric materials with phase transformation kinetics. Science and Technology for the Built Environment 24(6):673–84. Taylor & Francis. doi:10.1080/23744731.2018.1457411.
- Rayleigh, J. W. 1896. The theory of sound, Vol. 2. New York, NY, USA: Macmillan.
- Renaldi, R., N. D. Miranda, R. Khosla, and M. D. McCulloch. 2021, May. Patent landscape of not-in-kind active cooling technologies between 1998 and 2017. ( Elsevier) Journal of Cleaner Production 296:126507. doi: 10.1016/J.JCLEPRO.2021.126507.
- Riffat, S. B., and G. Qiu. 2004. Comparative investigation of thermoelectric air-conditioners versus vapour compression and absorption air-conditioners. Applied Thermal Engineering 24(14–15):1979–93. Pergamon. doi:10.1016/J.APPLTHERMALENG.2004.02.010.
- Rujun, M., Z. Zhang, K. Tong, D. Huber, R. Kornbluh, J. Yongho Sungtaek, and Q. Pei. 2017. Highly efficient electrocaloric cooling with electrostatic actuation. Science 357 (6356):1130–34. doi:10.1126/science.aan5980.
- Saleh, B., A. A. Aly, M. Alsehli, A. Elfasakhany, and M. M. Bassuoni. 2020. Performance analysis and working fluid selection for single and two stages vapor compression refrigeration cycles. Processes 8 (9):1017. doi:10.3390/pr8091017.
- Singh, R. K., H. R. Murty, S. K. Gupta, and A. K. Dikshit. 2009. An overview of sustainability assessment methodologies. Ecological Indicators 9(2):189–212. Elsevier. doi:10.1016/J.ECOLIND.2008.05.011.
- Snyder, G. J., and S. T. Eric. 2010. Complex Thermoelectric Materials. In Materials for sustainable energy: A collection of peer-reviewed research and review articles from nature publishing group, pp. 101–10. World Scientific Publishing Co. doi:10.1142/9789814317665_0016.
- Soni, P., and V. Kumar Gaba. 2019. Comparative analysis of silica-gel/water and zeolite/water pair on adsorption refrigeration system. Journal of Physics Conference Series 1240(1):012067. IOP Publishing. doi:10.1088/1742-6596/1240/1/012067.
- Statista. 2021. “Household electricity prices worldwide in september 2021.” https://www.statista.com/statistics/263492/electricity-prices-in-selected-countries/.
- Swift, G. W., D. L. Gardner, and S. Backhaus. 1999. Acoustic recovery of lost power in pulse tube refrigerators. The Journal of the Acoustical Society of America 105(2):711. Acoustical Society of AmericaASA. doi:10.1121/1.426262.
- Swift, G. W., and L. G. Steven. 2003. Thermoacoustics: A unifying perspective for some engines and refrigerators. The Journal of the Acoustical Society of America 113 (5):2379–81. doi:10.1121/1.1561492.
- Todd, O., R. A. Taylor, and P. E. Phelan. 2012. Prospects for solar cooling – an economic and environmental assessment. Solar Energy 86(5):1287–99. Pergamon. doi:10.1016/J.SOLENER.2012.01.020.
- US EIA. 2021. How Much Carbon Dioxide Is Produced per Kilowatthour of U.S. Electricity Generation? https://www.eia.gov/tools/faqs/faq.php?id=74&t=11.
- Ust, Y., A. V. Akkaya, and A. Safa. 2011. Analysis of a vapour compression refrigeration system via exergetic performance coefficient criterion. Journal of the Energy Institute 84 (2):66–72. doi:10.1179/014426011X12968328625351.
- Wang, X.L., H.T. Chua, and K.C. Ng. 2004. Simulation of the Silica Gel-Water Adsorption Chillers. https://docs.lib.purdue.edu/cgi/viewcontent.cgi?article=1662&context=iracc.
- Wang, Y., Z. Zhang, T. Usui, M. Benedict, S. Hirose, J. Lee, J. Kalb, and D. Schwartz. 2020. A high-performance solid-state electrocaloric cooling system. Science 370 (6512):129–33. doi:10.1126/science.aba2648.
- Wei, W., B. Wang, W. Shi, and X. Li. 2014, March. An overview of ammonia-based absorption chillers and heat pumps. ( Pergamon) Renewable and Sustainable Energy Reviews 31:681–707. doi: 10.1016/J.RSER.2013.12.021.
- White, J. 2013. Literature review on adsorption cooling systems. Latin American and Caribbean Journal of Engineering Education (378-884-1–RV).
- Yadav, V. K., J. Sarkar, and P. Ghosh. 2022, July. Thermodynamic, economic and environmental analyses of novel solar-powered ejector refrigeration systems. ( Pergamon) Energy Conversion and Management 264:115730. doi: 10.1016/J.ENCONMAN.2022.115730.
- Zhao, D., and G. Tan. 2014. A review of thermoelectric cooling: Materials, modeling and applications. Applied Thermal Engineering 66(1–2):15–24. Pergamon. doi:10.1016/J.APPLTHERMALENG.2014.01.074.
- Zimm, C., A. Jastrab, A. Sternberg, V. Pecharsky, K. Gschneidner, M. Osborne, and I. Anderson. 1998. Description and performance of a near-room temperature magnetic refrigerator. In Advances in cryogenic engineering, Vol. 43, pp. 1759–66. Boston, MA: Springer. doi:10.1007/978-1-4757-9047-4_222.
- Zolpakar, N. A., N. Mohd-Ghazali, and M. Hassan El-Fawal. 2016, February. Performance analysis of the standing wave thermoacoustic refrigerator: A review. ( Pergamon) Renewable and Sustainable Energy Reviews 54:626–34. doi: 10.1016/J.RSER.2015.10.018.
