
 ?Mathematical formulae have been encoded as MathML and are displayed in this HTML version using MathJax in order to improve their display. Uncheck the box to turn MathJax off. This feature requires Javascript. Click on a formula to zoom.
ABSTRACT
This paper outlines a comprehensive analysis of the optimal design and simulation of a crude oil distillation system within a refinery process, including pre-treatment and blending of two crude oils to increase the refinery’s annual profit. This distillation process is currently in operation, and the desired amount of feedstock is obtained from Iraqi Basra light-2015 and Kirkuk-2011 crude oil. To improve the energy efficiency of the utilization rate of crude oil, an atmospheric distillation process unit in this refinery with a capacity of 150,000 barrels per day (bpd) is considered. Aspen HYSYS simulation is used to optimize the distillation unit configuration and its operating performance. This paper also deals with three scenarios by comparing the feedstock compositions to the distillation process and the produced product compositions to minimize utility consumption. A heat integration approach was applied to the 3rd scenario by recycling hot outlet streams to the heat exchangers to increase the temperature of the inlet stream of the distillation column. Results indicated that about £2.29 million per year (Mpy) could be saved from the heat integration systems. Economic analysis and cut yields were carried out for each scenario to investigate the cost-effective and economically viable. Based on the economic analysis, scenario three showed better performance with a comparatively high cumulative cash flow of £31,886 M.
Introduction
Crude oil refineries continue to rule our lives for at least another two decades by providing global energy demand for transportation, heating, and electricity generation applications (Nalinakshan et al. Citation2019). The price and composition of crude oil are considered the largest contributors to refinery operating costs nowadays (Kumar, Voolapalli, and Upadhyayula Citation2018). Crude oils are a complex mixture of hundreds of different volatile hydrocarbon molecules and organic materials in the liquid phase accompanied by elemental compounds and contaminants (such as sulfur, oxygen, nitrogen, chromium, vanadium, and metal contents) (Al-Khafaji, Hakimi, and Najaf Citation2018). The amount of these elements present in crude oil significantly influences the characteristics and unique composition of that crude oil. Therefore, the nature of crude oil and its composition determine the price and refining ability to create a special design and operating condition to treat a unique crude oil with certain properties (Naji, Ateeq, and Al-MayyahCitation2021).
In the last six decades, it has been common practice for most refineries to deal with more different types of crude oil to ensure that an optimum mixture of crude oil can be achieved at minimum cost (Demibras and Bamufleh Citation2017). Most oil refiners use this strategy to maximize profits by purchasing lower-cost crude oils with high viscosity and high amounts of sulfur (Nalinakshan et al. Citation2019). It is essential for refiners to decide to purchase these kinds of crude oils for upgrading by mixing or blending them with lighter crude oils with lower viscosity to become blending crude oil with higher value. This blending process saves more money than the normal processing cost. A higher yield product from the atmospheric and vacuum distillation units could be produced (1–5%) when the refiners blend crude oils (Li et al. Citation2007). Production and synthetic crude oils reached almost three million barrels per day in 2015. Demand for petrochemical feedstocks across the world is continuously increasing, at a rate of about 1.5% per year, alongside the growing world population and consuming crude oil production (Gary, Visnja, and Tim Citation2015). Therefore, modifying a crude oil refining configuration and its operating condition to deal with different or blended crude oils may be applicable if new crude oils have reasonable or close similarity properties such as percentage of sulfur content and specific gravity compared to the original crude oils. If the new blended crude oil does not meet the sulfur content standard requirement, the sulfur removal process will be involved in the process (Naji, Ateeq, and Al-MayyahCitation2021).
In general, crude oils are classified based on several factors such as the type of hydrocarbons, specific gravity, and amount of sulfur content. The Watson K characterization factor, also known as the universal oil product characterization factor in EquationEquation 1(1)
(1) (Modarress et al., Modarress and Vakili-NezhaadCitation2002), is used to recognize the types of crude oil according to the hydrocarbons forming. According to the Watson K method, the whole crude oils are arranged between 10 and 12.9 Kw (Modarress and Vakili-NezhaadCitation2002).
where T represents the normal boiling point of crude oils, and SG represents the specific gravity of crude oil at 60°F.
Crude oil with lower than 10 Kw is recognized as a highly aromatic hydrocarbon. The Kw for naphthenic hydrocarbons is arranged between 10 and 11, while the Kw for paraffinic hydrocarbons starts from 11 to 12.9. Crude oils are also categorized based on their API gravity (known as specific gravity) using EquationEquation 2(2)
(2) (Fahim, Al-Sahhaf, and Elkilani Citation2010). Robinson (Citation2006) stated that this method measures crude oil density compared to water density at 15.6°C and arranges crude oils between 10 and 40 degrees. In this arrangement, crude oil with 30 degrees or higher of API gravity is considered a light hydrocarbon. The API of crude oil arranged between 22 and 29.9 degrees is known as a medium hydrocarbon. Crude oil with API gravity between 10.0 and 22.3 degrees is a heavy hydrocarbon, while less than 10.0 degrees is considered an extra heavy hydrocarbon with higher kinematic viscosity and density.
Crude oils are also defined and categorized according to the percentage of sulfur contents. Crude oil is considered sweet if it has less than 0.5% sulfur, and crude oil with more than 0.5% of sulfur content is considered sour (Fahim, Al-Sahhaf, and Elkilani Citation2010). The composition of typical Iraqi crude oil’s molecular compounds varies from one formation to another. The proportion of chemical elements is indicated as carbon (85–90%), nitrogen (0.1% to 2%), sulfur (0.%−2%), and oxygen (1%−1.5%) (Ali and Khathi Citation2019). High sulfur and a trace amount of metal, such as V, Ni, and Cu, characterize the type of crude oil (Al-Khafaji, Hakimi, and Najaf Citation2018).
In the past years, separation processes in chemical industries are facing a series of challenges due to environmental regulations to reduce CO2 emissions while balancing their annual profits. Crude oil refineries require a large amount of energy to operate. Process heat and heat integration systems have been the most considerable technologies in chemical plants and crude oil refineries in the past three decades, with significant advances in that area (Vasiliev, Ulyev, and Boldyryev Citation2018). Many techniques and methods have been tried to obtain more efficient energy management, and optimal energy consumption has been extensively investigated (Mehdizadeh-Fard and Pourfayaz, Citation2019). The distillation column requires a large amount of energy equivalent to 1–2% of its products alone (Gu et al. Citation2015). In general, crude oil distillation is one of the most complex processes consisting of lots of utility systems and process systems. An approach to address the integration of the utility system and process system to achieve better energy consumption was investigated by Zhang and Hua (Citation2007). This investigation presented a multi-period planning mathematical model with the process unit energy consumed model embedded in the plant-wide model to achieve better energy efficiency and overall optimization. Gu et al. (Citation2015) performed an integrated design system to decompose the main distillation column into several series of simple columns to be optimized. Then, simple columns were merged into a single complex design. Sabiria, Mustapha, and Fatima (Citation2007) investigated the change in separation method by introducing the thermodynamic concept of energy through exergetic efficiency of the vessel. The results revealed that the produced irreversibility fluxes are distributed throughout the whole process and the exergetic output is low. Ledesma-Martínez, Jobson, and Smith (Citation2018) suggested that preflash units be used to facilitate heat recovery in energy-intensive distillation systems before the distillation unit. However, all the studies mentioned above did not state the important role of heat exchanger networks in facilitating heat recovery within the distillation system to reduce energy demand for preheaters or fired heaters to increase the inlet stream temperature.
Due to the importance of crude oil blending method and achieving better advantages in maximizing the quality and refineries’ annual profits, various academic researchers have performed a huge number of scientific optimization research. Li et al. (Citation2007) monitored the blending optimization of two different crude oils to indicate consistent and optimal feedstocks for a certain distillation operation. The obtained distillation yields at 520°C were successfully investigated by the equilibrium flash vaporization (EFV) technique. The achieved result data reveal that the optimal blending of maxilla and cabinda crude oils on 3:7 ratio increased the atmospheric distillation yield by 3.02% more than the original individual yields. This yield could be increased more by supplying more heat into the column. Shaoping et al. (Citation2011) Investigated the blending of crude oil distillation yields and products. The results revealed that at the optimal blending ratio of Iran and Saudi 9:1, the highest total distillation yield is 67.20%, which is 1.47% higher than the theoretical distillation yield. In another investigation work, a model for optimizing and predicting properties for blended is established. The blended crude oil comprised six different types of crude oils from different oil wells in the Shanbei district. The basic properties of each crude oil, such as density, dynamic viscosity, the four components, and the compatibility index, were measured. This study aimed to improve and obtain a better yield of fractions and reduce the blended crude oil viscosity. Blended crude oil of two crude oils was prepared to see if the model could be validated. The objectives of the model indicated that the dynamic viscosity of blended crude oil would be as low as possible, the obtained yield (≤350°C) of the blended crude oil would be as big as possible, and the compatibility index would be below 0.35 (Hou, Li, and Sui Citation2015). The physicochemical properties of blended crude oils from six different wells in the sedimentary basin of the Brazilian coast were collected and monitored during the production stages by Sad et al. (Citation2019). The data on the properties of the blended crude oils were then taken by laboratory characterization for analysis by hierarchical cluster analysis (HCA) and principal component analysis (PCA). They easily identified the blend’s quality. The results showed that the profiles of the crude oil blends could be modified if any fraction contributed different crude oils from different wells.
The aim of this study is to develop a rigorous distillation process model for the Basrah Light Oil followed by the optimization of the crude oil atmospheric distillation units. As a new contribution which would be of great benefit to petroleum industry, this paper investigates the best predictive scenario, cost-effective, and energy efficient to maximize the quality and quantity of the production rate, as well as increase the refining annual margins by upgrading and blending two different types of Iraqi crude oils to maximize the refining annual margins as well as final products. We believe that the proposed method will reduce energy consumption and thus offer a marketable product of considerable value in future. Furthermore, to the best of our knowledge, blending, heat integration, upgrading crude oils, and economic analysis to maximize the refining annual margins and final products have not yet been investigated. For this purpose, crude oil blends were prepared from the Iraqi Basrah light-2015 from the southern part of Iraq and Kirkuk-2011 from the North of Iraq with two different API gravities, bulk sulfur contents and properties, and kinematic viscosity at 20°C. However, no work currently exists about blending these two crude oils. The blending process needs to be performed through very powerful simulation and optimization tools. Simulation models in Aspen HYSYS v12.1 were used to obtain the design methodology for this work. Finally, the blended crude oil composition as the optimal feed stream and suitable operating variables within the Aspen HYSYS model are presented according to the specific design of each crude oil distillation unit. Finally, the economic analysis identifies favorable scenarios in the distillation process calculating annual costs consisting of capital expenditure (CAPEX) and operation expenditure (OPEX).
Simulation tool and research methodologies
To obtain proper operating conditions and examine the production equipment and processing units without costing much money in advance, a simulation of Aspen HYSYS software is employed (Hanyak and Michael Citation2020). The process simulation of Aspen HYSYS software is one of the most important tools extensively used nowadays to design optimization, evaluate petroleum product efficiency, and improve process performance by optimization operating parameters and best finding the best process (Ledesma-Martínez, Jobson, and Smith (Citation2018). It is an essential tool that will provide sufficient assistance in understanding what happens in a chemical process unit (Sotelo et al. Citation2017). This computer program is used at the conceptual design level, at an actual plant or in academic education centers, and during the entire plant process life cycle. Therefore, three different scenarios or petroleum assays for the distillation unit for the Basrah light-2015 and Kirkuk-2011 crude oil and their blends are performed and characterized to choose the best optimization process by using the Aspen HYSYS database.
In this study, the tree method is utilized to find a suitable thermodynamic fluid package for the process after presenting the hypothetical component group, water, and light-end hydrocarbons to the Aspen HYSYS simulation. Selecting a correct fluid package is essential to determine the physical characteristics of the compounds and fluid mixture involved in the process (Khalaf Citation2018). These physical characteristics need to be determined and consist of fluid density, polarity, electrolyte entropy, pressure, and vapor–liquid equilibrium (Hamid Citation2010). In this study, Peng-Robinson (PR) model has been selected for this process because most of the components are nonpolar. It is also the ideal fluid package that can be used to calculate vapor–liquid equilibrium for most petrochemical applications when the temperature is arranged between (−271°C to 900°C) and pressure is less than 100,000 kPa (Hanyak and Michael Citation2020). This model is also considered the most optimum fluid package in petrochemical processes as it performs reliable stability and great efficiency in the simulation of crude oil atmospheric distillation column and other separation units used for light gases.
Importing crude oil assay
In this section, the characterization of Iraqi Basrah light-2015 and Kirkuk-2011 crude oils and input data need to be installed on the Aspen HYSYS simulation. Crude oil refineries use blended crude oils from a multiplicity of crude oils due to operational conditions and feed availability. Crude oil assay is combination data of physical and chemical properties used to describe and determine the suitability and behavior of crude oil under specific conditions to evaluate the yield and quality of the product. The crude oil assay also gives the required information to refiners to make a decision in the areas of crude selection, scheduling, and planning. It is also used in the optimization of various petrochemical processes. Typical crude oil assay contains most of the important bulk specifications including viscosity, characterization factor, amount of sulfur content, and API gravity at two different temperatures. Petroleum assay also has other important specifications, such as the composition of light ends by mass%, which is represented by the following chemical compounds: methane, ethane, propane, i-butane, n-butane, iso-pentane, and n-pentane, cuts density curve value for two temperatures, cuts molecular weight, cuts boiling points and their cumulative base on weight mass%, and cumulative sulfur content by mass%. In this paper, two different crude oils were used for the distillation process, and their specifications and characteristics are tabulated in (Hamid Citation2010).
Table 1. Bulk properties of both Basrah light-2015 and Kirkuk-2011 crude oil (Hamid Citation2010).
Blending process
Due to the continuous shortage of crude oils as raw materials to provide petroleum products in the domestic market and the availability of different types of crude oils in the world, most of the refiners are considering using the principle of blending distillation process for various crude types (Li et al. Citation2007). Therefore, crude oil blending processes become ordinary operations applied by refiners to upgrade crude oils to increase refining profits. This upgrading is proceeded in two alternative technologies: using a blender in-tank or in-line blending (Demibras and Bamufleh Citation2017). In In-tank method, specific volumes of two or more different types of crude oil are loaded into a mechanically stirred blending tank for mixing. Samples are taken to determine whether the blended crude oil reaches a homogeneous composition and meets the required specifications. In contrast, in-line blending method is continuously performed by sending different types of crude oil flows from separate tanks into an online mixing continuously to obtain the feedstock before arriving at the crude distillation units (CDUs) (PNA Citation2022). The schematic diagram of the blending process is shown in . If the crude oil feeding is made of two different types of crude oil, a blender unit must be added to the process. Otherwise, the refinery process does not require a blender for a single crude oil. In the first scenario, 150,000 barrels per day (bpd) from the Iraqi Basrah light-2015 crude oil is used for refining, and the simulation flowsheet for this scenariois shown in Figure A1 in the supplemental section. In the second scenario, only 150,000 bpd from Kirkuk-2011 crude oil is used for refining, and a simulation flowsheet for this process is shown in Figure A2 in the supplemental section. In the third scenario, both crude oils are blended on a scale of 50:50 to obtain 150,000 bpd. The simulation flowsheet for the third scenario is shown in . The total annual production price for scenarios 1, 2, and 3 calculated in as £4,548.50, £4,560.35, and £4,657.51 million (M) a year, respectively. Scenario three has better optimization production method, upgraded by blending Iraqi Basrah light-2015 and Kirkuk-2011 crude oil.
Figure 1. Blending Basrah light-2015 and Kirkuk-2011 crude oils.
Figure 2. Simulation flowsheet of distillation process without using integration technique for blended Basrah light-2015 and Kirkuk-2011 crude oil.
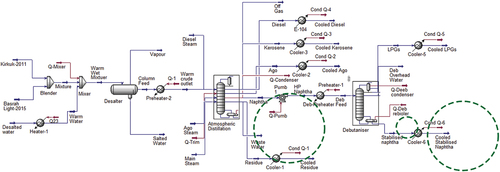
Table 2. Capital and utility costs for scenario three Baiji crude oil refinery scenarios.
Table 3. Distillation unit products, structures, boiling points, and usage (Leffler Citation2020; Brown, Citation2022).
Table 4. Costs used in economic analysis.
Table 5. Fixed costs of productions and their equations.
Table 6. Total annual Product prices for Basrah light-2015, Kirkuk-011, and Blended crude oil.
Heat integration and sequential heat exchangers
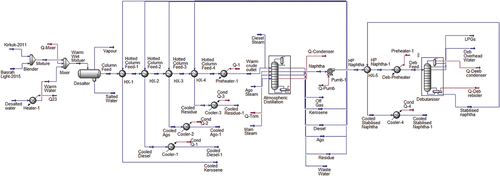
Heat integration is a formal method applied to minimize energy consumption in the large application of an industrial process (Hlavačka Citation1988). Heat exchangers could be the most effective equipment for facilitating heat recovery within the distillation system to reduce energy demand for preheaters or fired heaters to increase the inlet stream temperature (Liu, Luo, and Kabelac Citation2016). Increasing temperature allows a sufficient amount of the feed to be vaporized to make the vapor flow before arriving in the distillation unit. In crude oil refineries, the heat integration process is crucial to optimize the energy-efficient operation of the whole system (Ledesma-Martínez, Jobson, and Smith Citation2018). Therefore, to reduce the hot and cold utilities, heat exchangers are essential to be installed to achieve heat from streams requiring cooling to give streams requiring heating. In this system, the heat exchangers have two aims: (i) to minimize the boiling point temperature and the overall rate of entropy of the outlet product streams from the distillation tower to around 35C and (ii) to maximize the temperature of the inlet crude oil feed streams from ambient conditions to the required operating temperature before it enters the atmospheric distillation column. In both ways, connected heat exchangers reduce operational expenditure. In this distillation process, five heat exchangers have been added. Defining each process unit’s enthalpies and entropies, all the important parameters, such as temperature, pressure, and mass or mole flow rate for inlet streams and outlet streams, were studied and calculated precisely, including pump-around circuits. This can be used to analyze thermodynamics to determine the effect of energy and exergy efficiency rates on individual components and the entire process (AIChE Citation2015).
In scenario 3, shell and tube heat exchangers with counterflow systems are utilized to improve thermal energy efficiency and transfer heat from one medium to another. Sequential strategy is a great method to optimize the heat integration process. In scenario 3, inclusion of heat exchangers renders the process more economically viable due to the £2.3 million per year (Mpy) reduction in the cost of petroleum products. In , the process displays scenario 3 without a heat exchanger and the utility cost calculated by Aspen HYSYS as £19.82 Mpy. However, by recycling the hot outlet streams from the distillation column, the total utility energy consumption was calculated and shown in . It is reduced to £17.52 Mpy after heat integration for the same process, as shown in .
Figure 3. Simulation flowsheet of distillation process with heat exchangers to recycle back energy for blended Basrah light-2015 and Kirkuk-2011 crude oil.
Desalting process
The desalting process is the essential separation stage that must be completed at the beginning of a refining process. In this desalting process unit, most of the primary foreign substances are separated to avoid and at least minimize the corrosion and fouling of downstream lines and other unit operations during consumption by the oil’s salt content as shown in . Desalting is not a separate unit. It is considered an initial part of the distillation unit since the heat from some of the streams in the atmospheric distillation is obtained for heat exchangers to increase the crude oil stream temperature in the desalting process (Fahim, Al-Sahhaf, and Elkilani Citation2010). Most oil’s salt content as foreign particles, including sodium (NaCl ~70 to 80 wt.%), magnesium chlorides (MgCl2 ~10 to 20 wt%), and calcium (CaCl2 ~10 wt%), which are in the form of crystals or ionized in the water present in the crude. If salt is not removed, the high temperatures present during crude oil refining could cause water hydrolysis, which is the formation of hydrochloric acid (HCl) that causes severe damage and corrosion problems on the equipment surfaces (Leffler Citation2020).
Atmospheric Distillation Unit (ADU)
Distillation is one of the most common and oldest predominate separation methods used in crude oil refineries to separate the components or substances, such as hydrocarbon fractions, from a liquid mixture based on their volatile or boiling temperature (Muslim Citation2005). The operation of the tower here is purely physical (not chemical reaction) to manage the quality and boiling range of feedstock fractions to find a suitable required separation process for the distillation unit. To operate a typical crude oil distillation process environmentally and economically, 1–2% of its products are required to be consumed again (Gu et al. Citation2015). Crude oil distillation unit is the next unit that comes after the desalting process. It is an essential long horizontal column consisting of several trays set above each other for interacting hydrocarbon gases and liquids by using selective boiling and condensation temperature (Górak and Schoenmakers Citation2014). The distillation unit is divided into five main sections: the reaction section (located between the 7th and 14th internal trays), rectifying, stripping, and reboiler sections. The simulation of the developed distillation column employed for this process was made of 29 trays of separation, condenser, and reboiler. Each tray holds a number of bubble caps to pass through hydrocarbon vapors in the active tray area. The hydrocarbon mixture is continuously fed into the distillation tower in a tray above the bottom of the so-called flash zone, such as a tray column or packed column. The inlet feed crude oil temperature is increased by up to between 750°F and 800°F (Muslim Citation2005) before entering the atmospheric unit (ADU). Each crude oil has its specification and operating conditions. For instance, in scenario one, Basrah light-2015 crude oil is entered at a temperature of 700.0ºF, under 52 psia, on a mass flow rate of 881,200 kg/h. In scenario two, Kirkuk-2011 entered the distillation tower at a temperature of 710ºF under a pressure of 44.1 psia and a mass flow rate of 857,800 kg/h. In the third scenario, the blended crude oil entered at 730°F under 53 psia and a mass flow rate of 468,400 kg/h.
The developed atmospheric distillation column has four feed streams, and the column operating conditions for scenarios one and two are quite similar. The first stream (warm crude oil) enters the column at tray number 28 to improve the distillation efficiency. This stream enters at a significantly high temperature of 710°F, under 37 psia, with a mass flow rate of 1.943e + 006 lb/h. The second stream is the main stream and enters the column at tray number 29 at a temperature of 358.7°F under 150 psia at a mass flow rate of 6,000 lb/h. The third and fourth streams are diesel and Ago streams, introduced to the bottom of CDU (at the same temperature, pressure, and mass flow rate of 358.70°F, 150 psia, and 2000 lb/h, respectively). These streams reduce the partial pressure in the column and thus enhance the vaporization and separation of the crude oil. The simulation results for both crude oil properties are compared and stated in .
In the atmospheric tower, the temperature at the bottom is at the highest and lowest at the top. Therefore, the heating process vaporizes (in the vaporization process) the majority of the components with more volatility within the crude oil. The vaporized components are raised to the top alongside the atmospheric distillation tower, where the temperature gradually decreases. As the temperature decreases, the component with lower volatility becomes liquid in the condensation process. The lighter components flash and rise to the next trays throughout the bubble cap on the trays. The liquid components were then collected within trays fitted within the tower. The individual hydrocarbon components have distinct boiling points and condense the temperature gradient between the bottom and top trays, as shown in . The condensed liquid components with higher volatility rise through the liquid pool in the next stage above and then overflow. The overflow enters the stage from a down-comer above and leaves via a down-corner below. The uncondensed vapors containing lighter gas flew out for further processing. The components with high extremity volatility remain at the bottom of the column and are recycled by a column reboiler to vaporize more components still in the mixture. The liquid residue containing components with a high boiling point is sent to the vacuum distillation unit for further separation. Side cuts or feedstocks from a typical crude oil distillation are designated in the following list (Muslim Citation2005).
Debutanizer Column (DU)
The debutanizer column is another crucial unit used in industrial crude oil refining for further separation. In this process, the light naphtha stream is obtained from the atmospheric distillation column as a non-stabilized product and requires a further separation process to remove lighter components with higher volatility. To improve its products quality and stabilized condition, LPGs are separated from the incoming naphtha stream. The whole process starts by utilizing the naphtha stream with a higher temperature of 129.4°C by passing through a debutanizer heat exchanger and heater. The stream pressure is also increased to 265 Pisa by using a centrifugal pump with a similar continuous mass flow rate of 196,600 kg/h for scenario one, 223,800 kg/h for scenario two, and 130,900 kg/h for scenario three. The products obtained from the top part of the column are C2 and lighter gases for fuel gas, and then this gas is compressed to be liquefied petroleum gas (LPG). The products obtained from the bottom section of the column are gasoline or stabilized naphtha and sent to their respective storage system. A simplified simulation of Aspen HYSYS for each scenario was designated in the section of the simulation flowsheet of the distillation process (Hamid Citation2010).
Economic analysis
The economic analysis identifies favorable process scenarios (Waudby and Zein Citation2021). This section calculates annual costs of capital expenditure (CAPEX) and operation expenditure (OPEX). Crude oil as a raw material does not have that great value in its original raw state, and it cannot be used in most daily practical applications and energy requirements (Muslim Citation2005). However, in petroleum refinery plants, crude oil is separated or transformed into a wide range of valuable tasks and most usable petroleum component parts such as diesel, gasoline, and heating oils. A typical oil refinery consists of many physiochemical operational units, heating and cooling systems, waste treatment systems, loading and unloading machines, and other industrial facilities on a large-scale planet. To make more profits, refineries push to increase the efficiency and effectiveness of each process (Howden Citation2021). contains this project’s main crucial information applied for economic analysis.
Raw material costings
Production capacity of the Baiji refinery has recently increased production of oil derivatives from 70,000 to 150,000 bpd (Xinhuanet Citation2022), due to the increasing demand for energy production in the world. The prices of crude oils,of Basrah light-2015 and Kirkuk-2011 used in this process, either individually or blended, vary from time to time. The historical data and prices designated as the supplied crude oil in this refinery are hugely different and recorded as $66.83 for Basrah light-2015 and $99.56 for Kirkuk-2011 (Oil price.com Citation2022).
Estimated Capital Cost (CAPEX)
Capital expenditure can be the most important part of each petrochemical refinery to decide on the overall economic analysis and visibility. The total cost required by a company must fund designing major physical assets such as construction, technology equipment, property, building modifications, and working capital investment (WCI) to expand the company over a year. The capital cost (CAPEX) can be comprised of the following two sections:
Fixed Capital Investment (FCI)
• Fixed capital investment is the essential capital outlay for establishing a project. It is the amount of money needed to be invested for purchasing physical apparatus, installing and controlling industrial equipment being replaced, and design costs associated with the whole plant. Inside battery limit (ISBL) has a significant role in determining a project’s economic process. The investment includes a plant’s direct and indirect field costs. In order to evaluate the ISBL value for this process, EquationEquation 3(3)
(3) (Sinnott and Towler Citation2021) is applied as the following steps:
where C = ISBL capital cost value (US $ M) on US Gulf Coast Basis (GCB) for the year 2000; α = Historical cost of a chemical refinery in US $ M and Gulf Cost basis in the year 2006; S = Production rate or capacity of a chemical plant in US Barrel per day; and n = Extrapolation constant value applied to evaluate the capital cost.
Sinnott and Towler (Citation2021) provide the values for a and n as 0.151 and 0.6, respectively. These values are achieved from a crude oil distillation process that is already in operation by D2000 and runs by TOTAL/Technip. Cost estimation and regulation for a refinery plant needs to be established in Iraq (the Middle East). Therefore, all the location factors and exchange currency must be considered.
Once the ISBL value for a typical refinery process is achieved, the estimation values for all the other components from fixed capital investment, such as OSBL, Contingency cost, and engineering cost are calculated:
• Outside battery limit (OSBL) investment is calculated with EquationEq. 4(4)
(4) (Sinnott and Towler Citation2021), which compromises all the additional costs of a typical plant that is required for infrastructure.
• Contingency cost is also calculated using EquationEq. 5(5)
(5) (Sinnott and Towler Citation2021), which includes the sum of all the money needed for unexpected events and insurance.
• Design and engineering costs are also calculated, including most of the estimation of engineering costs associated with structures onside or inside a refinery plant. EquationEq. 6(6)
(6) (Sinnott and Towler Citation2021) is applied to find out an estimation of the engineering costs:
To find out all the estimated cost value for fixed capital investments for a typical petrochemical process, the costing values for ISBL, OSBL, contingency costs, and design and engineering costs are added to £453.59 M (Sinnott and Towler Citation2021). The cost estimation and regulation for establishing a refinery plant in Iraq (the Middle East) must be considered.
Working Capital Investment (WCI)
Working capital investment is also called net working capital. It refers to the deployment of financial resources in day-to-day business operations. Based on the ISBL value, the working capital (WC) value is also obtained, as shown in the following EquationEquation(14)
(14) Equation7
(7)
(7) (Sinnott and Towler Citation2021):
= 0.15 × (249.23 + 99.69) = £52.34 M on a Middle East basis.
Therefore, the value for Estimated Capital Cost (CAPEX) = £505.93 M on a Middle East basis.
Operation Expenditure or Cost (OPEX)
Fixed Costs of Productions (FCOP)
The fixed costs of production are defined as the costs that happened independently of chemical plant output and production rate, some of which are designated in . In this section, three scenarios are performed to explore and viability of each distillation feedstock. The fixed production cost rate is calculated as £22.48 M and remains constant for all the scenarios. All the mathematical steps and equations applied in this section are derived from (Sinnott and Towler Citation2021).
Price of products from this distillation
In competitive markets, refined product prices are determined by supply, demand, and inventory conditions at a given location and time. The most fundamental economic relationship governing commodities is that quantity demanded is a function of price and market information, including expectations of future supply and demand, seasonal factors, and inventory levels. Products obtained from the Iraqi Baiji refinery include off gas, naphtha, heating oil, kerosene, diesel, and residual fuel oil. To obtain feedstock from the distillation process, parameters, such as initial molar flow rate, temperature, and pressure values for each stream, are applied to the Aspen HYSYS simulation. The petroleum assays characterize the Aspen HYSYS database for the first scenario for Iraq’s Basrah light-2015 crude oil, the second for Kirkuk-2011 crude oil, and the third for blended crude oil from both. The products obtained from these processes consist of LPG, naphtha, kerosene, Diesel, ago, heating oil, residue fuel oil, and off-gas. Initially, the mass flow rate and composition of all the components as kg/h are obtained from the Aspen HYSYS simulation and displayed as products of the distillation process in . The obtained mass flow rate (kg/h) and their prices (£/h) for each component are calculated to find out the prices of the annual product (£/h), respectively, as shown in . The total annual production price for scenarios 1, 2, and 3 is calculated in as £4,548.50, £4,560.35, and £4,657.51 M a year, respectively. Crude oil in scenario three has a better product as it is upgraded by blending Iraqi Basrah light-2015 and Kirkuk-2011 crude oils
Variable Cost of Products (VCOP) for raw materials
As mentioned above, this paper contains three different scenarios for investigation. In the first scenario, only 150,000 barrels of Iraqi Basrah Light-2015 crude oil per day will be sent through the distillation unit. In the second scenario, only 150,000 barrels of Kirkuk crude oil per day is fed to the distillation unit. In the third scenario, 150,000 barrels per day of blended crude oil from the Iraqi Basrah Light-2015 and Kirkuk is fed to the distillation unit (Xinhuanet Citation2022).
Basrah light-2015 crude oil for the distillation process
Based on historical data, the average price for the Iraqi Basrah light-2015 crude oil purchased for this plant was $66.83 in US dollars per barrel in the oil market participants in March 2015 (eia Citation2022). The crude oil supply to this refinery was 150,000 (bpd) (Xinhuanet Citation2022). As a result, the daily cost of this refinery was $10.02 M US dollars per day. If this amount is converted into the UK pound Sterling using an exchange rate of 0.66 (Bank of England Citation2022), the annual cost of raw materials for this distillation process is £2,414.90 M.
Kirkuk-2011 crude oil for the distillation process
Based on historical data, the average price for the Iraqi Kirkuk crude oil purchased for this plant was $99.56 per barrel in US dollars in the oil market participants in March 2015 (eia Citation2022). The amount of crude oil supplied to this refinery was 150,000 bpd (Xinhuanet Citation2022). As a result, the daily cost of this refinery was $14.93 M US dollars per day. If this amount is converted into the UK pound Sterling using an exchange rate of 0.66 (Bank of England Citation2022), the annual cost of raw materials for this distillation process is £3,597.60 M.
Blended Basrah light-2015 and Kirkuk-2011 crude oil
This section performs a variable economic analysis and value method for this process. In this process, a basis of the feedstock mixture of two different crude oils, equal to 50:50 ratios, is used for the operation. The first half contains 75,000 barrels of Iraqi’s Basrah light-2015 a day, and the second half contains 75,000 barrels of Kirkuk-2011 crude oil daily. The price for Iraqi’s Basrah light crude oil-2015 in is $66.82 per barrel in US currency 2015 (eia Citation2022). If this value is exchanged into the UK pound Sterling using the current conversion ratio of 0.77 (Bank of England Citation2022), the result is £51.45 for each barrel. However, the price for Kirkuk-2011 crude oil was $99.56 per barrel in US currency in 2011 (Eia Citation2022). If this value is converted into the UK pound Sterling using the current exchanging ratio of 0.77 (Bank of England Citation2022), the results would be £76.66 for each barrel in 2011. As a result, the total cost is £23,270.94 M.
Revenue and gross profit values calculations
Accurate estimation of the products’ costs and revenues is essential to determining a project’s required budget and profitability. According to Sinnott and Towler Citation2021, profit is the surplus of total revenue that a company earns from purchasing products and services over the total costs incurred in selling those products and services. Usually, every industrial plant has a teeth period of 5 years to reach its capacity. Therefore, there are zero revenue and minuses gross profits for a while, such as the first 2 or 3 years of all new process projects, as they do not produce products in full of their capacities. This means the revenue and costs concerning trading activities over the past 2 or 3 years. Therefore, revenue is the money earned from normal industrial operations and calculated as the price of average sales items times the number of units sold. However, for most new plants, the revenue and costs will increase annually if everything remains the same, such as government rules, exchange currency, and inflation rate (Sinnott and Towler Citation2021).
In this project, the initial year for all the scenarios is the same, and the cost (cash flow) put in is calculated as 30% of FCI (Sinnott and Towler Citation2021), which is equal to £136.08 m. To find out value of gross profits, the cost values are subtracted from avenues. In the first year, the cash flow was calculated as 50% of FCI (Sinnott and Towler Citation2021), estimated at £226.80 M. In the second year, the inlet cash flow is calculated as 20% of FCI +WCI + FCOP + 30% of VCO) (Sinnott and Towler Citation2021) which is equal to £890.01 M. The revenue is calculated as 30% of the design basis (Sinnott and Towler Citation2021). In the third year, the inlet cash flow is estimated as 70% of VCOP + FCOP (Sinnott and Towler Citation2021), which is equal to £1,712.91 M, and the value of revenue for each scenario is calculated as 70% of the design basis. For the fourth year, the inlet cash flow is calculated as FCOP + VCOP, equal to £2437.38 M, and the avenue is calculated as 100% of the design basis (Sinnott and Towler Citation2021). For this project, assumed from year 4, the cost, revenue, and gross profit will remain quite similar for the next 16 years, and all the following equations used in are derived from (Sinnott and Towler Citation2021). contains start-up schedules for the initial 4 years for Iraqi’s Basrah light-2015, Kirkuk-2011, and blended crude oil in this plant.
Table 7. Start-up schedules of the initial 4 years for Iraqi’s Basrah light-2015 and Kirkuk-2011 and blended crude oil in this plant.
The gross profit for the Iraqi Basrah light-2015 and Kirkuk-2011 crude oil is used in . The values of gross profits from year 4 to year 20 are in Table SA1 in the appendix. The scrap value is used to obtain the depreciation value. The scrap value is defined as the worth of a physical asset of each component when the asset itself no longer operates, and the scrap value is found by EquationEquations 8(8)
(8) . EquationEquations 8
(8)
(8) –EquationEquation 14
(14)
(14) (Sinnott and Towler Citation2021) calculate taxable income values. Taxes paid, net cash flow, discount factor, discounted cash flow, and cumulative cash flow for 20 years are tabulated in Tables SA1, SA2, and SA3 for Basrah light-2015, Kirkuk-2011, and blended Basrah light-2015 and Kirkuk-2011 crude oils, respectively, in the appendix. First, the following mathematical steps are applied to determine depreciation and taxable income values.
= (0.05) × (£249.23 + £99.69) = £17.45 M
Then, the scrap value needs to be used in EquationEquation 9(9)
(9) :
And the tax-paid values is calculated using EquationEquation 10(10)
(10) :
To find cash flow in the second year of the project (EquationEquation 11(11)
(11) ) is used:
To find out discount factor at all the years, EquationEquation 12(12)
(12) is used (Sinnott and Towler Citation2021), assuming the discount rate for the next 20 years of the plant is 18%.
where i = the interest rate or the discount rate, and n = the year.
Discount factor at year 0 = 1
Discount factor at year 1 = (1 + i)−1 = (1 + 0.18)−1 = 0.85 (without unit)
Moreover, finally, to find out the discounted cash flow value for each year, either EquationEquation 13(13)
(13) or EquationEquation 14
(14)
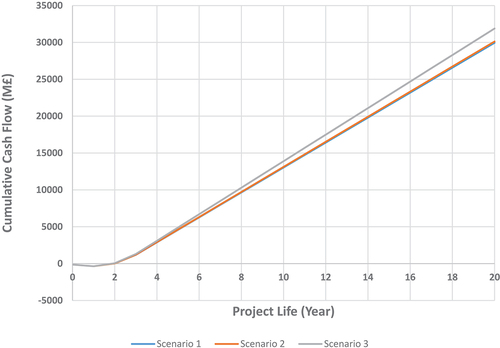
(14) is used (Sinnott and Towler Citation2021). Discovering all three scenarios is important to make comparisons and select a correct and profitable process. As shown in scenarion 3 shows a better performance with a relatively high cumulative cash flow of £31886 M.
Figure 4. Cumulative cash flow (M£) for three different scenarios over 20 years.
Or,
Conclusion
This paper presents an optimal design for a crude oil blending and distillation system by conducting rigorous simulations in Aspen HYSYS dynamic software. A suitable process to determine the product quality specification, optimal operating conditions, and the distillation configuration for crude oil separation was easily obtained. The process consists of three main units: a desalter, an atmospheric distillation column, and a naphtha debutanizer column. This separation process is currently under operation in the Baiji refinery and has a large separation capacity of 150,000 bpd. As the main feeds, Basrah light-2015 and Kirkuk-2011 crude oils have been used in the distillation column as three scenarios. The distillation process started with desalting the crude oil with freshwater and heating it to 100°C–150°C to remove all-forging particles. The distillation column presented in this study involves 30 stages and 3 side strippers attached to the main column. Three different design configurations have been presented with the same inlet flow rate to perform economic analyses such as the calculation of revenues, costs, and margins for each route. To improve the energy efficiency of the utilization rate of crude oil, an atmospheric distillation process unit in this refinery is considered. By comparing the results, it has been concluded that the blended crude oil scenario is the most profitable feedstock, with the Net Present Value (NPV) of £6,445.92 M. Despite the promising results discussed above, there are still many challenges to optimize the whole process and get a more valuable product.
Supplemental Material
Download MS Word (395.5 KB)Disclosure statement
No potential conflict of interest was reported by the authors.
Supplemental data
Supplemental data for this article can be accessed online at https://doi.org/10.1080/15567036.2023.2205365.
Additional information
Notes on contributors
Khalaf J. Jabbar
Mr Khalaf J. Jabbar is a PhD student in the School of Engineering, Faculty of Science and Engineering, University of Hull, Hull, UK.
Sharif H. Zein
Dr Sharif H. Zein is a Reader in the School of Engineering, Faculty of Science and Engineering, University of Hull, Hull, UK.
Abbas H. Hasan
Dr Abbas Hasan is a lecturer in the School of Engineering, Faculty of Science and Engineering, University of Hull, Hull, UK.
Usama Ahmed
Dr Usama Ahmed is an Associate professor at the Chemical Engineering Department at King Fahd University of Petroleum and Minerals, Dhahran, The Kingdom of Saudi Arabia.
A. A. Jalil
Prof. DR. A. A. Jalil is the director of the Centre of Hydrogen Energy, Institute of Future Energy, School of Chemical and Energy Engineering, Fac. of Engineering, Universiti Teknologi Malaysia, Johor Bahru, Johor, Malaysia.
References
- AIChE. 2015. Improve energy efficiency via heat integration. Available online at: https://www.aiche.org/resources/publications/cep/2010/december/improve-energy-efficiency-heat-integration (Accessed on 21/21/2022).
- Ali, A. A., and M. Khathi. 2019. Comparative study of Iraqi crude oil taken from the Nasiriyah refinery with various local and global crude oils. University of Thi-Qar Journal of Science Accessed on 27/10/2022 [Preprint] Available at. doi: 10.32792/utq/utjsci/vol6/1/11.
- Al-Khafaji, A. J., M. H. Hakimi, and A. A. Najaf. 2018. Organic geochemistry characterisation of crude oils from Mishrif reservoir rocks in the southern Mesopotamian Basin, south Iraq: Implication for source input and paleoenvironmental conditions. Egyptian Journal of Petroleum, 27 (1):117–30. Available. doi:10.1016/j.ejpe.2017.02.001.
- Bank of England. 2022. Daily spot exchange rate against Euro. Available online at: https://www.bankofengland.co.uk/boeapps/database/Rates.asp?Travel=NIxAZx&into=EUR [Accessed on 30/04/2022].
- Boiler Juice.com. 2022. Kerosene Prices in the UK. Available on line at: https://www.boilerjuice.com/kerosene-prices/[Accessed on 21/06/2022].
- Brown, P. 2022. A laboratory demonstration of the fractional distillation of crude oil. Availabe on line at: https://www.docbrown.info/index.htm
- Demibras, A., and H. S. Bamufleh. 2017. Optimization of crude oil refining products to valuable fuel blends. Petroleum Science and Technology 35 (4):406–12. Available at. doi:10.1080/10916466.2016.1261162.
- Eia. 2022. U.S. Energy Information Administration: Petroleum and other liquids. Available online at: https://www.eia.gov/dnav/pet/hist/LeafHandler.ashx [Accessed on 14/14/2022].
- European Commission. 2021. Weekly Oil Bulletin. Available online at: https://ec.europa.eu/energy/dataanalysis/weekly-oil-bulletined [Accessed 2/06/2022].
- Fahim, M. A., T. A. Al-Sahhaf, and A. S. Elkilani. 2010. Fundamentals of Petroleum Refining: Products composition. Oxford, UK and Amsterdam, the Netherlands: Elsevier.
- Gary, R. B., A. G. Visnja, and M. C. Tim. 2015. Changing refining configuration for heavy and synesthetic crude processing. Available online at: https://www.contracosta.ca.gov/DocumentCenter/View/28450/Fox-Report-Exh-13-Changing-Refinery-Configurations-for-heavy-and-Synnthetic-Crude-Processing [Accessed on: 3/02/2023].
- Global petrol prices.Com (2021) United Kingdom LPG prices. Available online at: https://www.globalpetrolprices.com/United-Kingdom/lpg_prices/[Accessed on 20/06/2022].
- Górak, A., and H. Schoenmakers. 2014. Distillation operation and applications. distillation in refining. London: Elsevier Inc.
- Gu, W., K. Wang, Y. Huang, B. Zhang, Q. Chen, and C. Hui. 2015. Energy optimization for a multistage crude oil distillation process. Chemical Engineering & Technology 38 (7):1243–53. doi:10.1002/ceat.201400130.
- Hamid, K. A. 2010. HYSYS: An introduction to chemical engineering simulation. Selecting a fluid package. 1st ed. Skudai, Johor, Malaysia: University Technology Malaysia.
- Hanyak, J., and E. Michael. 2020. Chemical process simulation and the Aspen HYSYS v10.0 Software, 17837. Lewisburg, PA: Bucknell University.
- Hlavačka, V. 1988. Heat recovery by heat pipe heat exchangers to improve energy efficiency in farming and industry. Innovation for Energy Efficiency: 117–28. Available online at. doi:10.1016/b978-0-08-034798-1.50016-1.
- Hou, J., X. Li, and H. Sui. 2015. The optimization and prediction of properties for crude oil blending. Computers & Chemical Engineering 76:21–26. compchemeng. doi:10.1016/j.compchemeng.2015.02.006.
- Howden, (2021). Where does crude oil come from. Available online at: https://www.howden.com/en-gb/articles/pcog/where-does-crude-oil-come-from. [Accessed on 15/06/2022].
- Khalaf, A. 2018. Steady state simulation of Basrah crude oil refinery distillation unit using aspen hysys. Thi-Qar University Journal for Engineering Sciences [Preprint]. Available at. doi: 10.31663/tqujes.9.2.312(2018).
- Kumar, R., R. K. Voolapalli, and S. Upadhyayula. 2018. Prediction of crude oil blends compatibility and blend optimization for increasing heavy oil processing. Fuel Processing Technology 177:309–27. Available at. doi:10.1016/j.fuproc.2018.05.008.
- Ledesma-Martínez, M., M. Jobson, and R. Smith. 2018. Simulation–optimisation-based design of crude oil distillation systems with preflash units. Industrial & Engineering Chemistry Research 57 (30):9821–30. doi:10.1021/acs.iecr.7b05252.
- Leffler, W. 2020. Petroleum refining in nanotechnical language. Affecting temperature on products. 5th. Nashville, Endeavor business media, LLC: Matthew Dresher.
- Liu, X. -W., X. Luo, and S. Kabelac. 2016. Optimal retrofit strategy of heat exchanger networks applied in crude oil distillation units. Industrial & Engineering Chemistry Research, 55 (43):11283–90. Available at. doi:10.1021/acs.iecr.6b01931.
- Li, S., Z. Zhang, X. Sun, Q. Fan, and J. Chen. 2007. Distillation yields and properties from blending crude oils: Maxilla and Cabinda Crude Oils, Maxila and daqing crude oils. Energy & Fuels, 21 (2):1145–50. Available at. doi:https://doi.org/10.1021/ef060316d.
- Mehdizadeh-Fard, M., and F. Pourfayaz. 2019. Advanced exergy analysis of heat exchanger network in a complex natural gas refinery. Journal of Cleaner Production 206:670–87. doi:10.1016/j.jclepro.2018.09.166.
- Modarress, H., and G. R. Vakili-Nezhaad. 2002. A new characterization factor for hydrocarbons and petroleum fluids fractions. Oil &gas Science and Technology 57 (2):149–54. Available online at. doi:10.2516/ogst:2002011.
- Muslim, H. 2005. Thermodynamic analysis of crude oil distillation systems. International Journal of Energy Research. 7(29):637–655
- Naji, F., A. Ateeq, and M. Al-Mayyah. 2021. Optimization of blending operation for the Iraqi oils. Journal of Physics Conference Series, 1773 (1):012037. Available at. doi:10.1088/1742-6596/1773/1/012037.
- Nalinakshan, S., V. Sivasubramanian, V. Ravi, A. Vasudevan, M. Sankar, and K. Arunachalam. 2019. Progressive crude oil distillation: An energy-efficient alternative to conventional distillation process. Fuel 239:1331–37. doi:10.1016/j.fuel.2018.11.033.
- Oil price.com. 2022. Iraqi Crude Oil Could. Available on line at: https://oilprice.com/Energy/Oil-Prices/Iraq-Oil-Could-Hit-100-Next-Year.html [Accessed on 16/06/2022].
- PNA. 2022. Crude oil blending application. Available online at: https://www.process-nmr.com/crude-blending/[Accessed on 16/06/2022].
- Robinson, P. R. 2006. Petroleum Processing Overview Robinson, P.R., Hsu, Chang S. 1 . In Practical Advances in Petroleum Processing. Co: Kalty 978-0-387-25789-1. doi:10.1007/978-0-387-25789-1.
- Sabiria, O., D. Mustapha, and T. Fatima. 2007. Distillation of complex mixture; Performance and analysis of a distillation column using exergy entropy. Entropy 9 (3):137–51. doi:10.3390/e9030137.
- Sad, C. M., M. Da Silva, F. D. Dos Santos, L. B. Pereira, R. R. Corona, S. R. Silva …, and V. Lacerda, E. V. R. Castro, P. R. Filgueiras, V. Lacerda. 2019. Multivariate data analysis applied in the evaluation of crude oil blends. Fuel 239:421–28. doi:10.1016/j.fuel.2018.11.045.
- Shaoping, L., D. Luoyong, S. Benxian, Z. Lijuan, T. Feng, X. Xinru, Y. Jingyi, and Z. Beilei. 2011. The distillation yield and properties of ternary crude oils blending. Petroleum Science and Technology, 29 (3):271–81. Available at. doi:10.1080/10916460902882800.
- Sinnott, T., and G. Towler. 2021. Chemical engineering design: principles, practice and economics of plant and process design. third ed. Oxford: Elsevier Ltd.
- Sotelo, D., A. Favela-Contreras, C. Sotelo, G. Jiménez, and L. Gallegos-Canales. 2017. Design and implementation of a control structure for quality products in a crude oil atmospheric distillation column. ISA Transactions 71:573–84. doi:10.1016/j.isatra.2017.08.005.
- Trading Economics. 2021. Naphtha: 2005-2021 data. Available online at: https://tradingeconomics.com/commodity/naphtha [Accessed 20/06/2022].
- Vasiliev, S., L. Ulyev, and M. Boldyryev. 2018. Process integration of crude oil distillation with technological and economic restrictions. Journal of Environmental Management 222:454–64. doi:10.1016/j.jenvman.2018.05.062.
- Waudby, H., and S. H. Zein. 2021. A circular economy approach for industrial scale biodiesel production from palm oil mill effluent using microwave heating: Design, simulation, techno-economic analysis and location comparison. Process Safety and Environmental Protection 148:1006–18. Available at. doi:10.1016/j.psep.2021.02.011.
- Xinhuanet. 2022. Iraq increases capacity of Baiji refinery to 280,000 barrel per day. Available online at: http://www.xinhuanet.com/english/2021-01/11/c_139659155.htm [Accessed on 15/06/2022].
- Zhang, B. J., and B. Hua. 2007. Effective MILP model for oil refinery-wide production planning and better energy utilization. Journal of Cleaner Production, 15 (5):439–48. Available at. doi:10.1016/j.jclepro.2005.08.004.