
 ?Mathematical formulae have been encoded as MathML and are displayed in this HTML version using MathJax in order to improve their display. Uncheck the box to turn MathJax off. This feature requires Javascript. Click on a formula to zoom.
Abstract
This study presents a combined application of hybrid life cycle sustainability assessment and multi-criteria decision-making, aiming to further advance an integrated sustainability assessment and decision-making for the selection of alternative-fuel taxis. First, a multiregional hybrid life cycle sustainability assessment model is built to evaluate macro-level sustainability impacts of various vehicle types: conventional gasoline vehicles, compressed natural gas vehicles, hybrid, and battery electric vehicles. Second, considering the subjective nature of the evaluation process, the interval-valued neutrosophic sets-based analytic hierarchy process is suggested to assess the results obtained from the life cycle model to determine the weight of each evaluation criterion. Then, the technique for order preference by similarity to the ideal solution is used to rank the sustainability performance. Two different charging scenarios are also tested. The results show that solar-powered BEVs are the best in the environmental impacts with the exceptions of water consumption and land use. Solar-powered BEVs are superior in human health impact, while, ICVs are the best in compensation and employment generations. The ranking results reveal that solar-powered BEVs are the best alternatives when all indicators are considered, followed by CNG vehicles. The proposed method provides a practical and life cycle-based decision-making approach to support and prioritize effective policies for more sustainable transportation.
1. Introduction
In the decade, the electrification of vehicle fleets has drawn widespread interest all over the globe. Electrifying the transport sector has been widely addressed and commonly seen as an attractive solution for reducing fossil fuel dependency, global climate change, air pollution, and its associated human health impact, toward achieving sustainable transportation. For instance, Norway, Britain, France, and India have established strategic plans to substitute conventional vehicles (fossil fuel-powered) with electric vehicles. Moreover, Japan, China, South Korea, Denmark, Ireland, Portugal, Spain, and Austria, have set up ambitious goals for electric vehicle sales (CNN, Citation2017). Electric taxis are considered as options for developing sustainable urban transportation. For example, in Amsterdam, the taxi electric service was the first in Europe to switch to 100% electric taxis. Today, cities like Stockholm, London, Dublin, Rome, Madrid, Barcelona, Prague, and Budapest, besides some metropolises in the US, Canada, and China are using electric taxi services on their roads (Bauer et al., Citation2018). However, the adoption of electric vehicle technologies has some drawbacks including, high initial price, limited electric range, operation-related issues, slow charging speed, insufficient charging infrastructure as well as undiscovered socioeconomic and environmental impacts, which necessitate a holistic and integrated decision and sustainability assessment approach (Melaina & Bremson, Citation2008; Qatar Green Leaders, Citation2017).
The structure of the paper is organized as follows: First, a review of the literature on sustainability assessment for electric taxis, as well as the multi-criteria decision-making methods are presented. Second, the novelty of the research is discussed. Third, the case study is presented, the scope is defined, and the proposed methodologies are explained. Fourth, the life cycle sustainability assessment results are presented. Fifth, alternative rankings are conducted. Lastly, the main findings are summarized, and future work is pointed out.
2. Literature review
2.1. Sustainability assessment of electric taxis
Life Cycle Assessment (LCA) method is commonly used for quantifying the vehicle's environmental impacts from cradle to grave (Aboushaqrah et al., Citation2020; Burchart-Korol et al., Citation2020; Nuri Cihat Onat et al., Citation2020). In this paper, we first presented a systematic literature review to investigate the gaps in the current literature for electric taxis LCA. According to the review of literature conducted (“Electric taxi” AND “Life cycle assessment” OR “Sustainability assessment” in either title, abstract, or keywords for the articles published in the period between 2000 and 2020, accessed on January 1, 2020, in the Scopus database), only three studies are found, and all found relevant to the research topic. Besides, three more studies are found through using the Google Scholar search engine, one of which is directly related to the research topic, while the rest have focused on autonomous electric taxis. The electric taxi studies were obtained from the Scopus database for the timeframe between 2000 and 2020. All the studies found in the literature are provided in Table S1 in the supplementary information (SI) file available on the journal's website.
Table 1. Fuel Efficiency of alternative vehicle technologies.
According to the literature, only four out of six studies conducted LCA of electric taxis. Of these four studies, two studies have covered the full LCA, while others limited the scope of their analysis to the environmental impacts during the operation phase only. Shi et al. (Citation2016) have conducted a comparative life cycle environmental assessment between gasoline and electric taxi in Beijing. The study has analyzed and compared ten environmental impact categories of the two types of taxi technologies, considering the full life cycle and the individual phases of the life cycle separately. Overall, in the case of China, battery electric vehicles performed a better environmental performance compared to gasoline vehicles. According to their critical findings, cleaner electricity generation, the efficiency of electric vehicles, and the lifetime of batteries were key aspects to maximize the environmental impacts. In another work, in Singapore, Reuter et al. (Citation2014) have analyzed the greenhouse gas (GHG) emissions of alternative taxi technologies using LCA for the operation phase and vehicle and battery production phase. In the operation phase, the fuel supply chain-related emissions were found to be significantly higher for electricity than for fossil fuels, but the overall findings showed that electric taxis perform better than all other options for operation phase impacts.
Ma et al. (Citation2017) have employed LCA to calculate operation phase-related carbon footprint and energy consumption of different electric vehicle types including electric taxis in Beijing between the period from 2012 to 2015. The results showed that around 7.1 million kJ energy has been saved and around 5.4 thousand tons of carbon emissions could be reduced by disseminating electric taxis in Beijing. Then, based on these results, the study forecasted the electric vehicles' performance for the period between 2016 and 2020, China's 13th Five-Year plan. According to the results, electric taxis have significant potential for CO2 and energy reduction. Onat et al. (Citation2017a, Citation2017b) quantified the carbon emissions generated in the operation phase for alternative-fuel taxi technologies in Istanbul. Their findings revealed that supply chains of electricity generation are the largest contributors to GHG emissions for electric taxis, though, overall, BEVs have the least GHG emissions compared to other technologies in the case of Istanbul.
On the other hand, two of the reviewed studies have addressed the benefits of autonomous electric taxis. According to these studies, autonomous taxis can reduce the overall environmental impacts. The potential environmental impact reduction depends on two main competing forces in the net benefits. Electrification and autonomy mostly mean lower energy consumption, thus lower environmental impacts. On the other hand, there is a rebound effect that causes users to travel more and thus have more impacts. It is very similar to previous efficiency improvement in some areas such as more energy-efficient light bulbs caused people to use more illumination, thus, net benefits in terms of environmental impacts are limited by more use of it due to efficiency benefits and reduced costs. Greenblatt and Saxena (Citation2015) have estimated the GHG emissions and costs of autonomous taxis in the US for the years 2014 and 2030. The authors found that the diffusion of automated taxis in 2030 can result in 87–94% GHG emission reduction relative to 2014 conventional vehicles, 63–82% GHG below the 2030 hybrid vehicles, and almost 100% reduction in oil consumption. Bauer et al. (Citation2018) proposed an agent-based model to identify the fleet configuration of the automated electric taxi with the lowest cost, and environmental impact on Manhattan Island. The results indicated that the automated electric taxis could reduce 58% of energy use and 73% of GHG emissions generated by the automated conventional vehicles. The authors found that the lowest cost fleet configuration is achieved with from 50 to 90 miles of battery range (all-electric range: the distance an electric vehicle can run with a fully charged battery until its battery depleted), together with either 44 or 66 chargers per square mile of 22 kW or 11 KW charging power, respectively.
This study distinguishes itself from the previous work in various ways. This study encompasses socio-economic aspects of sustainability, in addition to the environmental categories which were the most studied aspect using LCA. Furthermore, here, we employed an advanced Multi-Regional Input-Output Analysis (MRIO)-based Life Cycle Sustainability assessment approach where global supply chains of processes involved in taxi operations are covered. Also, stakeholder involvement allowed a comprehensive sustainability assessment framework where the alternative fuel taxi options are comprehensively evaluated and ranked.
2.2. Life Cycle sustainability assessment and decision making
There is a growing interest in the evaluation of socio-economic aspects of sustainability besides the environmental impacts, hence a paradigm shift from the traditional LCA to the Life Cycle Sustainability Assessment (LCSA) has taken place. LCSA is the up to date framework in the life cycle assessment field, in which Life Cycle Costing (LCC), Social Life Cycle Assessment (S-LCA), in addition to Environmental Life Cycle Assessment (LCA) are integrated to generate a more inclusive assessment (Kucukvar et al., Citation2014; Traverso et al. 2012a, 2012b; Zamagni et al., Citation2013). LCSA framework combines the three sustainable development dimensions: the environment, society, and economy, which are commonly called the "triple bottom line" (TBL) (Finkbeiner et al., Citation2010; Kucukvar & Tatari, Citation2013).
In the literature, LCSA is considered somehow a new framework, hence the applications of LCSA are highly limited (Onat et al., Citation2017a). Practical applications of LCSA can be enhanced through the integration of methodological approaches, such as the MRIO, Multi-Criteria Decision Making (MCDM), and system dynamics (Onat et al., Citation2017a). MRIO models are improved versions of single region input–output modeling that can serve best in the estimation of sustainability impacts on a global scale (Giljum et al., Citation2019; Minx et al., Citation2009; Onat & Kucukvar, Citation2020; Wood et al., Citation2014). Although, MRIO models can cover the entire global supply chain-related impacts and thereby provides a holistic perspective, the combination of MRIO with LCA is not sufficiently applied in the literature (Onat et al., Citation2017a). Besides, MCDM approaches are commonly employed for solving decision-making problems in which a set of criteria and alternatives exist (Kucukvar et al., Citation2019, Citation2017). These methods are useful when multiple criteria, especially if having conflicting nature, are to be considered simultaneously for ranking and selecting the best alternatives (De Luca et al. 2017; Abdella et al., Citation2020). On the other hand, the joint applications of MCDM and LCA in the literature are very limited. Hence, this study aims at analyzing the TBL impacts of the alternative vehicles from the LCSA perspective in conjunction with MRIO to account for the global supply chain impacts, as well as ranking the alternatives upon their corresponding sustainability performance using MCDM approaches.
The alternative vehicle fleets' life-cycle assessment has been addressed by many studies in the literature. For instance, Onat et al. (Citation2014) established a holistic LCSA model to quantify the impacts of 19 indicators, at the macro-level, from the TBL perspective, for the alternative passenger vehicles in the US. Many studies (Onat, Citation2015; Onat et al., Citation2016a,Citationb,Citationc,Citationd) employed single region input-output models to comprehensively evaluate the TBL impacts of alternative passenger vehicles in the US. In other work, Onat et al. (Citation2016c) used system dynamics modeling in combination with LCSA to analyze the TBL impacts of alternative vehicles in the US from an integrated system perspective. Also, the authors have investigated the dynamic relationships between the LCSA indicators. Furthermore, Onat et al. (Citation2016b) aimed to advance the LCSA literature by developing a novel uncertainty-embedded dynamic LCSA to identify the uncertainties and concerns in the sustainability assessment of the alternative vehicle options. Also, many studies in the literature have integrated MCDM techniques into the LCSA framework, such as multi-objective optimization to find out the optimal fleet mix (Onat et al., Citation2020; Onat et al., Citation2016d), intuitionistic fuzzy set methods to rank the vehicle alternatives (Onat et al., Citation2016a), the water footprint of electric vehicles (Onat et al., Citation2018), the material footprint of electric vehicles (B. Sen et al., Citation2020), life cycle sustainability assessment of autonomous trucks (Burak Sen et al., Citation2019), and eco-efficiency analysis of electric vehicles (N.C. Onat et al., Citation2019).
2.3. Neutrosophic sets
Neutrosophy as a new concept has opened new horizons in MCDM and inspired several types of research in the field. Due to its ability to handle various types of uncertainty, such as ambiguity, hesitancy, indeterminacy, hybridized methods with interval values neutrosophic (IVN) sets have gained ground. The idea of the neutrosophic set is originated from neutrosophy, a new concept in philosophy that deals with the nature, origin, and scope of neutralities (Biswas et al., Citation2016). Originally, Smarandache (Citation1998) developed neutrosophic sets as a generalization of classical sets, fuzzy sets, and intuitionistic fuzzy sets (Ali et al., Citation2018; Yang et al., Citation2017). Neutrosophic sets are seen as an extension of intuitionistic fuzzy sets (Abdel-Basset et al., Citation2019) with the ability to handle indeterminate data. AS reported, conventional fuzzy approaches are not suitable to deal with indeterminate relations (Ali et al., Citation2018; Deli, Citation2017). More precisely, Intuitionistic fuzzy sets can only tackle incomplete information whereas neutrosophic sets can cope with indeterminacy and inconsistency. By definition, the former assumes that the degrees of truth, indeterminacy, and falsity sum up to one while the latter, on the other hand, allows the decision-maker to quantify indeterminacy and inconsistency by explicitly assigning independent membership functions for truth, indeterminacy, and falsity (Deli, Citation2017; Kutlu Gündoğdu & Kahraman, Citation2020). So, neutrosophic sets are defined by three membership values where each element of the universe is characterized by a degree of truthiness, indeterminacy, and falsity, where the assigned values are between,]-0,1+[, the nonstandard unit interval (Bolturk & Kahraman, Citation2018a; Salama & Alblowi, Citation2012; Smarandache, Citation2019). In neutrosophic sets, the uncertainty and inconsistency that the decision-making problem possesses, are separately described. Two values, the truth (T: degrees of belongingness), the falsity (F: non-belongingness) degrees, represent uncertainty whereas the inconsistency is reflected as indeterminacy (I: a degree of hesitancy) value (Bolturk & Kahraman, Citation2018b; Karaaslan & Hayat, Citation2018). Considering its purposive properties, the neutrosophic fuzzy environment more realistically and accurately reflects many MCDM situations than the usual fuzzy framework does (Abdel-Baset et al., Citation2019).
Due to its specified properties, neutrosophic sets based fuzzy logic has been used in the solution of MCDM problems. Some application domains are as follows. Learning management system selection, cloud service selection (Ma et al., Citation2017), renewable energy alternative selection (Bolturk & Kahraman, Citation2018a), supplier selection (M. Abdel-Basset et al., Citation2018a, Citation2018b; M. Abdel-Basset et al., Citation2019a), and security service selection (M. Abdel-Basset et al., Citation2019b). We also see that neutrosophic sets have been integrated with a variety, if not many, of MCDM techniques, such as Analytical Network Process (ANP) and VIKOR (M. Abdel-Basset et al., Citation2019a), PROMETHEE (M. Abdel-Basset et al., Citation2019b), AHP (Bolturk & Kahraman, Citation2018a; M. Abdel-Basset et al., Citation2018a, Citation2018b). Considering the paucity of studies conducted, new attempts integrating neutrosophic sets based on fuzzy logic can offer novel contributions to decision-making problems where uncertainty is an essential factor.
3. Novelty and research objectives
In conclusion, few studies are investigating the sustainability impacts of alternative-fuel electric taxis in the literature. Overall, all of the studies focused only on some environmental impacts and life cycle cost impacts of alternative-fuel taxi options with no emphasis on macro-level impacts or consideration of a wide range of sustainability impact categories. Furthermore, there was no attempt to consider different impact categories to provide comprehensive decision support for the selection of the best alternative fuel option.
Considering the multiplicity of evaluation criteria of the sustainable vehicle selection problem, it is seen as a complex MCDM problem. In practice, researchers do not reach an agreement on a set of criteria when dealing with an MCDM problem even for the same practical case (Yilmaz et al., Citation2019). Moreover, the relative importance attached to evaluation criteria by decision-makers is strongly affected by several factors including availability, and ambiguity of data, background, and attitude of decision-makers (Lin et al., Citation2008). Similarly, practitioners of LCSA generally use subjective judgments and verbal expressions while eliciting proper weights for evaluation factors relying on uncertain, indeterminate, and ambiguous data sources. For such judgments, however, a precise numeric evaluation of alternative vehicles based on the LCSA study by the decision-maker is not a viable option. This necessitates a systematic approach that could handle a high level of ambiguity and indeterminacy while producing robust results (Erdoğan & Kaya, Citation2016a).
To this end, neutrosophic sets based AHP comes to our aid that enables us properly handling various types of uncertainty in the decision-making process (Abdel-Basset et al., Citation2018b; Bolturk & Kahraman, Citation2018b). After the weights of criteria are determined with neutrosophic sets based on AHP, the TOPSIS method is employed to determine the best sustainable vehicle. TOPSIS is a widely used MCDM approach with some promising properties such as simplicity and visual interpretability of the results (Jiang et al., Citation2019; Wang et al., Citation2019).
To this end, this study aims to achieve the following objectives:
To develop a holistic life cycle sustainability assessment method to quantify a wide range of sustainability impacts representing three pillars of the United Nation’s Sustainable Development Goals: environment, economy, and society.
To quantify the regional and global triple-bottom-line sustainability impacts of electric taxis for the first time using a hybrid multiregional life cycle sustainability assessment method.
To develop a multi-criteria decision support method for the selection of best alternative-fuel taxis considering all dimensions of sustainability, simultaneously.
To propose a novel neutrosophic set-based MCDM method to deal with various types of uncertainty, such as hesitancies, indeterminacies, and inconsistent information that sustainable vehicle selection problems may involve.
To provide an integrated sustainability assessment framework for policy support for a selection of alternative fuel electric taxi options.
4. Methods
Two main approaches, Life Cycle Sustainability Assessment (LCSA) and Multi-criteria Decision Making (MCDM) are employed to present an integrated sustainability assessment framework for the selection of alternative-fuel taxi options. In this research, a comprehensive sustainability assessment is conducted through developing an MRIO-based LCSA model to holistically analyze the impacts of 13 macro-level indicators concerning the environment, economy, and society. The model is created to compare four-vehicle technologies of potential candidates for taxis in Qatar including internal combustion vehicle (ICV), compressed natural gas vehicle (CNG), hybrid electric vehicle (HEV), and battery electric vehicle (BEV). CNG technology is included in the analysis as the natural gas resource is abundant in Qatar (world's third-largest natural gas reserves) (GECF, 2016), hence the inclusion of the CNG taxi option in the life cycle assessment is crucial. The proposed hybrid LCSA model is used due to its ability to cover the sustainability impacts throughout the supply chains of fuels on a global level. Also, an MCDM framework that combines Neutrosophic sets and TOPSIS method is built to rank the alternatives based upon their respective sustainability performance obtained from the LCSA-MRIO model for the two analyzed charging scenarios. In this study, IVN sets based AHP method is used to address uncertainties and indeterminacies, and expert judgments are used to determine the weights of each of the indicators used for ranking. After determining the weights, the alternative vehicle technologies options are ranked using the TOPSIS method, considering the quantified TBL sustainability impacts. For more details of the proposed MCDM method with mathematical formulations, please refer to the Section 5 of SI file.
4.1. System boundary
shows different vehicle's life cycle phases, highlighting the system scope which covers the vehicle’s operation phase mainly due to its high influence on environmental impacts relative to other life cycle phases. In , each process associated with each vehicle type is shown and their relations are expressed in form of arrows. For example, gasoline production is associated with both HEV and ICV, while the electricity generation process is only associated with BEV. Because of data limitation, other phases (i.e. manufacturing and end of life) fall outside the scope of this paper (Hawkins et al., Citation2013; Onat et al., Citation2015). All vehicles introduced in Qatar are imported from outside, and therefore, estimating the impacts associated with the vehicle's manufacturing phase is challenging and highly depends on the country of origin. Also, since the end-of-life vehicles in Qatar are typically sent to landfills for disposal without undergoing recycling processes, the end-of-life-related impacts data become not available. Typically, the quantification of the vehicle's operation phase is conducted for two parts, Well-to-Tank (WTT) and Tank-to-Wheel (TTW). WTT represents the upstream impacts of fuels from raw material acquisition to fuel production, distribution, and delivery.
Figure 1. System boundary and scope.
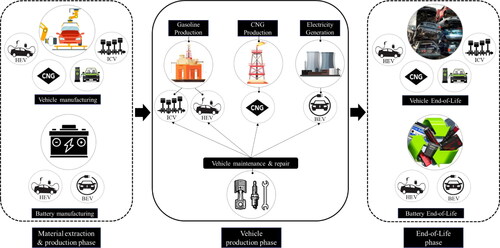
In the proposed MRIO-LCSA model, the WTT is further divided into three key components, 1) inside Qatar fuel supply (impacts of petroleum and compressed natural gas production as well as electricity generation at power plants inside Qatar), 2) inside Qatar sectors (impacts of suppliers for fuels production inside the regional boundary of Qatar excluding the fuel supply), and 3) outside Qatar sectors (impacts of suppliers for fuels production outside the regional boundary of Qatar). Whereas, TTW signifies the vehicles’ direct impact which comprises tailpipe emissions that release from vehicle exhaust during vehicle operation as a result of fuel combustion. 13 impact categories representing the environmental, economic, and social dimensions of sustainability are nominated for this sustainability assessment and they are introduced in Table S2 in (SI) file with a brief description for each. In this study, the sustainability impacts are quantified using the MRIO-LCSA model, with a functional unit of one kilometer (km) of vehicle travel.
The impacts of electric vehicles are assessed under two policy scenarios, Scenario 1 is based on the current electricity grid mixes in Qatar, and Scenario 2 is a futuristic scenario where electricity is assumed to be entirely produced by solar energy. Four different vehicle technologies of sedan type are considered, ICV, HEV, CNG, and BEV. Later, after the quantification process, this study uses two MCDM approaches, namely, neutrosophic sets and TOPSIS to rank the vehicle alternatives based on their respective sustainability performance.
4.2. Hybrid life cycle modeling
The life cycle impact quantification for the vehicle's operation phase is conducted using the MRIO-LCSA model for its capability to cover the supply chains related impacts on a global scale. The impacts associated with gasoline production, compressed natural gas supply, and electricity generation are the major components of WTT analysis for this study. To calculate WTT impacts resulting from each fuel supply along with the associated supply chains inside and outside Qatar, we extract the upstream impact factors from the proposed MRIO-LCSA model using a common database in life cycle analysis, the EXIOBASE 3.4. Besides, we used the vehicle fuel efficiency (the fuel amount required to travel one km) to perform the impact calculations, given below in . The fuel efficiency values reflect the real-world driving conditions (experimental values in 2019) and are obtained from the taxi operating company (a semi-government organization that owns and operate all the taxis in Qatar).
The WTT impacts related to gasoline production are evaluated for ICVs and HEVs and are computed by multiplying the upstream impact factors to produce per liter of gasoline, taken from the MRIO model, provided in Table S4, by the corresponding fuel efficiency of these vehicles. Also, since natural gas reserves are very abundant in Qatar, the impacts associated with the compressed natural gas production are considered in the WTT analysis. In the same way, the upstream impacts resulting from CNG vehicles are computed by multiplying the upstream impact factors of the production of a cubic meter of compressed natural gas, extracted from the established MRIO model, introduced in Table S5, by the respective vehicle’s fuel efficiency. Furthermore, electricity supply-related impacts are analyzed for BEVs, and since the existing electric power infrastructure in Qatar relies entirely on natural gas to generate electricity, the upstream impacts related to natural gas-based electricity generation are included in the analysis. The calculation of WTT impacts produced from the electricity supply is likewise performed by multiplying the BEV fuel efficiency by the respective impact factor per 1 kWh of natural gas-based electricity generation, derived from the developed MRIO model, shown in Table S6. Also, the impacts of generating 1 kWh electricity by solar are considered and computed in a similar way to the calculation of electricity by natural gas impact using the impact factors given in Table S7. In Scenario 2, all the potential impacts associated with establishing a solar energy power plant, encompassing all activities in its supply chains such as manufacturing of solar panels, as well as the energy required to manufacture solar panels. EquationEq. 1(1)
(1) shows the total WTT impact per vehicle km travel which can be used for either gasoline supply, compressed natural gas production, or electricity generation during the operation phase;
(1)
(1)
where SI: denotes the sustainability impact, i: denotes the sustainability indicator (environmental, economic, social), FE: indicates the vehicle fuel efficiency, m: represents the vehicle type, and UIF: represents upstream impact factors derived from the proposed MRIO-LCSA model.
On the other hand, in TTW analysis, the resulting tailpipe emissions occurring during vehicle operation due to fuel combustion are calculated for all vehicle types except for BEVs as BEVs operate on electricity and therefore have no tailpipe emissions. The total TTW impact for each vehicle is quantified by multiplying the vehicle fuel efficiency by the corresponding tailpipe emission factors. The tailpipe emission factors for burning a liter of gasoline and a cubic meter of compressed natural gas during the vehicle’s operation are obtained from a commonly used fuel-cycle model in life cycle studies, the Greenhouse Gases, Regulated Emissions, and Energy Use in Transportation (GREET 1) model.
5. Quantitative life cycle sustainability assessment
The results of the selected environmental, social, and economic impact categories are presented in this section for the studied alternative vehicles concerning the fuel supply and the associated supply chains inside and outside Qatar, as well as the tailpipe emissions during vehicle operation. Seven environmental impact categories; GWP, PMF, POF, water withdrawal, water consumption, energy use, and land use are presented for each alternative vehicle option in . The impact results of each of GWP, PMF, and POF are given in , respectively, for each vehicle technology.
Figure 2. Environmental impact results.
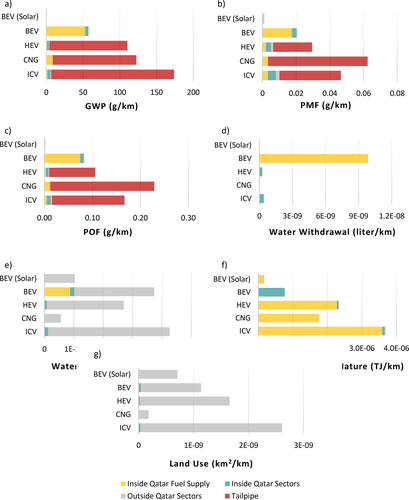
As shown, in GWP, PMF, and POF impact categories, the contribution of tailpipe impact for ICV, HEV, and CNG dominates the total impact of each technology. On the contrary, as BEVs run on electricity, their respective tailpipe impact is zero. In scenario 1, where BEVs are charged with electricity generated from natural gas, the great majority of BEVs impacts occur in the electricity generation power plant, while in scenario 2, when BEVs are powered with solar energy, the associated GWP, PMF, and POF impacts occur in the global supply chains of the electricity generation sector, and this makes up the majority of BEVs' total impact. In comparison, solar-powered BEVs are found to be far superior to BEVs powered with electricity generated by natural gas in terms of GWP, PMF, and POF impacts as solar-powered BEVs produce 99%, 95%, and 98% fewer impacts respectively. According to the results, the impacts inside the regional boundaries of Qatar including those associated with the fuel supply, the impacts of suppliers for petroleum and electricity production sectors within Qatar, and tailpipe impacts dominate the total impacts of all vehicle types with at least 96% of each vehicle's total to GWP, PMF, and POF. Whereas, when BEVs are charged with solar energy, the global supply chain-related impacts dominate the total contribution to these impact categories with approximately 74-87% of the total impact. All in all, BEVs perform better than all other alternatives for GWP, PMF, and POF impact categories and their performance becomes the best when they are charged with solar energy. In contrast, ICVs produce the largest GWP impact relative to other alternatives and CNG was found to be the worst vehicle option in terms of PMF and POF impacts.
also presents the water footprint impacts for each vehicle alternative, represented by water withdrawal and water consumption respectively. As can be seen, the fuel supply is the highest contributor to water withdrawal impact for BEVs powered by electricity from natural gas, while suppliers' impacts within Qatar for the petroleum production sector compose the great majority of the total water withdrawal impact for ICVs and HEVs. Whereas, the global supply chain-related impacts represent the dominant source of impact for CNGs and solar-powered BEVs. In this impact category, BEVs in scenario 1, is the most water-intensive vehicles compared to other alternatives, mainly due to substantial water withdrawals resulted from the natural gas-based electricity generation process. On the contrary, solar-powered BEVs in scenario 2 and CNGs in scenario 1 shows the minimum impacts compared to other alternatives. In the water consumption impact category, more than 97% of the total impact in all vehicle types comes from the global supply chains. BEVs powered by electricity from natural gas represent the vehicle alternative with the minimum water consumption impact generated from the outside the regional boundary of Qatar, with 73% of BEV’s total. For BEVs in scenario 1, after the global supply chains, the fuel supply impact has the second-largest contribution. Overall, ICV has the highest water consumption, while the least water-intensive vehicle is the CNG in both scenarios. On the other hand, a great majority of the water consumption is stemming from the global supply chain of gasoline production in Qatar. This finding shows the importance of boundary selection in LCA and how It could have been underestimated with a narrower boundary where supply chains are excluded.
Energy input from nature is shown in . The results show that the great majority of this impact occurs in the fuel supply for all vehicle types, accounting for at least 90% of each vehicle's total Energy input from nature impact. For BEVs powered with electricity by natural gas, the supply chain-related impacts inside Qatar represents the dominant source of Energy input impact with 99% of their total. ICVs have the largest energy input impact, while BEVs account for the least and thereby are better options relative to other alternatives and their performance becoming the best when powered by solar energy. Shifting from ICV to solar-powered BEVs can reduce the energy input impact by 95%. shows the land use impact results, and as shown, the supply chain impact occurring outside Qatar is the largest contributor to the total land use for all vehicle types, accounting for at least 97% of each vehicle's total. Overall, ICV is the most energy-intensive vehicle, while CNG appears to be the best option in both scenarios.
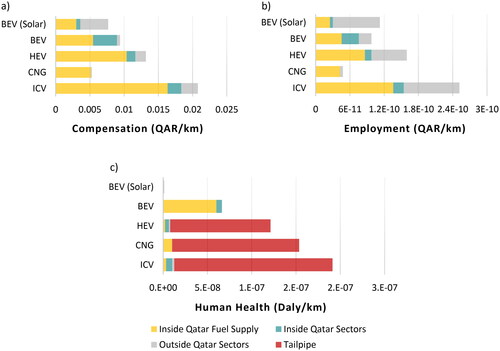
depicts the social impact results of three macro-level indicators: the compensation, employment, and human health impact, respectively. As can be seen, the power plants and their supply chains inside and outside Qatar represent the dominant sources of benefits to compensation and employment for all vehicle types. In compensation, at least 88% of the total benefit occurs inside Qatar for all vehicle types with an exception for solar-powered BEV where most of its related benefit (53%) takes place in the global supply chain. In employment, over 60% of the benefit for ICV and HEV occur inside Qatar, and around 90% and 75% of the total employment for CNG and BEV respectively occur in the regional boundary of Qatar. Whereas, the contribution of inside Qatar benefits to employment decreases sharply to around 27% for BEVs when charged by solar energy. As shown, ICV generates the largest benefit in compensation and employment, while CNGs represent the worst option in these categories. On the contrary, in human health, tailpipe impact is the highest contributor for all vehicle options, with around 93% of each vehicle's total human health impact except for BEVs as they have zero tailpipe impacts. For BEVs in scenario 1, the electricity generation sector is the dominant source of impact on human health, accounting for around 90% of BEV's total impact. As can be seen, ICV has the worst performance in the human health impact, while BEV has better performance than other alternatives especially when charged by solar energy.
Figure 3. Social impact results.
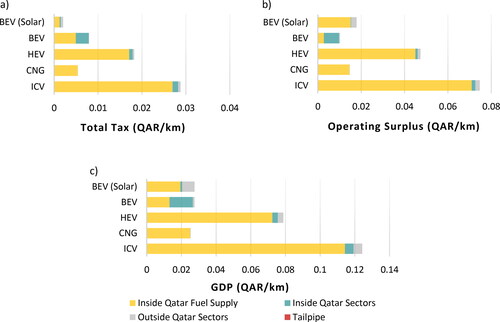
The economic impacts are also analyzed and presented in for three macro-level indicators: total tax, operating surplus, and GDP, respectively. The fuel supply is found to have the largest contribution to all the above-mentioned economic impact categories for all vehicle types. For BEVs in scenario 1, the fuel supply and its supply chains inside the regional boundary of Qatar represent the two dominant sources of impact to GDP, with roughly 48% and 49% of total contribution to GDP respectively. Furthermore, the contribution of BEVs in scenario 1 to operating surplus takes place mainly in the supply chains of the electricity generation sector within Qatar, accounting for approximately 70% of the total operating surplus. Overall, ICVs are more profitable compared to other options for these three economic indicators. On the contrary, in GDP, CNG has the worst performance in both scenarios. In total tax and operating surplus, CNG and BEV powered by electricity generated from natural gas represent the worst options respectively in scenario 1, while solar-powered BEV and CNG generate the least profit respectively in scenario 2.
Figure 4. Economic impact results.
6. A Systematic ranking of alternative fuel vehicles
The sustainable vehicle selection problem has several dimensions to be considered. Thus, it can be seen as an MCDM problem with contradicting multiple criteria. Furthermore, although the performance of each alternative vehicle on the selection criteria can be numerically quantified with ease, the preference relations established by the decision-makers over the evaluation criteria are highly subjective and involve various types of uncertainties. Given this motivation, we propose a two-stage approach to deal with this problem. The ranking model used IVN-AHP to determine the weights of the evaluation criteria. The obtained weights are used in TOPSIS to evaluate the alternatives.
In this study, a combined methodology of IVN-AHP and TOPSIS is proposed for the performance evaluation of 4 alternative vehicle technologies, ICV, HEV, CNG, and BEVs (both scenarios, when electricity is generated exclusively by natural gas and when generated entirely from solar energy). The framework is built upon the quantification of 13 macro-level sustainability indicators from environmental, economic, and social perspectives. We performed firstly neutrosophic AHP to determine the weights of main and sub-criteria as explained in the following section.
6.1. Stage 1: IVN-AHP
Step 1. The decision hierarchy is determined based on the three pillars of sustainability, namely, economic (EC), social (S), and environmental (ENV) sustainability. The three dimensions are employed as the main criteria where sub-criteria used under them are collectively determined by the experts.
Step 2. The pairwise comparison matrices are determined based on the verbal evaluation of three experts. Then, the verbal judgments are converted to IVN sets using the importance scale in Table S3. The IVN evaluation of the main criteria by experts is given in .
Table 2. Pairwise comparison matrix for main criteria.
Pairwise comparison matrices for sub-criteria under the three main criteria are obtained with respect to expert judgments and given in Tables S8–S10. The aggregated neutrosophic pairwise comparison matrix for main and sub-criteria is also shown in Tables S11–Table S14.
Step 3. Next, we calculate the normalized weights of the criteria by using the given interval-valued neutrosophic evaluation scale. Tables S15–S18 provide the obtained normalized weights for main and sub-criteria.
Step 4. The final combined IVN weights of the main and sub-criteria are calculated in this step and presented in Tables S19–S20.
Step 5. Given the combined IVN weights, we apply the deneutrosophication procedure to obtain the crisp weights. The final weights are given in which indicates that the three pillars of sustainability have received almost equal scores based on an expert evaluation with neutrosophic sets based on AHP. Also, a closer look at the reveals that Human Health (0, 22), GDP (0, 17), and Water Consumption (0, 11) are obtained as dominant sub-criteria under the three main areas of sustainability, respectively.
Table 3. The deneutrosophicated weights of main and sub-criteria.
6.2. Stage 2: Application of TOPSIS
This sub-section summarizes the details of the application of TOPSIS which employs the weights obtained in the previous stage of the case study.
Step 1. Performance values of each vehicle on the evaluation criteria are summarized in matrix form and can be seen in Table S21, where
denotes alternative
Step 2. This step serves the purpose of normalization of the decision matrix and the obtained matrix is given in Table S22.
Step 3. Next, we construct the weighted normalized decision matrix by multiplying the normalized decision matrix by corresponding global weights obtained with IVN-AHP. The results are shown in .
Table 4. Weighted normalized decision matrices.
Step 4. We build two artificial solutions, namely, the positive Ideal (
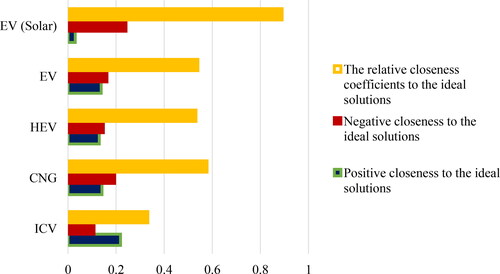
Step 5. The relative closeness coefficients to the ideal solutions are shown in .
Table 5. Positive–negative closeness coefficients values.
The higher
Step 6. Finally, alternatives are ranked in descending order by their respective closeness coefficients, where the highest value indicating the preferable alternative.
6.3. Rankings
Building on the sustainability results obtained by the developed MRIO-LCSA model, an MCDM model that combines IVN-AHP and TOPSIS method is built for ranking four alternative vehicles, ICV, CNG, HEV, and BEV (both scenarios, a 100% natural gas electricity generation mix, and a 100% solar electricity generation mix). It should be noted that a higher value of the closeness coefficient indicates that an alternative better resembles the positive ideal solution and differs widely from the negative ideal solution simultaneously.
From , when all sustainability impact categories are considered for vehicle selection, the solar-powered BEV achieves the best performance as it has the highest closeness coefficient value, while CNG, BEV, and HEV demonstrate similar performance. Given the closeness of the obtained scores, it is seen that it is not possible to make a healthy distinction between these three alternatives. On the other hand, the conventional ICV ranks as the worst alternative since it has the lowest closeness coefficient value.
Figure 5. Positive–negative closeness coefficients values.
7. Conclusion and future work
The main focus of this paper is that it takes into account the TBL indicators when quantifying the life cycle impacts of the alternative vehicles and integrates them into an MCDM framework that combines the neutrosophic sets based AHP and the TOPSIS method to rank these alternatives based upon their respective sustainability performance. The primary motivation of exploiting Neutrosophic sets based AHP-TOPSIS methodology was its ability to handle various types of uncertainty such as hesitancy, indeterminacy, and inconsistent information that ambiguate the nature of the decision-making process by the experts. The following conclusions are drawn based upon the life cycle assessment and MCDM results:
For the environmental impacts, ICV performs the worst in GWP, water consumption, energy inputs, and land use, while CNG produces the largest PMF and POF impacts. On the other hand, solar-powered BEV is overall a favored option for the studied environmental impacts except for water consumption and land use, where CNG vehicles achieve the best performance in these categories.
According to analysis results, over 95% of GWP, PMF, and POF impacts occur inside the regional boundary of Qatar for all vehicle types, except for solar-powered BEV where the majority of its impacts occur in the global supply chains.
In water consumption and land use categories, the global supply chain is found to be the largest contributor to all vehicle types. Conversely, in the energy inputs category, the regional boundary impacts account for the largest contribution to all vehicles including solar-powered electric vehicles. Whereas, in the water withdrawal category, the majority of the impact for ICV, HEV, and BEV takes place within Qatar, while 90% of the impact for CNG and solar-powered BEV occurs outside Qatar.
In social impact categories, solar-powered BEVs perform better than all other alternatives in human health impact, whereas, ICVs are the best options in terms of compensation and employment generation.
The majority of human health impacts, compensation, and employment generations take place inside the regional boundary of Qatar for all vehicle types, while for solar-powered BEVs, the global supply chain is the dominant contributor to these impacts.
The economic impacts assessment revealed that ICVs are the best options in total tax, operating surplus, and GDP impact categories as opposed to BEVs.
The majority of the three studied economic benefits are generated inside the regional boundary of Qatar for all vehicle types.
In terms of sustainability performance, the ranking results showed that solar-powered BEVs are superior to other options, followed by CNG, followed by BEV powered by electricity generated from natural gas, followed by HEV, while ICVs have the worst performance.
The proposed integrated sustainability assessment framework can be useful for policy decisions when selecting or promoting one alternative fuel vehicle among multiple options with consideration of multiple macro-level sustainability indicators, which are often in conflict with one another. To this end, when determining the importance of sustainability indicators, stakeholder perspectives can be efficiently integrated into a single assessment mechanism, and hence, optimal selections can be provided by considering all stakeholder’s perspectives. Furthermore, the proposed framework can be applied in different regions around the world as each country has Its unique supply-chain characteristics which would likely to show different results depending on the characteristics of their supply chains.
In this paper, the researchers proposed an integrated sustainability assessment framework, which is a flexible and transparent approach. Hence, the framework can be applied to any selection problem aiming to reveal the most sustainable option among many others in different regions in the world. In the future, other MCDM methods and their extension through the use of other fuzzy sets, such as hesitant fuzzy sets, intuitionistic sets, Pythagorean, type-2 fuzzy sets, or spherical fuzzy sets are considered to lead this work. The complex relationships among the sustainability indicators can better be captured using system dynamics models (Kelly et al., Citation2019; Kutty et al., Citation2020). Advanced eco-efficiency assessment models (Abdella et al., Citation2021a, Citation2021b) can be useful to address the selection problem of alternative vehicle technologies with multiple conflicting attributes. .
Supplemental Material
Download MS Word (128.3 KB)Acknowledgments
The authors acknowledge and appreciate Marubeni for the generous and continuous support for electric vehicle research at Qatar University.
Additional information
Funding
References
- Abdel-Baset, M., Chang, V., Gamal, A., & Smarandache, F. (2019). An integrated neutrosophic ANP and VIKOR method for achieving sustainable supplier selection: A case study in importing field. Computers in Industry, 106, 94–110. https://doi.org/10.1016/j.compind.2018.12.017
- Abdel-Basset, M., Manogaran, G., & Mohamed, M. (2019). A neutrosophic theory based security approach for fog and mobile-edge computing. Computer Networks, 157, 122–132. https://doi.org/10.1016/j.comnet.2019.04.018
- Abdel-Basset, M., Manogaran, G., Mohamed, M., & Chilamkurti, N. (2018a). Three-way decisions based on neutrosophic sets and AHP-QFD framework for supplier selection problem. Future Generation Computer Systems, 89, 19–30. https://doi.org/10.1016/j.future.2018.06.024
- Abdel-Basset, M., Mohamed, M., & Sangaiah, A. K. (2018b). Neutrosophic AHP-Delphi Group decision making model based on trapezoidal neutrosophic numbers. Journal of Ambient Intelligence and Humanized Computing, 9(5), 1427–1443. https://doi.org/10.1007/s12652-017-0548-7
- Abdella, G. M., Kucukvar, M., Ismail, R., Abdelsalam, A. G., Onat, N. C., & Dawoud, O. (2021a). A mixed model-based Johnson’s relative weights for eco-efficiency assessment: The case for global food consumption. Environmental Impact Assessment Review, 89, 106588. https://doi.org/10.1016/j.eiar.2021.106588
- Abdella, G. M., Kucukvar, M., Kutty, A. A., Abdelsalam, A. G., Sen, B., Bulak, M. E., & Onat, N. C. (2021b). A novel approach for developing composite eco-efficiency indicators: The case for US food consumption. Journal of Cleaner Production, 299, 126931. https://doi.org/10.1016/j.jclepro.2021.126931
- Abdella, G. M., Kucukvar, M., Onat, N. C., Al-Yafay, H. M., & Bulak, M. E. (2020). Sustainability assessment and modeling based on supervised machine learning techniques: The case for food consumption. Journal of Cleaner Production, 251. https://doi.org/10.1016/j.jclepro.2019.119661
- Aboushaqrah, N. N. M., Onat, N. C., Kucukvar, M., & Jabbar, R. (2020). Life cycle sustainability assessment of sport utility vehicles: The case for Qatar. Advances in Intelligent Systems and Computing 1091, 279–287. https://doi.org/10.1007/978-3-030-35543-2_22
- Ali, M., Dat, L. Q., Son, L. H., & Smarandache, F. (2018). Interval complex neutrosophic set: Formulation and applications in decision-making. International Journal of Fuzzy Systems, 20(3), 986–999. https://doi.org/10.1007/s40815-017-0380-4
- Bauer, G. S., Greenblatt, J. B., & Gerke, B. F. (2018). Cost, energy, and environmental impact of automated electric taxi fleets in Manhattan. Environmental Science & Technology, 52(8), 4920–4928.
- Biswas, P., Pramanik, S., & Giri, B. C. (2016). TOPSIS method for multi-attribute group decision-making under single-valued neutrosophic environment. Neural Computing and Applications, 27(3), 727–737. https://doi.org/10.1007/s00521-015-1891-2
- Bolturk, E., & Kahraman, C. (2018a). Interval-valued neutrosophic AHP with possibility degree method. Journal of the Analytic Hierarchy Process, 10, 431–446. https://doi.org/10.13033/ijahp.v10i3.545
- Bolturk, E., & Kahraman, C. (2018b). A novel interval-valued neutrosophic AHP with cosine similarity measure. Soft Computing, 22(15), 4941–4958. https://doi.org/10.1007/s00500-018-3140-y
- Burchart-Korol, D., Jursova, S., Fole, P., & Pustejovska, P. (2020). Life cycle impact assessment of electric vehicle battery charging in European Union Countries. Journal of Cleaner Production, 257, 1–15. https://doi.org/10.1016/j.jclepro.2020.120476
- Cihat Onat, N., Aboushaqrah, N. N. M., Kucukvar, M., Tarlochan, F., & Magid Hamouda, A. (2020). From sustainability assessment to sustainability management for policy development: The case for electric vehicles. Energy Conversion and Management, 216, 112937. https://doi.org/10.1016/j.enconman.2020.112937
- CNN (2017). These countries want to ban gas and diesel cars. Retrieved December 12, 2017, form http://money.cnn.com/2017/09/11/autos/countries-banning-diesel-gas-cars/index.html.
- Deli, I. (2017). Interval-valued neutrosophic soft sets and its decision making. International Journal of Machine Learning and Cybernetics, 8(2), 665–676. https://doi.org/10.1007/s13042-015-0461-3
- Erdoğan, M., & Kaya, İ. (2016). Evaluating Alternative-Fuel Busses for Public Transportation in Istanbul Using Interval Type-2 Fuzzy AHP and TOPSIS. Journal of Multiple-Valued Logic and Soft Computing, 26, 625.
- Finkbeiner, M., Schau, E. M., Lehmann, A., & Traverso, M. (2010). Towards Life Cycle Sustainability Assessment. Sustainability, 2(10), 3309–3322. https://doi.org/10.3390/su2103309
- Giljum, S., Wieland, H., Lutter, S., Eisenmenger, N., Schandl, H., & Owen, A. (2019). The impacts of data deviations between MRIO models on material footprints: A comparison of EXIOBASE, Eora, and ICIO. Journal of Industrial Ecology, 23(4), 946–958. https://doi.org/10.1111/jiec.12833
- Greenblatt, J. B., & Saxena, S. (2015). Autonomous taxis could greatly reduce greenhouse-gas emissions of US light-duty vehicles. Nature Climate Change, 5(9), 860–863.
- Hawkins, T. R., Singh, B., Majeau-Bettez, G., & Strømman, A. H. (2013). Comparative environmental life cycle assessment of conventional and electric vehicles. Journal of Industrial Ecology., 17(1), 53–64. https://doi.org/10.1111/j.1530-9290.2012.00532.x
- Jiang, Y., Zhang, J., Asante, D., & Yang, Y. (2019). Dynamic evaluation of low-carbon competitiveness (LCC) based on improved technique for order preference by similarity to an ideal solution (TOPSIS) method: A case study of Chinese steelworks. Journal of Cleaner Production, 217, 484–492. https://doi.org/10.1016/j.jclepro.2019.01.054
- Karaaslan, F., & Hayat, K. (2018). Some new operations on single-valued neutrosophic matrices and their applications in multi-criteria group decision making. Applied Intelligence, 48(12), 4594–4614. https://doi.org/10.1007/s10489-018-1226-y
- Kelly, C., Onat, N. C., & Tatari, O. (2019). Water and carbon footprint reduction potential of renewable energy in the United States: A policy analysis using system dynamics. Journal of Cleaner Production, 228, 910–926. https://doi.org/10.1016/j.jclepro.2019.04.268
- Kucukvar, M., Haider, M. A., & Onat, N. C. (2017). Exploring the material footprints of national electricity production scenarios until 2050: The case for Turkey and UK. Resources, Conservation and Recycling, 125, 251–263. https://doi.org/10.1016/j.resconrec.2017.06.024
- Kucukvar, M., Noori, M., Egilmez, G., & Tatari, O. (2014). Stochastic decision modeling for sustainable pavement designs. The International Journal of Life Cycle Assessment, 19(6), 1185–1199. https://doi.org/10.1007/s11367-014-0723-4
- Kucukvar, M., Onat, N. C., Abdella, G. M., & Tatari, O. (2019). Assessing regional and global environmental footprints and value added of the largest food producers in the world. Resources, Conservation and Recycling, 144, 187–197. https://doi.org/10.1016/j.resconrec.2019.01.048
- Kucukvar, M., & Tatari, O. (2013). Towards a triple bottom-line sustainability assessment of the U.S. construction industry. The International Journal of Life Cycle Assessment, 18(5), 958–972. https://doi.org/10.1007/s11367-013-0545-9
- Kutlu Gündoğdu, F., & Kahraman, C. (2020). A novel spherical fuzzy analytic hierarchy process and its renewable energy application. Soft Computing, 24(6), 4607–4621. https://doi.org/10.1007/s00500-019-04222-w
- Kutty, A. A., Abdella, G. M., Kucukvar, M., Onat, N. C., & Bulu, M. (2020). A system thinking approach for harmonizing smart and sustainable city initiatives with United Nations sustainable development goals. Sustainable Development, 28(5), 1347–1365. https://doi.org/10.1002/sd.2088
- Lin, C.-C., Wang, W.-C., & Yu, W.-D. (2008). Improving AHP for construction with an adaptive AHP approach (A3). Automation in Construction, 17(2), 180–187. https://doi.org/10.1016/j.autcon.2007.03.004
- Ma, Y., Ke, R. Y., Han, R., & Tang, B. J. (2017). The analysis of the battery electric vehicle's potentiality of environmental effect: A case study of Beijing from 2016 to 2020. Journal of Cleaner Production, 145, 395–406.
- Melaina, M., & Bremson, J. (2008). Refueling availability for alternative fuel vehicle markets: Sufficient urban station coverage. Energy Policy, 36(8), 3233–3241. https://doi.org/10.1016/j.enpol.2008.04.025
- Minx, J. C., Wiedmann, T., Wood, R., Peters, G. P., Lenzen, M., Owen, A., ... & Ackerman, F. (2009). Input–output analysis and carbon footprinting: An overview of applications. Economic Systems Research, 21(3), 187–216.
- Onat, N. C. (2015). A macro-level sustainability assessment framework for optimal distribution of alternative passenger vehicles. University of Central Florida.
- Onat, N. C., Aboushaqrah, N. N., Kucukvar, M., Tarlochan, F., & Hamouda, A. M. (2020). From sustainability assessment to sustainability management for policy development: The case for electric vehicles. Energy Conversion and Management, 216, 112937.
- Onat, N. C., Gumus, S., Kucukvar, M., & Tatari, O. (2016a). Application of the TOPSIS and intuitionistic fuzzy set approaches for ranking the life cycle sustainability performance of alternative vehicle technologies. Sustainable Production and Consumption, 6, 12–25. https://doi.org/10.1016/j.spc.2015.12.003
- Onat, N. C., & Kucukvar, M. (2020). Carbon footprint of construction industry: A global review and supply chain analysis. Renewable and Sustainable Energy Reviews, 124, 109783. https://doi.org/10.1016/j.rser.2020.109783
- Onat, N. C., Kucukvar, M., Aboushaqrah, N. N. M., & Jabbar, R. (2019). How sustainable is electric mobility? A comprehensive sustainability assessment approach for the case of Qatar. Applied Energy, 250, 461–477. https://doi.org/10.1016/j.apenergy.2019.05.076
- Onat, N. C., Kucukvar, M., & Afshar, S. (2019). Eco-efficiency of electric vehicles in the United States: A life cycle assessment based principal component analysis. Journal of Cleaner Production, 212, 515–526. https://doi.org/10.1016/j.jclepro.2018.12.058
- Onat, N. C., Kucukvar, M., Halog, A., & Cloutier, S. (2017a). Systems thinking for life cycle sustainability assessment: A review of recent developments. Sustainability, 9(5), 706. 2017, Page https://doi.org/10.3390/su9050706
- Onat, N. C., Kucukvar, M., & Tatari, O. (2014). Towards Life Cycle Sustainability Assessment of Alternative Passenger Vehicles. Sustainability. Sustainability, 6(12), 9305–9342. https://doi.org/10.3390/su6129305
- Onat, N. C., Kucukvar, M., & Tatari, O. (2015). Conventional, hybrid, plug-in hybrid or electric vehicles? State-based comparative carbon and energy footprint analysis in the United States. Applied Energy, 150, 36–49. https://doi.org/10.1016/j.apenergy.2015.04.001
- Onat, N. C., Kucukvar, M., & Tatari, O. (2016b). Uncertainty-embedded dynamic life cycle sustainability assessment framework: An ex-ante perspective on the impacts of alternative vehicle options. Energy, 112, 715–728. https://doi.org/10.1016/j.energy.2016.06.129
- Onat, N. C., Kucukvar, M., & Tatari, O. (2018). Well-to-wheel water footprints of conventional versus electric vehicles in the United States: A state-based comparative analysis. Journal of Cleaner Production, 204, 788–802. https://doi.org/10.1016/j.jclepro.2018.09.010
- Onat, N. C., Kucukvar, M., Tatari, O., & Egilmez, G. (2016c). Integration of system dynamics approach toward deepening and broadening the life cycle sustainability assessment framework: a case for electric vehicles. The International Journal of Life Cycle Assessment, 21(7), 1009–1034. https://doi.org/10.1007/s11367-016-1070-4
- Onat, N. C., Kucukvar, M., Tatari, O., & Zheng, Q. P. (2016d). Combined application of multi-criteria optimization and life-cycle sustainability assessment for optimal distribution of alternative passenger cars in U. Journal of Cleaner Production, 112, 291–307. https://doi.org/10.1016/j.jclepro.2015.09.021
- Onat, N. C., Kucukvar, M., Toufani, P., & Haider, M. A. (2017b). Carbon footprint analysis of electric taxis in Istanbul. In International conference in industrial engineering and operations management. IEOM Society, Bogota.
- Qatar Green Leaders (2017). The next big obstacle for electric vehicles? Charging infrastructure. http://www.qatargreenleaders.com/news/sustainability-news/1438-the-next-big-obstacle-for-electric-vehicles-charging-infrastructure (accessed 12.12.17).
- Reuter, B., Schönsteiner, K., Wagner, M., Gleyzes, D., Massier, T., Hamacher, T., & Lienkamp, M. (2014). Life cycle greenhouse gas analysis for automotive applications—a case study for taxis in Singapore. International Journal of Smart Grid and Clean Energy, 3(2), 127–134.
- Salama, A. A., & Alblowi, S. A. (2012). Neutrosophic set and neutrosophic topological spaces. IOSR Journal of Mathematics, 3, 31–35.
- Sen, B., Kucukvar, M., Onat, N. C., & Tatari, O. (2020). Life cycle sustainability assessment of autonomous heavy‐duty trucks. Journal of Industrial Ecology, 24(1), 149–164. https://doi.org/10.1111/jiec.12964
- Sen, B., Onat, N. C., Kucukvar, M., & Tatari, O. (2019). Material footprint of electric vehicles: A multiregional life cycle assessment. Journal of Cleaner Production, 209, 1033–1043. https://doi.org/10.1016/j.jclepro.2018.10.309
- Shi, X., Wang, X., Yang, J., & Sun, Z. (2016). Electric vehicle transformation in Beijing and the comparative eco-environmental impacts: A case study of electric and gasoline powered taxis. Journal of Cleaner Production, 137, 449–460. https://doi.org/10.1016/j.jclepro.2016.07.096
- Smarandache, F. (1998). Neutrosophy: Neutrosophic probability, set, and logic. Analytic Synthesis & Synthetic Analysis. American Research Press.
- Smarandache, F. (2019). About nonstandard neutrosophic logic (Answers to Imamura’s “Note on the Definition of Neutrosophic Logic”).
- Wang, Z., Hao, H., Gao, F., Zhang, Q., Zhang, J., & Zhou, Y. (2019). Multi-attribute decision making on reverse logistics based on DEA-TOPSIS: A study of the Shanghai End-of-life vehicles industry. Journal of Cleaner Production, 214, 730–737. https://doi.org/10.1016/j.jclepro.2018.12.329
- Wood, R., Hawkins, T. R., Hertwich, E. G., & Tukker, A. (2014). Harmonising national input—output tables for consumption-based accounting — experiences from exiopol. Economic Systems Research, 26(4), 387–409. https://doi.org/10.1080/09535314.2014.960913
- Yang, H.-L., Zhang, C.-L., Guo, Z.-L., Liu, Y.-L., & Liao, X. (2017). A hybrid model of single valued neutrosophic sets and rough sets: single valued neutrosophic rough set model. Soft Computing, 21(21), 6253–6267. https://doi.org/10.1007/s00500-016-2356-y
- Yilmaz, M. K., Kusakci, A. O., Tatoglu, E., Icten, O., & Yetgin, F. (2019). Performance evaluation of real estate investment trusts using a hybridized interval Type-2 Fuzzy AHP-DEA approach: The case of Borsa Istanbul. International Journal of Information Technology & Decision Making, 18(06), 1785–1820. https://doi.org/10.1142/S021922019500354
- Zamagni, A., Pesonen, H.-L., & Swarr, T. (2013). From LCA to life cycle sustainability assessment: Concept, practice and future directions. The International Journal of Life Cycle Assessment, 18(9), 1637–1641. https://doi.org/10.1007/s11367-013-0648-3