
 ?Mathematical formulae have been encoded as MathML and are displayed in this HTML version using MathJax in order to improve their display. Uncheck the box to turn MathJax off. This feature requires Javascript. Click on a formula to zoom.
Abstract
The supply of as well as the demand for carsharing has been increasing in recent years. Yet, these dynamics and carsharing's function as catalyzer toward a more sustainable transport behavior in German cities are still not fully understood. For this reason, we analyze supply data for 80 large cities in Germany regarding fleet numbers and supply densities. We combine this with analyses about carsharing (non-) members by drawing on the datasets Mobility in Germany and the German Mobility Panel. We find that carsharing members use walking, cycling, or public transport 1.4–1.5 times more often and motorized individual transport, respectively, less often than nonmembers. Based on this, we build user groups regarding the people's usage of the environmental alliance (i.e., walk, bicycle, public transport). In the subsequent multinomial logistic regression analysis for the years 2013, 2015, and 2017, we find that both increasing carsharing supply and being carsharing member are not effective measures to increase the share of walking, cycling, and public transport. The availability of mobility tools, especially the number of cars in households, are more important predictors.
Introduction
Tremendous changes for urban mobility are to be expected due to increasing population and the need to decrease greenhouse gas emissions. The European population living in cities is estimated to grow from 74% today up to 85% in 2050 (UN, Citation2019). This will increase the need for (new) transport options and services. Furthermore, transportation accounts for 20% of the total greenhouse gas emissions in Germany (Gniffke, Citation2020). However, in order to fulfill the climate targets, transport emissions need to be decreased by at least two thirds by 2050 (EEA, Citation2018). Hence, there is a conflict of objectives: Fulfilling the transport needs of a growing urban population while producing significantly less emissions in future.
One potential solution to this conflict is what has been termed “shared mobility” (Shaheen et al., Citation2020), based on the umbrella term “sharing economy” (Botsman & Rogers, Citation2010; Hamari et al., Citation2016). Drawing on the potential benefits of a “new culture of non-ownership” (Fromm et al., Citation2019), people are enabled to overcome the drawbacks of permanent ownership and, instead, have purposeful temporary access to resources (Fromm et al., Citation2019). The resulting higher utilization of resources denotes the sharing economy as one promising attempt toward a scalable sustainable business model (Botsman & Rogers, Citation2010).
Carsharing is one example within the transport sector that has been available for over 60 years (Ampudia-Renuncio et al., Citation2018) and is widely discussed in literature. By adding another mode to the choice set of travelers, and hence making their mobility behavior multimodal, carsharing is said to be one solution to the problems of air pollution, congestion and to achieve a reduction of private car ownership (Giesel & Nobis, Citation2016; Mehdizadeh et al., Citation2019; Nobis, Citation2006; Rabbitt & Ghosh, Citation2016). The operation scheme can be distinguished in station-based (Ampudia-Renuncio et al., Citation2018; Becker et al., Citation2017a; Bogenberger et al., Citation2016; Lempert et al., Citation2019; Zoepf & Keith, Citation2016), free-floating (Balac et al., Citation2019; Becker et al., Citation2017a; Molnar & Correia, Citation2019), and hybrid carsharing that combines station-based and free-floating services (Rotaris et al., Citation2019). Within and across these operation schemes, certain dimensions are examined: Characteristics of the service itself (Ampudia-Renuncio et al., Citation2018; Bogenberger et al., Citation2016; Lempert et al., Citation2019; Zoepf & Keith, Citation2016), the usage of the systems (Becker et al., Citation2017a; Citation2017b; Rotaris et al., Citation2019), the users of the systems (Becker et al., Citation2017b; Burghard & Dütschke, Citation2019; Münzel et al., Citation2019; Namazu et al., Citation2018), and environmental impacts (Becker et al., Citation2017a; Citation2020; Carroll et al., Citation2017; Clewlow, Citation2016; Dill et al., Citation2019; Namazu & Dowlatabadi, Citation2018), amongst others.
Yet, investigating supply and demand effects and their implications on overall mode-choice based on empirical data across a larger period in Germany is still very rare. Nevertheless, policymakers assume higher service-availability as driving force for the demand of carsharing (de Lorimier & El-Geneidy, Citation2013; Giesel & Nobis, Citation2016; Juschten et al., Citation2019).
Hence, in this article, we analyze carsharing supply in German cities and its consequences toward the demand for more environmentally friendly transport modes, that is, public transport, cycling, and walking. In doing so, this article aims at comparing demand and supply for carsharing. Since this has not been performed before, we want to contribute to a rarely discussed research topic that can be further developed. In addition, policymakers could draw conclusions from the early development of carsharing in large German cities and adjust their political instruments for carsharing based on our findings.
For this purpose, carsharing supply and respective mobility behavior is analyzed across 80 cities in Germany in 2013, 2015, and 2017. Therefore, we use supply data of carsharing services (BCS, Citation2013, Citation2015, Citation2017) and mobility behavior data from the German Mobility Panel (BMVI, Citation2020a). We apply multinomial logistic regressions with a dependent variable measuring the environmental friendliness of transport demand in order to depict the different effects of the factors.
In the remainder of this article, we first introduce the data and methods applied (Section 2), followed by the literature analysis (Section 3) and the discussion (Section 4). Conclusions (Section 5) with policy recommendations and an outlook close this article.
Literature review
Carsharing is considered as an important element of the sharing economy (Fromm et al., Citation2019; Münzel et al., Citation2018) and belongs to the “key areas of shared mobility” (Shaheen et al., Citation2020). This change in mobility supply is accompanied by and intertwined with a shift in mobility demand. According to Kuhnimhof et al. (Citation2012, Citation2013), many industrialized countries face a decline of the long-lasting increase in car-centric transportation (“peak car”), which dominated the second half of the 20th century. One of the most car-oriented age groups in Germany, people between 18 and 29, now turned into the opposite (Kuhnimhof et al., Citation2012; Citation2013). Existing research has identified several driving forces for the decline in car orientation especially among the younger population. These comprise multimodality, diminishing gender differences, a later start of the professional career and family formation, limited financial capacities, improved public transportation services, urbanization, and a loss of status of the car (Kuhnimhof et al., Citation2012; van Wee, Citation2015).
Previous studies on carsharing revealed young, high earning, and well-educated men as most incline to use carsharing (e.g., Clewlow, Citation2016; Nehrke & Loose, Citation2018; Prieto et al., Citation2017; Riegler et al., Citation2016). Riegler et al. (Citation2016) found potential cost savings and extended possibilities as non-sociodemographic influencing factors. They further distinguished station-based and free-floating carsharing and identified rather instrumental motives (i.e., the utility as transport mode itself) for station-based, while free-floating users show rather emotional motives (e.g., driving pleasure). Accessibility and availability of the vehicles play a major role in evaluating carsharing for (potential) users (de Lorimier & El-Geneidy, Citation2013; Giesel & Nobis, Citation2016; Juschten et al., Citation2019; Riegler et al., Citation2016). Reasons, which prevent people from using carsharing are more related to the individual benefits of the privately owned car such as independence or flexibility and partly driving pleasure, emotional connection, and habitual use (Riegler et al., Citation2016).
Several effects regarding vehicles and behaviors result in the potential of carsharing for sustainable mobility (Giesel & Nobis, Citation2016). Due to a relatively new fleet, carsharing vehicles have lower greenhouse gas (GHG) and noise emissions as well as energy consumptions than the general fleet of privately owned vehicles. Further, carsharing providers integrate more and more electric vehicles into their fleets which locally drive emission free. To this end, this occurs at higher adoption rates than for the total vehicle fleet (Clewlow, Citation2016; Giesel & Nobis, Citation2016). Yet, one of the major positive effects is that for some users the possession of a private car becomes obsolete. This in turn results in fewer vehicle kilometers traveled by car (VKT) and often the increased use of environmentally friendly transport modes (e.g., Clewlow, Citation2016; de Lorimier & El-Geneidy, Citation2013; Giesel & Nobis, Citation2016).
Clewlow (Citation2016) investigated the influence of carsharing on sustainable travel behavior in the San Francisco Bay Area. Results show that urban inhabitants, who are carsharing members, possess significantly fewer vehicles than nonmembers do (0.58 vs. 0.96 per household), whereas this could not be found in areas that are more rural. Members tend to display a multimodal behavior including the enhanced use of public transit, walking, and cycling compared to nonmembers. Regarding vehicle ownership, Riegler et al. (Citation2016) found similar results for Germany: While 80% of German households own a vehicle, these are just 25% among users of station-based and about half of free-floating users. Giesel and Nobis (Citation2016) compared the impacts of station-based and free-floating carsharing in the two German cities of Berlin and Munich (with Flinkster and DriveNow being the respective carsharing providers). They identified ubiquitous availability of carsharing vehicles as important condition for car shedding. Shaheen et al. (Citation2019) reviewed existing studies on the impacts of carsharing. Apart from several studies from North America, they also analyzed three studies on station-based carsharing (Giesel & Nobis, Citation2016; Lichtenberg & Hanel, Citation2007; Rydén & Morin, Citation2005) and two studies on free-floating carsharing (Firnkorn & Müller, Citation2011; Giesel & Nobis, Citation2016) in Germany. Their aggregation shows that for the German studies 14%–34% of users of station-based carsharing sold their private car and 14%–27% avoided the purchase of a new vehicle. Regarding free-floating carsharing, these shares were 7% and 14%, respectively. For one of the reviewed German investigations (station-based), the reduction in VKT was 28%–45%. Yet, the users’ modal shifts were rather topic of the North American studies in this aggregation and not investigated in the reviewed German or European studies. In short, the investigated modal splits shifted in net terms toward cycling (in four studies more people increased their bicycle usage, in one study more people decreased their bicycle usage, and in one study both hold the balance) and walking (in all nine studies more people increased than decreased walking). Against this, public transit shows no clear direction (in four studies more people increased, in five studies more people decreased usage). Therefore, in general on a global level, most of the literature published so far shows that both forms of carsharing are mostly beneficial in terms of a modal shift toward environmentally friendly mobility. Yet, station-based carsharing has a bigger impact due to lower levels of car ownership, respectively, higher ownership reduction of its users. This derived from different usage groups and patterns (Giesel and Nobis, Citation2016). Whereas station-based carsharing attracts more users who do not own a private car, free-floating carsharing is often seen as a supplemental aspect to other modes of transportation, respectively, public transport (Arndt et al., Citation2019; CIVITAS, Citation2016; Namazu & Dowlatabadi, Citation2018; Nehrke & Loose, Citation2018).
A recent study by Fromm et al. (Citation2019) investigated free-floating carsharing services in several major European metropolises and found that it is beneficial in terms of vehicle density in cities as well as GHG emissions. Regarding the modal shift, there is no clear direction. More respondents decreased their usage of public transport than increased, whereas the majority reported no change. This suggests that the investigated carsharing services are a comfortable alternative to public transit and—in general—are substituting these modes rather than complementing. Concerning bicycle use and walking, the effects are small, and the majority reports no change in behavior. In terms of VKT, the study estimated—depending on the city and scenario—a saving from 10 up to 109 million km per year, which corresponds to 55,000 up to 254,000 km per shared vehicle and year or 500 up to 6,700 km per user and year. Considering the two German cities investigated in this study, Berlin and Hamburg, it reveals that more respondents reduced their usage of the bicycle than increased it whereas the vast majority reported no changes. Regarding walking, both people who reduced and those who increased walking make of about 16% each, whereas about 68% report no change, which holds for both cities. Concerning public transit, the shares of people who decreased bus and urban rail usage are at least three times higher than the shares of people who increased their usage. The tendency is reversed with intercity rail (share of people who increased intercity rail at least two times higher than the share of those who decreased it). Hereby, again the majority reports no changes. Yet, pertaining to reduced VKT per shared vehicle, both German cities are in the upper end of reductions for the conservative as well as the optimistic scenario modeled by Fromm et al. (Citation2019).
Le Vine and Polak (Citation2019) investigated the effects of free-floating carsharing (DriveNow) in London and found that about half of respondents use carsharing in combination with other modes of transport, presumably as last-mile solution for public transit.
As the literature review points out, the function of carsharing in the overall transport behavior with respect to other low-emission modes, shows beneficial tendencies on a global level, which is dominated by studies conducted in the US.
Yet, especially in Germany, the modal shifts induced by the usage of carsharing is rather less investigated compared to American studies (e.g., Shaheen et al., Citation2019) or the direction is rather unclear (e.g., Fromm et al., Citation2019). For this reason, we analyze the mobility behavior of carsharing members compared to nonmembers in this article. Based on previous research reviewed above, which has shown that carsharing members possess less private vehicles and are more multimodal, we assume that such a multimodal mobility behavior reduces the modal share of the privately owned car—mostly for the benefit of more environmentally friendly modes such as cycling, walking, or public transit. However, apart from this assumed effect, there are some limitations associated with this assumption. Multimodality might not always imply a shift toward more environmentally friendly modes. Indeed, it can induce an increase in car usage if the private car is still regularly used and carsharing substitutes some trips, which would otherwise had been made with public transportation or by foot or bicycle. Moreover, this assumption may be more suitable for cities with a good infrastructure of public transportation or low urban sprawl, which ensures good walkability and bicycle-friendliness. Subsequently, we aim at investigating the driving forces behind this multimodal and more environmentally friendly behavior with special focus to the supply of carsharing—whether it is the carsharing membership, its vehicle density or rather other factors encompassing sociodemographic characteristics, mobility tools, and city characteristics regarding mobility.
Materials and methods
Data
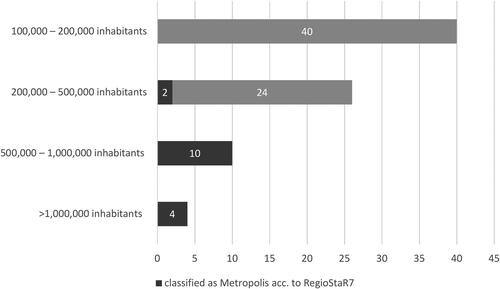
The scope of the investigation are the 80 largest cities in Germany with a population of at least 100,000 inhabitants (as of Dec 31, 2018)—with Berlin being the largest with 3,644,826 and Cottbus the smallest with 100,219 inhabitants. As shows, four cities have a population of more than one million inhabitants, ten of 500,000–1,000,000 inhabitants, 26 of 200,000–500,000 inhabitants, and 40 have a population of 100,000–200,000 inhabitants. According to RegioStaR7, which is the regional statistical spatial typology for mobility and transport research published by the Federal Ministry of Transportation in Germany (BMVI, Citation2020c), all cities with more than 500,000 inhabitants are classified as metropolises. In total, 16 of the 80 investigated cities are metropolises, while the other 64 are either regiopolises or large cities (BMVI, Citation2020c).
Figure 1. Cities investigated by number of inhabitants and classification as metropolis according to RegioStaR7 (BMVI, Citation2020c).
For the demand-side, we use data from the surveys “Mobility in Germany” (MiD) from 2017 and the “German Mobility Panel” (MOP) from 2013, 2015, and 2017. The MiD contains 316,361 respondents including their sociodemographic information and the modes of transportation used (BMVI, Citation2020b). After filtering for respondents who have reached the age of 18 (German adulthood) and who live in the aforementioned cities, the sample entails 87,690 respondents.
The German Mobility Panel (MOP) is a mobility survey that is carried out annually with about 1,000 households. The movements of all persons in the household are collected for one week. The data further contain information about usage of transport modes as well as sociodemographic characteristics. All German-speaking households in Germany are eligible to take part in the survey. The sample is designed to be population-representative in the recruitment phase and controlled for the characteristics spatial type, household type, and car ownership (further information on the sampling procedure can be found in Kantar TNS, Citation2018). It has been collected since 1994. In this article, we focus on the years 2013, 2015, and 2017. Filtering for the population over 18 years in the 80 cities under investigation results in sample sizes of 702 persons for 2013, 769 for 2015, and 876 for 2017, which are used for our analyses (BMVI, Citation2020a). With both surveys (MiD and MOP), actual sample sizes used for the conducted analyses may differ due to the exclusion of respondents who did not specify their answer or questions which only were asked to a subgroup. The reason for this is that the large sample size of the MiD is achieved through the combination of different survey methods such as paper and pen interviews (PAPI), computer assisted telephone interviews (CATI), and computer assisted web interviews (CAWI). With proxy interviews, it is possible that interviewees respond for other household members (Nobis & Köhler, Citation2018). These different methods and interview types result in slight differences in the questionnaire design, so that the MiD has the peculiarity that not every question is asked to every participant. Therefore, the subsamples of different questions can be of different sizes. In the following analyses, the sample sizes are specified, respectively. Both the MiD and the MOP contain information whether the respondents are members of a carsharing service or not.
Regarding the supply-side data, we draw on the results of an investigation by the “Bundesverband Carsharing” (BCS) that is a lobby organization of the German carsharing companies. The BCS analyzes the total number of carsharing vehicles—station-based and free-floating—and the density per 1,000 inhabitants for German cities (BCS, Citation2019). We use data for the years 2013, 2015, 2017, and 2019. Further data on the cities’ populations and municipal areas were gathered from the Federal Statistical Office of Germany (Destatis, Citation2019).
Methods
By comparing sociodemographic data, the equipment with mobility resources, and the actual mobility behavior, a deeper understanding of the user groups and possible impacts on behavior is provided. To investigate factors influencing mobility behavior and especially investigate the influence of the carsharing supply and its membership in conjunction with other input variables, we generate four distinct groups of people in accordance to their transport behavior. We do so by defining the groups based on their modal share of trips undertaken by foot, bicycle, and public transit. In doing so, we can assess the importance of the environmentally friendly modes in the mobility choice set of individuals. This offers four classes of traveler groups that are based on the four quartiles of the share regarding the mentioned modes. This categorical grouping is used as dependent variable for the multinomial logistic regression. The respective groups can be found in .
Table 1. User groups used as dependent variable categories.
When comparing proportions, for example, the share of respondents with a public transit season ticket, Fisher’s exact test is applied. This test is used here, since it secures viable results also with small sample sizes and little observations. Further, exact tests are more appropriate when the data is very imbalanced (Mehta & Patel, Citation1996), which occurs when comparing carsharing members with nonmembers, which outnumber the former by far.
The explaining variables used can be assigned to three areas and are summarized in : Sociodemographic characteristics, that is, age, gender, income, and education. Individual mobility resources include the possession of a driver’s license as well as a public transit pass, the number of cars in the household, bicycle ownership, and the membership in a carsharing organization. Furthermore, supply and city characteristics cover the city’s supply density with carsharing vehicles, binary variables indicating the existence of public transit stations within walking distance, and a binary variable indicating if the respective city is a metropolis according to RegioStaR7 classification. The RegioStaR7 categorization integrates different settlement structures, includes the central importance of cities and enables a population distribution that is suitable for sampling (BMVI, Citation2020c). Here, due to the urban focus, we select all cities that are metropolises (RegioStar7-71: e.g., Berlin or Hamburg), or regiopolises or large cities (RegioStaR7-72: e.g., Karlsruhe or Wiesbaden). Categorical input variables are encoded as dummy variables with the middle category being the reference basis.
Table 2. Summary of the independent variables used for the analysis.
We analyze the influence of the variables depicted above on the share of environmentally friendly modes by applying multinomial logistic regression. Hence, we allow the dependent variable to have more than two characteristics. This generalization of a logistic model was first developed by Cox (Citation1966) and three years later independently by Thiel (Backhaus et al., Citation2018; Cramer, Citation2002). Finally, McFadden (Citation1973) linked the multinomial logit model to the theory of discrete choice. The multinomial logistic regression function for G output categories is defined as follows:
with
as independent variable,
and
as constant, and
respectively,
as coefficients. The coefficients are estimated via Maximum-Likelihood, which means that the estimated values for the parameters should maximize the likelihood of the realized data (Backhaus et al., Citation2018).
In this article, the output categories of the dependent variable are the four traveler groups (reference, low eco, medium eco, high eco) depicted in . The independent variables are listed in . We estimate the models using Python's Statsmodels (Seabold & Perktold, Citation2010).
Results and discussion
Statistical analyses of data samples
Supply characteristics
Carsharing is widespread in large German cities. In 2019, nearly all large German cities had at least one carsharing provider (all cities except for Herne). The top five cities regarding the supply density with station-based carsharing, presented in , are dominated by rather small cities with large universities. On the other hand, the large German metropolises dominate the top five ranking regarding the free-floating carsharing supply density, which is depicted in . Regarding the supply density, Karlsruhe and Freiburg achieve the highest values for both per 1,000 inhabitants and per km2. Hence, these cities outperform metropolises such as Munich that comes third in terms of vehicle density per km2. Especially for the density per 1,000 inhabitants, it is the larger cities or regiopolises that offer a high supply and not the metropolises.
Table 3. Five highest supply densities of station-based carsharing in 2019 (Data from 2013 and 2019).
Table 4. Five highest supply densities of free-floating carsharing in 2019 (Data from 2013 and 2019).
Absolute fleet sizes—when station-based and free-floating are considered jointly—range from cities with one shared car such as Moers, Bottrop, and Remscheid up to 5,814 vehicles in Berlin. Split into station-based and free-floating, the fleet sizes range from one in the three cities just mentioned to 927 in Karlsruhe for station-based and from two in Neuss up to 5,200 in Berlin for free-floating. In general, it can be observed that free-floating carsharing is offered in 24 cities, whereof most are larger ones. There is no city, which has free-floating carsharing but does not have station-based carsharing. Comparing the fleet sizes of the different types, it turns out that the four cities with more than a million inhabitants—Berlin, Hamburg, Munich, Cologne—have a large imbalance in favor of the free-floating fleet (e.g., Berlin with 624 station-based and 5,200 free-floating vehicles). Apart from those four cities plus Düsseldorf and Stuttgart, in all other cities the ratio is reversed. This represents a tendency, which is in line with the findings of Münzel et al. (Citation2018) that many grassroot carsharing operators professionalized their services and pivoted from nonprofit to for-profit organizations. This affected mostly mid-sized to larger cities. Against this, free-floating carsharing organizations are often backed by companies from related industries and are not organically grown as the aforementioned. Yet, they were established more recent and their operators tend to target larger cities.
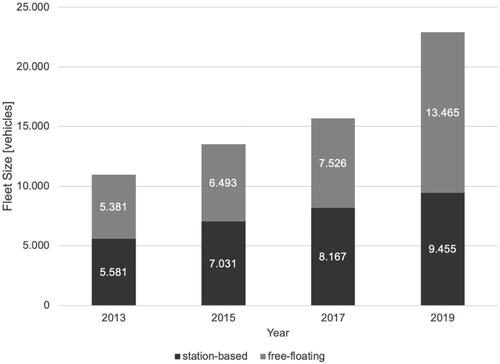
Since 2013, the supply of vehicles for carsharing has faced significant growth. depicts the development of the total carsharing fleet of the investigated cities (2013 only cities with more than 200,000 inhabitants are considered). The aggregated carsharing fleet rose from 10,692 vehicles in 2013, to 13,524 in 2015, to 15,693 in 2017, and eventually up to 22,920 in 2019. This corresponds to growth rates of 23.4% from 2013 to 2015, 16.0% from 2015 to 2017, and 46.1% from 2017 to 2019. However, the growth rate from 2013 to 2015 is to be interpreted with care due to the smaller number of cities in 2013. Whether this growth is due to expanded geographical coverage or the deployment of more vehicles in the unchanged area, is not investigated by the BCS. Yet, as population density of the catchment area is one primary success factor for the implementation of carsharing services (Arndt et al., Citation2019; CIVITAS, Citation2016) carsharing usually starts in the city center. Subsequently, due to network externalities, which are inherent in the carsharing market (Münzel et al., Citation2018) it is important for operators to increase their fleet to attract more customers.
Figure 2. Total number of station-based and free-floating carsharing vehicles in Germany (own display based on BCS, Citation2013, Citation2015, Citation2017, Citation2019).
Comparing the two types of carsharing, growth rates of free-floating carsharing are distinctly higher than those of station-based carsharing. Some cities display growth rates from 2013 to 2019 of more than 1,000% for the combined consideration of station-based and free-floating, for instance Augsburg (from 15 cars to 193) and Krefeld (from 2 cars to 24). Indeed, such high growth is realized rather in cities that had not been fully exploited in 2013. In the majority of cities, the increase turns out to be more moderate. However, looking at the city with the highest supply density Karlsruhe (), the fleet growth from 2013 to 2019 is also about 76%. Whereas other cities which were already well served in 2013, such as Stuttgart, Cologne, and Dusseldorf showed lower growth ranging from 4.7% to 29.3%, Munich and Berlin had a growth of 160.7% and 100.9% respectively. Since 2013, only six cities showed a decline in available carsharing vehicles: Braunschweig, Dortmund, Duisburg, Essen, Gelsenkirchen, and Oberhausen.
Besides city- or provider-specific vehicle stocks and supply densities, the findings reveal some tendencies regarding the services as well as city types in Germany. Station-based carsharing seems to be the widespread default mode of carsharing while free-floating is likely to be an extension for a few metropolises. This comes along with large fleet sizes in the respective metropolises, so that free-floating has higher fleet numbers to date ().
User groups and mobility behavior
Looking at customers of carsharing services, in MiD 2017, 3,009 out of 43,761 respondents who received the question on carsharing membership on individual level are members of a single carsharing organization, 1,133 are members of several organizations, and 39,619 are no member of any carsharing organization. This results in a carsharing membership share of 9.5%. The MOP collects the carsharing membership status since 2012 and the development shows a double-stage trend. In 2012 and 2013, the share of respondents who are members of a carsharing organization is about 2%, 3% in 2015 and 4.5% in 2017. As with the supply developments, it has to be noted that the temporal changes are accompanied by changes in the sample sizes as well as actual carsharing members. The very low absolute number of carsharing users in the first years of its inclusion in the MOP may lead to a poor comparability.
The analysis of the MiD and MOP reveal significant differences in the sociodemographic characteristics between members and nonmembers of carsharing organizations. compares the key sociodemographic data of the two groups. Fisher’s exact test is applied to determine whether proportions in the respective groups differ significantly. Analyzing the distribution of the age groups reveals that the younger groups below 50 years are overrepresented with the carsharing users whereas the older age groups are underrepresented. The income distributions also reveal significant differences: Whereas the lower income groups are underrepresented in the members, the higher are overrepresented. Regarding education, more than 70% of the carsharing members have a university degree compared to 45% with the nonmembers. In addition, the share of respondents with higher education entrance is higher among carsharing members while other educational backgrounds are less common. A comparison of the residential situation reveals that carsharing members live significantly more often in metropolises. With more than 80%, the vast majority lives in a metropolis, whilst this share reaches barely 54% with nonmembers. The differences between MiD and MOP are quite substantial in the details but nevertheless show a common picture: Carsharing members are younger, generate a higher income, achieved higher education and tend to live in metropolises. Therewith, the results join the ranks of several previous studies—which are, however, often limited to carsharing in restricted geographical areas such as Clewlow (Citation2016), Giesel and Nobis (Citation2016), Prieto et al. (Citation2017) or Nehrke and Loose (Citation2018).
Table 5. Sociodemographic characteristics for the groups of carsharing members and nonmembers (Data from 2017).
depicts the distribution of transport modes across all trips made of carsharing members as well as nonmembers. Further, the significance of differences as results of Fisher’s exact tests are depicted. Investigating the trip-based modal split of the MiD revealed significant differences, too. However, for both groups—carsharing members and nonmembers—the motorized individual traffic (MIT) is the most widely used means of transportation—but to a different extent. Whereas the MIT dominates the modal split of nonmembers with nearly half of all trips, it accounts for only 30.9% of trips made by carsharing members. With a share of 21.7% for public transit, 23.7% for foot, and 23.8%, the environmentally friendly modes make up nearly 70% of total trips conducted by carsharing members. Regarding the nonmembers, these modes just account for around half of the trips. When comparing both groups, carsharing members stand out with an almost equal split of modes ranging only from 21.7% to 30.9%. Against this, the mode choices for trips of nonmembers range from 13.3% to 48.4%.
Table 6. Undertaken trips by carsharing members and nonmembers including distribution across transport modes (Data from 2017).
Regarding the modal split, the results of the MOP are also depicted in and are comparable to those of the MiD. Yet, the spreads between members and nonmembers are even larger. Here, nearly 75% of trips of members are made by foot, bicycle or using public transit. Within the MOP data, the members’ equal usage of the different modes becomes even more apparent—it ranges from 23.2 to 28.7%. Against this, nonmembers display a more unbalanced mode choice—ranging from 13.0 to 49.2% of trips.
Analysis of impact factors
The descriptive statistics analysis reveals that carsharing members show a more frequent usage of environmentally friendly transport modes such as the environmental alliance, that is, cycling, public transportation, or walking. As next step, we aim at identifying the driving factors of this observation and especially the role of carsharing and its influence. The analysis is based on the MOP surveys of 2013, 2015, and 2017, as supply data is available for these years. The available MiD datasets did not allow analyses on the city-level, therefore it is excluded in the following analysis.
Sample sizes are n = 763 for the 2017 sample, n = 688 for the 2015 sample, and n = 480 for 2013 sample. It must be noted that the latter comprises only cities with more than 200,000 inhabitants. We estimate one multinomial logistic regression per year with the configurations described in Section 2.2. All models are significant and with McFadden’s Pseudo-R2 values of at least 0.29, the models all depict satisfying goodness of fit. depicts the odds ratios for the three years. Three groups, that is, low, medium, and high eco-mode shares are shown whilst the fourth, the quartile with the lowest share of eco-friendly transport modes, is the reference category. The share of these three categories across the sample is also shown.
Table 7. Model results and odds-ratios of multinomial logit regression.
In general, the results show that the mobility resources of an individual have higher impacts than the individual’s sociodemographic profile or the supply or city characteristics. Regarding sociodemographic variables, age has only very little influence, whilst being male is associated with a lower probability of falling in groups with higher shares of eco-friendly modes. Whereas in 2013 and 2015 belonging to the lower education group leads to lower probabilities of using more environmentally friendly modes, in 2017 this is inversed. The picture regarding the higher education group looks similar.
For carsharing membership, the odds-ratios show quite substantial numbers: 2.7 and 2.8 for the low and medium eco-group in 2017. Thus, being a carsharing member increases the probability to display sustainable mobility behavior. However, these effects are not statistically significant. Due to very few people being carsharing members in 2013 and 2015 (2013: 12, 2015: 22 people), data did not allow us to include the variable into the respective models. Consequently, although adding another transport mode to the choice set and, hence, increasing the multimodal travel behavior of people, being a carsharing member does not necessarily lead to a higher usage of public transport or active modes. On the other hand, holding a driver’s license leads to lower probabilities to fall into classes with frequent usage of eco-friendly modes, the number of cars of the household regularly shows significant impacts. The more cars in the household, the less likely it is that the respondent shows high shares of eco-friendly modes.
The possession of a public transit season ticket is indeed the most significant and strongest predictor; it is significant for all groups in each year. Overall, its possession leads to higher probabilities to fall into a group with a higher share of eco-friendly modes. Yet, for 2013 and 2015 only to a certain extent, as the odds ratios are smaller for the highest category compared to the second highest. Owning a bicycle also leads to higher probability to display a behavior with a higher share of eco-friendly modes, which is mostly significant.
Supply density of carsharing per 1,000 inhabitants does not have major impacts on the probability of people using more eco-friendly modes. The odds-ratios differ between 0.8 and 2.3 and are significant for one group (low eco) in one year (2015) only. Higher supply densities with carsharing vehicles seem to have a rather negative impact on sustainable mobility behavior in 2013, while it is associated with higher probabilities of being in a group with high shares of eco-friendly modes in 2015 and 2017. The supply density considering the area of the city in km2 was also tested and delivered no different result. Thus, we find that increasing the amount of vehicles, and hence the supply density, is not a sufficient measure to enhance the eco-friendliness of transport demand. It is hence also no measure to strengthen the demand for active modes or public transport as one could assume carsharing to play the role of the first-/last-mile connection. However, public transport stops in walkable distance increase the probability of using eco-friendly transport modes frequently.
Interestingly, the magnitude of the odds ratios differs over time and across the different investigated public transport modes. Bus and tram stops in 2013 are not associated with higher probabilities to display a mobility behavior with high shares of eco-friendly modes while these odds are higher in 2015 and especially in 2017. Apart from that, train stops, subway and urban railway stops show mostly increasing odds for the higher groups, which means that living within walkable distances around public transit stops increases the probability to belong to groups with high shares of eco-friendly transport modes. The influence of living in a metropolis is also indistinct. In 2013, metropolitan inhabitants have higher odds in the reference group. Whereas in 2015, living in a metropolis is associated with higher probability of being in the highest group, this cannot be observed for 2017.
The regression analyses reveal mobility resources as strongest and most significant predictors for mobility behavior. Not surprisingly, the possession of a public transit season ticket and a bicycle increase the probability of displaying a sustainable mobility behavior significantly. Furthermore, many cars in the household and the possession of a driver’s license decrease the probability. However, we did not find significant effects of carsharing toward a more environmentally friendly transport behavior, neither for the supply nor for the demand.
For the supply-side, one could argue that the density of carsharing vehicles is not relevant in absolute terms but has to be higher than a certain threshold in order to become an attractive alternative for travelers. As soon as people realize there is “enough” supply, they might consider it an alternative. Increasing supply above this level would then have no more effect. On the demand-side, simply being a member might not be sufficient to actively influence the travel behavior as this does not say in which pattern or regularity the person uses carsharing. Maybe carsharing unfolds its potential and influence toward the overall (and more environmentally friendly) travel demand as soon as people use it on a regular basis and not before. As can be seen from the regression results, the remaining mobility tools (car, bicycle ownership and holding a transport pass) have substantial impacts on the eco-friendliness of transport demand. This might overlay the effects of carsharing and as it is usually more accessible (even with high supply densities of carsharing) determines the choice set of transport alternatives more directly.
On a global scale, several studies analyzed the impacts of carsharing with similar methods such as the ones we applied in this study. For instance, Mishra et al. (Citation2015) applied propensity score matching, which is based on a logit model, to analyze effects of carsharing on vehicle holdings and travel behavior in the San Francisco Bay Area. Similar to our findings from the comparison of user groups, they find that urban carsharing members display a more sustainable travel behavior, which encompasses lower vehicle holdings and higher use of walking, cycling, and public transit, than nonmembers. Zhou et al. (Citation2020) conducted a nested logit model, which is related to the MNL model, to assess the impact of carsharing on private vehicle holdings in major Australian cities. Like the paper at hand, Zhou et al. (Citation2020) also studied the general public. Their analyses show, that carsharing availability has no influence on respondents’ vehicle ownership decisions. This in line with our findings, that carsharing seems to have no or just very little impact on sustainable travel behavior, especially when compared to mobility tools or infrastructural factors regarding public transit. However, studies using similar methods as those applied here found support for carsharing itself as factor for sustainable travel behavior. For example, Giesel and Nobis (Citation2016) and Namazu and Dowlatabadi (Citation2018) both used binary logistic regression to investigate factors influencing car ownership with the focus on station-based and free-floating carsharing. They found that carsharing leads to a reduction of private car ownership and use and identified it as driving force for sustainable mobility (Giesel & Nobis, Citation2016). Moreover, carsharing membership can also serve as predictor for shedding a car (Namazu & Dowlatabadi, Citation2018).
Conclusions
This study analyzes supply and demand data in order to investigate carsharing and its impacts for mobility behavior and changes thereof. The data show that carsharing today is a widespread mode in the urban transportation landscape in Germany—with a grown number of cars and increasing supply as well as increasing user numbers on the demand side. It can be shown that all major cities in Germany offer station-based carsharing with the free-floating service being an extension mainly in metropolises.
By using travel survey data comprising all major German cities (MOP and MiD) to compare carsharing members with nonmembers, this study is able to confirm—on national level—previous studies which found remarkable differences regarding sociodemographic profile and mobility behavior on city or regional level. So, carsharing users tend to be younger, better educated, more often male and inhabitants of metropolises than on average. Furthermore, they use environmentally friendly transport modes such as walking, cycling, and public transit 1.4–1.5 times more often than nonmembers.
We further investigate the influencing factors on sustainable mobility behavior by conducting multinomial logistic regressions whereby particular focus is laid on the supply density of carsharing vehicles of the individual’s residence city and on the individual’s membership status and their interaction with other variables. Those variables turn out to be rather less influential and significant compared to (other) mobility tools of the individual, such as public transit pass holdings and corresponding infrastructure, bicycle ownership, or number of cars in the household. Thus, solely increasing the supply of carsharing in German cities is not sufficient in terms of changing mobility patterns toward more sustainable ones. Or, it has as least not been important in the past. In addition, being member of a carsharing service does not necessarily lead to a more multimodal travel behavior, which in turn could decrease the carbon footprint of the person's travels. Despite the clear orientation toward sustainable transportation of carsharing members, which we showed in the comparative analyses, the membership status has only very little influence (and not significant) in the MNL model. Another unexpected outcome is the overall low influence of the city and supply characteristics. Further, the low influence of the city’s status as metropolis is surprising, especially when considering the often-postulated image of metropolises being the starting point for a sustainable development (e.g., 2thinknow, Citation2021; UN, Citation2013).
The sociodemographic and mobility tool preconditions are more important in this regard. As shown in the analyses, the number of privately owned cars is a much better predictor for sustainable transport behavior. We did not analyze interaction effects of carsharing supply or membership in this work, which could yield more detailed results for discussing the effects of carsharing on sustainable transport behavior. One can argue that carsharing membership and shedding of private vehicles is intercorrelated as well as carsharing supply and the overall transport infrastructure in the city. Thus, there is room for further research decomposing the main effects investigated here.
This work is limited to the extent of data used as well as the explanatory variables integrated. Due to the missing differentiation on the city level, we were not able to use the larger MiD dataset for this analysis. Further research could overcome this drawback by integrating more regionally specific data and match it accordingly. Due to the missing differentiation of the MiD, the multinomial logistic regression described above is conducted using the smaller MOP dataset. Yet, the spatial perspective on the supply and demand of carsharing in German cities requires more in-depth research in order to understand according dynamics. Additional research might conduct a similar analysis using high-resolution spatial data on cell-level and compare respective results between the cities or city categories (large city and metropolis). Moreover, it might be valuable to further integrate latent factors such as attitudes and modality lifestyles into future analyses on a city-level.
In terms of policy recommendations, regulators should accompany the strategy toward reducing emissions from transport by measures aiming to reduce car ownership in the first place. Since all cities studied offer carsharing, we argue that the push needs to come via the demand-side by decreasing the private car’s attractiveness without directly decreasing the demand for carsharing services. One might think of parking fees or toll roads excluding carsharing vehicles. Fuel pricing or bans of vehicles in cities could also increase the demand for carsharing, making supply densities more important. Future research is needed to analyze the potential effects thereof. Moreover, the infrastructure for cycling and public transport are key toward a more sustainable transport behavior. Hence, these need to be high up in the agenda for policy makers in order to enable the urban population to actually use these modes in a safe and efficient manner.
Acknowledgments
This publication was written in the framework of the Profilregion Mobilitätssysteme Karlsruhe, which is funded by the Ministry of Economic Affairs, Labour and Housing in Baden-Württemberg and as a national High Performance Center by the Fraunhofer-Gesellschaft. The funding sources were not involved in the work. The authors thank Dr. Johannes Schuler from Fraunhofer ISI for helpful comments on previous versions of the manuscript.
Disclosure statement
No potential conflict of interest was declared by the authors.
Correction Statement
This article has been republished with minor changes. These changes do not impact the academic content of the article.
References
- 2thinknow. (2021). Innovation Cities Index 2018: Global. Retrieved March 16, 2021 from https://www.innovation-cities.com/innovation-cities-index-2018-global/13935/.
- Ampudia-Renuncio, M., Guirao, B., & Molina-Sanchez, R. (2018). The impact of free-floating carsharing on sustainable cities: Analysis of first experiences in Madrid with the University Campus. Sustainable Cities and Society, 43, 462–475. https://doi.org/10.1016/j.scs.2018.09.019
- Arndt, W., Drews, F., Hertel, M., Langer, V., & Wiedenhöft, E. (2019). Integration of shared mobility approaches in Sustainable Urban Mobility Planning: Topic Guide. Deutsches Institut für Urbanistik.
- Backhaus, K., Erichson, B., Plinke, W., & Weiber, R. (2018). Multivariate Analysemethoden – Eine anwendungsorientierte Einführung. Vol. 15. Springer Gabler.
- Balac, M., Becker, H., Ciari, F., & Axhausen, K. W. (2019). Modeling competing free-floating carsharing operators – A case study for Zurich, Switzerland. Transportation Research Part C: Emerging Technologies, 98, 101–117. https://doi.org/10.1016/j.trc.2018.11.011
- BCS. (2013). CarSharing Städteranking 2013. Bundesverband Carsharing.
- BCS. (2015). CarSharing Städteranking 2015. Bundesverband Carsharing.
- BCS. (2017). CarSharing Städteranking 2017. Bundesverband Carsharing.
- BCS. (2019). CarSharing Städteranking 2019. Bundesverband Carsharing.
- Becker, H., Balac, M., Ciari, F., & Axhausen, K. W. (2020). Assessing the welfare impacts of Shared Mobility and Mobility as a Service (MaaS). Transportation Research Part A: Policy and Practice, 131, 228–243. https://doi.org/10.1016/j.tra.2019.09.027
- Becker, H., Ciari, F., & Axhausen, K. W. (2017a). Comparing car-sharing schemes in Switzerland: User groups and usage patterns. Transportation Research Part A: Policy and Practice, 97, 17–29. https://doi.org/10.1016/j.tra.2017.01.004
- Becker, H., Loder, A., Schmid, B., & Axhausen, K. W. (2017b). Modeling car-sharing membership as a mobility tool: A multivariate Probit approach with latent variables. Travel Behaviour and Society, 8, 26–36. https://doi.org/10.1016/j.tbs.2017.04.006
- BMVI. (2020a). German Mobility Panel (MOP): Longitudinal study on the travel behavior of the population. Federal Ministry of Transport and Digital Infrastructure (BMVI). Retrieved August 28, 2020, from http://mobilitaetspanel.ifv.kit.edu/english/index.php. Data repository: https://daten.clearingstelle-verkehr.de/192/.
- BMVI. (2020b). Mobilität in Deutschland (MiD). Federal Ministry of Transport and Digital Infrastructure (BMVI). Retrieved August 28, 2020, from http://www.mobilitaet-in-deutschland.de/. Data repository: https://daten.clearingstelle-verkehr.de/279/.
- BMVI. (2020c). Regionalstatistische Raumtypologie (RegioStaR). Retrieved Accessed August 27, 2020, from https://www.bmvi.de/SharedDocs/DE/Artikel/G/regionalstatistische-raumtypologie.html.
- Bogenberger, K., Weikl, S., Schmöller, S., & Müller, J. (2016). Entwicklung und Nutzungsstruktur von Carsharing-Systemen in Deutschland. In: C. Jacoby & S. Wappelhorst (Eds.), Potenziale neuer Mobilitätsformen und -technologien für eine nachhaltige Raumentwicklung (pp. 157–174). Akademie für Raumforschung und Landesplanung.
- Botsman, R., & Rogers, R. (2010). What's mine is yours: The rise of collaborative consumption. Harper Business.
- Burghard, U., & Dütschke, E. (2019). Who wants shared mobility?: Lessons from early adopters and mainstream drivers on electric carsharing in Germany. Transportation Research Part D: Transport and Environment, 71, 96–109. https://doi.org/10.1016/j.trd.2018.11.011
- Carroll, P., Caulfield, B., & Ahern, A. (2017). Examining the potential for car-shedding in the Greater Dublin Area. Transportation Research Part A: Policy and Practice, 106, 440–452. https://doi.org/10.1016/j.tra.2017.10.019
- CIVITAS. (2016). Smart choices for smart cities. Cities towards Mobility 2.0: Connect, share and go!. Retrieved March 19, 2021, from https://civitas.eu/sites/default/files/civ_pol-07_m_web.pdf.
- Clewlow, R. R. (2016). Carsharing and sustainable travel behavior: Results from the San Francisco Bay Area. Transport Policy, 51, 158–164. https://doi.org/10.1016/j.tranpol.2016.01.013
- Cox, D. R. (1966). Some procedures connected with the logistic qualitative response curve. Research papers in statistics: Festschrift for J. Neuman. Wiley.
- Cramer, J. S. (2002). The origins of logistic regression. Discussion paper. Tinbergen Institute.
- de Lorimier, A., & El-Geneidy, A. M. (2013). Understanding the Factors affecting vehicle usage and availability in carsharing networks: A case study of communauto carsharing system from Montréal, Canada. International Journal of Sustainable Transportation, 7(1), 35–51. https://doi.org/10.1080/15568318.2012.660104
- Destatis. (2019). Städte (Alle Gemeinden mit Stadrecht) nach Fläche, Bevölkerung und Bevölkerungsdichte am 31.12.2018. Statistisches Bundesamt.
- Dill, J., McNeil, N., & Howland, S. (2019). Effects of peer-to-peer carsharing on vehicle owners’ travel behavior. Transportation Research Part C: Emerging Technologies, 101, 70–78. https://doi.org/10.1016/j.trc.2019.02.007
- EEA. (2018). Greenhouse gas emissions from transport. European Environment Agency. Retrieved August 27, 2020, from https://www.eea.europa.eu/data-and-maps/indicators/transport-emissions-of-greenhouse-gases/transport-,emissions-of-greenhouse-gases-11.
- Firnkorn, J., & Müller, M. (2011). What will be the environmental effects of new free-floating car-sharing systems? The case of car2go in Ulm. Ecological Economics, 70(8), 1519–1528. https://doi.org/10.1016/j.ecolecon.2011.03.014
- Fromm, H., Ewald, L., Frankenhauser, D., Ensslen, A., & Jochem, P. (2019). A study on free-floating carsharing in Europe: Impacts of car2go and DriveNow on modal shift, vehicle ownership, vehicle kilometers traveled, and CO2 emissions in 11 European cities (Working Paper Series in Production and Energy. 36). Karlsruhe Service Research Institute.
- Giesel, F., & Nobis, C. (2016). The impact of carsharing on car ownership in German cities. Transportation Research Procedia, 19, 215–224. https://doi.org/10.1016/j.trpro.2016.12.082
- Gniffke, P. (2020). Nationale Trendtabellen für die Treibhausgas-Emissionen nach Sektoren des Klimaschutzgesetzes: 1990 - 2018. Stand zur Vorjahresschätzung: 11.03.2020.
- Hamari, J., Sjöklint, M., & Ukkonen, A. (2016). The sharing economy: Why people participate in collaborative consumption. Journal of the Association for Information Science and Technology, 67(9), 2047–2059. https://doi.org/10.1002/asi.23552
- Juschten, M., Ohnmacht, T., Thao, V. T., Gerike, R., & Hössinger, R. (2019). Carsharing in Switzerland: Identifying new markets by predicting membership based on data on supply and demand. Transportation, 46(4), 1171–1194. https://doi.org/10.1007/s11116-017-9818-7
- Kantar TNS. (2018). Deutsches Mobilitätspanel (MOP) – Erhebung der Alltagsmobilität sowie der Pkw-Fahrleistungen und Kraftstoffverbräuche. Endbericht zum Paneljahr 2017/2018.
- Kuhnimhof, T., Buehler, R., Wirtz, M., & Kalinowska, D. (2012). Travel trends among young adults in Germany: Increasing multimodality and declining car use for men. Journal of Transport Geography, 24, 443–450. https://doi.org/10.1016/j.jtrangeo.2012.04.018
- Kuhnimhof, T., Zumkeller, D., & Chlond, B. (2013). Who made peak car, and how? A breakdown of trends over four decades in four countries. Transport Reviews, 33(3), 325–342. https://doi.org/10.1080/01441647.2013.801928
- Le Vine, S., & Polak, J. (2019). The impact of free-floating carsharing on car ownership: Early-stage findings from London. Transport Policy, 75, 119–127. https://doi.org/10.1016/j.tranpol.2017.02.004
- Lempert, R., Zhao, J., & Dowlatabadi, H. (2019). Convenience, savings, or lifestyle? Distinct motivations and travel patterns of one-way and two-way carsharing members in Vancouver. Transportation Research Part D: Transport and Environment, 71, 141–152. https://doi.org/10.1016/j.trd.2018.12.010
- Lichtenberg, J., & Hanel, F. (2007). Carsharing und ÖPNV: Nutzen für beide? Eine Analyse der Situation in Franfkurt am Main. Der Nahverkehr. Öffentlicher Personenverkehr in Stadt und Region. 11/2007, 37–41.
- McFadden, D. (1973). Conditional logit analysis of qualitative choice behavior. Frontiers in Economics. Academic Press.
- Mehdizadeh, M., Zavareh, M. F., & Nordfjaern, T. (2019). Mono- and multimodal green transport use on university trips during winter and summer: Hybrid choice models on the norm-activation theory. Transportation Research Part A: Policy and Practice, 130, 317–332. https://doi.org/10.1016/j.tra.2019.09.046
- Mehta, C., & Patel, N. (1996). Exact Tests. SPSS.
- Mishra, G. S., Clewlow, R. R., Mokhtarian, P. L., & Widaman, K. F. (2015). The effect of carsharing on vehicle holdings and travel behavior: A propensity score and causal mediation analysis of the San Francisco Bay Area. Research in Transportation Economics, 52, 46–55. https://doi.org/10.1016/j.retrec.2015.10.010
- Molnar, G., & Correia, G. H. d. A. (2019). Long-term vehicle reservations in one-way free-floating carsharing systems: A variable quality of service model. Transportation Research Part C: Emerging Technologies, 98, 298–322. https://doi.org/10.1016/j.trc.2018.11.017
- Münzel, K., Boon, W., Frenken, K., & Vaskelainen, T. (2018). Carsharing business models in Germany: Characteristics, success and future prospects. Information Systems and e-Business Management, 16(2), 271–291. https://doi.org/10.1007/s10257-017-0355-x
- Münzel, K., Piscicelli, L., Boon, W., & Frenken, K. (2019). Different business models – different users?: Uncovering the motives and characteristics of business-to-consumer and peer-to-peer carsharing adopters in The Netherlands. Transportation Research Part D: Transport and Environment, 73, 276–306. https://doi.org/10.1016/j.trd.2019.07.001
- Namazu, M., & Dowlatabadi, H. (2018). Vehicle ownership reduction: A comparison of one-way and two-way carsharing systems. Transport Policy, 64, 38–50. https://doi.org/10.1016/j.tranpol.2017.11.001
- Namazu, M., MacKenzie, D., Zerriffi, H., & Dowlatabadi, H. (2018). Is carsharing for everyone?: Understanding the diffusion of carsharing services. Transport Policy, 63, 189–199. https://doi.org/10.1016/j.tranpol.2017.12.012
- Nehrke, G., & Loose, W. (2018). Nutzer und Mobilitätsverhalten in verschiedenen CarSharing-Varianten. Bundesverband Carsharing.
- Nobis, C. (2006). Carsharing as key contribution to multimodal and sustainable mobility behavior: Carsharing in Germany. Transportation Research Record: Journal of the Transportation Research Board, 1986(1), 89–97. https://doi.org/10.1177/0361198106198600112
- Nobis, C., Köhler, K. (2018). Mobilität in Deutschland − MiD: Nutzerhandbuch. Studie von infas, DLR, IVT und infas 360 im Auftrag des Bundesministers für Verkehr und digitale Infrastruktur (FE-Nr. DOI:70.904/15). Bonn, Berlin. www.mobilitaet-in-deutschland.de.
- Prieto, M., Baltas, G., & Stan, V. (2017). Car sharing adoption intention in urban areas: What are the key sociodemographic drivers? Transportation Research Part A: Policy and Practice, 101, 218–227. https://doi.org/10.1016/j.tra.2017.05.012
- Rabbitt, N., & Ghosh, B. (2016). Economic and environmental impacts of organised Car Sharing Services: A case study of Ireland. Research in Transportation Economics, 57, 3–12. https://doi.org/10.1016/j.retrec.2016.10.001
- Riegler, S., Juschten, M., Hössinger, R., Gerike, R., Rößger, L., Schlag, B., Manz, W., Rentschler, C., & Kopp, J. (2016). Carsharing 2025 – Nische oder Mainstream? Ifmo - Institut für Mobilitätsforschung.
- Rotaris, L., Danielis, R., & Maltese, I. (2019). Carsharing use by college students: The case of Milan and Rome. Transportation Research Part A: Policy and Practice, 120, 239–251. https://doi.org/10.1016/j.tra.2018.12.017
- Rydén, C., & Morin, E. (2005). Mobility Services for Urban Sustainability: Environmental Assessment. Report WP 6. Trivector Traffic AB. 213.170.188.3/moses/Downloads/reports/del_6.pdf.
- Seabold, S., & Perktold, J. (2010). Statsmodels: Econometric and statistical modeling with Python [Paper presentation]. Proceedings of the 9th Python in Science Conference, Austin, Texas. https://doi.org/10.25080/Majora-92bf1922-011
- Shaheen, S., Cohen, A., Chan, N., & Bansal, A. (2020). Sharing strategies: Carsharing, shared micromobility (bikesharing and scooter sharing), transportation network companies, microtransit, and other innovative mobility modes. In E. Deakin (Ed.), Transportation, land use, and environmental planning (pp. 237–262). Elsevier.
- Shaheen, S., Cohen, A., & Farrar, E. (2019). Chapter five - Carsharing's impact and future. Advances in Transport Policy and Planning, 4, 87–120.
- UN. (2013). World Economic and Social Survey 2013 - Sustainable development challenges.
- UN. (2019). World Urbanization Prospects: The 2018 Revision (ST/ESA/SER.A/420).
- van Wee, B. (2015). Peak car: The first signs of a shift towards ICT-based activities replacing travel? A discussion paper. Transport Policy, 42, 1–3. https://doi.org/10.1016/j.tranpol.2015.04.002
- Zhou, F., Zheng, Z., Whitehead, J., Perrons, R. K., Washington, S., & Page, L. (2020). Examining the impact of car-sharing on private vehicle ownership. Transportation Research Part A: Policy and Practice, 138, 322–341. https://doi.org/10.1016/j.tra.2020.06.003
- Zoepf, S. M., & Keith, D. R. (2016). User decision-making and technology choices in the U.S. carsharing market. Transport Policy, 51, 150–157. https://doi.org/10.1016/j.tranpol.2016.01.010