
 ?Mathematical formulae have been encoded as MathML and are displayed in this HTML version using MathJax in order to improve their display. Uncheck the box to turn MathJax off. This feature requires Javascript. Click on a formula to zoom.
Abstract
This article assesses private car CO2 emissions and car tax revenue in Ireland over the 10-year period following the introduction of an emissions-based car taxation policy in 2008. We build on a model of the Irish car stock, which has new car sales, car fleet mileage, and CO2 emissions intensity data to develop a bottom-up picture of historic CO2 emissions from the car fleet. In this article, we develop a counterfactual scenario following car purchasing trends in EU countries that did not introduce an emissions-based purchase and annual car taxes over the same period. Relative to this counterfactual scenario, the CO2 emissions intensity of the new car sales would have been 9% higher in 2018. This results in an estimated cumulative saving of 1.2 Mt CO2 from 2008 to 2018 brought about by the tax change. Total annual emissions from private cars were 4.4% higher in the counterfactual scenario. The tax change also led to a fall in annual motor tax revenues. Recorded receipts from annual motor tax were €0.77 billion in 2018. Our study shows that this would have been €1.1 billion in 2018 under the pre-2008 tax regime. The estimated cost of abatement in this case ranges from €1,500–€2,220 per tonne of CO2 avoided over the period 2009 − 2018. The study uses the novel technique of applying a technology stock model to better understand the longer-term consequences of a government policy.
1. Introduction
1.1. Policy context
In the European Union (EU), cars are responsible for around 12% of total CO2 emissions (European Commission, Citation2020); for Ireland it is 15% (EPA, Citation2019). In the EU, transport emissions targets are set under the EU Effort Sharing Regulation (ESR) 2018/842 covering non-emissions-traded sectors (non-ETS) (European Parliament, Citation2018a). In Ireland, despite a commitment to a 20% reduction in non-ETS emissions by 2020 relative to 2005 levels, a reduction of 8% has been achieved (Environmental Protection Agency, 2021). According to projections, without the impact of COVID-19, transport emissions would have been only 2.7% lower (EPA, Citation2020). This makes meeting Ireland’s 2030 target of a 30% reduction in non-ETS (non-Emissions Trading Scheme) targets even more challenging. Therefore, policymakers are now focusing on other policy measures to decarbonize private car transport and achieve the ambitious decarbonization targets set out under the EU Effort Sharing Decision which defines percentage reduction targets for countries to achieve by 2030 (European Parliament, 2018b). Policies emerging include target setting for the sale of electrification of cars, electric car grants, and increased funding for and expansion of public transport, low traffic, and pedestrian-only zones in urban centers (Aldred & Goodman, Citation2020; Grischkat et al., Citation2014; Mukherjee & Ryan, Citation2020; Tattini et al., Citation2018). To that end, the Irish government’s Climate Action Plan outlined ambitious future policy targets and instruments to reduce CO2 emissions from the transport sector by focusing on car electrification, rail electrification, and bus system updates (Government of Ireland, Citation2021). To what extent can future policy reduce emissions? Some insight into this question can be gained by looking at the impact of previous policy. Transport greenhouse gas emissions are influenced by both economic activity and government policy; here, we seek to quantify the impact of the latter.
One policy instrument to reduce CO2 emissions from private cars, which is at the heart of this study, is changing the car taxation regime to favor low-emitting cars. Such a measure was introduced in Ireland in 2008 so that motor tax rates would reflect CO2 emissions intensity (CO2 emissions per kilometer driven) rather than engine size (Financial Statement of the Minister for Finance, Citation2006). Vehicle registration tax was changed from a tax based on the car sales price to one based on the emissions class of the car. Annual motor tax was changed from a rating based on engine size to one based on CO2 emissions intensity (T. D. Department of Finance., Citation2019). This study looks at the implications of this taxation change on private car CO2 emissions and tax revenues.
Ex post policy analysis is challenging, especially because of the interaction of multiple factors impacting car purchase and usage decisions. However, without an understanding of the impact of past policy interventions, future policy planning and implementation may be designed suboptimally. The key innovations in this article include developing a car stock scenario by simulating counterfactual Irish new car sales that follow purchasing trends in countries (Estonia and Lithuania) that did not introduce purchase or annual taxes based on the CO2 emissions intensity of the new cars over the period of 2009 − 2018. An OECD performance review on environmental policies for both Estonia and Lithuania found that other policies introduced in the passenger transport sector were marginal over the period of 2009 − 2017 (OECD, Citation2017, Citation2021). This counterfactual scenario is compared with real-life sales of new cars in Ireland over the same period, which is the reference for the ex post scenario simulation. By using a counterfactual based on trends in CO2 emissions intensity of new cars from European countries that did not introduce emissions-based purchase and annual taxes, we capture European-wide improvements in manufacturer specifications in car engine efficiencies that occurred due to the transition from Euro V to Euro VI vehicles standards in 2013 (European Commission, Citation2022) while isolating the effect of the emissions-based annual and purchase taxes for new cars. We also developed a tool to calculate the revenue from annual motor taxes based on new car sales and the overall car stock.
1.2. Past policy analysis
An ex ante 2008 study of projected impacts of a carbon-emission differentiated car tax system on CO2 emissions intensity from new car purchases in Ireland showed that the car tax change would result in a reduction of 3.6%−3.8% in CO2 emissions intensity and a reduction of annual tax revenue of €191 million (Giblin & McNabola, Citation2009). The study specified a potential for future work in the revisiting of the modeling exercise following several years of the operation of the July 2008 tax system to assess the accuracy of model predictions; this article aims to address this recommendation. Other ex ante studies of the car tax change included a total life-cycle cost model, which is used to estimate the mileage break-even point at which the purchaser will opt for the more efficient car and choose a diesel car over petrol (Hennessy & Tol, Citation2011). This ex ante model assumes rational behavior in initial purchase choice and aggregates an average annual distance traveled across all car types, although the up-front costs are known to be more important for consumer choices than a rational behavior that considers the life cycle costs of a purchasing decision. Thus, the taxes added at the point of sale for a new car have additional importance. The ex ante analysis anticipated that the cost of CO2 emissions abatement per tonne under the new taxation regime would be “high, if not very high.”
Regarding ex post analysis, a study on the impact of the 2008 car tax changes included a one-year analysis of the 2008 change in Irish car tax, which found that in the first year of the policy, average specific emissions intensity of new cars fell by 13% to 145 gCO2/km (Rogan et al., Citation2011). This study used a disaggregated stock profile and monitored trends in car purchasing by emission bands, engine sizes and fuel types in the year following the introduction of the taxation change to quantify the weighted CO2 emissions of new cars and expected car tax payments. Dennehy & Ó Gallachóir adopted the car stock-model simulation approach for an ex post decomposition analysis over the period of 2005 − 2015, to examine the impact of seven underlying factors in driving energy demand. This analysis saw the increasing new diesel car purchases and overall diesel share in the Irish car fleet. It also highlighted the historical difference between average laboratory test values and on-road performance for the Irish car stock (Dennehy & Ó Gallachóir, Citation2018).
Looking further afield for ex post studies on the impact of emissions-based car tax systems, a six-year ex post analysis of the Dutch car taxation change found that the tax incentives were effective in encouraging changes toward lower-emitting cars. This contributed to a 6% reduction in private car emissions. The study noted the growing gap between rated performance and on-road performance, and how the scheme was not revenue neutral (Kok, Citation2015).
Across the EU, Dineen et al., studied the implications of CO2 emissions taxation across all member states (Dineen et al., Citation2018). The qualitative study analyzed factors, in particular national car taxes. The study noted the influence of confounding factors such as varying levels of economic growth in the EU. By observing the trends in new passenger car CO2 emissions intensity, the analysis found that most member states that shifted to emissions-based car taxes were found to have improved their new passenger car emissions intensity more than other EU member states that did not change to emissions-based car taxes (Dineen et al., Citation2018).
1.3. Outline
The article is structured as follows: In Section 2, we describe the methods used for this analysis, the Irish car stock model, the factual and counterfactual scenarios for exploring the impacts of the car tax change and the method. In Section 3, the results section, we highlight: (i) the emissions trends over the period of 2008 − 2018 for the factual and counterfactual cases, (ii) the new car CO2 emissions intensity impacts, (iii) the revenue impacts of the taxation change. Section 4, the discussion section, covers areas of uncertainty in the analysis and draws comparisons with other ex ante and ex post studies on the car tax change. The conclusion section discusses these results and draws insights for policy makers.
2. Methods
2.1. Irish car stock model
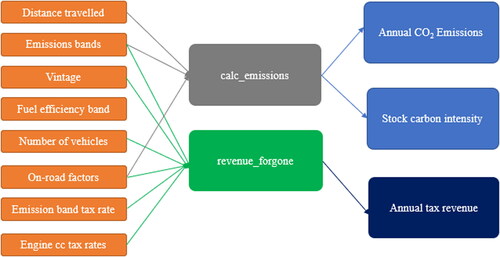
The model used in this article is a technology stock simulation model, which relies on revealed preferences of car choice. This was selected over a cost optimization model to estimate car choice, due to the unavailability and uncertainty associated with cost data on private cars across various dealerships that is needed for a techno-economic optimization model. This article uses a technological stock model of the Irish private car fleet, which was first developed by Daly and Ó Gallachóir (Kok, Citation2015). The car stock and activity profile are disaggregated by car technology, engine class, fuel type and age (or car vintage) to produce a detailed look at private car activity and energy consumption over the period 2000 to 2008. An overview of the private car transport model is provided in (below), which includes the relationship between the inputs (left), the calculation programs (center) and the output calculations (right). The model combines distance traveled, information on the fuel consumption performance of cars with the number of car sales and survival rates of older cars in the Irish car stock. The code base and data input files for the model are available on Open Science Framework (O’Riordan, Citation2020).
Figure 1. Overview of private car stock model.
2.2. Total car fleet CO2 emissions, 2001–2018
CO2 emissions are calculated as described in EquationEquation (1)(1)
(1) .
(1)
(1)
where;
car stock (number of cars),
CI –
ORF – the on-road factor which outlines the difference between the test values (or rated values) and actual, or on-road, fuel consumption based on the fuel type f and year y.
a – age of the car, which in turn defines the measured mileage and emissions intensity for cars of a given age and emissions band OR engine cc (engine cubic capacity, also known as the volumetric size of the engine) for pre-2008 purchased cars.
f – fuel type of the car, which in turn defines the measured mileage and emissions intensity for a car of a given age and emissions band OR engine cc for pre-2008 purchased cars
e – emissions band OR engine cc of the car for pre-2008 purchased cars, which returns the measured mileage and emissions intensity value for a car of a given age and fuel type.
Data is sourced from a range of publicly available sources (see Appendix A).
The activity-weighted CO2 emissions intensity takes the distance traveled by each car type into account. It is important to weigh by activity because this is the most representative of actual fleet emissions, representing the fact that different car types have different annual mileages. Based on information from the National Car Test center on annual distance traveled, new cars travel further than cars of older vintages and cars of a larger engine capacity also travel further.
The on-road factor (ORF) is derived from a study on the on-road performance of passenger cars. Earlier literature (Daly & Ó Gallachóir, Citation2011a; Dennehy & Ó Gallachóir, Citation2018) estimated the on-road factor by comparing manufacturer specified specific fuel consumption with household consumption of petrol and diesel from the Household Budget Survey conducted by the Central Statistics Office. The on-road factors derived from the Household Budget Survey highlighted their increasing trend as also noted in a study on passenger cars conducted in Germany (Tietge et al., Citation2017). The German study was corroborated with a method for calculating the car stock on-road factor by using a top-down estimate from Irish household budget spends on fuel, as described in Hennessy and Tol (Citation2011) and Kok (Citation2015). The study calculated an increasing on road factor from a mean divergence of 13% in 2008 to 33% in 2014 for gasoline cars, 16% in 2008 to 39% in 2014 for diesel cars (Tietge et al., Citation2017), and the Household Budget Survey determined an increase in on-road factor from 14% in 2008 to 30% in 2015 for gasoline cars, and 22% in 2008 to 43% in 2015 for diesel cars (Dennehy & Ó Gallachóir, Citation2018). As the laboratory study recorded the on-road factor for a car of a given build year, the on-road factors from the German passenger car study were applied to the Irish Car Stock model.
2.3. Counterfactual scenario: Average CO2 emissions intensity of new cars, 2008–2018
Counterfactual scenarios for ex post analysis can be based on cost-price models. Previous ex post transport infrastructure studies used cost-benefit models coupled with qualitative methods to assess the success of the projects (De Jong et al., Citation2019; Welde, Citation2018). Cost-benefit models can also be used to compare future choices in new cars based on updated taxes, which could be adjusted to consider how purchases have occurred over the period of 2008 − 2018 (De Jong et al., Citation2019). Decomposition analysis can also be used to assess the separate elements involved in policy-based interventions. Ex post analyses of transport infrastructure projects use a mix of cost-benefit analysis and qualitative analysis reflecting on other projects. Multisector log-mean-divisia index (LMDI) decomposition analyses have also been used to evaluate the effectiveness of past energy efficiency policies and transport policies over extended periods (Dennehy & Ó Gallachóir, Citation2018; Trotta, Citation2020), and single years (Rogan et al., Citation2011). As there was an availability of information on the CO2 emissions intensity of new car sales across all the EU countries over the period of 2000 − 2018, and new sales and stock data available from Irish cars over the period of 2008 − 2018, a counterfactual based on alternative car sales following trends in CO2 emissions intensity reductions of countries that did not introduce emissions-based car taxes was used.
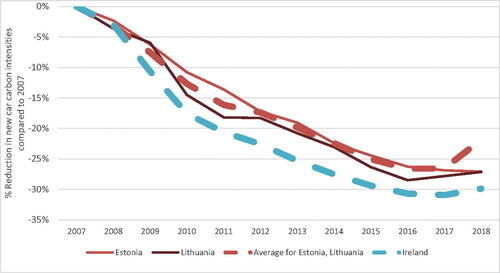
The counterfactual reflects a modeled scenario of post-2008 average CO2 emissions intensity of new cars in the absence of an emissions-based taxation change for Ireland. To do this, it is assumed that the trend in the emissions intensity of new car sales would have followed that of the two EU countries that did not introduce such tax changes. Based on a study conducted by the European Environmental Agency (European Environment Centre, Citation2016), Estonia and Lithuania did not introduce CO2 and proxy-based incentives at the point of sale for new cars over the period of 2008 − 2018. Every other country in the EU did. The relative annual reductions in the CO2 emissions intensity of new cars from an aggregate of Estonia and Lithuania form the basis of the counterfactual scenario for the Irish car stock. Net reductions in car carbon intensity are easier to achieve if starting from a higher emissions intensity, and thus calculating the relative reduction in emissions intensity in percent terms to 2007 values counterbalances this. The CO2 emissions intensities of new cars purchased over the period of 2000 − 2019 are included in Appendix G, and the reduction in carbon intensities of new cars purchased by country over the period of 2008 − 2018 indexed to the 2007 average emissions intensity of new cars sold in that year are highlighted in the results section in . The average reduction in CO2 emissions intensity of new cars for each year over 2008 − 2018 amongst the two countries (Estonia and Lithuania) was applied to the Irish car stock, using Irish car sale numbers for each year.
The stock-based approach involves bottom-up calculations of the counterfactual CO2 emissions from private transport, based on car sales following a counterfactual average CO2 emissions intensity and being added to the stock each passing year. Total private car emissions from the Irish car stock for each year was calculated as shown previously in EquationEquation (1)(1)
(1) .
2.4. Annual motor tax revenue
Revenue from annual motor tax is recorded by the Government Climate Action and Tax Strategy Group (T. D. Department of Finance, Citation2019). These values are compared with the revenue calculated from the Irish Car Stock Model. The stock model calculates the revenue as follows:
Tax revenue from cars registered before 2008 (EquationEquation (2)(2)
(2) ):
(2)
(2)
where engine cc refers to the volumetric size of the engine, also known as the cubic capacity. For cars registered after 2008, the revenue generated from annual motor tax is calculated as a function of the manufacturer specified emissions band as follows (Equation (3)):
The revenue from Annual Motor Tax for the following scenarios were recorded:
Recorded Receipts: the documented revenues from the Parliamentary Budget Office (House of the Oireachtas, Citation2019).
Modeled Revenue: the expected revenue over the period of 2001–2018, which applied the tax bands and the stock of cars as recorded in the Irish Car Stock Model. The calculations factor in the change in taxation for cars registered after 2008.
Counterfactual revenue: the revenue calculated based on the counterfactual car stock scenario as described in the methods section (Subsection 2.3). All cars in the stock have a motor tax based on the pre-2008 engine cc-based rates as documented in Appendix D.
3. Results
3.1. Average CO2 emissions intensity of new cars
Average CO2 emissions intensity of new cars in Ireland over the period of 2009 − 2018 form the basis of the reference scenario which we compare to the “counterfactual scenario.” The counterfactual scenario assumes that the average CO2 emissions intensity of new cars follows the same trends as countries that did not introduce an emission-based purchase and annual car tax. Values for CO2 emissions intensity of new cars in the Irish car fleet for the actual (Eurostat, Citation2022), and the counterfactual scenario are listed in .
Table 1. CO2 emissions intensity of new cars in the Irish car fleet for the actual and counterfactual scenario.
For 2018, the average CO2 emissions intensity of a new car was 158 g of CO2 emissions per kilometer (gCO2/km) compared to counterfactual scenario, calculated to be 175 gCO2/km.
A comparison of CO2 emissions intensity of new Irish cars versus the countries did not introduce emissions-based car taxes is shown in .
Figure 2. Percentage reduction in CO2 emissions intensity of new cars by country from 2008 to 2018 compared to their respective 2007 values.
3.2. Overall car fleet emissions
Compared to actual emissions in 2018, the emissions in the counterfactual scenario for 2018 are 2.8% higher than the reference. This results in a net annual saving of 0.25 MtCO2 in 2018 compared to the counterfactual, and a cumulative saving of 1.2 MtCO2 over the 2008 − 2018 period. The results for overall car fleet emissions from the counterfactual scenario compared with the actual private car CO2 emissions are shown in (below).
Table 2. Summary of emissions model results.
3.3. Tax revenue from the annual motor tax
Tax revenue collected from annual motor taxes was calculated for both the reference and counterfactual scenarios to evaluate the cost implications of the policy on the exchequer. To validate the bottom-up stock method used to determine modeled revenue in-take from the counterfactual, revenue for the modeled reference scenario was compared with recorded receipts from the Department of Transport from annual motor tax. For 2018, the modeled actual revenue is 9% lower than the recorded revenue from the Department of Transport. The modeled actual revenue, modeled counterfactual revenue and recorded receipts are shown in (below) Differences between the recorded receipts could be determined by overdue payments of the fee which would not have yet been recorded for the latter years, i.e., 2017, 2018, and from modeling discrepancies as the emission band is approximated across the car fleet from aggregated efficiency band calculations.
Figure 3. Tax revenue generated from the Annual Motor Tax.
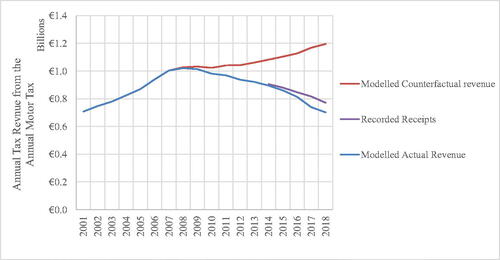
By 2018, reference tax revenue was calculated as €0.7 billion, revenue which is €0.4 billion lower than the counterfactual scenario, which had a revenue intake of €1.1 billion.
Progression of the revenue generated from the Annual Motor Tax based is illustrated in (below).
4. Discussion
4.1. Discussion and policy implications
Following a comparison of the reference scenario with the counterfactual scenario, actual private car CO2 emissions calculated in this study were 2.8% lower than that would have been relative to the counterfactual scenario in 2018. This suggests that the change in taxation had a marginal impact on overall private car CO2 emissions by 2018. What is also interesting to note is that the difference in new car carbon intensity between actual and counterfactual develops in the first few years, and then stabilizes at a level of about 10 gCO/km, with a slight decrease in the last year.
However, despite this, as indicated in absolute car fleet emissions grew by 1.7% over the period 2008 − 2018, because of robust growth in activity which offset gains from efficiency. In the counterfactual scenarios, private car emissions for 2018 would be 3.9% higher than for 2008. This analysis indicates that the change in annual motor tax reduced the rise in CO2 emissions from private cars to an extent, but the effect was not strong enough to reduce overall private car CO2 emissions.
Regarding the overall CO2 emissions intensity of the private car fleet, Rogan et al. also concluded that the average specific emissions of new cars fell by 13% in 2009 because of the policy change, resulting in a 5.9 kt reduction in CO2 emissions that year (Rogan et al., Citation2011).
The tax change had the effect of incentivizing the purchase of diesel cars that had lower CO2 emissions and lower taxes under the new taxation scheme. However, because the tax change had been designed in part to counteract a trend toward larger cars, there had been an expectation that its successful implementation would lead to the purchase of smaller cars. Analysis done during the first year of the tax change noted a shift toward diesel cars, but was not prepared to predict if this shift would become a trend (Ó Gallachóir et al., Citation2009). As it happened diesel cars were particularly susceptible to excessive NOx and SOx emissions under the New European Driving Cycle (Rogan et al., Citation2011). The ensuing “Diesel-gate” scandal highlighted the extremely high NOx emissions from new diesel cars that the CO2-emissions based tax change had incentivized (Leinert et al., Citation2013). The switch to diesel also led to interaction with the Biofuel Obligation Scheme (National Oil Reserves Agency, 2020; Ryan et al., Citation2018). The switch to diesel enabled Ireland to achieve a higher share of renewable energy in transport (due to double accounting for the increased biodiesel mixing rates in diesel cars compared to bioethanol mixing rates for petrol cars), than would have been the case without such a switch (Mulholland et al., Citation2014).
The 2008 car tax change culminated as a tax cut in disguise for car owners and resulted in the high cost of carbon abatement of €1,500 − 2,220 per tonne of CO2. This loss of revenue was anticipated in the ex ante car choice model study from 2009 by Giblin and McNabola (Citation2009). The study found that the introduction of new CO2-based taxes in Ireland would result in a reduction of 3.6%−3.8% in CO2 emissions intensity and an annual revenue loss of €191 million. The one-year ex post analysis of the 2008 car tax also noted that the scheme, which was intended to be revenue neutral, was not (Rogan et al., Citation2011). Hennesey and Tol’s (Hennessy & Tol, Citation2011) ex ante cost-based car-choice model for the car tax regime showed that the cost of CO2 emissions abatement would be “high, if not very high.” Our results indicate a reduction of 4.4% by 2018, with the net reductions accumulating with each year as the emissions reductions permeate throughout the car stock.
Since 2021, the Irish government has introduced an update to the annual motor tax (Department of Transport, Citation2020). The new taxation scheme includes a greater number of subcategories for emissions classes, with additional subdivisions for the emission band category, which allows for a greater specification of super low emission cars (those with a less than 50 gCO2/km emissions intensity). However, the emission band taxation rates for the higher emissions categories have remained unchanged. In addition, the new taxation rates will only apply to cars registered in Ireland after 2021.
This study highlights the importance of monitoring ongoing developments in revenue following car taxation changes, as the policy resulted in a reduction of car tax revenue when compared to the pre-2008 rates based on engine displacement. Ongoing adjustment of the policy design is necessary to maintain revenue neutrality.
The study also highlights the importance of ongoing analysis of the effectiveness of policy design for CO2 emissions reductions. Overall, emissions from private cars were higher in 2018 than in 2008, which suggests that improvements in car efficiency resulting from the taxation policy were not sufficient to offset the increase in emissions from private car because of growing activity. As noted in Dennehy and Ó Gallachóir, increased energy consumption and emissions from growing demand for private car transport outweighed any energy and emissions reductions from efficiency improvements in private cars (Dennehy & Ó Gallachóir, Citation2018). The finding illustrates the importance of car transport demand management in parallel with financial incentives to encourage a switch to low emission and high efficiency cars. The issue of managing car activity increases also emerges in the guideline for making transport-based emissions reduction policy from the Department of Transport, Environmental Protection Agency, and the IPCC (Intergovernmental Panel on Climate Change) (Department of Transport, Citation2019b; Environmental Protection Agency, Citation2020; IPCC, 2014). They recommend following the Avoid-Shift-Improve framework, which focuses initially on avoiding transport demand with demand management strategies, then pursuing a course to encourage modal shift to public transport or active modes of travel and as a last resort, improving the fuel efficiency or fuel type of the car through technology adoption and financial incentives. The car tax strategy focuses on the “Improve” aspect of the framework, and regarding the new car tax as a financial mechanism to reduce CO2 emissions, our study found that the cost of the policy per tonne of CO2 abated was very high relative to other emissions abatement measures, and that while finance measures can be helpful, they are not sufficient to address the structural factors of passenger transport emissions in Ireland, such as transport demand, car lock-in and mode choice.
The tax policy also highlights the pitfalls of setting an environmental policy based on laboratory-based manufacturer specified measurements that cannot be continually monitored on the road. The manufacturer specified emissions used to set the Irish car tax rate were subject to “gaming” in what is now known as the “Diesel-gate” scandal. While emissions of nitrous dioxides (NOx) and sulfur dioxides (SOx), rather than CO2, were in the spotlight throughout the scandal, the growth of the CO2 on-road factor in Ireland over the period of 2008 − 2018 as highlighted in Table B1 contributed to CO2 emissions being higher than they otherwise would have been. This also impacted the tax revenue collected by the Irish government as cars were increasingly in lower taxation classes than they would be if they were rated according to real-world driving. As internal combustion engines are emitting more than the tax policy specifies, the relative tax benefit of switching to a no-emission car, such as an electric car, is subsequently reduced. Increasing the relative difference between the emissions bands, combined with the new World Harmonized Light Vehicle Test Procedure (WLTP), would result in a stronger price signal for switching to super low emission cars such as EVs (Electric Vehicles) could be helpful toward Ireland’s 2030 EV uptake and sustainable transport targets. Retrospectively updating taxation rates on higher emission cars are also an option to be considered, as current updates to the taxation policy only focus on cars registered after the date of implementation. An iterative approach to taxation policy allows for continual monitoring of tax revenue from the new taxation schemes and prevents the revenue losses suffered because of the 2008 car tax rate changes.
4.2. Uncertainty
Several sources of uncertainty arise in calculating the emissions impact of a change in car taxation. These sources of uncertainty can be categorized as first, uncertainty in the calculation of emissions although technical and behavioral characteristics of fuel consumption, and second, uncertainty in distinguishing the impact of the policy change on car sales from other trends impacting car sales.
First, there is a significant source of uncertainty in determining the real-world driving emissions relative to those calculated in standardized tests, referred to as the on-road factor. In Rogan et al. (Citation2011) the on-road factor was highlighted as a potential source for uncertainty. It is well established that the carbon intensity of cars in real-world driving conditions is higher than measured in test conditions, due to factors such as driving technique, road surfaces and engine conditions. For this study, the on-road factor is derived from comparing data from the Irish household budget survey with modeled fuel consumption according to test values, and corroborated with a study of on-road factors of new German passenger cars (Tietge et al., Citation2017). This data is available up to 2015 is available, however data from 2016 to 2018 is not readily available and 2015 rates are applied in this study up to 2018.
A second source of uncertainty arises from the specification of counterfactual scenario, in distinguishing the impact of the car tax change relative to other background changes. The counterfactual scenario is based on assuming that new car CO2 emissions intensity of new cars purchased in Ireland would follow the same average reduction as European countries that did not introduce such emissions-based car purchasing incentives over the period of 2008 − 2018. Not included in the counterfactual are the effects of the taxation change on the adoption of electric cars. In 2018, electric cars accounted for 1% of sales, with 99% of sales applying to petrol/diesel and hybrid varieties (Central Statistics Office, Citation2020). Overall carbon intensity of new car sales in Ireland and across the EU from Eurostat include hybrid and electric car varieties.
Another unanticipated occurrence when the car tax scheme was introduced was the increase in secondhand car imports over the period of 2009 − 2018. In 2019, these now account for nearly 50% of new car registrations (CSO, Citation2020a). While accounted for in the car stock model through calculating the average car age of the car stock, the impact of secondhand imports is a research question worthy of deeper analysis. Furthermore, car scrappage schemes were introduced in Ireland during 2001 − 2002 and 2007 − 2008, the latter which may have impacted sales from 2009 coinciding with the car tax, however, this was not within the scope of this study. van wee et al found that private car emissions reductions were modest and short-term, with the cost-effectiveness of these schemes being quite poor. The cost-effectiveness of scrappage schemes is often quite poor (van Wee et al., Citation2011). Similarly, Kagawa et al.’s study on the Japanese scrappage scheme showed that CO2 emissions would only decrease if users of the scheme retained their new gasoline passenger cars for at least 4.7 years. It also found that the scheme was costly considering the emissions reduction achieved from the intervention (Kagawa et al., Citation2013).
Another source of uncertainty arises from the knock-on effects of the increased tax payments in the counterfactual “no-tax change” scenario. For example, as annual motor tax revenue was reduced, this meant that car owners who purchased their car after 2008 were spending less on car tax each year than would have been the case under the pre-2008 engine-size based taxation regime. This would reduce the cost of car ownership compared to a higher-tax counterfactual and in turn, would incentivize car ownership by making it lower in cost. It is common knowledge in the field of consumer behavior that upfront costs are considered to be more important than an assessment of the cost of car ownership and operating costs during the car’s lifespan, and hence, the taxes being added for car registration has an added significance.
The uncertainty issue is one aspect of the discussion on whether energy systems models are fit for purpose (CSO, Citation2020b). Gilboae et al. (Department of Transport, Citation2019a) argue that economic models are most usefully seen as describing specific, theoretical systems rather than general rules, and as such, are simply one source of knowledge alongside other data such as experimental or empirical results. A simulation technology stock-based model should be viewed as a source of possible storylines rather than of fundamental truth. The situations modeled by ex post analysis cannot be fully observed and measured, and do not exhibit a reliability of structure in time and across variations in conditions not specified in the model: therefore, they cannot be properly validated (European Environment Centre, Citation2016). However, by comparing the results with car choice models such as Hennessy and Tol (Citation2011), Giblin and McNabola (Citation2009), and Rogan et al. (Citation2011), we can gather valuable insights.
In addition, the model does not consider the rebound effect of such reductions in CO2 emissions intensity, whereby perceived improvements in technology, efficiency, and emissions are coupled with an increase in kilometers traveled. This may act to negate the positive effects of this tax policy change and further measures should be put in place to protect the predicted CO2 savings. Dynamic effects of the tax change, which lead to reduced tax revenue for the government and lower taxes for the consumer and how that could have impacted consumer behavior was not investigated. Car manufacturers also optimize cars for the driving tests that are connected to the Euro Standards, this is different from optimizing the cars for real world driving performance, and results in cars being rated with lower emissions of NOx, SOx, and CO2 emissions than what would be the case in day-to-day use. These intentional and misleading design decisions encompassed is now known as the “Diesel-gate” scandal. In the Irish Car Stock Model, an on-road factor is applied to fuel consumption figures to adjust for the discrepancy between on-road and manufacturer specified fuel consumption values, these figures are listed in Appendix B.
As mentioned in Section 3, Results, we compared the modeled tax revenue from the Irish car stock model with the recorded receipts from the motor taxes (House of the Oireachtas, Citation2019). The recorded receipts from the motor taxes were up to 9.5% higher. This discrepancy can be explained by factors such as delayed payment of taxes from previous years and discrepancies between the actual on-road car fleet and the car stock model. A table of the percentage difference between recorded receipts and the calculated revenue from the Irish Car Stock Model is shown below ().
Table 3. Difference in recorded and modeled tax revenue from motor tax.
5. Conclusions and policy implications
5.1. Conclusions of the ex post study
Several important findings arise from this study.
The 2008 car tax change influenced purchasing patterns. This change in purchasing patterns caused a slight shift in new car purchasing trends toward more efficient cars. In 2018, actual private car CO2 emissions were 2.7% lower than as calculated in the counterfactual “no-tax change” scenario. Cumulative CO2 savings over the 10-year period following the introduction of the tax change amounted to 1.2 MtCO2, when compared to the counterfactual.
However, despite the increase in new-car efficiency arising from this policy, this did not cause a net annual decrease in private car transport emissions over the 10-year period itself. There was a strong fall in emissions after 2008, but this was caused by a reduction in car activity following the economic crash of 2008 and private car emissions rebounded alongside the economy (Sustainable Energy Authority of Ireland, Citation2018). Net CO2 emissions from private cars in 2018 were 4.4% higher than in 2008. This suggests that technical and policy efforts to improve internal combustion engine efficiency improvements do not sufficiently reduce emissions and will need to be complemented by changes to mobility and fuel type. The relatively small reduction in carbon dioxide emissions could also be due to the policy being too soft and small in scope, and that the relative differences in taxes between cars that have emissions and those that are zero-emission is not enough. Irish policy is reflecting this: a ban on new fossil fuel cars by 2030 is currently under discussion (Department of Communications Climate Action and Environment, Citation2019) and the new policy focuses on car electrification and mode shifting to public transport, walking, and cycling rather than efficiency improvements (Government of Ireland, Citation2021).
As for whether the policy was revenue neutral, it is estimated that annual motor tax receipts would have been €207 million higher in 2018 without the policy. This happened because the design of the taxation bands did not anticipate consumer purchasing trends toward cars in lower emissions classes. It also resulted in a tax-cut in disguise, as tax rates based on emissions bands were lower overall than those previously based on engine displacement. Lastly, the car tax change resulted in the high cost of carbon abatement of €1,500 − 2,220 per tonne of CO2.
Disclosure statement
No potential competing interest was reported by the authors.
Additional information
Funding
References
- Aldred, R., & Goodman, A. (2020). Low Traffic Neighbourhoods, Car Use, and Active Travel: Evidence from the People and Places Survey of Outer London Active Travel Interventions. Findings, 1–8. https://doi.org/10.32866/001c.17128
- Central Statistics Office. (2017). Travel patterns and car ownership. https://www.cso.ie/en/media/csoie/newsevents/documents/census2016summaryresultspart2/Chapter_8_Travel_patterns_and_car_ownership.pdf
- Central Statistics Office. (2020). CSO – Vehicle Licensing Statistics Annual Series/TEA17/TEA03 Irish private vehicle transport model.
- CSO. (2019). Transport Omnibus 2018, road traffic volumes. https://www.cso.ie/en/releasesandpublications/ep/p-tranom/transportomnibus2018/roadtrafficvolumes/
- CSO. (2020a). Used imported cars by county of last registration and year. https://statbank.cso.ie/px/pxeirestat/Statire/SelectVarVal/Define.asp?maintable=RTA03&PLanguage=0
- CSO. (2020b). Vehicles liscenced for the first time. https://www.cso.ie/en/statistics/transport/vehicleslicensedforthefirsttime
- Daly, H. E., & Ó Gallachóir, B. P. (2011a). Modelling future private car energy demand in Ireland. Energy Policy, 39(12), 7815–7824. https://doi.org/10.1016/j.enpol.2011.09.027
- Daly, H., & Ó Gallachóir, B. P. (2011b). Modelling private car energy demand using a technological car stock model. Transportation Research Part D: Transport and Environment, 16(2), 93–101. https://doi.org/10.1016/j.trd.2010.08.009
- De Jong, G., Vignetti, S., & Pancotti, C. (2019). Ex-post evaluation of major infrastructure projects. Transportation Research Procedia 42, 75–84. https://doi.org/10.1016/j.trpro.2019.12.008
- Dennehy, E. R., & Ó Gallachóir, B. P. (2018). Ex-post decomposition analysis of passenger car energy demand and associated CO2 emissions. Transportation Research Part D: Transport and Environment, 59(February), 400–416. https://doi.org/10.1016/j.trd.2018.01.012
- Department of Communications Climate Action and Environment. (2019). Climate action plan to tackle climate breakdown. Department of Communications Climate Action and Environment, https://assets.gov.ie/10206/d042e174c1654c6ca14f39242fb07d22.pdf
- Department of Transport. (2019a). Motor tax rates. https://www.gov.ie/en/publication/41c9cc-motor-tax-rates/
- Department of Transport. (2019b). Oireachtas Joint Committee on Climate Action Wednesday 27 November 2019 Statement by the Department of TransportTourism and Sport, https://data.oireachtas.ie/ie/oireachtas/committee/dail/32/joint_committee_on_climate_action/submissions/2019/2019-11-28_opening-statement-deirdre-hanlon-assistant-secretary-public-transport-sustainability-and-climate-change-department-of-transport-tourism-and-sport_en.pdf
- Department of Transport. (2020). Rates of duty on motor vehicles 2021.
- Dineen, D., Ryan, L., & Ó Gallachóir, B. (2018). Vehicle tax policies and new passenger car CO2 performance in EU member states. Climate Policy, 18(4), 396–412. https://doi.org/10.1080/14693062.2017.1294044
- Environmental Protection Agency. (2020). Chapter 11: Environment and Transport, Ireland’s Environment - An Integrated Assessment 2020.
- Environmental Protection Agency. ( 2021). The impact on 2020 greenhouse gas emissions of COVID-19 restrictions. http://www.epa.ie/pubs/reports/air/airemissions/ghgcv-19/SEAI-EPA Bulletin v1.7.pdf
- EPA (2019). Ireland’s greenhouse gas emissions projections. http://www.epa.ie/pubs/reports/air/airemissions/ghgprojections2019-2040/2020-EPA-Greenhouse-Gas-Emissions-Projections_final.pdf
- EPA. (2020). Ireland’s greenhouse gas emissions projections 2019-2040. http://www.epa.ie/pubs/reports/air/airemissions/ghgprojections2019-2040/
- European Commission. (2020). Reducing CO2 emissions from passenger cars - before 2020. https://ec.europa.eu/clima/policies/transport/vehicles/cars_en
- European Commission (2022) Emissions in the automotive sector; https://ec.europa.eu/growth/sectors/automotive-industry/environmental-protection/emissions-automotive-sector_en
- European Environment Centre. (2016). Appropriate taxes and incentives do affect purchases of new cars (pp. 1–10).
- European Parliament. (2018a). Regulation (EU) 2018/842 of the European Parliament and of the Council of 30 May 2018. European Parliament.
- European Parliament (2018b, May 30). Regulation (EU) 2018/842 of the European Parliament and the Council of. The Official Journal of the European Union, 2018(406), 26–42.
- Eurostat. (2022). Average CO2 emissions per km from new passenger cars (source: EEA, DG CLIMA); https://ec.europa.eu/eurostat/databrowser/view/sdg_12_30/default/table?lang=en
- Financial Statement of the Minister for Finance. (2006). Financial Statement of the Minister for Finance. http://www.budget.gov.ie/Budgets/2007/FinancialStatement.aspx#_Toc153132261
- Giblin, S., & McNabola, A. (2009). Modelling the impacts of a carbon emission-differentiated vehicle tax system on CO2 emissions intensity from new vehicle purchases in Ireland. Energy Policy, 37(4), 1404–1411. https://doi.org/10.1016/j.enpol.2008.11.047
- Government of Ireland. (2021). Climate action plan 2021.
- Grischkat, S., Hunecke, M., Böhler, S., & Haustein, S. (2014). Potential for the reduction of greenhouse gas emissions through the use of mobility services. Transport Policy, 35, 295–303. https://doi.org/10.1016/j.tranpol.2014.06.007
- Hennessy, H., & Tol, R. S. J. (2011). The impact of tax reform on new car purchases in Ireland. Energy Policy, 39(11), 7059–7067. https://doi.org/10.1016/j.enpol.2011.08.011
- House of the Oireachtas. (2019). An analysis of the sustainability of vehicle registration and motor tax.
- IPCC. (2014 September). Climate Change 2014: Mitigation of climate change. In Summary for Policymakers and Technical Summary, No, 2014.
- Kagawa, S., Hubacek, K., Nansai, K., Kataoka, M., Managi, S., Suh, S., & Kudoh, Y. (2013). Better cars or older cars?: Assessing CO2 emission reduction potential of passenger vehicle replacement programs. Global Environmental Change, 23(6), 1807–1818. https://doi.org/10.1016/j.gloenvcha.2013.07.023
- Kok, R. (2015). Six years of CO2-based tax incentives for new passenger cars in The Netherlands: Impacts on purchasing behavior trends and CO2 effectiveness. Transportation Research Part A: Policy and Practice, 77, 137–153. https://doi.org/10.1016/j.tra.2015.04.009
- Leinert, S., Daly, H., Hyde, B., & Gallachóir, B. Ó. (2013). Co-benefits? Not always: Quantifying the negative effect of a CO2-reducing car taxation policy on NOx emissions. Energy Policy, 63, 1151–1159. https://doi.org/10.1016/j.enpol.2013.09.063
- Mukherjee, S. C., & Ryan, L. (2020). Factors influencing early battery electric vehicle adoption in Ireland. Renewable and Sustainable Energy Reviews, 118, 109504. https://doi.org/10.1016/j.rser.2019.109504
- Mulholland, E., Rogan, F., & Gallachóir, B. P. Ó. (2017). Techno-economic data for a multi-model approach to decarbonisation of the Irish private car sector. Data in Brief. https://doi.org/10.1016/j.dib.2017.10.006
- Mulholland, E., Rogan, F., Mac Uidhir, T., & Gallachóir, B. Ó. (2014). Opportunities to decarbonise the Irish transportation sector. https://www.epa.ie/pubs/reports/research/climate/Research_Report_321.pdf
- National Oil Reserves Agency. ( 2020). Biofuel obligation scheme. https://www.nora.ie/biofuels-obligation-scheme.141.html
- Ó Gallachóir, B. P., Howley, M., Cunningham, S., & Bazilian, M. (2009). How private car purchasing trends offset efficiency gains and the successful energy policy response. Energy Policy, 37(10), 3790–3802. https://doi.org/10.1016/j.enpol.2009.07.012
- O’Riordan, V. (2020). Irish car stock model. https://doi.org/10.17605/OSF.IO/6N7QJ
- OECD. (2017). OECD environmental performance reviews: Estonia.
- OECD. (2021). OECD environmental performance reviews: Lithuania 2021.
- Rogan, F., Dennehy, E., Daly, H., Howley, M., & Ó Gallachóir, B. P. (2011). Impacts of an emission based private car taxation policy - first year ex-post analysis. Transportation Research Part A: Policy and Practice, 45(7), 583–597. https://doi.org/10.1016/j.tra.2011.03.007
- Ryan, L., Kelly, A., Petrov, I., Guo, Y., & Monaca, S. L. (2018). An assessment of the social costs and benefits of vehicle tax reform in Ireland. OECD, 33, 1–53.
- Sustainable Energy Authority of Ireland. (2018). Energy related CO2 emissions in Ireland 2005 - 2018. https://www.seai.ie/publications/Energy-Emissions-Report-2020.pdf
- T. D. Department of Finance. (2019). Climate Action and Tax Tax Strategy Group TSG 19/04 July 2019.
- Tattini, J., Gargiulo, M., & Karlsson, K. (2018). Reaching carbon neutral transport sector in Denmark – Evidence from the incorporation of modal shift into the TIMES energy system modeling framework. Energy Policy, 113, 571–583. https://doi.org/10.1016/j.enpol.2017.11.013
- Tietge, U., Mock, P., Franco, V., & Zacharof, N. (2017). From laboratory to road: Modeling the divergence between official and real-world fuel consumption and CO2 emission values in the German passenger car market for the years 2001–2014. Energy Policy, 103, 212–222. https://doi.org/10.1016/j.enpol.2017.01.021
- Trotta, G. (2020). Assessing energy efficiency improvements and related energy security and climate benefits in Finland: An ex post multi-sectoral decomposition analysis. Energy Economics. 86, 104640. https://doi.org/10.1016/j.eneco.2019.104640
- van Wee, B., de Jong, G., & Nijland, H. (2011). Accelerating car scrappage: A review of research into the environmental impacts. Transport Reviews, 31(5), 549–569. https://doi.org/10.1080/01441647.2011.564331
- Welde, M. (2018). In search of success: Ex-post evaluation of a Norwegian motorway project. Case Studies in Transport Policy. 6(4), 475–482. https://doi.org/10.1016/j.cstp.2018.04.008
Appendix A
Table A1. Data sources.
Appendix B
Table B1. On-road factors derived from the Household Budget Surveys.
Appendix C
Table C1. Private Households in Permanent Housing Units 2016 (Number) by County and City, Motor Car Availability and Census Year, Census 2016 (Central Statistics Office, Citation2017).
Appendix D
Table D1. Taxation rates based on the engine CC.
Appendix E
Table E1. CO2-based taxation rates (Source: DTTAS, 2019).
Appendix F
Table F1. Revenue and cost of carbon abatement.
Appendix G
Table G1. CO2 emissions intensity of new cars by country (gCO2/km) (Eurostat, Citation2022).