
 ?Mathematical formulae have been encoded as MathML and are displayed in this HTML version using MathJax in order to improve their display. Uncheck the box to turn MathJax off. This feature requires Javascript. Click on a formula to zoom.
ABSTRACT
The main goal of this study was non-destructive evaluation of wooden elements using ultrasonic waves. The inspection was carried out on wooden beams from a historical object. Elastic wave signals were processed by ultrasonic transmission tomography to obtain imaging of the internal structure of tested elements without disturbing their state and integrity. The focus was on the influence of wood anisotropy on the propagation of ultrasonic waves. A novel method of determining the position of the cross-section pith was proposed. The study presented that the proposed imaging approach was capable to assess the technical condition of historic wooden beams by determining the degree of wood damage and the location of discontinuities, scratches or fibrosis in the tested cross-section.
1. Introduction
In historical objects, it is essential to preserve as many elements in the original character as possible. It is particularly difficult in the case of wood, which is one of the most susceptible construction materials. Over the years, the wooden structure elements undergo progressive destructive processes. Their development depends on various factors amongst which an important role is played by the historical events that took place while the structure existed. Mechanical wear and long-term mechanical stress together with its consequences are the elements resulting in the destruction of wooden elements of the cultural heritage. Wood is subject to degradation also under the influence of stresses from the humidity changes and insect effect. The fungi decay emerging when the humidity is above 20%, is an important issue in the case of wooden objects in civil engineering (Niemz and Mannes Citation2012).
Examining the condition of wooden elements is crucial from the perspective of the correct structure work. Detecting the internal wood condition deterioration without any symptoms visible from the outside allows preventing the further spread of the destruction. Research conclusions frequently result in the necessity to conduct repairs, renovations, replacement of the wooden beams structure, or even the substitution of a significant part of the structure. In addition to approaches such as a visual inspection, numerical analysis (Chenwei et al. Citation2021; Lubowiecka, Zybała, and Bukal Citation2019; Zybała et al. Citation2021), destructive tests (Rebouças et al. Citation2022) or tapping to determine the near-surface defects, non-destructive testing (NDT) techniques play an important role in the process of diagnostics. NDT has been effectively used in civil engineering to diagnose reinforced concrete, concrete, masonry and composite elements, e.g. (Drobiec, Jasiński, and Mazur Citation2019; Grębowski, Rucka, and Wilde Citation2019; Rucka, Wojtczak, and Zielińska Citation2020; Słoński, Schabowicz, and Krawczyk Citation2020; Zielińska and Rucka Citation2018). In previous studies, the non-destructive testing on wooden elements have been conducted with ground penetrating radar (GPR) (Mai et al. Citation2015; Martínez-Sala et al. Citation2013), thermal techniques (Bucur Citation2003; López et al. Citation2014), microwaves (Beni et al. Citation2016; Pastorino et al. Citation2015), acoustic emission (Beall Citation2002; Riccadonna et al. Citation2019), ultrasonic tomography (Arciniegas et al. Citation2014; Feio, Lourenço, and Machado Citation2007) and X-ray tomography (Kobayashi et al. Citation2019; Nilakantan Citation1937; Paris and Kamke Citation2015; Wei, Leblon, and la Rocque Citation2011). The use of several research techniques allowed performing comprehensive research on wood elements, collecting a lot of information about the material properties and the strength grade (Santini, Baggio, and Sguerri Citation2021).
The use of the ground penetrating radar may be problematic in the case of small size elements wooden components. Then the methods of acoustic research are more favourable. They allow the identification of inhomogeneous or damaged areas in tested elements. Sound methods are used, among others, in tomography to create maps showing the distribution of a specific parameter, for example, wave propagation velocity. Such use of ultrasonic methods facilitates the interpretation of information about the studied area. The evaluation of the ultrasonic tomography implementation in wooden elements was first described by (Tomikawa et al. Citation1986). The measurements taken on the wooden columns provided satisfactory effects; nevertheless, the image was of poor resolution. From that time onwards, the implementation of ultrasonic tomography for wooden elements is under constant development. (Comino et al. Citation2000), (Giuliana, Fink, and Schwarze Citation2008), (Brazee et al. Citation2011) used ultrasonic tomography to evaluate the condition of alive trees. (Yan, Chongke, and Honglin Citation2018) detected discontinuities of non-metallic elements by applying the proposed ultrasonic-based algorithm on a wooden element. The internal discontinuities of wood were also identified by (Alves et al. Citation2015). (Colla Citation2016) described the ultrasonic tomography results and juxtaposed them with destructive tests. (Niemz and Mannes Citation2012) compared the results obtained from ultrasonic tomography of the wood with other non-destructive methods. (Perlin et al. Citation2018) proposed a method to locate the pith of timber (unprocessed wood), as well as lumbers (processed wood), while (Qin et al. Citation2018) showed how to detect knots in wooden beams. Despite numerous previous tests, ultrasonic tomography in wooden elements can still be a difficult task. The reason for that lies mainly in wood anisotropy, which results in bending of paths of ultrasonic waves. The wavefront propagating in wood has a deformed shape in comparison to spherical waves obtained for isotropic media. The traditional tomographic imaging takes into account the straight radius transfer. In this particular case, however, the actual waveform shall be taken into account (Espinosa et al. Citation2019a, Citation2019b).
This paper evaluates the possibility to implement ultrasonic tomography for wooden beams. Both healthy and defective wood was taken for the experimental test. The damaged beams were acquired from a historical object and their degradation was significant. Additionally, in order to compare the results, measurements were also made for a new beam with dimensions corresponding to the historic beams. A new method of imaging the internal structure of the tested wood is proposed in this study. The focus is on the influence of wood anisotropy on the propagation of ultrasonic waves. The method consists in determining the position of the cross-section pith based on the fastest propagating signals. For the determined cross-section pith, an ultrasonic tomography map of the reference velocity distribution in the idealized model is created. Subtraction of maps made directly on the basis of ultrasonic wave signals and the reference map allows determining the location of defects.
2. Theoretical background of travel-time ultrasonic tomography
Travel-time ultrasonic tomography is an imaging technique that allows obtaining the internal image of an element structure in terms of the velocity of an elastic wave propagating within the medium. At first, the examined object is divided into finite area elements called cells or pixels (). The resolution of the final image depends on the number of pixels. Then, the time-of-flight (TOF) is measured between a transmitter and a receiver along multiple paths passing through a tested element. The system of linear equations enabling the reconstruction of the velocity profile can be written as:
Figure 1. Scheme of passing: (a) i path through j element, (b) several paths through the object.
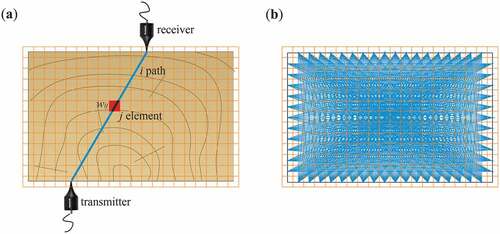
where ti is the total time from the transmitter to the receiver for i-th path, wij is the length of the i-th path passing through the j-th pixel and sj is the ultrasonic pulse slowness which is related to the ultrasonic pulse velocity vj in pixel j as:
Based on known cross-sectional geometry, it is possible to determine the ultrasonic pulse velocity in each pixel. In ultrasonic tomography, EquationEq. (1)(1)
(1) is usually overdetermined or underdetermined. Therefore, usual methods of resolution such as simple inversion or Gaussian elimination cannot be used. The system of equations can be solved by iterative methods. The calculations presented in this paper are based on the algebraic reconstruction technique (ART) (Kak and Slaney Citation1988), which is described by the following equation:
where Δti is the difference between the measured and the reconstructed time of flight, and the k index symbolizes the step of the iteration.
3. Materials and methods
3.1. Description of specimens
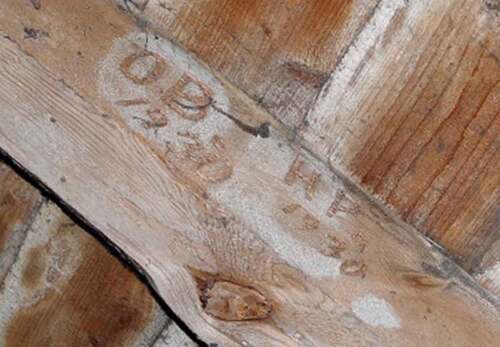
The ultrasonic surveys were conducted on wooden beams taken from the historical Monastery of Congregation of the Sisters of St. Catherine located in Orneta, in the northern part of Poland. It is a four-winged building with an inner courtyard on a rectangular plan. The object was built in 1586. It is entered in the Registry of Cultural Property in Poland under the number A-189, in the accordance with the decision of November 17, 1956. In its original form, the building was a monastery of Beguines from Orneta. In the 1880s, the bishop of Warmia, Marcin Kromer, decided to hand over the deserted monastery to the sisters of the Congregation of St. Catherine. Over the years, the city has changed its urban layout. The location of the monastery in the 17th-20th century is shown in maps and photos in . The building structure underwent numerous damages and fires. It was renovated and modernized many times. The date of the last renovation before World War II can be found on the rafters of the roof truss of the west wing along with the contractors’ initials. There are “OB HP” monograms and the date 1930 on the beam ().
Figure 2. Location of the monastery of congregation of the sisters of St. Catherine located in Orneta: (a) city plan from 1627 from the collection of “Kriegsarchiv” in Stockholm, (b) urban layout according to Giesego early 19th century, (c) city plan from 1940, (d) panorama of the city in the 1930s (Hliwiadczyn, Cholewska, and Grunwald Citation2018).
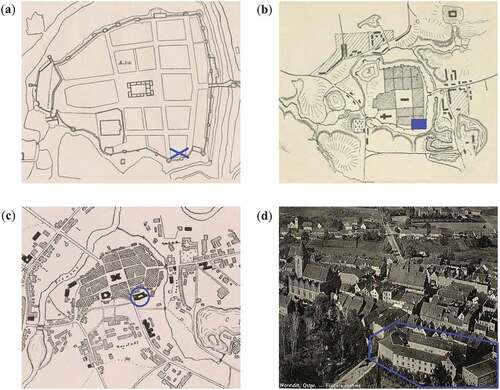
Figure 3. A rafter at the top of the roof of the monastery’s west wing. (Hliwiadczyn, Cholewska, and Grunwald Citation2018).
The three-story building of the old Grunenberg tobacco factory is connected to the Monastery building on the eastern side. Just like the monastery, the building was erected on the former city fortifications. However, the building was built much later, at the turn of the 19th and 20th centuries. It is not entered in the register of monuments, but is subject to conservation protection in accordance with the provisions of the Local Development Plan, being in the conservation protection zone. The monastery is connected with the former tobacco factory by a link.
Currently, both buildings are being renovated and they are to form one construction object. Due to the high rank of the complex, all design activities were subordinated to the principle of preserving the historical layout and maximum exposure of the monastery complex. This rule applies mainly to the legibility of the elements of medieval city fortifications, which have been partially preserved in the cubature of the existing building and can be exposed. The preservation of the historic substance was adopted as the basic assumption. For this reason, the new functional program was fully integrated into the existing layout of the rooms. The preserved historical elements inside the building are to be renovated. It is also assumed that the old tobacco factory will be restored to its original shape, in accordance with the documentation. The elements of the roof truss without any historical value are to be replaced (). Thanks to this, it was possible to collect the damaged fragments of the roof truss beams for testing ().
Figure 4. Photographs of the roof framework from the monastery of congregation of the sisters of St. Catherine in Orneta (Poland) before starting construction work (a-c) and when the works are carried out (d).
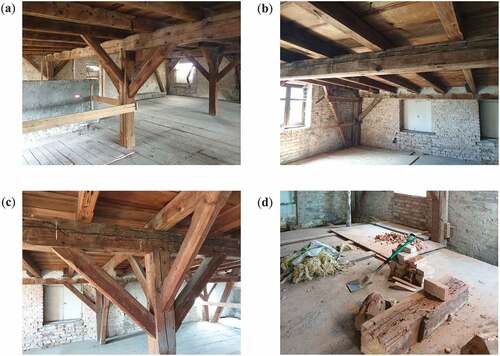
Figure 5. Laboratory models of wooden beams: (a) view of the beams, (b) dimensions of the beam, (c) cross-section of the tested beams #1–#3.
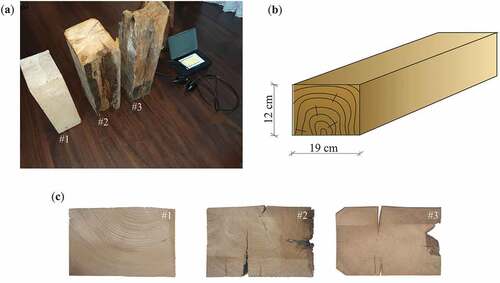
The ultrasonic tomography was conducted on three beams (), denoted as #1, #2 and #3. The dimensions of each beam were 19 cm x 12 cm (). Beams with different degrees of destruction were used for the research. The specimen (#1) was an intact pinewood beam. The edges of this beam were straight and the beam did not have any significant damages or cracks. The beams of such type were used to replace the damaged pieces of wood in the roof truss in the monastery building in Orneta. The other two specimens (#2 and #3) were historical beams from the roof structure. These beams were significantly damaged. There were defects in the material on one edge. In addition, cracks run along the wood fibres. They were replaced due to their bad technical condition by new wooden beams. After the tests, all tested samples #1–#3 were cut at the height of the reconstruction image. As a result, it was possible to identify the course of the fibres and the damage exactly at the plane of measurement ().
3.2. Experimental setup
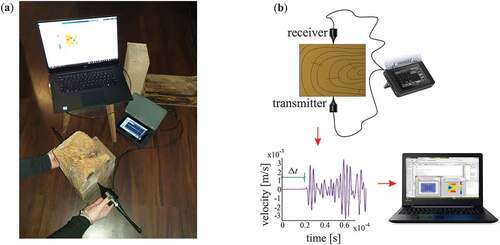
Ultrasonic tomography was performed based on the measured times-of-flight (TOFs) for waves passing through the tested element. Wave signals were measured by the PUNDIT PL-200 instrument (Proceq SA, Schwerzenbach, Switzerland). Two exponential transducers of 54 kHz were used in the through-transmission mode. The experimental setup and scheme of image reconstruction are shown in .
Figure 6. Experimental setup: (a) testing in through-transmission mode; (b) scheme of image reconstruction by ultrasonic tomography.
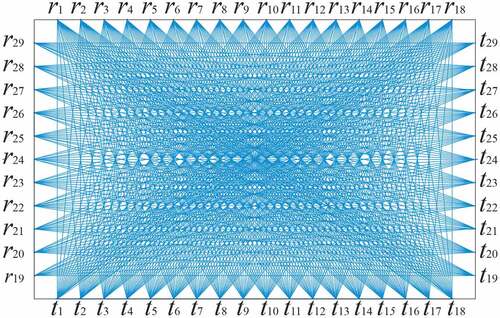
Measurements were carried out in the cross-section located in the mid-height of each beam. The configuration of transmitters (t1–t29) and receivers (r1–r29) is shown in . The transmitters and receivers were placed at the edge, with an interval of 1 cm between each other. The TOF for each transmitter was recorded at the receiver points lying on the opposite wall. For each of the beams, 445 TOFs were obtained.
Figure 7. Configuration of the wave paths from transmitters (t) to receivers (r).
4. Results and discussion
4.1. Ultrasonic tomography images
The internal structure of tested beams #1–#3 was reconstructed based on the collected TOFs. Wood is an anisotropic material in which the speed of ultrasonic waves in the radial-tangential plane depends on the direction of propagation, relative to the annual rings. The wave propagates faster in the radial direction and slows down going into the tangential direction (Yaitskova and Jan Willem van de Citation2014). The highest apparent speed in wood without defects, knots and defects is concentrated at the location of the cross-section pith since the pith location is inherently connected with annual rings (Perlin et al. Citation2018). The quantitative analysis of wave propagation velocities for each of the beams is given in , where the minimum, maximum and mean velocity are listed, supplemented by the measures of variability, i.e., the standard deviation (SD) and coefficient of variation (CV). summarizes the coefficient of variation (CV) for all 445 measurement paths, for each of the three samples separately. The coefficient was measured for two walls simultaneously. As an anisotropic material, examined wood samples showed a large change in properties depending on the direction of the fibers.
Table 1. Wave propagation velocities for beams #1-#3.
The first laboratory model (#1) was a new pine beam. The edges of this beam were straight and the beam did not have any significant damages or cracks. shows the resulting tomography velocity map for beam #1 together with the photograph of its cross-section. Significantly higher values of wave velocity were observed in the upper part of the image. This area indicates that the pith can be located near the upper edge of the cross-section or even outside of it. The measured values of the wave velocity for beam # 1 ranged from 929.7 m/s to 1637.0 m/s, thus the difference between the lowest and the highest velocity was 707.3 m/s. The average value of the velocity for this beam was 1231.5 m/s. The variability of measurements along different paths was determined were: SD equal to 154.2 m/s and CV equal to 12.5%.
Figure 8. Results obtained for beam #1: (a) top view of the beam, (a) ultrasonic tomography image, (c) side view of the beam.
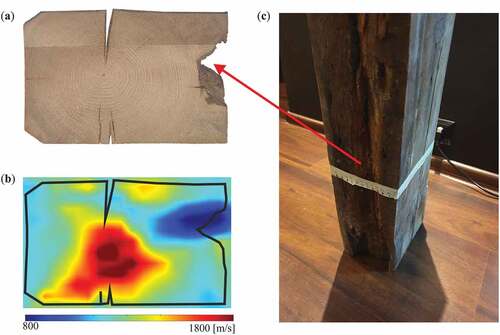
Beam #2 was taken from the historical roof framework. One of its sides included major wood fibrosis (see ). The remaining three contained cracks. The ultrasonic tomography image clearly indicates the places where the beam is damaged (). The edge with the wood fibrosis showed the reduced wave transfer velocity. A similar effect was observed in the places where the cracks were located. Furthermore, an increased velocity may be spotted at the location of the pith, similar to the reference beam (#1). The wave propagation velocity varied between 632.7 m/s and 1442.3 m/s. The difference between the minimum and maximum velocity was, therefore, greater than in the reference beam (#1) and equal to 809.6 m/s. The average velocity of wave propagation was 1093.3 m/s, the standard deviation was 137 m/s. Both of these values are smaller than in the undamaged beam. The coefficient of variation was equal to 12.5% and it was at the same value as for reference beam #1. However, it should be noted that the pith of the undamaged beam is outside the cross-section, while in beam #2, the pith is within the tested cross-section.
Figure 9. Results obtained for beam #2: (a) top view of the beam, (a) ultrasonic tomography image, (c) side view of the beam.
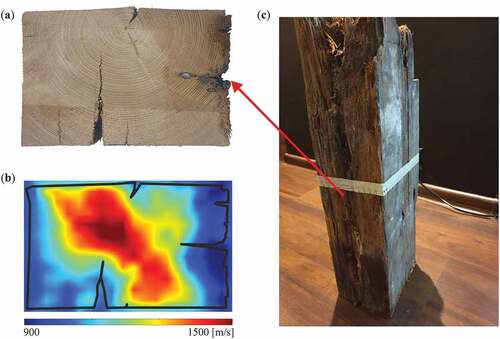
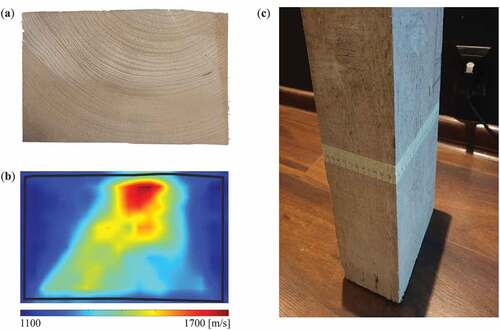
Beam #3 had the highest level of degradation. One of the sides included a significant cavity caused by insects (). This place is marked in blue on the ultrasonic tomography map (). The remaining sides included cracks. The biggest crack is marked on the tomographic image. Similarly to beams #1 and #2 the greatest concentration of the wave propagation velocity determined the location of the pith. The propagation velocity of ultrasonic waves was between 478.6 m/s and 2262.3 m/s. The difference between the minimum and maximum velocity was the largest compared to the other two beams. It was twice as high as in the reference beam. The average velocity was 1462.3 m/s. The standard deviation (SD) was 293.4 m/s, while the coefficient of variation (CV) is 20.1%. Such a high value indicates significant damage to the beam.
Figure 10. Results obtained for beam #3: (a) top view of the beam, (a) ultrasonic tomography image, (c) side view of the beam.
4.2. Location of the pith
The anisotropy of wood significantly affects the velocity of propagation of ultrasonic waves. The highest velocity is observed in the case of waves propagating through the pith. This place on tomographic maps is indicated as a point with an increased apparent velocity value. This property of wood causes some difficulties in determining the state of preservation of a wooden element using non-destructive testing methods. Contrary to isotropic elements, it is more difficult to indicate the places of potential destruction.
This paper proposes a novel approach to determining the quality of preservation of historic wooden beams. The method consists in determining the location of the pith and then using this knowledge to create tomographic velocity maps. In general, the wood pith may be within or outside the cross-sectional area for which the measurements are made. In the proposed approach, it was based on 5% of the fastest paths among the collected measurement data. These paths, marked in red in , were selected in order to determine the location of the pith for each of the beams. If the fastest paths appear between a pair of opposite edges, it is an indication that the pith lies outside the examined area. This can be seen in the case of beam #1. For the remaining beams (#2–#3), the fastest rays occurred between two pairs of opposite edges. This indicates the location of the pith inside the tested cross-section. Moreover, the average velocities of waves propagating from two perpendicular walls were compared (). The first edge took into account the measurements made between the transmitters t1–t18 and the receivers r1–r18, while the second edge included the measurements made between the transmitters t19-t29 and the receivers r19–r29. In the case of the pith located outside the cross-section, this difference will be much greater. This is because waves propagating perpendicular to the fibres have a much slower velocity than waves propagating along the fibres. It is assumed that a value greater than 1.15 indicates the possibility of the wood pith occurring outside the tested cross-section. This coefficient appears only in beam # 1.
Figure 11. Rays of performed measurements with the 5% fastest waves marked in red.
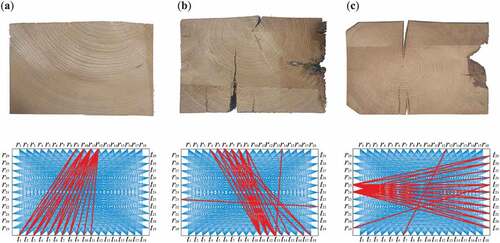
Table 2. Comparison of the velocity of waves propagating from two perpendicular walls.
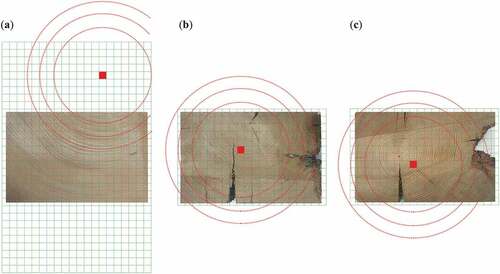
The wood pith was searched independently for each pixel into which the element was divided. In the case of the element for which the pith was expected to be outside, the pixel grid was enlarged along the edge from where the fastest rays propagated. The pixel grid was therefore enlarged 3 times for element #1 (). In beams #2 and #3 the pixel grids remained unchanged (). For each of the pixels, the closest path from each transmitter t1–t29 and each receiver s1–s29 was selected. Thus, 58 rays were assigned to each pixel. The pixel for which the sum of the velocities of these rays was the highest indicated the positions of the pith. Selected pixels are shown in red in . In beam #1, it coincides with the actual location of the pith. In beams #2 and #3, it is slightly shifted due to the failures in the beams affecting the course of the rays.
Figure 12. Determining the location of the pith form beams #1-#3.
Idealized maps of wave propagation velocity in the wooden element were created after determining the pith location (, second row). The highest speed was identified at the designated pith and was equal to the maximum value in the preliminary topographic map (). It was different for each of the three samples and was 1637 m/s, 1442.3 and 1842.5 m/s respectively for samples # 1- # 3. The velocity decreased circularly and uniformly for each direction of the outer edges of the beams. The third row in summarizes the initial tomographic maps. The final result is the maps shown in the fourth row. They are the difference between idealized and initial maps. Due to the subtraction of the idealized model indicating the location of the pith, only places showing a decrease in wave propagation velocity due to discontinuities, voids, scratches or fibrosis are visible on these maps. The final ultrasound tomography maps with a visible beam cross-section are shown in .
Figure 13. Ultrasound tomography maps: cross-sections (first row), idealized models, taking into account the location of the pith (second row), initial tomographic maps from (third row), the difference between the idealized maps and the initial maps (fourth row).
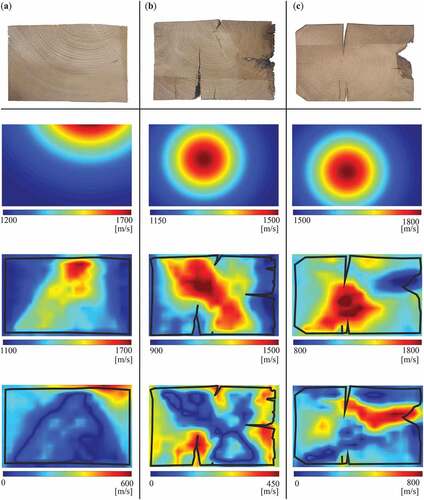
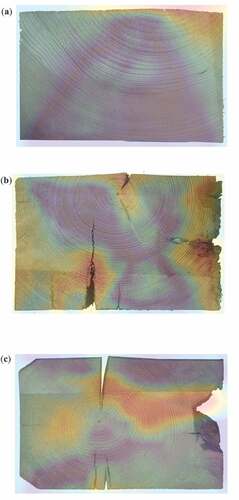
Figure 14. Final ultrasonic tomography maps imposed on cross-sections of tested beams.
5. Conslusions
This article describes the experimental research conducted on wooden beams from a historical object. Two damaged beams were used for the research, and their technical condition was determined by employing ultrasonic tomography. The obtained results were compared with the tomography performed for a new, undamaged beam with similar cross-section dimensions.
The conducted research aimed at evaluating the possibility to use ultrasonic waves for imaging the internal structure of historical wood. The paper proposes a novel method of assessing the technical condition of wooden beams. First, the location of the wood cross-section pith was determined taking into account the fastest rays propagating through the tested element. For the correct interpretation of the obtained tomographic image, it is essential. It has been proved that if the cross-section pith lies in the tested area, 5% of the fastest rays occurred in both directions, vertically and horizontally. If the pith of the cross-section was outside the examined cross-section, the fastest rays occurred in one direction only. Moreover, a difference in the ratio of average velocities in both directions was observed for elements with the pith located in the tested cross-section and outside it. If the pith is outside the test area, the ratio was greater than 1.15. An idealized tomographic model was developed based on the knowledge of the location of the pith. In the wooden element, the ultrasound tomography map located the pith as a place with increased wave propagation velocity. If the purpose of the test is to find damage to the wood, then the velocity-increasing effect in the pith area should be overcome. This is why the final map was drawn as a subtraction of the idealized map, showing the location of the pith from the original map. On this map, the increase in speed caused by the location of the pith inside the cross-section was reduced. The areas with wood fibrosis and damages caused by insect activity indicated a significant reduction in the ultrasonic velocity. A similar effect was visible in places where the cracks in wood occurred. At the same time, it should be noted that in the case of significant damaged beams (beam #3), ultrasonic waves are strongly disturbed. Such behavior of the waves reduces the apparent speed on the tomographic map over a larger area than the actual defect occurs. This should be taken into account when analyzing the obtained velocity distribution images.
An ultrasonic tomography is an effective tool enabling the reconstruction of the internal cross-section of the examined wooden element. The presented approach may be used to evaluate the quality of the wooden beams, which damages are not always in plain sight. Owing to this, a more effective plan of wooden structure repair and renovation works can be prepared and used for such elements as roof framework or ceiling, which often appear in historical objects.
Acknowledgments
The research work was carried out within project No. 2017/27/N/ST8/02399, financed by the National Science Centre, Poland.
Disclosure statement
No potential conflict of interest was reported by the author(s).
Additional information
Funding
References
- Alves, R. C., J. N. R. Mantilla, C. F. Bremer, and E. V. M. Carrasco. 2015. Application of acoustic tomography and ultrasonic waves to estimate stiffness constants of muiracatiara Brazilian wood Bioresources . 10 (2010):1845–56.
- Arciniegas, A., F. Prieto, L. Brancheriau, and P. Lasaygues. 2014. Literature review of acoustic and ultrasonic tomography in standing trees. Trees - Structure and Function 28 (6):1559–67. doi:10.1007/s00468-014-1062-6.
- Beall, F. C. 2002. Overview of the use of ultrasonic technologies in research on wood properties. Wood Science and Technology 36 (3):197–212. doi:10.1007/s00226-002-0138-4.
- Beni, S., N. Macchioni, M. Mannucci, R. Olmi, S. Palanti, and C. Riminesi. 2016. First trials to set up a microwave reflectometric tool for the survey of historic timber structures. International Journal of Architectural Heritage 10 (5):636–45. doi:10.1080/15583058.2015.1077904.
- Brazee, N. J., R. E. Marra, L. Göcke, and P. Van Wassenaer. 2011. Non-destructive assessment of internal decay in three hardwood species of Northeastern North America using sonic and electrical impedance tomography. Forestry 84 (1):33–39. doi:10.1093/forestry/cpq040.
- Bucur, V. 2003. Techniques for high resolution imaging of wood structure: A review. Measurement Science and Technology 14 (12):12. doi:10.1088/0957-0233/14/12/R01.
- Chenwei, W., J. Xue, D. Song, and Y. Zhang. 2021. Seismic performance evaluation of a roof structure of a historic Chinese timber frame building. International Journal of Architectural Heritage, 1–22. doi:10.1080/15583058.2021.1894503.
- Colla, C. 2016. Verification of sonic tomography outcome through local testing of mechanical properties in Historic timber beam. Journal of Heritage Conservation 47:71–79. doi:10.17425/WK47TIMBERBEAM.
- Comino, E., V. Socco, R. Martinis, G. Nicolotti, and L. Sambuelli. 2000. Ultrasonic tomography for wood decay diagnosis. In International symposium on plant health in urban horticulture, Braunschweig, ed. E. Backhaus, G. F. Balder, and H. Idczak, 279, Germany: Biologischen Bundesanstalt für Land- und Forstwirtschaft.
- Drobiec, Ł., R. Jasiński, and W. Mazur. 2019. Accuracy of eddy-current and radar methods used in reinforcement detection. Materials 12 (7):1168. doi:10.3390/ma12071168.
- Espinosa, L., F. Prieto, L. Brancheriau, and P. Lasaygues. 2019a. Effect of wood anisotropy in ultrasonic wave Propagation : A ray-tracing approach Ultrasonics . 91:242–51. doi:10.1016/j.ultras.2018.07.015.
- Espinosa, L., F. Prieto, L. Brancheriau, and P. Lasaygues. 2019b. Quantitative parametric imaging by ultrasound computed tomography of trees under anisotropic conditions: Numerical case study. Ultrasonics (26):106060. doi:10.1016/j.ultras.2019.106060.
- Feio, A. O., P. B. Lourenço, and J. S. Machado. 2007. Non-destructive evaluation of the mechanical behavior of chestnut wood in tension and compression parallel to grain. International Journal of Architectural Heritage 1 (3):272–92. doi:10.1080/15583050701300475.
- Giuliana, D., S. Fink, and F. W. M. R. Schwarze. 2008. Detection of incipient decay in tree stems with Sonic tomography after wounding and fungal inoculation. Wood Science and Technology 42 (2):117–32. doi:10.1007/s00226-007-0159-0.
- Grębowski, K., M. Rucka, and K. Wilde. 2019. Non-destructive testing of a sport tribune under synchronized crowd-induced excitation using vibration analysis. Materials 12 (13):2148. doi:10.3390/ma12132148.
- Hliwiadczyn, S., M. Cholewska, and M. Grunwald. 2018. . Documentation of conservatoryResearch conservatory expertise and conservation work program, Vol II. concerning the interiors of the convent of the congregation of the sisters of St. Catherine in Orneta. Vol II. (Morąg) .
- Kak, A. C., and M. Slaney. 1988. Principles of computerized tomographic imaging. New York: The Institiute of Electrical and Electronics Engineers, Inc.
- Kobayashi, K., S. Wook Hwang, T. Okochi, W. Hee Lee, and J. Sugiyama. 2019. Non-destructive method for wood identification using conventional X-ray computed tomography data. Journal of Cultural Heritage 38:88–93. doi:10.1016/j.culher.2019.02.001.
- López, G., L. Alfonso Basterra, G. Ramón-Cueto, and A. De Diego. 2014. Detection of singularities and subsurface defects in wood by infrared thermography. International Journal of Architectural Heritage 8 (4):517–36. doi:10.1080/15583058.2012.702369.
- Lubowiecka, I., T. Zybała, and G. Bukal. 2019. On the current state of dovetail wall-corner joints in wooden Greek catholic churches in polish subcarpathia with structural and sensitivity analyses on the current state of dovetail wall-corner joints in wooden Greek catholic churches in polish subcarpat. Journal of Biomedical Materials Research. Part B, Applied Biomaterials 107 (5):1400–09. doi:10.1002/jbm.b.34232.
- Mai, T. C., S. Razafindratsima, Z. Mehdi Sbartaï, F. Demontoux, and F. Bos. 2015. Non-destructive evaluation of moisture content of wood material at GPR frequency. Construction and Building Materials 77:213–17. doi:10.1016/j.conbuildmat.2014.12.030.
- Martínez-Sala, R., I. Rodríguez-Abad, R. Diez Barra, and R. Capuz-Lladró. 2013. Assessment of the dielectric anisotropy in timber using the nondestructive GPR technique. Construction and Building Materials 38:903–11. doi:10.1016/j.conbuildmat.2012.09.052.
- Niemz, P., and D. Mannes. 2012. Non-destructive testing of wood and wood-based materials. Journal of Cultural Heritage 13 (3):S26–34. doi:10.1016/j.culher.2012.04.001.
- Nilakantan, P. 1937. X-ray studies of wood, lignin and wood-cellulose. Proceedings of the Indian Academy of Sciences - Section A 5 (2):166–74. doi:10.1007/BF03036172.
- Paris, J. L., and F. A. Kamke. 2015. Quantitative wood-adhesive penetration with X-ray computed tomography. International Journal of Adhesion and Adhesives 61:71–80. doi:10.1016/j.ijadhadh.2015.05.006.
- Pastorino, M., A. Randazzo, A. Fedeli, A. Salvadè, S. Poretti, M. Maffongelli, R. Monleone, and M. Lanini. 2015. A microwave tomographic system for wood characterization in the forest products industry. Wood Material Science & Engineering 10 (1):75–85. doi:10.1080/17480272.2014.898696.
- Perlin, L. P., Â. Valle, R. Caldas, and D. Andrade Pinto. 2018. New method to locate the pith position in a wood cross-section based on ultrasonic measurements Construction and Building Materials . 169:733–39. doi:10.1016/j.conbuildmat.2018.03.021.
- Qin, J., X. Liu, K. Van Den Abeele, and G. Cui. 2018. The study of wood knots using acoustic nondestructive testing methods. Ultrasonics 88:43–50. doi:10.1016/j.ultras.2018.01.004.
- Rebouças, A. S., Z. Mehdipour, M. Jorge, B. Paulo, and B. Lourenço. 2022 February. Ductile moment-resisting timber connections: A review. Buildings 12(2):240. doi:10.3390/buildings12020240.
- Riccadonna, D., I. Giongo, D. Casagrande, and M. Piazza. 2019. Acoustic testing for the preliminary assessment of timber beams — A pilot study. International Journal of Architectural Heritage 13 (7):979–91. doi:10.1080/15583058.2019.1598516.
- Rucka, M., E. Wojtczak, and M. Zielińska. 2020. Interpolation methods in GPR tomographic imaging of linear and volume anomalies for cultural heritage diagnostics. Measurement: Journal of the International Measurement Confederation 154. doi:10.1016/j.measurement.2020.107494.
- Santini, S., C. Baggio, and L. Sguerri. 2021. Sustainable interventions: Conservation of old timber roof of Michelangelo’s cloister in Diocletian’s baths. International Journal of Architectural Heritage, 1–18. doi:10.1080/15583058.2021.1938747.
- Słoński, M., K. Schabowicz, and E. Krawczyk. 2020. Detection of flaws in concrete using ultrasonic tomography and convolutional neural networks. Materials 13 (7):1557. doi:10.3390/ma13071557.
- Tomikawa, Y., Y. Iwase, K. Arita, and H. Yamada. 1986. Non destructive inspection of wooden Poles using ultrasonic tomogrphy. IEEE Transactions on Ultrasonics, Ferroelectrics and Frequency Control 33 (4):354–58. doi:10.1109/T-UFFC.1986.26842.
- Wei, Q., B. Leblon, and A. la Rocque. 2011. On the use of X-ray computed tomography for determining wood properties: A review 1. Canadian Journal of Forest Research 41 (11):2120–40. doi:10.1139/x11-111.
- Yaitskova, N., and K. Jan Willem van de. 2014. Time-of-flight modeling of transversal ultrasonic scan of wood. The Journal of the Acoustical Society of America 135 (6):3409–15. doi:10.1121/1.4873519.
- Yan, B., W. Chongke, and M. Honglin 2018. Study on the method of nonmetallic defects based on ultrasonic tomography and morphology. Proceedings of the 2017 12th IEEE Conference on Industrial Electronics and Applications, ICIEA 2017 Cambodia 2018 February: 1287–92. 10.1109/ICIEA.2017.8283037.
- Zielińska, M., and M. Rucka. 2018. Non-destructive assessment of masonry pillars using ultrasonic tomography. Materials 11 (12):2543. doi:10.3390/ma11122543.
- Zybała, T., K. Szepietowska, G. Bukal, and I. Lubowiecka. 2021. Portico farmhouses of the vistula delta: Architecture, current state and finite element modelling of timber roof truss under material and cross-section uncertainty. International Journal of Architectural Heritage, 1–22. doi:10.1080/15583058.2021.1918285.