
ABSTRACT
Orexin neurons regulate critical brain activities for controlling sleep, eating, emotions, and metabolism, and impaired orexin neuron function results in several neurologic disorders. Therefore, restoring normal orexin function and understanding the mechanisms of loss or impairment of orexin neurons represent important goals. As a step toward that end, we generated human orexin neurons from induced pluripotent stem cells (hiPSCs) by treatment with N-acetyl-d-mannosamine (ManNAc) and its derivatives. The generation of orexin neurons was associated with DNA hypomethylation, histone H3/H4 hyperacetylation, and hypo-O-GlcNAcylation on the HCRT gene locus, and, thereby, the treatment of inhibitors of SIRT1 and OGT were effective at inducing orexin neurons from hiPSCs. The prolonged exposure of orexin neurons to high glucose in culture caused irreversible silencing of the HCRT gene, which was characterized by H3/H4 hypoacetylation and hyper-O-GlcNAcylation. The DNA hypomethylation status, once established in orexin neurogenesis, was maintained in the HCRT-silenced orexin neurons, indicating that histone modifications, but not DNA methylation, were responsible for the HCRT silencing. Thus, the epigenetic status of the HCRT gene is unique to the hyperglycemia-induced silencing. Intriguingly, treatment of ManNAc and its derivatives reactivated HCRT gene expression, while inhibitors SIRT1 and the OGT did not. The present study revealed that the HCRT gene was silenced by the hyperglycemia condition, and ManNAc and its derivatives were useful for restoring the orexin neurons.
Abbreviations
| ManNAc | = | N-acetyl-d-mannosamine |
| MGEA5 | = | Meningioma Expressed Antigen 5 |
| SIRT1 | = | Sirtuin 1 |
| O-GlcNAc | = | O-linked N-acetylglucosamine |
| OGT | = | O-GlcNAc transferase |
| mESC | = | mouse embryonic stem cell |
| miON | = | mouse induced orexin neuron |
| hiPSC | = | human induced pluripotent stem cell |
| hiON | = | human induced orexin neuron |
| HAT | = | histone acetyltransferase |
| ChIP | = | chromatin immunoprecipitation |
| T-DMR | = | tissue-dependent differentially methylated region |
| TSS | = | transcriptional start site |
Introduction
OREXIN-A and OREXIN-B are neuropeptides produced by the cleavage of prepro-orexin, which is encoded by the hypocretin (HCRT/Hcrt) gene.Citation1,Citation2 Orexin neurons project broadly to dopaminergic, noradrenergic, and GABAergic neurons.Citation3 Therefore, the orexin system is associated with various physiologic and pathophysiological events. Loss or impairment of orexin neurons is a feature of several other neurologic disorders, including anorexia and Parkinson disease.Citation4-6 It has been established that orexin deficiency is a cause of human narcolepsy, which is characterized by daytime sleepiness with an uncontrolled need for sleep, lapses into sleep, and cataplexy.Citation7-9
Hcrt knockout mice exhibit late-onset obesity despite a decrease in food intake.Citation1 Patients with narcolepsy have higher body mass indices (BMIs) compared with the general population.Citation10-13 In contrast, diabetes model mice have decreased numbers of orexin neurons in the lateral hypothalamic area.Citation14,Citation15 The loss of orexin neurons may be involved in metabolic disorders, and vice versa. Since environmental conditions, such as aging and diabetes, are associated with orexin neuron loss,Citation14,Citation16,Citation17 there must be a close relationship between the loss of orexin neurons and metabolic abnormalities. The molecular mechanisms of the orexin neuron loss, however, have not yet been determined. HCRT/Hcrt gene silencing may be one of the causes of pathogenic loss or chronic impairment of orexin neurons under a hyperglycemic condition.
We previously reported the induction of functional mouse orexin neurons (miONs) from mouse embryonic stem cells (mESCs) by culturing them in a neural culture medium containing N-acetyl-D-mannosamine (ManNAc).Citation18 ManNAc is an intermediate metabolite produced from glucose in the hexosamine biosynthetic pathway (HBP). The involvement of HBP in orexin neurogenesis suggests a link between metabolic disorders and the loss or impairment of orexin neurons. UDP-GlcNAc, a donor for O-GlcNAcylation, is also an intermediate metabolite of glucose in the HBP.Citation19-23 O-GlcNAcylation is a modification occurring in various proteins, including transcription factors, epigenetic factors, and histones, in which single O-GlcNAc moieties are attached to serine (Ser) or threonine (Thr) residues. O-GlcNAc transferase (OGT) catalyzes the addition of O-GlcNAc to the Ser or Thr residues of target proteins. O-GlcNAcase (OGA), which is encoded by MGEA5, removes O-GlcNAc from the protein.Citation20
DNA methylation and histone modifications are the main epigenetic mechanisms that underlie the differentiation and chronic pathological changes in cells.Citation24,Citation25 Numerous tissue-dependent differentially methylated regions (T-DMRs) have been identified in the CpG sites in the mammalian genome.Citation26,Citation27 In general, genes with hypomethylated T-DMRs are associated with histone modifications permissive for gene expression, such as H3K9, K14, H4K8, K16 acetylation, and H3K4 methylation.Citation28 On the other hand, loci with hypermethylated T-DMRs are associated with repressive histone modifications, such as H3K9 and K27 methylation, which create a silent state. The Hcrt gene is hypermethylated at T-DMRs in the mESC and neural precursor cells, while the T-DMRs are hypomethylated in the miONs.Citation18 Therefore, epigenetic switching has been shown to be a key step in mouse orexin neurogenesis, and may also be relevant in humans.
In this study, we aimed to induce the differentiation of orexin neurons from human induced pluripotent stem cells (hiPSCs) by ManNAc, based on the method to produce miONs.Citation18 We hypothesized that ManNAc might also be useful in human orexin neurogenesis. This raised the question: Does ManNAc affect the metabolic pathways to produce nicotinamide adenine dinucleotide (NAD+) and UDP-GlcNAc, which are involved in epigenetic regulation? Furthermore, is sialic acid production involved in orexin neurogenesis? ManNAc is a metabolite of UDP-GlcNAc and a precursor of sialic acid. We also needed to consider that CMP-Neu5Ac, which is produced in the final step of the sialic acid synthesis pathway, has a function for feedback inhibition of the UDP-GlcNAc 2-epimerase activity, and, thereby, sialic acid synthesis can affect the amount of UDP-GlcNAc.Citation29 To help address these questions, we induced differentiation of the orexin neurons and developed ManNAc derivatives. Moreover, restoring normal orexin function and understanding the mechanisms of loss or impairment of orexin neurons are important goals in this study. Here, by using orexin neurons derived from hiPSCs, we showed that in vitro hyperglycemia causes HCRT gene silencing involved in epigenetic alteration and that ManNAc and its derivatives could reactivate HCRT gene expression.
Results
Treatment with ManNAc induces HCRT gene expression during neural differentiation of hiPSCs
Treatment with ManNAc during neural differentiation culture of hiPSCs could induce expression of the HCRT gene (201B7 cell line; and ) and this treatment was required for a longer period in human cells than in mouse cells (20 d vs. 10 d, respectively).Citation18 Treatment with other glucose and HBP metabolites, Glucosamine (GlcN), N-acetyl-d-glucosamine (GlcNAc), or N-acetyl-neuraminic acid (Neu5Ac), did not lead to HCRT expression. Immunofluorescence studies showed the expression of OREXIN-A and -B in the cells treated with ManNAc (). Co-expression of OREXIN-A and -B with the neural markers TUBB3 and NCAM were also confirmed. From these results, we confirmed that generation of orexin neurons could be achieved by treatment of hiPSCs with ManNAc.
Figure 1. Generation of orexin neurons from human induced pluripotent stem cells (hiPSCs) by ManNAc treatment. (A-H) Induction of neural cells expressing HCRT from hiPSCs. Differentiation of the neural cells from hiPSCs was induced by culture in SDIA+BMP4 medium with or without the addition of GlcN (1 mM), GlcNAc (1 mM), ManNAc (1 mM), or Neu5Ac (1 mM). Culture protocol to prepare neural cells derived from hiPSCs (A). On day 20, HCRT mRNA expression was analyzed by RT-PCR (B). We also performed immunofluorescent (IF) assays for OREXIN-A and OREXIN-B (C). OREXIN-A (green, upper), TUBB3 (red, upper), OREXIN-B (green, bottom), NCAM (red, bottom), and DAPI (blue). TUBB3 and NCAM are pan-neural markers. The right panel shows high magnification images of the ManNAc-treated cells. Scale bars, 100 μm (left panel) and 10 μm (right panel). Zebularine (100 μm) and Trichostatin A (TSA, 200 nM) were added to the SDIA+BMP4 medium, and HCRT mRNA expression was analyzed by RT-qPCR (D). BADGP (5 mM) or EX-527 (50 nM) was added to the SDIA+BMP4 medium with or without the addition of ManNAc, and HCRT mRNA expression was analyzed by RT-qPCR (E). The data were normalized to ACTB levels. Relative values were expressed, with the expression of ManNAc-treated cells (line 5) equal to 1.0. Means ± SD (n = 3). Immunofluorescence (IF) assay in EX-527 and BADGP-treated cells (F). ST078925 (100 μM) or ST045849 (40 μM) was added to the SDIA+BMP4 medium containing ManNAc and EX-527, and HCRT mRNA and OREXIN-A expressions were analyzed by RT-qPCR (G) and IF assays (H), respectively.
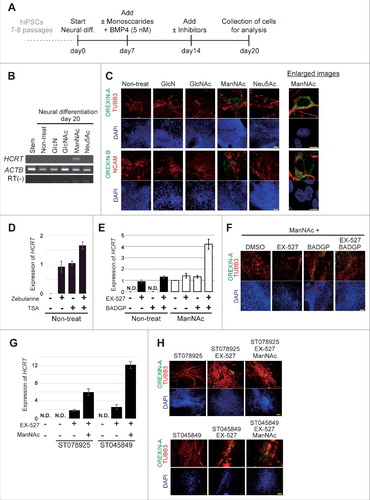
Inhibitors of DNA methylation (Zebularine), histone de-acetylation (Trichostatin A, TSA), SIRT1 (EX-527), OGT (BADGP), and their combinations induced expression of the HCRT gene and OREXIN-A in hiPSCs (). Furthermore, there were synergistic effects of ManNAc, EX-527, and BADGP on HCRT expression. Similar results were obtained in experiments using two specific OGT inhibitors (ST078925 and ST045849; and ). Therefore, epigenetic regulation, consisting of at least DNA methylation, histone acetylation and O GlcNAcylation, was involved in HCRT gene expression in hiPSCs.
Generation of human orexin neurons by ManNAc derivatives
To develop more potent compounds for orexin neurogenesis, we prepared several derivatives of ManNAc (Table S1) and evaluated their activities in inducing the HCRT/Hcrt gene expression in the neural cells derived from hiPSCs and mESCs.
The activities of ManNFAc, 5S-ManNAc, 5S-ManNAcF, ManNCOOMe, and ManNCOOEt were more potent than that of ManNAc in human cells (). The activity of ManNCOOEt reached a plateau at 1 μM and was maintained up to 10 μM, thus a wide range of activity was observed (). The other derivatives had bell shape-like responses, i.e., the activities were the highest at 1 μM for ManNFAc and at 200 nM for ManNCOOMe but were reduced at higher concentrations (). Unexpectedly, Me-α-ManNAc and SPh-αβ-ManNAc were active in mouse cells (Fig. S1). In contrast, these derivatives did not show any activity in human cells.
Figure 2. Generation of human orexin neuron by treatment with ManNAc derivatives. (A-C) Activities of 13 ManNAc derivatives for HCRT gene expression in neural cells derived from hiPSCs. hiPSCs were cultured in SDIA+BMP4 medium for 20 d (). ManNAc derivatives were added on day 7, and HCRT mRNA expression was evaluated by RT-PCR (A) or RT-qPCR (B). Values were normalized to ACTB expression. Means ± SD (n = 3). The broken red line indicates the activity of ManNAc for comparison. IF assay to confirm OREXIN-A expression in the hiONs induced by ManNAc and ManNFAc (C). Right panel indicates the high magnification images in ManNAc- and ManNFAc-treated cells. Scale bars, 100 μm (left panel) and 10 μm (right panel). (D) Efficiencies of neural cells treated with ManNAc, ManNFAc, or the inhibitors BADGP and EX-527 (see also ). Percentages of OREXIN-A positive area were determined by counting the OREXIN-A positive areas, and normalized by the DAPI-positive areas in 20 random images.
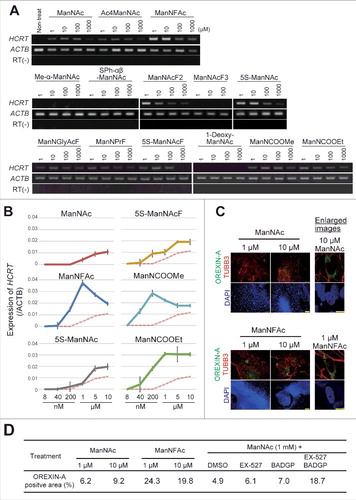
We next investigated the induction efficiencies of orexin neurons by ManNAc and ManNFAc, with and without treatment with a combination of EX-527 and BADGP, using an immunofluorescence assay for OREXIN-A ( and ). Treatment with ManNFAc (1 µM) was the most efficient in inducing OREXIN-A expression and led to the induction of 24.3% of the DAPI-stained total area. The induction efficiency of OREXIN-A positive cells by ManNFAc was better than the combination of ManNAc with EX-527 and BADGP, suggesting that the pharmacological effect of ManNFAc is achieved by the mechanism of inhibition of SIRT1 and OGT. In this study, OREXIN positive cells induced by treatments with either ManNAc or ManNAc derivatives are called human induced orexin neurons (hiONs).
hiONs equip the physiologic nature and sensitivity to glucose
Orexin neurons are localized in the lateral hypothalamic area (LHA)Citation1-3 and respond to circulating hormones and indicators of metabolic status, including circulating glucose levels. It is well documented that orexin neurons can respond to leptin secreted by the peripheral adipose tissue, and ghrelin secreted by the stomach before meals during fasting.Citation30
We tested the acute responses of the hiONs to the various neural peptides by using an ELISA. The hiONs by ManNAc and ManNFAc were responsive to neural peptides such as ghrelin and leptin ( and S2A). GABA and neuropeptide Y (NPY) repressed the secretion of OREXIN-A in a dose-dependent manner ( and S2B). Orexin neurons sense glucose as a peripheral metabolic signal.Citation31,Citation32 In hiONs, secretion of OREXIN-A was minimal at a 25 mM glucose concentration; however, increased secretion was observed at 1 mM and 5 mM glucose concentrations ( and S2C). Glucose-induced suppression of OREXIN-A secretion was also observed in the presence of 100 nM ghrelin. Therefore, hiONs have the ability to respond to neural peptides and glucose, which are well-known regulators of secretion in orexin neurons in vivo.Citation30
Figure 3. Acute response of ManNFAc-treated cells to neural and peripheral metabolic signals. (A-C) Responses of ManNFAc-treated cells to metabolic signals. The cells were incubated for 3 h with various doses of ghrelin, leptin (A), GABA, Neuropeptide Y (NPY) (B), and glucose (C). OREXIN-A in the medium was evaluated using an ELISA. Means ± SD (n = 3). Non, non-treated neural cell. Responses of ManNAc-treated cells are shown in Fig. S2.
ManNAc and its derivatives affect the cellular metabolome
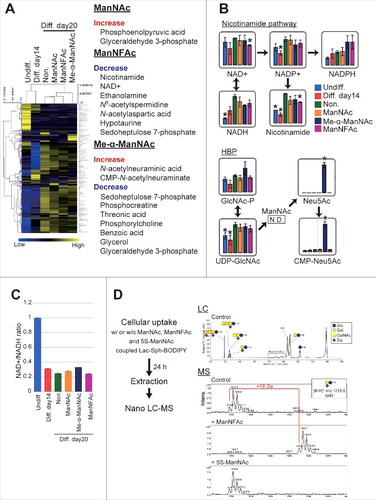
To evaluate how metabolic changes are associated with neurogenesis in the hiPSCs in response to ManNAc and its derivatives, neural cells at day 14 (neural progenitor cell stage) and at day 20 (OREXIN-positive preparations by ManNAc or ManNFAc and OREXIN-negative preparations either non-treated or treated with Me-α-ManNAc) were subjected to a metabolome analysis using liquid chromatography-mass spectrometry (LC-MS). There was a dynamic change at 14 d after the neural differentiation of hiPSCs (). In the neural cell preparation (day 20), there were significant differences in the levels of metabolites following treatments with ManNAc, ManNFAc, and Me-α-ManNAc. For example, treatment with ManNAc caused an increase in the levels of metabolites such as phosphoenolpyruvic acid and glyceraldehyde 3-phosphate (). ManNFAc caused a decrease in nicotinamide and NAD+ ( and ). There was also a dramatic decrease in the NAD+/NADH ratio after differentiation into neural cells (); however, the ratio in neural cells at day 20 was similar among the treatments. In the HBP, the level of UDP-GlcNAc increased after differentiation into neural cells (day 20) compared with those at the undifferentiated state and the neural progenitor cell stage (day 14), regardless of treatment with ManNAc or its derivatives ().
Figure 4. Effects of ManNAc and its derivatives on the metabolome. (A-C) Metabolome analyses of hiPSCs, non-orexigenic cells, and hiONs. Undifferentiated hiPSCs, intermediate neural cells (on day 14), and neural cells (on day 20) treated with or without ManNAc or potent (ManNFAc) or less-potent (Me-α-ManNAc) derivatives were subjected to a metabolome analysis by LC-MS. The values of the metabolites are presented in a heatmap showing hiPSCs, non-orexin neural cells (days 14 and 20), and ManNAc-, ManNFAc-, and Me-α-ManNAc-treated cells (A). The metabolites, which are significantly changed in ManNAc-, ManNFAc- and Me-α-ManNAc-treated cells compared with in non-treated cells, are listed in the right of heatmap (Welch's t-test). Levels of metabolites related to the nicotinamide pathway and the hexosamine synthetic pathway (HBP) (B). *, P<0.05 (Welch's t-test) compared with non-treated neural cells at day 20 (Non, green bar). NAD+/NADH ratio calculated from the metabolome data in hiPSCs and neural differentiated cells (C). (D) Metabolism of ManNAc and its derivatives through the sialic acid synthetic pathway. COS-7 cells were incubated with Lac-Sph-BODIPY (fluorescent glycolipid substrate)-BSA complex and ManNAc, ManNFAc, or 5S-ManNAc. Total lipid extraction was analyzed using Nano LC-MS. Formation of Neu5AcF-Gal-Glc-R was detected by MS. In contrast, the glycolipid containing 5S-Neu5Ac was not detectable.
Collectively, metabolome analysis demonstrated that ManNAc derivatives had a unique metabolome, which was different between the treatments with ManNAc, ManNFAc, and Me-α-ManNAc. Since NAD+ is known as an activator of sirtuins such as SIRT1, the decrease of NAD+ by ManNFAc treatment may contribute to the overall hyperacetylation in the neural cells. Increase of UDP-GlcNAc may be associated with the differentiation from neural progenitor cells into neural cells. However, considering that treatment with OGT inhibitors augmented HCRT expression ( and ), an increase of UDP-GlcNAc should not be favorable for orexin neurogenesis. Therefore, we also have to consider the local regulation of HCRT locus by O-GlcNAcylation.
Metabolism of ManNAc and its derivatives into the sialic acid pathway is not necessary to activate the HCRT gene
In the metabolome analysis by LC-MS, interestingly, Me-α-ManNAc, which did not induce hiON from hiPSCs, stimulated the accumulation of sialic acid (Neu5Ac and CMP-Neu5Ac). In contrast, sialic acid was quite low in cells treated with ManNAc or ManNFAc, which have the ability to induce hiONs (). ManNAc is converted to N-acetylneuraminic acid (Neu5Ac) through ManNAc-6-phosphate by UDP-N-acetylglucosamine 2-epimerase / N-acetylmannosamine kinase (GNE).Citation29 ManNAc has been used as a precursor for sialic acid in other tissues, including the kidney and muscles.Citation29,Citation33 Our data and these previous studies raised the question that sialic acid synthesis pathway may not be critical for ManNAc to induce the hiONs, and metabolism of ManNAc derivatives may provide clues for this question. Therefore, we examined whether ManNAc, ManNFAc, and 5S-ManNAc were incorporated into the sialic acid biosynthesis pathway using a 4,4-difluoro-5,7-dimethyl-4-bora-3a,4a-diaza-s-indacene-3-pentanoyl (BODIPY) assay.Citation34 In each case, a peak corresponding to BODIPY-labeled GM3 was analyzed.
ManNFAc was shown to be incorporated into glycolipids, which led us to observe the formation of NeuAcF-Gal-Glc-R, whose molecular weight is 18 Da larger than that of the control (). In contrast, incubation with 5S-ManNAc did not affect the formation of NeuAc-Gal-Glc-R, indicating that this monosaccharide did not enter the metabolic pathway. Therefore, given that both ManNFAc and 5S-ManNAc are effective in inducing hiONs, the sialic acid biosynthesis pathway is not critical for their activities.
Epigenetic status in orexin neurons derived from hiPSCs
Treatment with Zebeularine or TSA induced expression of the HCRT gene in hiPSCs as well as mESCs (); hence, epigenetic mechanisms must play an important role in the regulation of the expression of the human HCRT gene as observed previously for the mouse Hcrt gene. The sequence of the HCRT/Hcrt gene locus, including several transcription factor binding sites, such as the orexin response element (ORE),Citation35 is well conserved between human and mouse (). Therefore, based on this, we selected the regions around the transcriptional start site (TSS) of the HCRT gene, as shown in the , for epigenetic analysis in undifferentiated hiPSCs and three neural differentiated cell preparations cultured for 20 d.
Figure 5. Epigenetic changes at the HCRT gene locus from hiPSCs to hiONs. (A-C) Epigenetic analysis of the HCRT gene locus around the transcriptional start site (TSS). Genomic sequence of HCRT gene loci around the TSS are conserved in human and mouse (A). The green bar and the brown bar indicate forward and reverse complement alignments, respectively. Dot plots were generated using the YASS programCitation65 with the E-value threshold set at 1 × 10⁻⁸. DNA methylation status of HCRT gene around the TSS in hiPSCs, non-orexin neural cells (non-treat), and hiONs induced by ManNAc or ManNFAc (B). Top. Schematic diagram of the genes. ORE1 indicates orexin regulatory element 1. The vertical lines denote the positions of the cytosine residues of the CpG sites. Bottom. Open and filled squares represent unmethylated and methylated cytosines, respectively. Neural cells at day 20 were derived from hiPSCs by supplementation with 10 μM ManNAc and 1 μM ManNFAc. The red and green letters indicate the levels of DNA methylation (%) at T-DMR-U (red square) and T-DMR-D (green square), respectively. ChIP assays to determine histone acetylation and epigenetic regulators were performed focusing on Regions 1 and 2 (upper diagram in ) (C). ChIP assays for O-GlcNAcylation were performed using the antibody RL2.
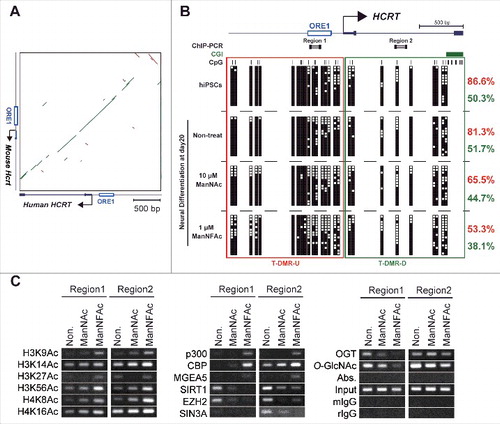
The T-DMRs upstream of the TSS (−1 kb from the TSS: T-DMR-U, Region 1) was heavily methylated in more than 80% in non-HCRT expressing cells (hiPSCs and non-treated neural cells) (). When treated with ManNAc or ManNFAc, methylation levels decreased to 65.5% and 53.3%, respectively. The region downstream of the TSS (+1 kb from the TSS: T-DMR-D, Region 2) was methylated at 40–50% in all cell preparations, and this hypomethylation was observed regardless of ManNAc or ManNFAc treatment (). Therefore, as noted in the miONs,Citation18 demethylation of DNA at T-DMR-U, rather than at T-DMR-D, seems to be an important event in the induction of the hiONs.
In the ManNAc- and ManNFAc-treated cells, the HCRT locus was hyperacetylated on H3 (K9, K14, K27, K56) and H4 (K8, K16) at both the upstream (Region 1) and downstream (Region 2) regions, where histone acetyltransferases p300, CBP, and O-GlcNAcase MGEA5 were located (). In contrast, SIRT1, EZH2, SIN3A, OGT, and O-GlcNAc modifications, which have been identified as epigenetic repressors of the Hcrt locus in mESCs,Citation18 disappeared or decreased in the ManNAc- and ManNFAc-treated cells ().
Collectively, epigenetic shifts, which consist of hypomethylation of DNA and hyperacetylation of histone on the HCRT locus occupied by epigenetic activators, p300, CBP, and MGEA5, occur during orexin neurogenesis by treatment with ManNAc and ManNFAc in human cells, similar to what is observed in miONs.
Hyperglycemic condition in vitro causes chronic repression of the HCRT gene in hiONs
Mouse models for diabetes have decreased numbers of orexin neurons in the lateral hypothalamic area,Citation14,Citation15 suggesting a close relationship between the loss of orexin neurons and metabolic abnormalities. To explore the possibility that hyperglycemia may directly affect human orexin neurons, the hiONs prepared with the ManNFAc treatment (Fig. S3A) were exposed to a high glucose concentration (25 mM) for 12 d, and the HCRT expression was evaluated by RT-qPCR. HCRT expression was maintained until day 6 in a high-glucose regime (). By day 8, however, the HCRT gene expression declined to an undetectable level and did not change thereafter until at least day 12.
Figure 6. Repression of HCRT gene expression in hiONs by hyperglycemia in vitro. (A-J) HCRT gene expression in hyperglycemic condition. hiONs established by treatment with ManNFAc for 20 d were used (see Fig. S3A). HCRT expression was measured during hyperglycemia in vitro for 12 d by RT-qPCR (A). Values were normalized to ACTB expression. Means ± SD (n = 3). Relative values were expressed, with the expression of day 0 equal to 1.0. HCRT expression in hiONs under euglycemic or hyperglycemic conditions for 8 d (days 0–8) (B) or 4 d (days 8–12) (C). On days 0, 8, and 12, the cells were subjected to the TUNEL assay (D). Treatments with ManNAc (10 μM) and ManNFAc (1 μM) in hyperglycemic conditions were effective in maintaining HCRT gene expression during the sensitive phase (E) and in the reactivation during the refractory phase (F). The ManNAc derivatives (5S-ManNAc, 5S-ManNAcF, ManNCOOMe, and ManNCOOEt) were also effective during both phases, but the pharmacological spectrum was different between the phases (G and H). Treatments with EX-527 and BADGP, in hyperglycemic conditions were effective in maintaining HCRT gene expression during the sensitive phase (I). Treatments with TSA (200 nM), but not Zebularine (100 μM), EX-527 and BADGP, were effective in the reactivation of HCRT expression during the refractory phase (J). (K) Summary of pharmacological activities of ManNAc and its derivatives.
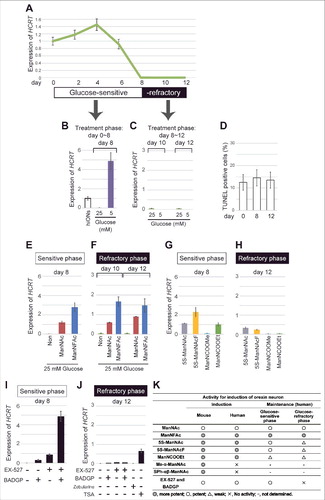
Exposure to a low glucose concentration (5 mM) from the start of the culture (day 0) maintained the HCRT expression at day 8 ( and S3B). However, exposure to a low glucose concentration, starting at day 8, could not induce HCRT expression at day 10 or 12 (), indicating that the hiONs became refractory to the glucose. Day 8 was a transition period in the culture, while days 10–12 were referred to as the refractory phase to extracellular glucose. TUNEL-positive cells were similar at days 0, 8, and 12, and ranged between 12 to 14% (); thereby, a sudden increase of cell death did not occur at refractory phase.
Recovery of HCRT gene expression by ManNAc and its derivatives in the hyperglycemic condition
When hiONs fell into the refractory phase, lowering the glucose level could not reactivate the HCRT gene expression, as indicated in . The development of compounds to overcome hyperglycemia-induced chronic HCRT repression is required to treat patients with diseases related to loss of orexin neurons. Therefore, we tested the ability of candidate compounds, such as ManNAc derivatives, inhibitors of SIRT1, and OGT, by using hiONs in the glucose-sensitive (day 8) and -refractory (day 12) phases. As expected, in the glucose-sensitive phase, ManNAc and ManNFAc stimulated HCRT expression even in the high-glucose condition (). In the glucose-refractory phase (day 10 or 12), ManNAc and ManNFAc could also reactivate the HCRT expression (). Other derivatives (5S-ManNAc, 5S-ManNAcF, ManNCOOMe, and ManNCOOEt), however, showed little to no activity in both glucose-sensitive and -refractory phases ( and ). Therefore, ManNAc derivatives revealed a different pharmacological spectrum in relation to orexin neurogenesis in the refractory phase.
In the refractory phase, only TSA, but not Zebularine, could induce HCRT expression (), suggesting that the silencing is induced by histone hypoacetylation, but not by DNA methylation. Interestingly, EX-527 and BADGP could not induce HCRT expression in the refractory phase, in contrast to the sensitive phase (). From these data, reactivation of the HCRT gene was unique to ManNAc and ManNFAc, a limited member among the active derivatives of ManNAc (). Furthermore, since the inhibitors of SIRT1 and OGT were not effective for the reactivation, the HCRT silencing mechanism must be distinctive between the non-orexin neural cells and the cells under the hyperglycemia-silenced condition.
Epigenetic status of the HCRT gene locus in the hyperglycemic condition
Finally, we investigated the epigenetic status of the HCRT locus during the glucose-sensitive transition period (day 8) and the refractory phase (day 12) in hiONs preparation. Intriguingly, the DNA methylation status at the TSS of the HCRT gene was the same (approximately 30%) in all cell preparations, regardless of glucose concentration (25 mM and 5 mM), both during the transition period and the refractory phase ( and ). This indicates that the HCRT gene is silenced under hypomethylation of the DNA. The result is consistent with the data that Zebularine treatment did not cause the expression at hiONs at the refractory phase (). Again, these data indicate that hyperglycemia-induced HCRT gene silencing must be caused by different mechanisms from that of de novo induction phase of orexin neurogenesis.
Figure 7. Epigenetic status at the HCRT gene locus in hiONs during hyperglycemia-induced damage. (A-D) Epigenetic status in glucose-sensitive and -refractory phases. Cell preparations were the same as those in . The red line indicates the levels of hiONs for comparison (Fig. S3C and S3D). DNA methylation status of the HCRT gene locus by COBRA during glucose-sensitive (day 8) and refractory (day 12) phases (A and B). CpG site for COBRA is located at upstream of TSS (−770 bp from TSS). Levels of O-GlcNAcylation and histone acetylation and the accumulation of epigenetic modulators (MGEA5, SIRT1 and OGT) at the HCRT gene locus during glucose-sensitive and -refractory phases (C and D). Data for ChIP-qPCR are normalized to input DNA. Means ± SD (n = 3).
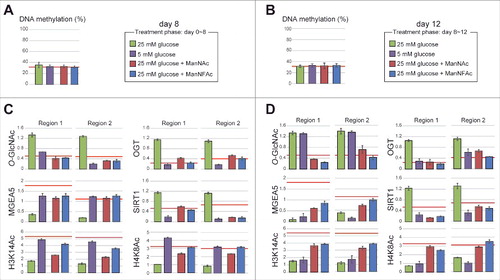
During the glucose-sensitive phase (day 8), the hiONs exposed to a low glucose concentration had hypo-O-GlcNAcylation, low accumulation of OGT and SIRT1, hyperacetylation of histones (H3K14Ac, H4K8Ac), and a higher accumulation of MGEA5 at regions 1 and 2 of the HCRT gene locus (). In contrast, exposure to a low glucose concentration during the glucose-refractory phase (day 12) did not induce hypo-O-GlcNAcylation and hyperacetylation, when the accumulation of OGT and SIRT1 was low (). Therefore, decreasing OGT and SIRT1 was not sufficient to reduce the O-GlcNAcylation levels and increase the histone acetylation levels. These results explain why EX-527 and BADGP did not induce HCRT gene expression during the refractory phase (). ManNAc and ManNFAc induced the accumulation of MGEA5 and led to histone acetylation (H3K14 and H4K16) during the refractory phase (day 12) (), supporting the idea that the accumulation of MGEA5 at the HCRT gene locus is critical for HCRT gene reactivation.
Taken together, these data demonstrated that the chronic hyperglycemic condition induced the epigenetic inactivation by histone hypoacetylation, but not by DNA methylation, at the HCRT locus. Only ManNAc, and its derivative ManNFAc, were effective in epigenetic reactivation consisting of histone hyperacetylation and accumulation of MGEA5 on the HCRT gene in hiONs during the glucose-refractory phase.
Discussion
Hyperglycemia is a risk factor for the persistent phenotypic changes in various neurodegenerative diseases.Citation36,Citation37 In the present study, we found that exposure to chronic conditions of hyperglycemia resulted in HCRT silencing in the hiONs. Silencing at the HCRT locus was long lasting and continued even after a return to low glucose levels. Histone modifications but not DNA methylation were responsible for the HCRT silencing. Intriguingly, ManNAc and its derivative could reactivate HCRT gene expression, whereas the inhibitors of SIRT1 and OGT could not, suggesting that a unique epigenetic status was established by the chronic hyperglycemia condition on the HCRT gene locus.
In hiONs, DNA was hypomethylated and histone H3/H4 was hyperacetylated at the HCRT locus where histone acetyltransferases such as p300, CBP, and MGEA5 were located. In contrast, non-orexin cells were characterized by H3/H4 hypoacetylation, hyper-O-GlcNAcylation, and accumulation of OGT and SIRT1. Consequently, SIRT1 inhibitor (EX-527) and the OGT inhibitors (BADGP, ST078925, and ST045849) augmented HCRT expression. Demethylation of CpGs at the T-DMR was also needed to induce expression of HCRT, similar to the induction of miONs.Citation18 Unexpectedly, re-methylation of DNA did not occur in silenced hiONs by hyperglycemia. Indeed, only TSA, but not Zebularine, could induce HCRT expression during the refractory phase. Therefore, high glucose-induced HCRT gene silencing was associated with histone modifications and epigenetic regulators without DNA re-methylation. Once hiONs were established, DNA hypomethylation status seemed to stabilize. Therefore, the HCRT locus in the hyperglycemic-injured hiONs was referred to as being in a pre-activated state, characterized by DNA hypomethylation and hypoacetylation of the histones. Based on these data, pathologically silenced orexin neurons by hyperglycemia can be distinguished by determining their DNA methylation status from the non-orexin neurons.
ManNAc and ManNFAc treatments had a tendency to decrease GlcNAc monophosphate and UDP-GlcNAc levels in the metabolome analysis. ManNAc can be metabolized by, at least, 2 enzymes, GNE and GlcNAc 2-epimerase (also known as Renin binding protein, RnBP), into ManNAc-6-phosphate and GlcNAc, respectively.Citation38-40 Moreover, treatment of ManNFAc significantly decreased the level of NAD+, which is an activator of sirtuins including SIRT1. These results suggest that ManNAc and its derivatives affect the levels of intercellular UDP-GlcNAc and NAD+, and this modifies the activities of OGT and SIRT1. Although a mechanistic insight for the metabolism of ManNAc and its derivatives remains unclear, these metabolic changes would be reflected in the global epigenetic status, however, the local regulation at the specific gene locus would be more complex.
It was noteworthy that several ManNAc derivatives, such as Me-α-ManNAc and SPh-αβ-ManNAc, had the potency to stimulate orexin neurogenesis only in mouse cells. It is known that the final step of the sialic acid synthesis is species-dependent.Citation41 Humans do not have the CMAH protein, which is an enzyme in the sialic acid pathway that produces Neu5Gc from Neu5Ac. Studies of sialic acid distribution show that Neu5Gc is not detectable in normal human tissues, although it is an abundant sialic acid in other mammals.Citation42,Citation43 The basic epigenetic system for orexin neurogenesis seems to be similar between human and mice; however, species differences in the ManNAc metabolism clearly indicate that human orexin neurons derived from hiPSCs are more suitable than miONs for the analysis of mechanistic insights targeting disorders related to loss of orexin neurons in humans.
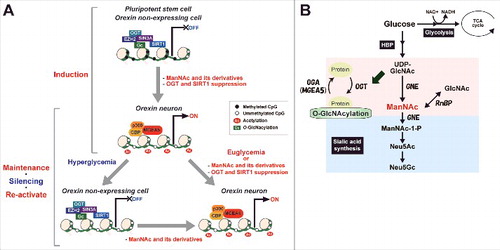
Since we could not analyze isolated hiONs in the present study, the data of epigenetic alteration ( and ) was not specific to the hiONs. However, the alteration is caused by treatment with ManNAc and ManNFAc, which are effective at inducing orexin neurons and reactivating the HCRT genes. Based on the findings in this study, we propose a hypothetical model of ManNAc function on HCRT gene expression during orexin neurogenesis and hyperglycemia-induced silencing ( and ). Since the potent derivative 5S-ManNAc does not enter the sialic acid synthesis pathway, ManNAc does not need to be metabolized into sialic acid to induce the hiONs. ManNAc and its derivatives exert their action by changing the local epigenetic status at the HCRT locus. UDP-GlcNAc is converted into ManNAc by GNE, while ManNAc and GlcNAc are changeable by RnBP. Dynamic change into hyperacetylation of histones and hypo-O-GlcNAcylation occurred by the decreasing of OGT, EZH2, SIN3A, and SIRT1, and increasing of MGEA5, p300, and CBP accumulation during orexin neurogenesis, and HCRT gene expression was reactivated from hyperglycemia-induced silencing by treatment with ManNAc and its derivatives. DNA hypomethylation status was maintained during the glucose-refractory phase. Accumulation of MGEA5 at the HCRT locus seems to be a key event for the pharmacological function of ManNAc and its derivatives in activation and reactivation of the HCRT gene.
Figure 8. Proposed model of changes in epigenetic status before and after establishing hiONs from hiPSCs and epigenetic silencing by hyperglycemia in orexin neurons. (A) Epigenetic status in HCRT expressing and non-expressing cells on HCRT gene locus. (B) Hexosamine biosynthetic pathway (HBP) and sialic acid synthetic pathway. Some glucose is metabolized by the HBP into UDP-GlcNAc, ManNAc, and sialic acid. UDP-GlcNAc is used to modify O-GlcNAc in cells, while sialic acid is essential for extracellular bioactivity. ManNAc is an intermediate of UDP-GlcNAc and is a precursor of sialic acid. ManNFAc, a potent ManNAc derivative, enters the sialic acid biosynthetic pathway, while 5S-ManNAc, another potent derivative, does not.
We recently discovered the O-GlcNAcylation of histone H2A at Ser40 (H2AS40-GlcNAc).Citation23 H2AS40-GlcNAcylation did not occur at the T-DMR of HCRT (data not shown). To date, 14 O-GlcNAcylated sites of core histones have been reported. However, biologic studies on these histone O-GlcNAcylations are limited.Citation44 We need to consider that there are hundreds of O-GlcNAcylated proteins,Citation19,Citation20,Citation22,Citation44 including epigenetic regulators such as SIN3A, EZH2, SIRT1, a component of the transcriptional co-repressor or Polycomb-repressive complex, to determine the targets of O-GlcNAcylation involved in HCRT silencing.
A decrease in the number of orexin neurons have been reported in physiologic and pathological conditions, such as aging, diabetic mellitus, and narcolepsy.Citation14,Citation16,Citation17 Hyperglycemia underlies various neural diseases, including Alzheimer disease, depression, and dementia.Citation45-47 The classical definitions of the identities of specific neuron types rely on anatomic and physiologic features. Recently, particularly in vitro, cell types have been identified by molecular features including gene expression and epigenetic status.Citation26,Citation28 In any case, gene silencing might be recognized as cell loss. There is a phenomenon referred to as metabolic memory, in which prolonged exposure to hyperglycemia predisposes individuals to the development of diabetic complications, such as neuropathy.Citation48 As shown in the present study, gene silencing of HCRT was induced in the hyperglycemic condition, suggesting that there are molecular links between the glucose metabolism and loss of orexin neurons.
Here, we generated functional human orexin neurons from pluripotent stem cells by adding ManNAc and its derivatives providing a potential model for the testing of a therapy for neural disorders. Hyperglycemia in vitro leads to the loss or impairment of orexin neurons through HCRT gene silencing. Importantly, ManNAc and its derivative could reactivate HCRT gene expression. The generation of specific cell types is the first step in establishing cell-transplantation therapies for patients with a loss or impairment of neural cells.Citation49,Citation50 Hypothalamic neurons, including orexin neurons, are generated from the human ESCs and iPSCs.Citation51 In cell therapy, the procedure for the maintenance of cell types is also important after transplantation. Human HCRT neurons continued to express HCRT for at least 18 months after transplantation into normal newborn mouse brain.Citation51 We do not know if the transplanted cells were maintained in the pathological condition. Knowledge of the mechanisms underlying maintenance or damage to cells is also necessary for the prevention or treatment of neurodegenerative diseases.Citation52,Citation53 Our study on the generation of hiONs and reactivation of the HCRT gene from hyperglycemia-induced silencing contributes to the progress of regenerative medicine and drug development for diseases associated with the loss or impairment of orexin neurons.
Materials and methods
Reagents
Reagents without specific references to suppliers were purchased from Wako Pure Chemical (Japan). All primers were prepared by Sigma. The primer sequences are shown in Supplementary Table S2, and the antibodies are listed in Table S3.
The experiments described in the present study were repeated at least 3 times, with similar results obtained in each case. The results shown are representative of all repeated experiments.
Monosaccharides and inhibitors
d-(+)-glucosamine hydrochloride (GlcN), EX-527, and benzyl 2-acetamido-2- deoxy-α-d-galactopyranoside (BADGP) were purchased from Sigma. ST078925 (4-[(3-cyano-4-(2-thienyl)-2–5,6,7,8-tetrahydroquinolylthio)methyl]benzoic acid) and ST045849 (3-(2-adamantanylethyl)-2-[(4-chlorophenyl)azamethylene]-4-oxo-1,3-thiazaperhydroine-6-carboxylic acid) were purchased from TimTec. Zebularine, and trichostatin A were purchased from Wako. N-acetyl-d-glucosamine (GlcNAc), N-acetyl-d-mannosamine (ManNAc), and N-acetylneuraminic acid (Neu5Ac) were purchased from Tokyo Chemical Industry (Japan), Sanyo Fine and Food & Bio Research Center (Japan), respectively.
Neural differentiation from PSCs
The hiPSC line 201B7 was provided by the RIKEN BRC through the National Bio-Resource Project of the MEXT, Japan.Citation54 hiPSCs were maintained on feeder layers of mitomycin C-treated STO/Neo resistant/LIF (SNL) feeder cells in ReproStem medium (ReproCELL, Japan) supplemented with 5 ng/mL bFGF. Neural differentiation using the SDIA+BMP4 methods was performed as described in previous reports.Citation55 We cultured hiPSCs (1.7 × 10³ cells/cm2) on PA6 feeder cells in G-MEM (containing 25 mM glucose) supplemented with 10% KnockOUT serum replacement (Invitrogen), 0.1 mM NEAA, and 0.1 mM β-mercaptoethanol. G-MEM containing 5 mM glucose was purchased from the Cell Science & Technology Institute (Japan). PA6 cells were provided by RIKEN BRC through the National Bio-Resource Project of the MEXT, Japan. The culture medium was changed on day 1, day 4 and every 3 d thereafter. In total, 5 nM BMP4 was added to the medium from day 7. hiONs were prepared according to the culture schedule in Supplementary Fig. S4A. Neural differentiation from mESCs was performed as previously reported.Citation18
RT-PCR and RT-qPCR
Total RNA was isolated from cells and tissues using the Direct-zol RNA MiniPrep Kit (Zymo Research) according to the manufacturer's instructions. First-strand cDNA was synthesized from 2 μg of total RNA, using oligo(dT)20 primers and the SuperScript III First-Strand Synthesis System (Invitrogen). RT-PCR was conducted with LA Taq DNA polymerase (Takara, Japan) using cDNA equivalent to 10 ng of total RNA per reaction, and the reactions were performed by denaturation at 95°C for 3 min and an appropriate number of cycles (Table S2), each consisting of 95°C for 30 sec, 60°C for 30 sec, and 72°C for 15 sec. Each RT-quantitative PCR (qPCR) was performed with cDNA and Thunderbird Sybr qPCR Mix (Toyobo) using the ABI7500 thermal cycler (Applied Biosystems) or LightCycler96 (Roche). RT-qPCR was performed by denaturation at 95°C for 1 min followed by 40 cycles, each consisting of incubation at 95°C for 10 sec and 60°C for 35 sec. Data were normalized to the expression of ACTB and expressed as the means ± standard deviations (SDs) derived from 3 independent PCR reactions.
Immunofluorescence assay
Cells cultured in 4-well dishes were fixed using 4% paraformaldehyde and permeabilized with 0.2% Triton X-100. They were blocked using 5% bovine serum albumin (BSA)/0.1% Tween 20/phosphate-buffered saline for 1 h at room temperature (RT) and incubated with primary antibody overnight at 4 °C. The secondary antibody was added, and the incubation was continued for 1 h at RT. Nuclei were stained using DAPI (1 μg/mL, Dojindo, Japan). The following secondary antibodies were used: donkey anti-goat Alexa Fluor 488, rabbit anti-mouse Alexa Fluor 594, and chicken anti-rabbit Alexa Fluor 594 (1:1,000; Invitrogen). Fluorescence images were acquired using a microscope (BZ-8000; Keyence, Japan). High magnification images were obtained using a laser scanning microscope (LSM700, ZEISS). Immuno- and DAPI-stained cells were counted in at least 20 randomly chosen areas, using ImageJ software (http://rsb.info.nih.gov/ij/). Percentages indicate the mean of the ratio of the OREXIN-A-positive area to that of the DAPI-positive area in 3 independent cultures.
TdT-mediated dUTP nick end labeling (TUNEL) assay
Cells cultured in 4-well dishes were fixed using 4% paraformaldehyde. The TUNEL assay was performed using the MEBSTAIN Apoptosis TUNEL Kit Direct (Medical & Biological Laboratories, Japan) according to the manufacturer's protocol. TUNEL- and DAPI-stained cells were counted in at least 20 randomly chosen areas, using ImageJ software. Percentages indicate the mean of the ratio of TUNEL-positive cells to DAPI-positive cells in 3 independent cultures.
DNA methylation analysis using the bisulfite method
Genomic DNA was extracted from cells as described previously.Citation18 Bisulfite conversion was performed using the EZ DNA Methylation-Gold Kit (Zymo Research). Bisulfite PCR was performed with BIOTAQ HS DNA polymerase (Bioline) and the following thermocycling conditions: denaturation at 95°C for 10 min, 40 cycles each consisting of incubation at 95°C for 30 sec, 60°C for 45 sec and 72°C for 30 sec, and a final extension for 5 min at 72°C. For the combined bisulfite restriction analysis (COBRA), PCR products were digested using HpyCH4IV (New England Biolabs). Restriction enzyme-treated DNA was purified by gel filtration with Sephadex G-5 (GE Healthcare), and concentrations (ng/ml) of cut (derived from methylated DNA) and uncut (derived from unmethylated DNA) fragments were quantified by MultiNA Microchip Electrophoresis (Shimadzu, Japan). Methylation level was calculated as the concentration ratio of the cut fragments to the cut plus the uncut fragments. Data were expressed as the mean ± SD derived from 3 independent PCR reactions. For sequencing, the PCR fragments were cloned into the pGEM-T Easy vector (Promega).
OREXIN-A releasing assay using ELISA
hiPSCs were cultured under the SDIA+BMP4 condition for 20 d in 4-well dishes and were subjected to the following analyses. For the measurement of the neural peptide sensitivity, neural differentiated hiPSCs were incubated in 500 μL of the medium from the SDIA condition supplemented with leptin, ghrelin, TRH, Neuropeptide Y, GABA, and glucose (Sigma) at the appropriate concentrations at 37°C. After 3 h of incubation, the supernatants were collected, and the OREXIN-A concentration was measured using the OREXIN-A Fluorescent EIA Kit (Phoenix Pharmaceuticals) according to the manufacturer's instructions.
ChIP-PCR and ChIP-qPCR
The chromatin immunoprecipitation (ChIP) assay was performed with 1 × 10⁶ cells per assay using the ChIP-IT Express Enzymatic Kit (Active Motif) according to the manufacturer's instructions. Briefly, fixed cells were lysed, and chromatin was sheared by an enzymatic shearing cocktail for 10 min. After immunoprecipitation, the DNA was recovered using an elution buffer (10% SDS, 300 mM NaCl, 10 mM tris-HCl, and 5 mM EDTA, pH 8.0) at 65°C overnight and then collected using the ChIP DNA Clean and Concentrator Kit (Zymo Research). Input (10%), normal IgGs from rabbit and mouse (rIgG and mIgG) and RL2 absorbed with GlcNAc (200 mM) (Abs. in ) were used as the positive and negative controls, respectively. ChIP-qPCR was performed using a high-throughput gene expression platform based on microfluidic dynamic arrays (Fluidigm). DNA obtained by ChIP was pre-amplified using TaqMan PreAmp Master Mix (Applied Biosystems) according to the manufacturer's protocol. Following pre-amplification, the samples were diluted 1:5 in TE buffer (pH 8.0). BioMark 48 × 48 arrays were prepared according to the manufacturer's instructions. Following the loading of the assays and samples into the chip by the IFC controller, PCR was performed with the following conditions: 50°C for 2 min and 95°C for 10 min, followed by 40 cycles of 95°C for 15 sec and 60°C for 60 sec. Data were processed by automatic threshold setting using the same threshold value for all assays and linear baseline correction using BioMark Real-time PCR Analysis software (Fluidigm). Data were normalized to the input DNA and expressed as the mean ± SD derived from 3 independent PCR reactions.
Metabolome
Duplicate samples were washed twice with a 5% solution of mannitol and covered with methanol. Cells were harvested after the addition of the internal standard solution (Human Metabolome Technologies, Japan) and subjected to centrifugation for 5 min at 2,000 × g at 4°C. The aqueous layers were collected in ultrafiltration units (Millipore) and subjected to centrifugation for 2.5 h at 20,000 × g at 4°C. All of the following metabolome analyses were performed by Human Metabolome Technologies.
BODIPY analysis
A Lac-Sph-BODIPY (fluorescent glycolipid substrate)–BSA complex was prepared before the experiments according to a previous report.Citation34 Briefly, COS-7 cells were incubated with 2.5 μM Lac-Sph-BODIPY–BSA complex in DMEM for 5 min at 37°C. The medium was changed to DMEM containing N2 supplement (Invitrogen) and ManNAc derivatives (final concentration of 3 mM), and the cells were incubated for 24 h. The total lipids were extracted from the cells with 20-fold (w/v) chloroform–MeOH (1:2, v/v) by sonication after freeze–thaw. Fluorescent glycolipid metabolites were separated using a Nano Frontier nLC digital nanoflow HPLC system with C18 silica particles [particle size: 3 μm; 75 μm (i.d.) × 150 mm (length)], at 200 nL/min. A gradient conditions: from 0 min, 5% B (acetonitrile) and 95% A (water); from 5 min, 90% B and 10% A; and from 15 min until the end of the run, 100% B. Fluorescence (520 nm) was detected directly by irradiating the excitation light (470 nm) through a collimator using OptiTool FLE1100 Type B at 0.20 sec intervals. A mass spectral analysis of the eluted fluorescent glycolipid was performed using a quadrupole ion trap mass spectrometer (QIT-MS) coupled with a nanoelectrospray interface, amaZon ETD (Bruker Daltonics).
Construction of ManNAc derivatives
The ManNAc derivatives used in this study are listed in Table S1. Ac4ManNAc,Citation56 ManNFAc,Citation57 Me-α-ManNAc,Citation58 SPh-αβ-ManNAc,Citation59 ManNAcF2,Citation60 ManNAcF3,Citation61 5S-ManNAc,Citation62 1-deoxy-ManNAc,Citation63 and ManNCOOMeCitation64 were synthesized as per previous reports. The d-mannosamine hydrochloride used for the synthesis of the ManNAc derivatives was purchased from Sanyo Fine (Japan). Satisfactory NMR spectral data were obtained for all new compounds synthesized in this study.
Synthesis of ManNGlyAcF: N-fluoroacetylglycine N-succinimidyl ester was prepared from glycine by reaction with ethyl fluoroacetate and NaOMe in MeOH followed by reaction with N-hydroxysuccinimide and 1-ethyl-3-(3-dimethylaminopropyl)carbodiimide hydrochloride in DMF. Et3N (2.08 mmol) was added to a mixture of d-mannosamine hydrochloride (0.677 mmol) and N-fluoroacetylglycine N-succinimidyl ester (0.810 mmol) in MeOH at RT. After being stirred for 1.5 h at the same temperature, the reaction mixture was concentrated in vacuo. The residue was purified by column chromatography on silica gel (CHCl3/MeOH = 2/1) and on silica gel (EtOAc/MeOH = 4/1) and by gel permeation column chromatography on LH20 with MeOH to produce ManNGlyAcF (0.358 mmol, 53%).
Synthesis of ManNPrF: To d-mannosamine hydrochloride (2.56 mmol) was added saturated sodium bicarbonate solution and a solution of 3-fluoropropionyl chloride in 1,4-dioxane, which was prepared from thionyl chloride (2.54 mmol) and 3-fluoropropionic acid (1.28 mmol), at 0°C. After being stirred for 1 h at 0°C and for 30 min at RT, the reaction mixture was washed with CHCl3, and the aqueous layer was concentrated in vacuo. The residue was purified by column chromatography on silica gel (CHCl3/MeOH = 4/1) and on ODS (MeCN/H2O = 3/1) to give ManNPrF (0.331 mmol, 26%). An extensive purification was performed by HPLC using a silica gel column (AQUASIL SP100, 20 × 250 mm) with 20% MeOH in CHCl3.
Synthesis of 5S-ManNAcF: A solution of 5S-ManNAc (0.421 mmol) in 2 N HCl was heated at 60°C. After the removal of the solvent in vacuo, 5S-ManNH2·HCl was obtained. To a solution of a crude 5S-ManNH2·HCl in MeOH was consecutively added Et3N (6.74 mmol) and methyl fluoroacetate (8.90 mmol) at 0°C. After being stirred for 24 h at 27°C, the reaction mixture was concentrated in vacuo. The residue was purified by column chromatography on silica gel (CHCl3/MeOH = 2/3) to give 5S-ManNAcF (0.322 mmol, 76%).
Synthesis of ManNCOOEt: Ethyl chloroformate (7.00 mmol) was added to a mixture of d-mannosamine hydrochloride (4.64 mmol) and saturated sodium bicarbonate solution in 1,4-dioxane at 0°C. After being stirred for 50 min at the same temperature, the reaction mixture was concentrated in vacuo. The residue was purified by column chromatography on silica gel (CHCl3/MeOH = 5/1) to give ManNCOOEt (3.23 mmol, 70%). An extensive purification was performed by HPLC using a polymer-based amino column (Shodex Asahipak NH2P-90 20F, 20 × 300 mm) with 75% MeCN in H2O.
Disclosure of potential conflicts of interest
None of the authors have a financial interest related to this work. We have patents related to this work (Patent No. 2015–077228 and 2015–177176).
Author contributions
K.H. and K.S. designed this study. Y.S. and Y.I. constructed the ManNAc derivatives. O.K., A.O., and SD performed the BODIPY analysis. K.H. performed all other experiments. K.H. and K.S. prepared the manuscript.
KEPI_A_1346775_s02.docx
Download MS Word (847.3 KB)Acknowledgments
We thank Dr. Bruce Murphy (Universite de Montreal) for discussions and reading the manuscript and Dr. Hirofumi Dohi (RIKEN) and Dr. Hideharu Seto (RIKEN) for the construction of Me-α-ManNAc, SPh-αβ-ManNAc, 5S-ManNAc and 5S-ManNAcF.
Additional information
Funding
References
- Sakurai T, Amemiya A, Ishii M, Matsuzaki I, Chemelli RM, Tanaka H, Williams SC, Richarson JA, Kozlowski GP, Wilson S, et al. Orexins and orexin receptors: a family of hypothalamic neuropeptides and G protein-coupled receptors that regulate feeding behavior. Cell 1998; 92:573-85, 1 page following 696; PMID:9491897; https://doi.org/10.1016/S0092-8674(00)80949-6
- de Lecea L, Kilduff TS, Peyron C, Gao X, Foye PE, Danielson PE, Fukuhara C, Battenberg EL, Gautvik VT, Bartlett FS, et al. The hypocretins: hypothalamus-specific peptides with neuroexcitatory activity. Proc Natl Acad Sci USA 1998; 95:322-7; PMID:9419374; https://doi.org/10.1073/pnas.95.1.322
- Sakurai T. The role of orexin in motivated behaviours. Nat Rev Neurosci 2014; 15:719-31; PMID:25301357; https://doi.org/10.1038/nrn3837
- Fortuyn HA, Swinkels S, Buitelaar J, Renier WO, Furer JW, Rijnders CA, Hodiamont PP, Overeem S. High prevalence of eating disorders in narcolepsy with cataplexy: a case-control study. Sleep 2008; 31:335-41; PMID:18363309; https://doi.org/10.1093/sleep/31.3.335
- Arnulf I, Leu-Semenescu S. Sleepiness in Parkinson's disease. Parkinsonism Relat Disord 2009; 15 Suppl 3:S101-4; PMID:20082966; https://doi.org/10.1016/S1353-8020(09)70792-8
- Wienecke M, Werth E, Poryazova R, Baumann-Vogel H, Bassetti CL, Weller M, Waldvogel D, Storch A, Baumann CR. Progressive dopamine and hypocretin deficiencies in Parkinson's disease: is there an impact on sleep and wakefulness? J Sleep Res 2012; 21:710-7; PMID:22747735; https://doi.org/10.1111/j.1365-2869.2012.01027.x
- Sakurai T, Mieda M, Tsujino N. The orexin system: roles in sleep/wake regulation. Ann N Y Acad Sci 2010; 1200:149-61; PMID:20633143; https://doi.org/10.1111/j.1749-6632.2010.05513.x
- Nishino S, Okuro M. Emerging treatments for narcolepsy and its related disorders. Expert Opin Emerg Drugs 2010; 15:139-58; PMID:20166851; https://doi.org/10.1517/14728210903559852
- Chow M, Cao M. The hypocretin/orexin system in sleep disorders: preclinical insights and clinical progress. Nat Sci Sleep 2016; 8:81-6; PMID:27051324
- Schuld A, Hebebrand J, Geller F, Pollmächer T. Increased body-mass index in patients with narcolepsy. Lancet 2000; 355:1274-5; PMID:10770327; https://doi.org/10.1016/S0140-6736(05)74704-8
- Poli F, Plazzi G, Di Dalmazi G, Ribichini D, Vicennati V, Pizza F, Mignot E, Montagna P, Pasquali R, Pagotto U. Body mass index-independent metabolic alterations in narcolepsy with cataplexy. Sleep 2009; 32:1491-7; PMID:19928388; https://doi.org/10.1093/sleep/32.11.1491
- Heier MS, Jansson TS, Gautvik KM. Cerebrospinal fluid hypocretin 1 deficiency, overweight, and metabolic dysregulation in patients with narcolepsy. J Clin Sleep Med 2011; 7:653-8; PMID:22171205
- Beitinger PA, Fulda S, Dalal MA, Wehrle R, Keckeis M, Wetter TC, Han F, Pollmächer T, Schuld A. Glucose tolerance in patients with narcolepsy. Sleep 2012; 35:231-6; PMID:22294813; https://doi.org/10.5665/sleep.1628
- Yamamoto Y, Ueta Y, Date Y, Nakazato M, Hara Y, Serino R, Nomura M, Shibuya I, Matsukura S, Yamashita H. Down regulation of the prepro-orexin gene expression in genetically obese mice. Brain Res Mol Brain Res 1999; 65:14-22; PMID:10036303; https://doi.org/10.1016/S0169-328X(98)00320-9
- Yamamoto Y, Ueta Y, Serino R, Nomura M, Shibuya I, Yamashita H. Effects of food restriction on the hypothalamic prepro-orexin gene expression in genetically obese mice. Brain Res Bull 2000; 51:515-21; PMID:10758342; https://doi.org/10.1016/S0361-9230(99)00271-3
- Kessler BA, Stanley EM, Frederick-Duus D, Fadel J. Age-related loss of orexin/hypocretin neurons. Neuroscience 2011; 178:82-8; PMID:21262323; https://doi.org/10.1016/j.neuroscience.2011.01.031
- Hunt NJ, Rodriguez ML, Waters KA, Machaalani R. Changes in orexin (hypocretin) neuronal expression with normal aging in the human hypothalamus. Neurobiol Aging 2015; 36:292-300; PMID:25212464; https://doi.org/10.1016/j.neurobiolaging.2014.08.010
- Hayakawa K, Hirosawa M, Tabei Y, Arai D, Tanaka S, Murakami N, Yagi S, Shiota K. Epigenetic switching by the metabolism-sensing factors in the generation of orexin neurons from mouse embryonic stem cells. J Biol Chem 2013; 288:17099-110; PMID:23625921; https://doi.org/10.1074/jbc.M113.455899
- Hardivillé S, Hart GW. Nutrient regulation of signaling, transcription, and cell physiology by O-GlcNAcylation. Cell Metab 2014; 20:208-13; PMID:25100062; https://doi.org/10.1016/j.cmet.2014.07.014
- Nagel AK, Ball LE. O-GlcNAc transferase and O-GlcNAcase: achieving target substrate specificity. Amino Acids 2014; 46:2305-16; PMID:25173736; https://doi.org/10.1007/s00726-014-1827-7
- Sakabe K, Wang Z, Hart GW. Beta-N-acetylglucosamine (O-GlcNAc) is part of the histone code. Proc Natl Acad Sci USA 2010; 107:19915-20; PMID:21045127; https://doi.org/10.1073/pnas.1009023107
- Hanover JA, Krause MW, Love DC. Bittersweet memories: linking metabolism to epigenetics through O-GlcNAcylation. Nat Rev Mol Cell Biol 2012; 13:312-21; PMID:22522719; https://doi.org/10.1038/nrm3334
- Hirosawa M, Hayakawa K, Yoneda C, Arai D, Shiota H, Suzuki T, Tanaka S, Dohmae N, Shiota K. Novel O-GlcNAcylation on Ser(40) of canonical H2A isoforms specific to viviparity. Sci Rep 2016; 6:31785; PMID:27615797; https://doi.org/10.1038/srep31785
- Shiota K. DNA methylation profiles of CpG islands for cellular differentiation and development in mammals. Cytogenet Genome Res 2004; 105:325-34; PMID:15237220; https://doi.org/10.1159/000078205
- Lieb JD, Beck S, Bulyk ML, Farnham P, Hattori N, Henikoff S, Liu XS, Okumura K, Shiota K, Ushijima T, et al. Applying whole-genome studies of epigenetic regulation to study human disease. Cytogenet Genome Res 2006; 114:1-15; PMID:16717444; https://doi.org/10.1159/000091922
- Shiota K, Kogo Y, Ohgane J, Imamura T, Urano A, Nishino K, Tanaka S, Hattori N. Epigenetic marks by DNA methylation specific to stem, germ and somatic cells in mice. Genes Cells 2002; 7:961-9; PMID:12296826; https://doi.org/10.1046/j.1365-2443.2002.00574.x
- Yagi S, Hirabayashi K, Sato S, Li W, Takahashi Y, Hirakawa T, Wu G, Hattori N, Ohgane J, Tanaka S, et al. DNA methylation profile of tissue-dependent and differentially methylated regions (T-DMRs) in mouse promoter regions demonstrating tissue-specific gene expression. Genome Res 2008; 18:1969-78; PMID:18971312; https://doi.org/10.1101/gr.074070.107
- Ikegami K, Ohgane J, Tanaka S, Yagi S, Shiota K. Interplay between DNA methylation, histone modification and chromatin remodeling in stem cells and during development. Int J Dev Biol 2009; 53:203-14; PMID:19412882; https://doi.org/10.1387/ijdb.082741ki
- Reinke SO, Lehmer G, Hinderlich S, Reutter W. Regulation and pathophysiological implications of UDP-GlcNAc 2-epimerase/ManNAc kinase (GNE) as the key enzyme of sialic acid biosynthesis. Biol Chem 2009; 390:591-9; PMID:19426133; https://doi.org/10.1515/BC.2009.073
- Yamanaka A, Beuckmann CT, Willie JT, Hara J, Tsujino N, Mieda M, Tominaga M, Yagami K, Sugiyama F, Goto K, et al. Hypothalamic orexin neurons regulate arousal according to energy balance in mice. Neuron 2003; 38:701-13; PMID:12797956; https://doi.org/10.1016/S0896-6273(03)00331-3
- Cai XJ, Evans ML, Lister CA, Leslie RA, Arch JR, Wilson S, Williams G. Hypoglycemia activates orexin neurons and selectively increases hypothalamic orexin-B levels: responses inhibited by feeding and possibly mediated by the nucleus of the solitary tract. Diabetes 2001; 50:105-12; PMID:11147774; https://doi.org/10.2337/diabetes.50.1.105
- Tsujino N, Sakurai T. Orexin/hypocretin: a neuropeptide at the interface of sleep, energy homeostasis, and reward system. Pharmacol Rev 2009; 61:162-76; PMID:19549926; https://doi.org/10.1124/pr.109.001321
- Nishino I, Carrillo-Carrasco N, Argov Z. GNE myopathy: current update and future therapy. J Neurol Neurosurg Psychiatry 2015; 86:385-92; PMID:25002140; https://doi.org/10.1136/jnnp-2013-307051
- Ohtake A, Daikoku S, Suzuki K, Ito Y, Kanie O. Analysis of the cellular dynamics of fluorescently tagged glycosphingolipids by using a nanoliquid chromatography-tandem mass spectrometry platform. Anal Chem 2013; 85:8475-82; PMID:23895632; https://doi.org/10.1021/ac401632t
- Tanaka S, Kodama T, Nonaka T, Toyoda H, Arai M, Fukazawa M, Honda Y, Honda M, Mignot E. Transcriptional regulation of the hypocretin/orexin gene by NR6A1. Biochem Biophys Res Commun 2010; 403:178-83; PMID:21056546; https://doi.org/10.1016/j.bbrc.2010.11.001
- Cai D. Neuroinflammation and neurodegeneration in overnutrition-induced diseases. Trends Endocrinol Metab 2013; 24:40-7; PMID:23265946; https://doi.org/10.1016/j.tem.2012.11.003
- Depner CM, Stothard ER, Wright KP. Metabolic consequences of sleep and circadian disorders. Curr Diab Rep 2014; 14:507; PMID:24816752; https://doi.org/10.1007/s11892-014-0507-z
- Maru I, Ohta Y, Murata K, Tsukada Y. Molecular cloning and identification of N-acyl- d-glucosamine 2-epimerase from porcine kidney as a renin-binding protein. J Biol Chem 1996; 271:16294-9; PMID:8663114; https://doi.org/10.1074/jbc.271.27.16294
- Takahashi S, Takahashi K, Kaneko T, Ogasawara H, Shindo S, Kobayashi M. Human renin-binding protein is the enzyme N-acetyl- d-glucosamine 2-epimerase. J Biochem 1999; 125:348-53; PMID:9990133; https://doi.org/10.1093/oxfordjournals.jbchem.a022293
- Reinke SO, Eidenschink C, Jay CM, Hinderlich S. Biochemical characterization of human and murine isoforms of UDP-N-acetylglucosamine 2-epimerase/N-acetylmannosamine kinase (GNE). Glycoconj J 2009; 26:415-22; PMID:18815882; https://doi.org/10.1007/s10719-008-9189-6
- Angata T, Varki A. Chemical diversity in the sialic acids and related alpha-keto acids: an evolutionary perspective. Chem Rev 2002; 102:439-69; PMID:11841250; https://doi.org/10.1021/cr000407m
- Irie A, Koyama S, Kozutsumi Y, Kawasaki T, Suzuki A. The molecular basis for the absence of N-glycolylneuraminic acid in humans. J Biol Chem 1998; 273:15866-71; PMID:9624188; https://doi.org/10.1074/jbc.273.25.15866
- Irie A, Suzuki A. CMP-N-Acetylneuraminic acid hydroxylase is exclusively inactive in humans. Biochem Biophys Res Commun 1998; 248:330-3; PMID:9675135; https://doi.org/10.1006/bbrc.1998.8946
- Gambetta MC, Müller J. A critical perspective of the diverse roles of O-GlcNAc transferase in chromatin. Chromosoma 2015; 124:429-42; PMID:25894967; https://doi.org/10.1007/s00412-015-0513-1
- Barnes DE, Yaffe K. The projected effect of risk factor reduction on Alzheimer's disease prevalence. Lancet Neurol 2011; 10:819-28; PMID:21775213; https://doi.org/10.1016/S1474-4422(11)70072-2
- Ninomiya T. Diabetes mellitus and dementia. Curr Diab Rep 2014; 14:487; PMID:24623199; https://doi.org/10.1007/s11892-014-0487-z
- Bornstein NM, Brainin M, Guekht A, Skoog I, Korczyn AD. Diabetes and the brain: issues and unmet needs. Neurol Sci 2014; 35:995-1001; PMID:24777546; https://doi.org/10.1007/s10072-014-1797-2
- Pirola L, Balcerczyk A, Okabe J, El-Osta A. Epigenetic phenomena linked to diabetic complications. Nat Rev Endocrinol 2010; 6:665-75; PMID:21045787; https://doi.org/10.1038/nrendo.2010.188
- Ahrlund-Richter L, De Luca M, Marshak DR, Munsie M, Veiga A, Rao M. Isolation and production of cells suitable for human therapy: challenges ahead. Cell Stem Cell 2009; 4:20-6; PMID:19058776; https://doi.org/10.1016/j.stem.2008.11.012
- Sandoe J, Eggan K. Opportunities and challenges of pluripotent stem cell neurodegenerative disease models. Nat Neurosci 2013; 16:780-9; PMID:23799470; https://doi.org/10.1038/nn.3425
- Merkle FT, Maroof A, Wataya T, Sasai Y, Studer L, Eggan K, Schier AF. Generation of neuropeptidergic hypothalamic neurons from human pluripotent stem cells. Development 2015; 142:633-43; PMID:25670790; https://doi.org/10.1242/dev.117978
- Kirouac DC, Zandstra PW. The systematic production of cells for cell therapies. Cell Stem Cell 2008; 3:369-81; PMID:18940729; https://doi.org/10.1016/j.stem.2008.09.001
- Teo AK, Wagers AJ, Kulkarni RN. New opportunities: harnessing induced pluripotency for discovery in diabetes and metabolism. Cell Metab 2013; 18:775-91; PMID:24035588; https://doi.org/10.1016/j.cmet.2013.08.010
- Takahashi K, Tanabe K, Ohnuki M, Narita M, Ichisaka T, Tomoda K, Yamanaka S. Induction of pluripotent stem cells from adult human fibroblasts by defined factors. Cell 2007; 131:861-72; PMID:18035408; https://doi.org/10.1016/j.cell.2007.11.019
- Mizuseki K, Sakamoto T, Watanabe K, Muguruma K, Ikeya M, Nishiyama A, Arakawa A, Suemori H, Nakatsuji N, Kawasaki H, et al. Generation of neural crest-derived peripheral neurons and floor plate cells from mouse and primate embryonic stem cells. Proc Natl Acad Sci USA 2003; 100:5828-33; PMID:12724518; https://doi.org/10.1073/pnas.1037282100
- Wong CG, Sung SSJ, Sweeley CC. Analysis and structural characterization of amino sugars by gas-liquid chromatography and mass spectrometry. Methods in Carbohydrate Chemistry (Whistler RL, and BeMiller JN, eds) Vol. VIII; Academic Press:1980:p 55-65
- Fondy TP, Emlich CA. Haloacetamido analogues of 2-amino-2-deoxy-d-mannose. Syntheses and effects on tumor-bearing mice. J Med Chem 1981; 24:848-52; PMID:7277392; https://doi.org/10.1021/jm00139a016
- Beychok S, Ashwell G, Kabat EA. Optical activity and conformation of carbohydrates part III. Preparation and opticalactivity of methyl 2-acetamido-2-deoxy-α- and β-d-mannopyranosides and the corresponding furanosides. Carbohydr Res 1971; 17:19-24; https://doi.org/10.1016/S0008-6215(00)81538-4
- Buskas T, Garegg PJ, Konradsson P, Maloisel JL. Facile preparation of glycosyl donors for oligosaccharide synthesis: 2-azido-2-deoxyhexopyranosyl building blocks. Tetrahedron: Asymmetry 1994; 5:2187-94; https://doi.org/10.1016/S0957-4166(00)86294-1
- Humphrey AJ, Fremann C, Critchley P, Malykh Y, Schauer R, Bugg TDH. Biological properties of N-acyl and N-haloacetyl neuraminic acids: processing by enzymes of sialic acid metabolism, and interaction with influenza virus. Bioorg Med Chem 2002; 10:3175-85; PMID:12150863; https://doi.org/10.1016/S0968-0896(02)00213-4
- Hadfield AF, Mella SL, Sartorelli AC. N-acetyl-d-mannosamine analogues as potential inhibitors of sialic acid biosynthesis. J Pharm Sci 1983; 72:748-51; PMID:6577183; https://doi.org/10.1002/jps.2600720709
- Hasegawa A, Tanahashi E, Hioki Y, Kiso M. Synthesis of 2-acetamido-2-deoxy-5-thio-α-d-mannopyranose. Carbohydr Res 1983; 122:168-173; https://doi.org/10.1016/0008-6215(83)88416-X
- Pravdić N, Fletcher HG. The behavior of 2-acetamido-2-deoxy-d-mannose with isopropenyl acetate in the presence of p-toluenesulfonic acid. I. Isolation and identification of derivatives of 2-amino-d-glucal (2-amino-1,2-dideoxy- d-arabino-hex-1-enopyranose) and of other products. J Org Chem 1967; 32:1806-10; PMID:6047395; https://doi.org/10.1021/jo01281a022
- Angelino NJ, Bernacki RJ, Sharma M, Dodson-Simmons O, Korytnyk W. Versatile intermediates in the selective modification of the amino function of 2-amino-2-deoxy-d-mannopyranose and the 3-position of 2-acetamido-2-deoxy-d-mannose: potential membrane modifiers in neoplastic control. Carbohydr Res 1995; 276:99-115; PMID:8536261; https://doi.org/10.1016/0008-6215(95)00154-L
- Noé L, Kucherov G. YASS: enhancing the sensitivity of DNA similarity search. Nucleic Acids Res 2005; 33:W540-3; PMID:15980530; https://doi.org/10.1093/nar/gki478