
ABSTRACT
Chromosomal abnormalities are detected in 20–30% of patients with chronic myelomonocytic leukemia (CMML) and correlate with prognosis. On the mutation level, disruptive alterations are particularly frequent in chromatin regulatory genes. However, little is known about the consequential alterations in the epigenetic marking of the genome. Here, we report the analysis of genomic DNA methylation patterns of 64 CMML patients and 10 healthy controls, using a DNA methylation microarray focused on promoter regions. Differential methylation analysis between patients and controls allowed us to identify abnormalities in DNA methylation, including hypermethylation of specific genes and large genome regions with aberrant DNA methylation. Unsupervised hierarchical cluster analysis identified two main clusters that associated with the clinical, biological, and genetic features of patients. Group 1 was enriched in patients with adverse clinical and biological characteristics and poorer overall and progression-free survival. In addition, significant differences in DNA methylation were observed between patients with low risk and intermediate/high risk karyotypes and between TET2 mutant and wild type patients. Taken together, our results demonstrate that altered DNA methylation patterns reflect the CMML disease state and allow to identify patient groups with distinct clinical features.
Introduction
Chronic myelomonocytic leukemia (CMML) is a rare clonal hematopoietic malignancy with features from both myelodysplastic syndromes (MDS) and myeloproliferative neoplasms (MPN) [Citation1]. The 2008 World Health Organization (WHO) classification distinguishes two categories (CMML-1 and CMML-2) according to blast percentage in bone marrow (BM) or peripheral blood (PB), while the original French-American-British (FAB) Group distinguishes two disease variants, myelodysplastic and myeloproliferative CMML, based on leukocyte count [MD-CMML (<13 × 109/L) and MP-CMML (>13 × 109/L)) [Citation1,Citation2]. Clinical course in CMML is variable, with a median overall survival (OS) of 20 months and progression to acute myeloid leukemia (AML) in 15–30% of cases [Citation1].
Large scale chromosomal abnormalities are detected in 20–30% of patients at diagnosis and correlate with clinical outcomes [Citation3,Citation4]. Most frequent alterations recur in 3–8% of cases and include trisomy 8 (+8), abnormalities of chromosome 7 (del(7q)/-7), loss of Y chromosome (-Y), or an overall complex karyotype [Citation3,Citation4]. According to the CMML-specific cytogenetic risk classification, proposed by the Spanish Group of MDS, up to 80% of CMML patients fall into the low risk cytogenetic category, characterized by normal karyotype and isolated -Y. Patients with complex karyotype, +8 or del(7q)/-7 are classified into the high risk group, while the intermediate risk category includes all other alterations [Citation3].
Mutations in epigenetic regulatory genes are present in more than 60% of CMML patients and include disruptive mutations in genes regulating DNA methylation, such as in TET2 (50-60%) and DNMT3A (5-10%), and post-translational histone modification, such as in ASXL1 (40-50%) and EZH2 (5-10%) [Citation5–8]. In cancer, there are complex changes in DNA methylation [Citation9]. Frequently, global DNA demethylation is accompanied by the de novo methylation of CpG islands. In particular, hypermethylation of CpG islands overlapping gene promoters has been associated with the transcriptional silencing of tumor suppressor genes (TSG), leading to clonal advantage of the affected cell [Citation10]. DNA methylation has been widely investigated in hematological neoplasms [Citation10–12]. MDS is characterized by local DNA hypermethylation that increases with disease severity [Citation13–15]. In AML, DNA methylation correlates with specific cytogenetic abnormalities [Citation14] and the hypermethylation of specific genes such as CDH1, CDKN2B and DBC1 has been shown to have an impact on the outcome of MDS and AML patients [Citation13–15]. In CMML, hypermethylation of genes such as CDKN2B and TIF1γ has been reported [Citation16,Citation17]. In addition, a signature of DNA methylation was found to predict the response of CMML patients to hypomethylating agents [Citation18]. It is further clear that TET2 mutations correlate with changes in DNA methylation in CMML and other diseases [Citation19–22]. These studies show that DNA methylation plays a role in the pathogenesis of CMML. However, little is known about genome-wide DNA methylation changes and their relevance for disease progression.
In this study, we performed DNA methylation microarrays in 64 CMML patients with the aim to investigate the differences in the methylation profile between CMML patients and healthy controls, as well as to evaluate the possible prognostic impact of DNA methylation abnormalities. In addition, we have explored the differences in DNA methylation between patients with different cytogenetic and molecular features.
Results
Characteristics of CMML patients
A total of 64 patients with CMML were included in the study. Median follow-up of living patients was 36 months (range: 5.7 to 83.3 months). Main clinical and biological characteristics of patients are summarized in . Median age at diagnosis was 71 years and there was a 1.8:1 male:female ratio. According to the FAB criteria [Citation2], 47 (73%) patients were classified as MD-CMML and 17 (27%) as MP-CMML. Considering the 2008 WHO classification [Citation1], 46 (72%) cases corresponded to CMML-1 and 18 (28%) to CMML-2. Progression to AML was observed in 25 (39%) patients. Conventional G-banding cytogenetics (CC) was performed at diagnosis and an informative result was obtained in all but one patient. This patient had no chromosomal abnormalities when analyzed by SNP array (SNP-A). According to the CMML-specific cytogenetic risk stratification [Citation3], most patients (50, 78%) had low risk cytogenetic features: normal karyotype (47) and isolated -Y (3). The rest of cases displayed alterations that corresponded to intermediate (7, 11%) or high risk (7, 11%) groups (). Targeted deep sequencing of 83 myeloid-related genes had been previously performed on a subset of these patients [Citation23]. The following genes were mutated in >10% of analyzed cases: TET2 (34/46, 73%), ASXL1 (26/57, 46%), SRSF2 (21/57, 37%), RUNX1 (13/46, 28%), CBL (8/57, 14%), ZRSR2 (6/46, 13%) and EZH2 (5/46, 11%) ().
Table 1. Main clinical and hematological characteristics of CMML patients at diagnosis (n = 64).
Methylation profiling of CMML
DNA methylation was assessed with the Infinium HumanMethylation450 BeadArray). All samples passed quality control criteria. After preprocessing, a total of 48,186 probes, which overlapped with SNPs (47,007 sites) or corresponded to unreliable measurements (1,179 sites), were removed from further analyses. Unsupervised analysis of the resulting methylation profiles was performed by principal component analysis (PCA), which segregated the malignant samples from the control samples (Supplementary A). Based on methylation data, significant (P<0.01) association between the following clinical traits was observed: CMML-specific prognostic scoring system (CPSS) was associated with FAB subtype, WHO category, cytogenetic features, and AML progression; FAB and WHO classifications were also correlated with AML progression (Supplementary B).
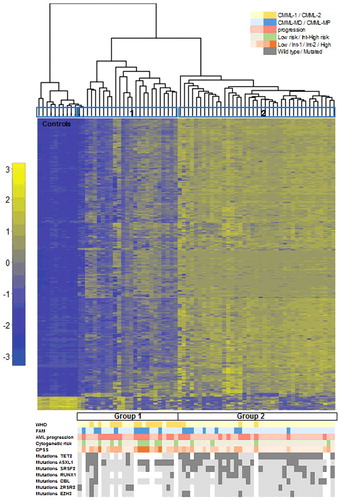
Figure 1. Hierarchical clustering according to DNA methylation in CMML distinguishes two main clusters. Heatmap showing the most variable (>0.4, P < 0.05) differentially methylated probes across the series of CMML patients. Each row represents a single probe and each column corresponds to a separate patient. Each probe has been normalized by the mean β-value in all samples and the color in the heatmap represents the scaled methylation value. Below is represented in color-code the distribution of the clinical features from the patients (WHO classification, FAB classification, AML progression, CPSS risk groups, and cytogenetic features and gene mutations). White gaps represent missing data. AML: acute myeloid leukemia; CPSS: CMML specific prognostic scoring system; FAB: French-American-British; Int: intermediate; WHO: World Health Organization.
Differential methylation between CMML and healthy controls
To identify changes in DNA methylation associated with CMML, we compared the DNA methylation patterns between CMML patients (n = 64) and healthy controls (n = 10) by differential methylation analysis. Differentially methylated probes included 1,844 probes hypermethylated and 255 probes hypomethylated in CMML patients compared to controls (>0.3 methylation difference, P<0.05). Hypermethylated probes affected a total of 1,100 genes and 636 promoter or enhancer regions, while hypomethylated probes affected 165 genes. To investigate whether hypermethylation in CMML patients was associated with specific biological processes, we performed Gene Ontology (GO) analysis of all the hypermethylated genes, but the analysis did not reveal a significant enrichment in any GO term. Differentially methylated blocks (DMBs) analysis across the genome (see Materials and Methods) revealed that aberrant methylation was not distributed randomly across chromosomes. Bin screening using the 10 Mb filter revealed 14 DMBs in which DNA methylation was significantly altered across the whole region (Supplementary Table 1). The region in which DNA methylation showed the highest significant difference, using both 10 Mb and 1 Mb filters, was located in chromosome 5q31.3 and included the protocadherin (PCDH) gene cluster. This cluster, comprising 53 genes and 3 pseudogenes, expands across approximately 1 Mb and contains the three alpha, beta, and gamma PCDH clusters tandemly linked on this region (Supplementary ). Other highly significant DMBs included a region on chromosome 17q24.3-q25.3 that contained genes with several altered sites, such as P4HB, RPTOR, and TBC1D16, as well as a region on chromosome 6p22.1-p21.2, including DAXX, DDAH2, PPP1R18, PRRT1, TNF, TRIM39, and ZBTB12. We also identified several genes (72) aberrantly methylated in CMML patients that play a role in the WNT signaling pathway, including APC2, CDH1, CDH13, CDH23, CREBBP, CSNK1A1, CSNK1D, FBXW11, LRG4, PLCB3, WNT5, and several PCDH genes (Supplementary Table 2). Aberrant DNA methylation was also detected in many genes involved in inflammation mediated by chemokine and cytokine signaling pathways (e.g., CCR1, CCR2, CCR3, CCRL2, CX3XR1, CXCR1, CXCR2, IFNGR2, PIK3D, PRKCZ), PDGF signaling (e.g., ETS1, HRAS, MAPK3, PDGFD, PDGFRB, PIK3CD, PIK3R1, PRKCA, SHC1, SRC), and apoptosis (e.g., BCL2A1, BIRC3, CRADD, DAXX, FADD, TNF, TNFRSF1A, TNFRSF1B, TNFSF10, TRAF2).
Figure 2. Kaplan-Meier survival curves in CMML patients. (A) Overall survival (OS) and progression free survival (PFS) curves according to the two groups identified by hierarchical clustering. (B) OS and PFS curves according to BCL2 DNA methylation levels.
Table 2. Comparison of the main clinical and biological parameters of CMML patients between the two groups identified by hierarchical cluster analysis.
Probes differentially methylated in CMML identify two clusters with clinical relevance
To explore associations among CMML samples, 2-dimensional hierarchical cluster analysis was performed, considering all CMML patients, using the most variable probes that displayed an absolute difference >0.4 (n = 333; P<0.05) between patients and controls (Supplementary Table 3). The analysis revealed 3 main clusters, one with the 10 control samples plus two patients, and then two other clusters with 23 and 39 patients, respectively (). According to this methylation profile, we grouped the patients into two groups and then analyzed the differences between their biological and clinical characteristics (, ). Statistically significant differences were observed in the following parameters between Group 1 (n = 25) and Group 2 (n = 39): age, WHO classification, AML progression, cytogenetic risk groups, hemoglobin (Hb) levels, platelet count, CPSS groups, and SRSF2 mutations (). Group 1 was enriched in patients with advanced disease features, such as CMML-2, presence of anemia or thrombocytopenia, higher risk CPSS groups, and intermediate or high risk karyotypes. Therefore, we performed survival analysis, which revealed significant differences regarding the outcome of the patients in the two groups. Group 1 had an inferior overall survival (OS) and progression-free survival (PFS) compared to Group 2 [median OS of 13 months, confidence interval 95% (CI95%) 10–15, for Group 1 vs. median OS of 55 months, CI95% 13–96, for Group 2, P = 0.014; median PFS of 24 months, CI95% 20–27, for Group 1 vs. median PFS not reached, for Group 2, P = 0.017] (A, Supplementary Table 5). Regarding molecular data, significant differences were observed in the following genes: ZRSR2 mutations were restricted to Group 1, while Group 2 was enriched in patients with mutations in TET2 and SRSF2 genes (, ).
Gene expression and prognostic value of the DNA methylation of specific genes
Due to the fact that assessing genome-wide methylation profiles has a limited applicability in a diagnostic setting, the methylation level of individual selected gene promoters, which, according to previous studies, may play a role in MDS and myeloid-related diseases, was correlated with OS and PFS: CDH1, ETS1, DAXX, FADD, DAPP1, AATK, CYFIP, TP53BP2, and AIM2, which were hypermethylated in CMML samples, and BCL2, which was hypomethylated. Only hypomethylation of BCL2 was predictive of poorer OS and PFS. Patients with demethylation of BCL2 had an inferior OS and PFS compared to patients that displayed BCL2 methylation levels comparable to the ones observed in healthy controls (median OS of 14 months, CI95% 6–21, for hypomethylation vs. median OS of 55 months, IC95% 9–100, for normal methylation, P = 0.002; median PFS of 23 months, CI95% 13–33, for hypomethylation vs. median PFS not reached, for normal methylation, P = 0.001) (B, Supplementary Table 4, Supplementary Table 5). In order to assess if increased or reduced methylation levels of these genes resulted in gene expression changes, we analyzed their expression by RT-PCR in 20 CMML patients and 4 healthy controls (Supplementary Table 6). Regarding hypermethylated genes, gene expression of AATK, AIM2, CYFIP2, DAPP1, and FADD was significantly decreased in patients compared to controls. Conversely, CDH1 was significantly overexpressed in CMML samples, despite being hypermethylated, while no significant changes in gene expression were observed for genes DAXX, ETS1, and TP53BP2. On the other hand, BCL2 hypomethylation did not result in increased expression of the gene.
Multivariate survival analysis
In order to assess the independent prognostic role of DNA methylation data, we performed an adjusted multivariate survival analysis, including also clinical, biological, and genetic features that were statistically significant in the univariate OS and PFS analyses (Supplementary Table 5). None of the variables related to DNA methylation remained significant in these analyses. Independent prognostic variables for OS were MP-CMML FAB subtype/leukocyte count ≥13 × 109/L, hemoglobin level >10 g/dL, and EZH2 mutations; for PFS, hemoglobin level >10 g/dL and presence of splenomegaly (Supplementary Table 6).
Differential methylation in patients with distinct cytogenetic and molecular features
Finally, differential methylation analysis was performed between patients that presented with distinct cytogenetic and molecular features (). The most significant differences were observed between patients with different risk karyotypes and between patients with different mutational status of TET2 and EZH2, so we focused on these comparisons.
Figure 3. Differential methylation between CMML patients displaying distinct molecular and cytogenetic features. The bar plot shows the number of probes differentially methylated (P<0.05) between groups of patients characterized by different molecular features (presence vs. absence of specific gene mutations) and cytogenetic [intermediate/high risk karyotype (IHR-K) vs. low risk karyotype (LR-K)].
![Figure 3. Differential methylation between CMML patients displaying distinct molecular and cytogenetic features. The bar plot shows the number of probes differentially methylated (P<0.05) between groups of patients characterized by different molecular features (presence vs. absence of specific gene mutations) and cytogenetic [intermediate/high risk karyotype (IHR-K) vs. low risk karyotype (LR-K)].](/cms/asset/72c6044c-8601-464e-90e4-27eb9c2fe52f/kepi_a_1405199_f0003_b.gif)
Higher methylation levels were detected in patients with intermediate/high risk karyotype (IHR-K) compared to the low risk karyotype (LR-K) group (Supplementary Figure 3A). A total of 240 and 12 probes were significantly hypermethylated and hypomethylated, respectively, in the group with IHR-K (>0.3 methylation difference, P<0.05). Interestingly, 70% (167/240) of the hypermethylated probes corresponded to CpGs located at promoter or enhancer regions. Overall, 122 different genes were significantly more methylated in patients with IHR-K and only 3 genes were less methylated. The combination of differential methylation analysis and DMBs analysis across the genome allowed us to identify regions and genes with significantly different levels of DNA methylation between these two groups and revealed an enrichment in transcription factor proteins. The region displaying the highest difference between the two groups of patients corresponded to WT1 gene, which was more methylated in patients with IHR-K (Supplementary Figure 4A). Another region identified corresponded to the homeobox HOXB gene cluster, located at chromosome 17q21.32 and consisting of 9 genes (Supplementary Figure 4B). Other hypermethylated transcription factors included PAX8, NR5A2, LMO3, PRDM16, THRB, EVX2, TFAP2B, TFAP2E, PDLIM4, and other homeobox genes (HOXA2, HOXA10, HOXC4, HOXC9, HOXC12, HOXD9, HOXD10).
Then, we focused on the differences between TET2 mutant and wild type patients. Cases with TET2 mutations were characterized by significantly higher methylation levels (Supplementary Figure 3B), with 667 probes hypermethylated and only 9 probes hypomethylated, affecting 518 and 8 genes, respectively (>0.3 methylation difference, P<0.05). GO analysis of the differentially methylated promoter regions revealed a significant enrichment in several GO terms, including immune response, cell activation and multiple hematological processes, such as leukocyte activation, proliferation or migration, monocyte and granulocyte chemotaxis, granulocyte activation, myeloid leukocyte migration, and myeloid leukocyte mediated immunity, among others (Supplementary Table 7). Regarding EZH2, although a high number of probes was differentially methylated between mutant and wild type patients (), these differences were more subtle and only 44 and 46 probes were hyper- and hypo-methylated, respectively, when we applied the same cut-off value (>0.3 methylation difference, P<0.05). In contrast to TET2 mutants and patients with IHR-K, EZH2 mutations were not associated with global higher methylation levels (Supplementary Figure 3C).
Discussion
Cytogenetic abnormalities and recurrent genetic lesions may be insufficient to explain the biological diversity of CMML. The initiation and development of cancer involves both genetic and epigenetic alterations and increasing evidence shows that hypermethylation of genes occurs in myeloid malignancies and potentially contributes to the pathogenesis of these diseases [Citation10]. Nevertheless, the role of DNA methylation in CMML remains unclear and little is known about the relevance of genome-wide methylation changes in the disease progression. In the present study, we performed an integrative genome-wide DNA methylation profile analysis in 64 CMML patients using the Infinium HumanMethylation450 BeadArray that interrogates the DNA methylation status of 450,000 CpGs throughout the genome. It should be noted that, while the Infinium HumanMethylation450 BeadArray used in this and many other studies covered much of the genome, including 99% of RefSeq genes, it is mostly focused on promoter CpG islands and their shores, and thus the effect of CpGs located at promoter-distal and intergenic regulatory regions could not be assessed.
Our results show significant higher levels of DNA methylation in >1,800 CpGs in patients compared to controls. Aberrant DNA methylation of promoters in CMML and MDS has previously been reported in specific genes [Citation16,Citation24–27]. Here, with the use of a wider approach, we found significant and widespread promoter hypermethylation in CMML, which affected 636 regulatory regions, including 296 promoter sites in 244 different genes. As promoter hypermethylation affected many known TSGs, such as BCL2, BRCA2, PRDM2, SEPT9, and VHL, likely reflecting their transcriptional inactivation, it is likely that this contributed to positive selection in neoplastic evolution. The extent of the hypermethylation further suggests that it also includes many passenger alterations, or so called epiphenomenon effect, that are not disease causative [Citation26]. Of note, epigenetic deregulation was not limited to cancer-associated genes but appeared to be a more widespread phenomenon. Aberrant methylation was detected in several genes involved in the WNT signaling pathway, similarly to what has been reported in MDS, secondary AML [Citation26,Citation28], and several solid tumors [Citation29–31]. Among these genes, aberrant methylation of CDH1 has been consistently reported in MDS patients and has been correlated with poor prognosis [Citation15,Citation25,Citation32]. Activation of the WNT signaling pathway has been associated to cancer initiation, and WNT antagonists or inhibitors are known TSGs, suggesting that hypermethylation-induced silencing of these genes may play a role in the pathogenesis or progression of these malignancies [Citation33]. Many genes involved in inflammation mediated by chemokine and cytokine signaling pathways, PDGF signaling and apoptosis were also affected by aberrant DNA methylation, some of which have been described in other myeloid malignancies, such as MDS and AML. Methylation-induced silencing of the apoptotic gene ETS1 was also reported by del Rey et al. in low risk MDS patients [Citation34]. Conversely, del Rey et al. also reported methylation-induced silencing of BCL2 in low risk MDS patients, while in our cohort, BCL2 promoter was methylated in healthy controls and hypomethylated in a subset of CMML patients. In fact, a significant decrease in OS and PFS was observed in this last group. However, we did not observe a significant increase in BCL2 expression in CMML patients compared to controls, suggesting that it may be regulated by other mechanisms. We also detected DNA hypermethylation in several genes previously reported in MDS and AML, including BCL11A, BRCA2, CYFIP2, DAPP1, DAXX, FADD, KLF11, LCK, LRRF1P1, NOTCH4, PDCHB3, PDCHB7, SMPD3, TGFA, TNF, and ZFP161 [Citation13,Citation14,Citation28,Citation35,Citation37]. Furthermore, we observed that hypermethylation of some of these genes (AATK, CYFIP2, DAPP1, FADD) led to a significant decrease in gene expression. All these results suggest that some of these genes may be involved in pathogenic steps that are common across the spectrum of myeloid malignancies and that may be a necessary, but not sufficient, event during the malignant transformation process of hematopoietic cells. However, specific patterns and distributions of epigenetic deregulation may characterize different forms of hematologic malignancies, potentially contributing to the biology of each disease [Citation28]. Identifying targets for altered DNA methylation conserved across all myeloid neoplasms will help in the identification of key drivers of these diseases. The identification of methylation changes in common pathways provides the rationale for testing the inhibition of key signaling components of these pathways for novel therapeutic intervention strategies.
In our study, the effect of DNA hypermethylation was not completely stochastic and certain chromosomal regions presented more hypermethylation than others. Accordingly, it has been shown that DNA hypermethylation can extend over regions of the genome from 100 to >1,000 kb in size and is linked to long-range epigenetic silencing [Citation38]. Identified by DMBs analysis, the region with most significant differences in DNA methylation between patients and controls was located at 5q31.3 and included the PCDH gene family, which is formed by 3 clusters of PCDH genes (α, β, and γ) arranged in tandem that codify for a superfamily of cell adhesion molecules. The expression of PCDH genes by hematopoietic stem cells could play an important role in the hematopoietic niche [Citation39]. The genes within each α and γ cluster share the same last three 3′ exons, while genes in the β cluster are distinct and consist of only one exon [Citation40]. Each PCDH gene in these three gene clusters also has a CpG island promoter. Global methylation silencing of clustered PCDH genes has been previously described in solid tumors [Citation38,Citation41]. Another significant region detected by this analysis was 17q24.3-q25.3. Interestingly, Bullinger et al. identified a CpG island-dense region on 17q25.3 that was predictive of poor outcome in AML patients [Citation13].
Hierarchical cluster analysis of CMML samples using the most variable probes between patients and controls revealed two main clusters: Group 1 and Group 2. Group 1 was enriched in patients with advanced disease features, such as CMML-2, presence of anemia or thrombocytopenia, intermediate/high risk karyotypes and higher risk CPSS groups. Furthermore, patients from Group 1 had an inferior OS and PFS compared to Group 2, although these differences were not statistically significant in the multivariate analyses when clinical, biological, and genetic data were included. These results suggest that DNA methylation alteration has a major impact on the biology of the disease and that these altered patterns of DNA methylation may be an important determinant of the different clinical behavior of CMML patients. Moreover, differences in DNA methylation patterns at diagnosis may be useful biomarkers for prediction of clinical outcome.
The two identified clusters also correlated with cytogenetic and molecular characteristics. Group 2 was enriched in patients with normal karyotype. Correlation between genome-wide DNA methylation patterns and cytogenetic features has also been described in both AML and ALL, although clustering is never absolute [Citation14,Citation42]. Patients with intermediate/high risk karyotypes were characterized by higher levels of DNA methylation, supporting that aberrant methylation is a progressive process that increases in more advanced states of the disease, as previously hypothesized [Citation26]. Another possibility is that aberrant DNA methylation could in some way be triggered by chromosome instability [Citation28]. Comparison between patients with intermediate/high risk karyotypes (IHR-K) vs. low risk karyotypes (LR-K) revealed an abnormal methylation in several transcription factors in the IHR-K group. Both WT1 and its antisense WT1-AS1 were significantly hypermethylated in cases with IHR-K. WT1 can function as an oncogene or a TSG and plays a role in the pathogenesis of several hematological neoplasms [Citation43]. Promoter methylation of WT1 and WT1-AS has been observed in hematological neoplasms and solid tumors [Citation44–47]. Another differentially methylated region was also detected at 17q21.2-q21.33, which includes the HOXB gene cluster that codifies for a family of transcription factors that have been shown to play a role in both myeloid and lymphoid malignancies [Citation48–51].
Regarding molecular data, we found that ZRSR2 mutations were restricted to Group 1, while Group 2 was enriched in patients with mutations in TET2 and SRSF2 genes. This interesting observation is limited by the fact that mutation data was only available for a subset of patients of which more fell into Group 2 than 1. Differences in DNA methylation between patients with different molecular features were also explored. As expected, since TET2 enzyme is involved in the methylation cycle, the highest number of differentially methylated probes was observed between patients with TET2 mutant and wild type cases. Differential methylation analysis revealed higher methylation levels in patients with TET2 mutations, in accordance with previous studies [Citation19,Citation21]. Focusing on specific genes, Yamazaki et al. reported hypermethylation of AIM2 and SP140 promoters in TET2 mutant CMML patients [Citation21], both of which were also highly methylated in TET2 mutant cases in our cohort. Of note, AIM2 hypermethylation correlated with a significant decrease in gene expression. The role of this gene in hematological neoplasms is unknown, but it has been reported that decrease of AIM2 contributes to hepatocellular carcinoma metastasis [Citation51]. Similarly, Pérez et al. detected hypermethylation in these two genes and other 11 genes in TET2 mutant CMML patients, 9 of which were also more methylated in our series (CCIN, CD48, GPR109B, LAX1, MS4A1, NKG7, SLC22A12, TRAF1, and VHL) [Citation52]. Compared to these studies, our genome-wide approach allowed us to identify a total of 518 genes hypermethylated in TET2 patients. Of note, these were enriched in several GO terms related to hematological processes. While we have used a CpG island-focused technique, a recent study has pointed out that TET2 mutations might have a more pronounced effect on DNA methylation outside of CpG islands [Citation20], which we could not assess due to the nature of the technique used in the present study.
In conclusion, our data show that epigenetic lesions are abundant in CMML, suggesting that some driver lesions in CMML could be of epigenetic nature. In addition, the clinical significance of DNA methylation patterns is underlined by the fact that it contributes to identifying groups of patients that share common biological and clinical features. Finally, some of these alterations could be targets for the development of novel therapeutic approaches.
Materials and methods
Patients and samples
A total of 64 patients with CMML and 10 controls (healthy hematopoietic stem cell donors) were included in the study. Patients were diagnosed at the Institut Català d'Oncologia (ICO) following the 2008 WHO criteria [Citation1]. Patients were also classified according to the FAB classification and the prognostic score for each patient was calculated according to the CPSS [Citation2,Citation53]. The study was approved by the ICO-Hospital Germans Trias i Pujol Ethics Committee and an informed consent was obtained from each patient in accordance with the Declaration of Helsinki.
Samples
BM samples from CMML patients were collected at diagnosis in all cases and total BM cells were obtained after erythrocyte lysis. Total cells from CD34+ enriched mobilized PB from 10 healthy donors were obtained. Mobilized CD34+ cells were obtained from PB after donors’ treatment with G-CSF for five days. Genomic DNA was extracted in all cases with QiaAmp DNA Blood Mini kit (Qiagen, Hilden, Germany) and quantified using Quant-iT PicoGreen dsDNA Assay Kit (Invitrogen, CA, USA). Total RNA was extracted from RNA samples in 20 CMML patients and 4 controls using the QiaAmp RNA Blood Mini kit (Qiagen, Hilden, Germany). The purity and quantity of DNA and RNA was evaluated by spectrophotometry, using the Nano Drop 2000 (Thermofisher Scientific, Wilmington, DE).
Cytogenetics
Conventional G-banding cytogenetics was performed on BM samples at diagnosis following standard procedures [Citation3]. Karyotypes were described according to the International System for Human Cytogenetic Nomenclature [Citation54]. In one uninformative case with no metaphases, SNP-A analysis was performed as previously described [Citation55].
Targeted deep sequencing
Targeted deep sequencing of a panel consisting of 83 myeloid-related genes had been previously performed on a subset of patients (n = 46), as previously published [Citation23]. Libraries were prepared and enriched using the Kapa Library Preparation Kit (Kapa Biosystems, MA, USA) and the SeqCap EZ capture chemistry (Nimblegen, Roche, Basel, Switzerland), and then sequenced in an Illumina MiSeq following a 150 bp paired-end reads standard protocol. Sequencing data was analyzed using an in-house bioinformatics pipeline [Citation23]. Briefly, reads were aligned against human genome build 19 (hg19) using BWA 0.7.12. Post-alignment including local indel realignment and base recalibration was performed using the tools in GATK 3.4.46 software package. Packages SAMtools 1.2 and VarScan 2.4.0 were used for variant calling and ANNOVAR for variant annotation. High-probability oncogenic mutations were called by eliminating sequencing and mapping errors and by discarding variants located in highly variable regions or with low coverage (<100x), as well as synonymous variants and polymorphisms described on the available databases.
DNA methylation microarrays
DNA methylation was assessed with the Infinium HumanMethylation450 BeadArray (Illumina, San Diego, CA, USA). First, sodium bisulfite conversion was performed on 1μg of DNA using the EZ DNA Methylation-Gold™ Kit (Zymo Research, Orange, CA, USA) following the manufacturer's protocol. Bisulfite converted DNA was then processed and hybridized to the array according to the manufacturer's recommendations. The HumanMethylation450 DNA Methylation array assesses the methylation status of 485,764 cytosines distributed over the whole genome, which correspond to CpG dinucleotides (99.3%) and CNG targets (0.7%) [Citation56]. According to their associated RNA transcripts, 361,766 CpGs (74.4%) correspond to classic coding messenger RNA genes, 4,168 (0.85%) are linked to non-coding RNAs (microRNAs and long non-coding RNAs) and for 119,830 (24.6%) sites there are no annotated transcripts associated with the described CpG location [Citation56]. Fluorescence signals generated for unmethylated and methylated cytosines were transformed into beta-value (β-value) ratio ranging from 0 (completely unmethylated site) to 1 (completely methylated site). Raw data are available at the Gene Expression Omnibus (GEO) database under the accession number GSE105420. Raw IDAT files from Infinium HumanMethylation450 experiments were imported into RnBeads for DNA methylation analysis, including quality control, data preprocessing and normalization [Citation57]. The methylation β-values were normalized using the BMIQ normalization method [Citation58]. RnBead was used to perform unsupervised principal component analysis (PCA) and to explore associations between traits [Citation57]. Differential methylation analysis was performed to identify hypermethylated and hypomethylated probes between the compared groups. Aberrant methylation was defined as a mean absolute difference >0.3 (adjusted P<0.05) between the average β-values of the two groups, for each specific site. To calculate DMBs, for each comparison, the genome was divided in bins (0.1, 1, 10 Mb). For each bin, a score was calculated dividing the probes differentially methylated (we set the cut-off for the differential methylation using all the probes that showed an adjusted P≤0.01 and an absolute differential methylation >0.1), with the total probes present in the bin and then multiplied for the probes differentially methylated. The bins with the higher rank, that showed a score belonging at the higher 5% of the calculated scores, were further investigated. Hierarchical clustering was performed using the function hclust, with default parameters, from the Bioconductor Heat Plus package v.2.22. All statistical analyses were performed using RnBeads package version 1.8.0. Post-statistical analyses were done using in-house R scripts.
Gene expression analysis
A total of 150 ng of RNA were retrotranscribed using the Reverse Transcription Master Mix and cDNA products were pre-amplified with the PreAmp Master Mix (Fluidigm Co., San Francisco, CA, USA). In all cases protocols supplied by the manufacturer were followed. DELTAgene® assays (Fluidigm Co.) were designed for 10 selected genes (CDH1, BCL2, ETS1, DAXX, MFADD, DAPP1, AATK, CYFIP, TP53BP2, and AIM2) plus two housekeeping genes (GAPBH and GUSB) (Supplementary Table 8). Gene expression was assessed by Real-Time PCR using the microfluidic system Biomark HD and the FLEXsix™ Gene Expression IFCs, following the manufacturer's recommendations (Fluidigm Co.). Each measurement was performed in triplicate. The relative expression levels between CMML patients and healthy controls, normalized to GAPDH housekeeping gene, was determined using the 2−ΔΔCt method [Citation59].
Statistical and survival analyses
Baseline demographic and clinical–biological characteristics were described as median and range for continuous variables, while frequency and percentage were used for categorical variables. Comparisons of variables between patient subsets were performed by χ2, Fisher's exact or Mann-Whitney U test, as appropriate. OS was defined as time from diagnosis to the last follow-up or death from any cause, while PFS was defined as time from diagnosis to progression to AML (presence of >20% of blasts in BM or PB) or death from CMML. Survival curves were calculated using the Kaplan-Meier method and log-rank test was used for comparisons between groups. Where disease-modifying treatment was administered, duration of follow-up was censored at the time of starting disease-modifying treatment (specifically, allogeneic stem cell transplantation, aggressive chemotherapy, or hypomethylating agents). Multivariate analysis was performed using Cox proportional-hazards regression model, considering Wald Backward as selection method. Two-sided P values<0.05 were considered as statistically significant. The statistical package SPSS, version 23.0 (SPSS Inc., Chicago, IL, USA) was used for all analyses.
Disclosure of potential conflicts of interest
The authors have no potential conflicts of interest to disclose.
Sup-mat-DNA_methylation_profile_in_chronic_myelomonocytic.docx
Download MS Word (1.4 MB)Acknowledgements
The authors would like to thank Lauro Sumoy, Gabriel Rech, Sílvia Marcé and Diana Domínguez for their technical assistance.
Additional information
Funding
References
- Swerdlow SH, Campo E, Harris NL, et al. WHO classification of tumours of haematopoietic and lymphoid tissues. Lyon (France): IARC; 2008.
- Bennett JM, Catovsky D, Daniel MT, et al. Proposals for the classification of the myelodysplastic syndromes. Br J Haematol. 1982;51(2):189–199. doi:10.1111/j.1365-2141.1982.tb08475.x. PMID:6952920
- Such E, Cervera J, Costa D, et al. Cytogenetic risk stratification in chronic myelomonocytic leukemia. Haematologica. 2011;96(3):375–383. doi:10.3324/haematol.2010.030957. PMID:21109693
- Wassie EA, Itzykson R, Lasho TL, et al. Molecular and prognostic correlates of cytogenetic abnormalities in chronic myelomonocytic leukemia: a Mayo Clinic-French Consortium Study. Am J Hematol. 2014;89(12):1111–1115. doi:10.1002/ajh.23846. PMID:25195656
- Gelsi-Boyer V, Trouplin V, Adélaïde J, et al. Mutations of polycomb-associated gene ASXL1 in myelodysplastic syndromes and chronic myelomonocytic leukaemia. Br J Haematol. 2009;145(6):788–800. doi:10.1111/j.1365-2141.2009.07697.x. PMID:19388938
- Kosmider O, Gelsi-Boyer V, Ciudad M, et al. TET2 gene mutation is a frequent and adverse event in chronic myelomonocytic leukemia. Haematologica. 2009;94(12):1676–1681. doi:10.3324/haematol.2009.011205. PMID:19797729
- Itzykson R, Kosmider O, Renneville A, et al. Prognostic score including gene mutations in chronic myelomonocytic leukemia. J Clin Oncol Off J Am Soc Clin Oncol. 2013;31(19):2428–2436. doi:10.1200/JCO.2012.47.3314.
- Elena C, Gallì A, Such E, et al. Integrating clinical features and genetic lesions in the risk assessment of patients with chronic myelomonocytic leukemia. Blood. 2016;128(10):1408–1417. doi:10.1182/blood-2016-05-714030. PMID:27385790
- Issa J-P. Epigenetic changes in the myelodysplastic syndrome. Hematol Oncol Clin North Am. 2010;24(2):317–330. doi:10.1016/j.hoc.2010.02.007. PMID:20359628
- Boultwood J, Wainscoat JS. Gene silencing by DNA methylation in haematological malignancies. Br J Haematol. 2007;138(1):3–11. doi:10.1111/j.1365-2141.2007.06604.x. PMID:17489980
- Lehmann U, Brakensiek K, Kreipe H. Role of epigenetic changes in hematological malignancies. Ann Hematol. 2004;83(3):137–152. doi:10.1007/s00277-003-0798-7. PMID:15064862
- Galm O, Herman JG, Baylin SB. The fundamental role of epigenetics in hematopoietic malignancies. Blood Rev. 2006;20(1):1–13. doi:10.1016/j.blre.2005.01.006. PMID:16426940
- Bullinger L, Ehrich M, Döhner K, et al. Quantitative DNA methylation predicts survival in adult acute myeloid leukemia. Blood. 2010;115(3):636–642. doi:10.1182/blood-2009-03-211003. PMID:19903898
- Figueroa ME, Lugthart S, Li Y, et al. DNA methylation signatures identify biologically distinct subtypes in acute myeloid leukemia. Cancer Cell. 2010;17(1):13–27. doi:10.1016/j.ccr.2009.11.020. PMID:20060365
- Shen L, Kantarjian H, Guo Y, et al. DNA methylation predicts survival and response to therapy in patients with myelodysplastic syndromes. J Clin Oncol Off J Am Soc Clin Oncol. 2010;28(4):605–613. doi:10.1200/JCO.2009.23.4781.
- Tessema M, Länger F, Dingemann J, et al. Aberrant methylation and impaired expression of the p15(INK4b) cell cycle regulatory gene in chronic myelomonocytic leukemia (CMML). Leukemia. 2003;17(5):910–918. doi:10.1038/sj.leu.2402891. PMID:12750705
- Aucagne R, Droin N, Paggetti J, et al. Transcription intermediary factor 1γ is a tumor suppressor in mouse and human chronic myelomonocytic leukemia. J Clin Invest. 2011;121(6):2361–2370. doi:10.1172/JCI45213. PMID:21537084
- Meldi K, Qin T, Buchi F, et al. Specific molecular signatures predict decitabine response in chronic myelomonocytic leukemia. J Clin Invest. 2015;125(5):1857–1872. doi:10.1172/JCI78752. PMID:25822018
- Ko M, Huang Y, Jankowska AM, et al. Impaired hydroxylation of 5-methylcytosine in myeloid cancers with mutant TET2. Nature. 2010;468(7325):839–843. doi:10.1038/nature09586. PMID:21057493
- Yamazaki J, Jelinek J, Lu Y, et al. TET2 mutations affect Non-CpG Island DNA methylation at enhancers and transcription factor-binding sites in chronic myelomonocytic leukemia. Cancer Res. 2015;75(14):2833–2843. doi:10.1158/0008-5472.CAN-14-0739. PMID:25972343
- Yamazaki J, Taby R, Vasanthakumar A, et al. Effects of TET2 mutations on DNA methylation in chronic myelomonocytic leukemia. Epigenetics. 2012;7(2):201–207. doi:10.4161/epi.7.2.19015. PMID:22395470
- Diesch J, Zwick A, Garz A-K, et al. A clinical-molecular update on azanucleoside-based therapy for the treatment of hematologic cancers. Clin Epigenetics. 2016;8:71. doi:10.1186/s13148-016-0237-y. PMID:27330573
- Palomo L, Garcia O, Arnan M, et al. Targeted deep sequencing improves outcome stratification in chronic myelomonocytic leukemia with low risk cytogenetic features. Oncotarget. 2016;7(35):5702–57035. doi:10.18632/oncotarget.10937 PMID:27486981.
- Brakensiek K, Länger F, Schlegelberger B, et al. Hypermethylation of the suppressor of cytokine signalling-1 (SOCS-1) in myelodysplastic syndrome. Br J Haematol. 2005;130(2):209–217. doi:10.1111/j.1365-2141.2005.05590.x. PMID:16029449
- Aggerholm A, Holm MS, Guldberg P, et al. Promoter hypermethylation of p15INK4B, HIC1, CDH1, and ER is frequent in myelodysplastic syndrome and predicts poor prognosis in early-stage patients. Eur J Haematol. 2006;76(1):23–32. doi:10.1111/j.1600-0609.2005.00559.x. PMID:16343268
- Jiang Y, Dunbar A, Gondek LP, et al. Aberrant DNA methylation is a dominant mechanism in MDS progression to AML. Blood. 2009;113(6):1315–1325. doi:10.1182/blood-2008-06-163246. PMID:18832655
- Braun T, Itzykson R, Renneville A, et al. Molecular predictors of response to decitabine in advanced chronic myelomonocytic leukemia: a phase 2 trial. Blood. 2011;118(14):3824–3831. doi:10.1182/blood-2011-05-352039. PMID:21828134
- Figueroa ME, Skrabanek L, Li Y, et al. MDS and secondary AML display unique patterns and abundance of aberrant DNA methylation. Blood. 2009;114(16):3448–3458. doi:10.1182/blood-2009-01-200519. PMID:19652201
- Yu J, Tao Q, Cheng YY, et al. Promoter methylation of the Wnt/beta-catenin signaling antagonist Dkk-3 is associated with poor survival in gastric cancer. Cancer. 2009;115(1):49–60. doi:10.1002/cncr.23989. PMID:19051296
- Li J, Huang KL, Zhang T, et al. Pan-cancer methylation and expression profiling of adenocarcinomas revealed epigenetic silencing in the WNT signaling pathway. Neoplasma. 2016;63(2):208–214. doi:10.4149/205_150601N306. PMID:26774141
- Liu S, Chen X, Chen R, et al. Diagnostic role of Wnt pathway gene promoter methylation in non small cell lung cancer. Oncotarget. 2017;8(22):36354–36367. doi:10.18632/oncotarget.16754. PMID:PMC5482660
- Grövdal M, Karimi M, Khan R, et al. Maintenance treatment with azacytidine for patients with high-risk myelodysplastic syndromes (MDS) or acute myeloid leukaemia following MDS in complete remission after induction chemotherapy. Br J Haematol. 2010;150(3):293–302. doi:10.1111/j.1365-2141.2010.08235.x. PMID:20497178
- Reya T, Clevers H. Wnt signalling in stem cells and cancer. Nature. 2005;434(7035):843–850. doi:10.1038/nature03319. PMID:15829953
- Del Rey M, O'Hagan K, Dellett M, et al. Genome-wide profiling of methylation identifies novel targets with aberrant hypermethylation and reduced expression in low-risk myelodysplastic syndromes. Leukemia. 2013;27(3):610–618. doi:10.1038/leu.2012.253. PMID:22936014
- Potapova A, Hasemeier B, Römermann D, et al. Epigenetic inactivation of tumour suppressor gene KLF11 in myelodysplastic syndromes*. Eur J Haematol. 2010;84(4):298–303. doi:10.1111/j.1600-0609.2009.01389.x. PMID:20002157
- Zhao X, Yang F, Li S, et al. CpG island methylator phenotype of myelodysplastic syndrome identified through genome-wide profiling of DNA methylation and gene expression. Br J Haematol. 2014;165(5):649–658. doi:10.1111/bjh.12811. PMID:24601943
- Novak P, Jensen T, Oshiro MM, et al. Agglomerative epigenetic aberrations are a common event in human breast cancer. Cancer Res. 2008;68(20):8616–8625. doi:10.1158/0008-5472.CAN-08-1419. PMID:18922938
- Halbleib JM, Nelson WJ. Cadherins in development: cell adhesion, sorting, and tissue morphogenesis. Genes Dev. 2006;20(23):3199–3214. doi:10.1101/gad.1486806. PMID:17158740
- Wu Q, Maniatis T. A striking organization of a large family of human neural cadherin-like cell adhesion genes. Cell. 1999;97(6):779–790. doi:10.1016/S0092-8674(00)80789-8. PMID:10380929
- Wang K-H, Lin C-J, Liu C-J, et al. Global methylation silencing of clustered proto-cadherin genes in cervical cancer: serving as diagnostic markers comparable to HPV. Cancer Med. 2015;4(1):43–55. doi:10.1002/cam4.335. PMID:25418975
- Milani L, Lundmark A, Kiialainen A, et al. DNA methylation for subtype classification and prediction of treatment outcome in patients with childhood acute lymphoblastic leukemia. Blood. 2010;115(6):1214–1225. doi:10.1182/blood-2009-04-214668. PMID:19965625
- Yang L, Han Y, Suarez Saiz F, et al. A tumor suppressor and oncogene: the WT1 story. Leukemia. 2007;21(5):868–876. doi:10.1038/sj.leu.2404624. PMID:17361230
- Cosialls AM, Santidrián AF, Coll-Mulet L, et al. Epigenetic profile in chronic lymphocytic leukemia using methylation-specific multiplex ligation-dependent probe amplification. Epigenomics. 2012;4(5):491–501. doi:10.2217/epi.12.40. PMID:23130831
- Magnani G, Furlan D, Sahnane N, et al. Molecular features and methylation status in early onset (≤40 Years) colorectal cancer: A population based, Case-control study. Gastroenterol Res Pract. 2015;2015:132190. doi:10.1155/2015/132190. PMID:26557847
- Stirzaker C, Zotenko E, Song JZ, et al. Methylome sequencing in triple-negative breast cancer reveals distinct methylation clusters with prognostic value. Nat Commun. 2015;6:5899. doi:10.1038/ncomms6899. PMID:25641231
- Mžik M, Chmelařová M, John S, et al. Aberrant methylation of tumour suppressor genes WT1, GATA5 and PAX5 in hepatocellular carcinoma. Clin Chem Lab Med. 2016;54(12):1971–1980. doi:10.1515/cclm-2015-1198. PMID:27171388
- Strathdee G, Holyoake TL, Sim A, et al. Inactivation of HOXA genes by hypermethylation in myeloid and lymphoid malignancy is frequent and associated with poor prognosis. Clin Cancer Res Off J Am Assoc Cancer Res. 2007;13(17):5048–5055. doi:10.1158/1078-0432.CCR-07-0919.
- Jost E, Lin Q, Weidner CI, et al. Epimutations mimic genomic mutations of DNMT3A in acute myeloid leukemia. Leukemia. 2014;28(6):1227–1234. doi:10.1038/leu.2013.362. PMID:24280869
- Qu X, Davison J, Du L, et al. Identification of differentially methylated markers among cytogenetic risk groups of acute myeloid leukemia. Epigenetics. 2015;10(6):526–535. doi:10.1080/15592294.2015.1048060. PMID:25996682
- Spencer DH, Young MA, Lamprecht TL, et al. Epigenomic analysis of the HOX gene loci reveals mechanisms that may control canonical expression patterns in AML and normal hematopoietic cells. Leukemia. 2015;29(6):1279–1289. doi:10.1038/leu.2015.6. PMID:25600023
- Chen S-L, Liu L-L, Lu S-X, et al. HBx-mediated decrease of AIM2 contributes to hepatocellular carcinoma metastasis. Mol Oncol. 2017;11(9):1225–1240. doi:10.1002/1878-0261.12090. PMID:28580773
- Pérez C, Martínez-Calle N, Martín-Subero JI, et al. TET2 mutations are associated with specific 5-methylcytosine and 5-hydroxymethylcytosine profiles in patients with chronic myelomonocytic leukemia. PloS One. 2012;7(2):e31605. doi:10.1371/journal.pone.0031605. PMID:22328940
- Such E, Germing U, Malcovati L, et al. Development and validation of a prognostic scoring system for patients with chronic myelomonocytic leukemia. Blood. 2013;121(15):3005–3015. doi:10.1182/blood-2012-08-452938. PMID:23372164
- Shaffer LG, McGowan-Jordan J, Schmid M. ISCN2013: An international system for human cytogenetic nomenclature. Basel (Switzerland): Karger; 2013.
- Palomo L, Xicoy B, Garcia O, et al. Impact of SNP array karyotyping on the diagnosis and the outcome of chronic myelomonocytic leukemia with low risk cytogenetic features or no metaphases: SNP-a karyotyping impact on the diagnosis and outcome of patients with chronic myelomonocytic leukemia. Am J Hematol. 2016;91(2):185–192. doi:10.1002/ajh.24227. PMID:26509444
- Sandoval J, Heyn H, Moran S, et al. Validation of a DNA methylation microarray for 450,000 CpG sites in the human genome. Epigenetics. 2011;6(6):692–702. doi:10.4161/epi.6.6.16196. PMID:21593595
- Assenov Y, Müller F, Lutsik P, et al. Comprehensive analysis of DNA methylation data with RnBeads. Nat Methods. 2014;11(11):1138–1140. doi:10.1038/nmeth.3115. PMID:25262207
- Ma Z, Teschendorff AE. A variational Bayes beta mixture model for feature selection in DNA methylation studies. J Bioinform Comput Biol. 2013;11(4):1350005. doi:10.1142/S0219720013500054. PMID:23859269
- Schmittgen TD, Livak KJ. Analyzing real-time PCR data by the comparative C(T) method. Nat Protoc. 2008;3(6):1101–1108. doi:10.1038/nprot.2008.73. PMID:18546601