
ABSTRACT
Patterns of DNA methylation, an important epigenetic modification involved in gene silencing and development, are disrupted in cancer cells. Understanding the functional significance of aberrant methylation in tumors remains challenging, due in part to the lack of suitable tools to actively modify methylation patterns. DNA demethylation caused by mammalian DNA methyltransferase inhibitors is transient and replication-dependent, whereas that induced by TET enzymes involves oxidized 5mC derivatives that perform poorly understood regulatory functions. Unlike animals, plants possess enzymes that directly excise unoxidized 5mC from DNA, allowing restoration of unmethylated C through base excision repair. Here, we show that expression of Arabidopsis 5mC DNA glycosylase DEMETER (DME) in colon cancer cells demethylates and reactivates hypermethylated silenced loci. Interestingly, DME expression causes genome-wide changes that include both DNA methylation losses and gains, and partially restores the methylation pattern observed in normal tissue. Furthermore, such methylome reprogramming is accompanied by altered cell cycle responses and increased sensibility to anti-tumor drugs, decreased ability to form colonospheres, and tumor growth impairment in vivo. Our study shows that it is possible to reprogram a human cancer DNA methylome by expression of a plant DNA demethylase.
Introduction
DNA methylation at the C5 position of cytosine (5-methylcytosine, 5mC) is an epigenetic mark with important roles in embryonic development, X-chromosome inactivation, imprinting, and control of transposon activity [Citation1,Citation2]. Altered methylation patterns are common in a growing number of human diseases, including disorders of the immune system [Citation3] and cancer [Citation4]. Tumor cells display local hypermethylation of gene promoters and global hypomethylation of gene-poor regions and repetitive sequences [Citation5]. It has been proposed that the former leads to transcriptional silencing of tumor suppressor genes, whereas the latter contributes to genome instability [Citation6,Citation7]. However, elucidation of the functional significance of aberrant DNA methylation in cancer and its causal relationship to tumorigenesis remains difficult, due in part to the lack of appropriate tools to actively modify methylation patterns in human cells.
DNA hypermethylation in cancer cells may be reversed by DNA methyltransferase inhibitors, such 5-aza-2′-deoxycytidine (5-azaCdR), that cause passive genome-wide DNA demethylation and have antitumoral properties in vivo [Citation8]. However, demethylation is followed by re-methylation after drug withdrawal [Citation9], which limits their usefulness for functional studies. An alternative option is the use of enzymes involved in DNA demethylation. The ten-eleven translocation (TET) proteins TET1, TET2, and TET3 are alpha-ketoglutarate-dependent dioxygenases that catalyze conversion of 5mC to 5-hydroxymethylcytosine (5hmC), 5-formylcytosine (5fC), and 5-carboxylcytosine (5caC) by consecutive oxidation reactions [Citation10,Citation11]. TET proteins have been proposed as promising candidates for mediating DNA demethylation in mammalian cells either via passive dilution, since 5hmC prevents maintenance DNA methylation, or in an active pathway, because 5fC and 5caC are substrates of the thymine DNA glycosylase (TDG) that initiates a base excision repair (BER) that would replace them with unmethylated cytosines [Citation12–14]. However, some oxidized derivatives of 5mC have been found to be stable and recognized by specific readers [Citation15], and accumulating evidence suggests that they perform specific regulatory functions [Citation16,Citation17]. Therefore, the use of TET proteins for functional studies on the role of aberrant DNA methylation in cancer remains problematic.
DNA demethylation mechanisms have independently evolved in plants and animals. In plants, a family of 5mC DNA glycosylases directly excise unoxidized 5mC, initiating restoration of unmethylated C through BER [Citation18–20]. These enzymes, with no counterparts in animal cells, are typified by Arabidopsis thaliana DEMETER (DME) and its paralogs REPRESSOR OF SILENCING 1 (ROS1) and DEMETER-LIKE 2 and 3 (DML2 and DML3) [Citation20–23]. We have recently shown that a fusion protein containing the catalytic domain of ROS1 and the DNA binding domain of yeast GAL4 specifically demethylates and reactivates a methylation-silenced reporter gene in human cells [Citation24]. Here, we show that overexpression of DME in human colorectal cancer (CRC) DLD-1 cells causes genome-wide DNA methylation changes, including both gains and losses, that partially revert aberrant methylation to normal levels. Furthermore, the DNA methylome reprogramming induced by DME is accompanied by altered cell-cycle responses and enhanced sensitivity to chemotherapeutic agents in vitro and reduced tumorigenesis in vivo.
Results
Expression of DME in DLD-1 cells demethylates and reactivates hypermethylated silenced loci
We stably transfected DLD-1 cells with the pcDNA3.1 vector either containing a wild type DME cDNA or a mutant version (D1562A) encoding a catalytically inactive enzyme [Citation20]. Following transfection, G418-resistant transfectants were selected. Stable transfectants containing the empty vector were also obtained. DME expression was detected by RT-PCR and protein expression was confirmed by western blot using nuclear extracts (Fig. S1).
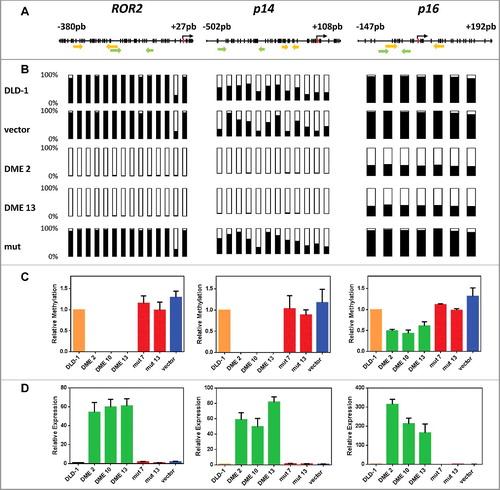
We first used bisulfite pyrosequencing and bisulfite sequencing of multiple clones to examine the methylation status of three loci reported to be hypermethylated in DLD-1 cells: ROR2 [Citation25], p14 [Citation26], and p16 [Citation27]. Bisulfite pyrosequencing revealed that methylation at promoters of ROR2 and p14 in cells expressing active DME was reduced to nearly undetectable levels, whereas demethylation of the p16 promoter was about 50 percent (A-B). Bisulfite sequencing of multiple clones confirmed that hypermethylation of ROR2 promoter was virtually abolished by DME expression, and that demethylation at p14 and p16 was partially extended to gene body regions (Fig. S2). We next tested whether DNA demethylation was accompanied by gene reactivation. We re-analyzed the methylation status of ROR2, p14, and p16 by quantitative methylation-specific PCR (qMSP) analysis and, in parallel, we measured their expression levels by quantitative RT-PCR (qRT-PCR). The three genes were reactivated in cells expressing DME, but not in non-transfected cells or in control transfectants with the mutant version or the empty vector (C-D). DNA demethylation and transcriptional activation induced by DME expression are either comparable or stronger than those achieved by treatment with 5-aza-CdR (Fig. S3). However, whereas 5-aza-CdR-induced demethylation is transient, DME-induced demethylation is stable over time (Fig. S4). All together, these results indicate that expression of DME in DLD-1 cells causes loss of methylation at hypermethylated silenced loci and concomitant reactivation of their expression. Furthermore, both effects are dependent on the catalytic activity of the 5mC DNA glycosylase.
Figure 1. DNA demethylation of ROR2, p14, and p16 in DME-expressing cells is accompanied by gene reactivation. (A) Schematic diagram of analyzed genes. Each vertical bar represents a CpG dinucleotide. Position of ATG codon is indicated as a red rectangle. Green arrows show the location of pyrosequencing primers and yellow arrows the location of qMSP primers. (B) Methylation levels analyzed by bisulfite pyrosequencing; CpG sites are shown as bars filled with black to represent percentage methylation. (C) Methylation levels analyzed by qMSP (D) Gene expression levels analyzed by qRT-PCR. Analyses were performed in non-transfected DLD-1 cells and independent transfectants expressing WT DME (DME 2, DME 10, and DME 13), a catalytically inactive mutant version (mut 7 and mut 13) or cells transfected with the empty vector. Values are shown relative to those detected in non-transfected cells. Data are the mean ± SE of three independent experiments.
DME-induced DNA demethylation is dependent upon the base excision repair pathway
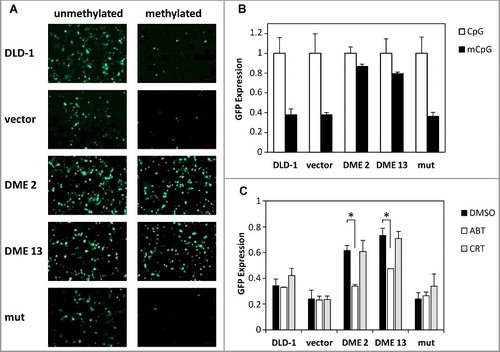
We employed a methylated GFP reporter plasmid to examine whether DME-induced demethylation involves the base excision repair pathway. Cells were transfected with SssI-methylated or unmethylated CMV-GFP plasmid, and fluorescence was analyzed after 48 h (A-B). The expression of the methylated GFP reporter gene was specifically reactivated in DME-expressing cells, but not in either untransfected cells or in cells expressing a catalytically inactive version of the DNA glycosylase. Next, we analyzed the effect of two different BER inhibitors on such DME-dependent reactivation (C). DME is a bifunctional DNA glycosylase that generates as a final product a single-nucleotide gap flanked by 3´-phosphate and 5´-phosphate termini [Citation20]. In mammalian cells, processing of such intermediates during BER does not require AP endonuclease activity [Citation28] but involves PARP [Citation29]. We found that reactivation of the silenced GFP reporter gene was significantly reduced by treatment with the poly (ADP-ribose) polymerase (PARP) inhibitor ABT, but was not affected by the AP endonuclease inhibitor CRT (C). All together, these results suggest that expression of DME in DLD-1 cells initiates an active DNA demethylation process that involves the BER pathway.
Figure 2. DME-induced DNA demethylation is dependent upon the base excision repair (BER) pathway. (A) Non transfected cells and stably transfected lines were transiently transfected with SssI-methylated (right) or unmethylated (left) CMV-GFP reporter plasmid. Fluorescence microscopy images were taken 48 h after transfection. (B) Flow cytometry measurements of GFP expression. Values are shown relative to those detected in cells transiently transfected with unmethylated plasmid. Data are the mean ± SE of five independent experiments. (C) Effect of BER inhibitors on GFP reactivation. Cells transiently transfected with methylated CMV-GFP plasmid were plated either in the absence or presence of BER inhibitor (ABT or CRT; 50 mM), and GFP expression was measured after 24 h by flow cytometry. Values are shown relative to those detected in cells transiently transfected with unmethylated plasmid. Data are the mean ± SE of three independent experiments. Asterisks indicate statistical significance as determined by Student's t-test (* P < 0.05).
Effect of DME expression on hypomethylated loci and repetitive DNA sequences
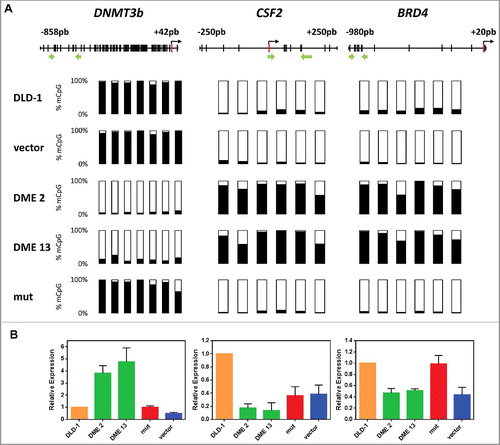
We next asked whether DME expression has any effect on hypomethylated genes. To this end, we specifically compared the effect of DME expression on three loci (DNMT3b, CSF2, and BRD4) that display different types of methylation changes in DLD-1 cells (). DNMT3b and CSF2 are hypermethylated and hypomethylated, respectively, compared to normal colon cells [Citation30,Citation31]. BRD4 is hypermethylated in most colon cancer cells lines, but is unmethylated in both DLD-1 and normal colon cells [Citation32]. Bisulfite pyrosequencing confirmed that, as previously observed with ROR2, p14, and p16, hypermethylation of DNMT3b was virtually abolished in DME-expressing cells. Unexpectedly, however, both CFS2 and BRD4 became methylated (A). Analysis of mRNA levels by qRT-PCR confirmed that demethylation of DNMT3b was accompanied by reactivation, whereas methylation gain at CFS2 and BRD4 was concomitant with silencing (B). We also examined the effect of DME expression on three different types of DNA repetitive elements (Fig. S5). We found that DME expression caused a small, but significant, increase in DNA methylation levels at all three types of repeated sequences. All together, these results indicate that DME expression causes complex effects on the methylome of DLD-1 cells.
Figure 3. DME expression on three loci displays different types of methylation changes in DLD-1 cells. (A) Methylation levels analyzed by bisulfite pyrosequencing; Each vertical bar represents a CpG dinucleotide, and position of ATG codon is indicated as a red rectangle; green arrows show the location of pyrosequencing primers. Analyzed CpG sites are shown as bars filled with black to represent percentage methylation. (B) Gene expression levels analyzed by qRT-PCR. Values are shown relative to those detected in non-transfected cells. Data are the mean ± SE of three independent experiments.
DME causes genome-wide DNA methylation losses and gains that partially restore normal patterns
In order to analyze the effects of DME expression on the methylome of DLD-1 cells, we performed a genome-wide DNA methylation analysis. We first examined global DNA methylation levels by UPLC-MS/MS (Table S1). The results show that there are no significant differences in 5mC global content between control cells and cells expressing DME. Next, we used the Illumina Infinium HumanMethylation450 BeadChip (450K) array to analyze the methylation status at >480,000 CpG sites in DLD-1 cells transfected with the empty vector and cells expressing either active DME or a catalytically inactive mutant version. We found that cells expressing active DME displayed statistically significant differences in methylation levels for about 38,000 CpG sites (8% of analyzed sites), when compared either to cells transfected with the empty vector or cells expressing the mutant protein (A). Surprisingly, we found that expression of active DME was accompanied by both methylation gains and losses. The effect was very similar in the two independent transfectants analyzed, which shared a high proportion (around 90%) of both hypermethylated and hypomethylated CpG sites (Table S2). These results suggest that methylation changes observed upon DME expression are not stochastic in nature and depend upon the catalytic activity of the protein.
Figure 4. DME expression causes both losses and gains of DNA methylation, partially restoring the pattern of normal tissue. (A) Barplot depicting the number of CpG sites displaying differential methylation in several pairwise comparisons. Cell lines are DLD-1 cells transfected with the empty vector and transfectants expressing WT DME or a mutant version. Hyper-/hypo-methylation indicates a statistically significant methylation increase/decrease observed in the first member of each pair. (B) Distribution of differentially methylated CpG sites according to their genomic location (inner ring) and CpG class (outer ring). The left plot represents the distribution of all probes in the 450K methylation array. Center and right plots depict sites displaying hyper- or hypo-methylation in both DME 2 and DME 13 lines when compared to cells expressing a mutant DME version. Colors indicate the percentage of sites at each location, as indicated at the bottom. (C) Overall methylation changes in CpG sites displaying differential methylation according to their respective genomic locations. Absolute beta values are means for sites displaying hyper- or hypo-methylation in both DME 2 and DME 13 lines when compared to cells expressing a mutant DME version. (D) Boxplot indicating overall changes in beta values across different genomic locations for probes located in genes containing both hyper- and hypo-methylated sites. Values are means for sites displaying hyper-or hypomethylation in both DME 2 and DME 13 lines when compared to cells expressing a mutant DME version. (E) Heatmap representing the methylation status (beta-value) of the 3000 most variable probes (y-axis) for each of the different cell samples (x-axis). Unsupervised clustering analysis grouped cell samples in 3 main clusters (indicated by three major branches of the upper dendrogram) and CpG sites in 4 main groups (indicated on the left by different colors, see text for details). (F) Genomic location and CpG class distribution for each of the 4 groups of CpG sites identified by the unsupervised clustering algorithm.
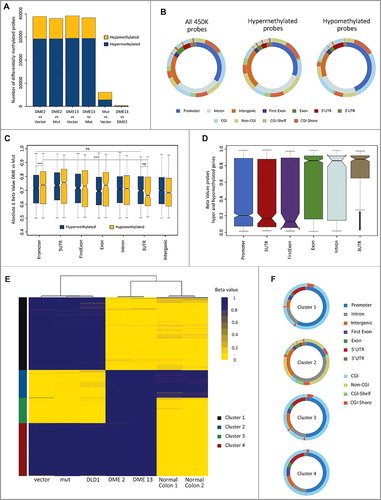
We next examined the genomic distribution of the 35,212 CpG sites (27,175 hypermethylated and 8,037 hypomethylated relative to control samples) showing differential methylation in both transfectants expressing wild type (WT) DME when compared to cells expressing the mutant protein. Hypomethylated sites are enriched in promoters and 5´UTRs (P value < 0.0001 when compared to array background), with a pronounced representation of CpG islands (CGI) in those promoter regions (P < 0.0001). In contrast, hypermethylated sites are enriched in intergenic regions (P < 0.0001) characterized by the presence of non-CGIs (P < 0.0001) (B). Very similar results were obtained when comparing DME-expressing cells with cells transfected with the empty vector (Fig. S6). We also found that, at promoters, absolute methylation change values were somewhat higher for hypomethylated sites as compared to hypermethylated regions (P < 0.0001). Moreover, these differences are more pronounced according to their genomic location, as significant changes are observed for hypomethylated promoters and hypomethylated 3’UTRs (P < 0.0001), but not between hypermethylated promoters and hypermethylated 3’UTRs (C).
The 35,212 CpG sites showing differential methylation upon DME expression are associated with 9,918 genes subdivided in three groups: 7,135 genes with only hypermethylated sites, 1,610 genes with only hypomethylated sites, and 1,173 genes including both hyper- and hypo-methylated sites (Fig. S7A). Interestingly, in the latter group hypomethylation preferentially occurs at promoters, 5’UTRs, and first exon, whereas hypermethylation takes place at the remaining of the gene body and 3’UTRs (D; Table S3). In genes only containing hyper- or hypo-methylated sites, no significant differences in absolute methylation changes were detected across the different gene regions (Fig. S7B-C). However, in genes containing only hypomethylated sites these were enriched in proximal promoters (≤1 kb) and regions close to the transcription start site (TSS) (Fig. S7D-E) (P < 0.0001). Taken together, these results suggest that methylation gains and losses observed upon expression of DME are not randomly distributed over the genome.
A gene ontology (GO) analysis on the three gene groups showed that each one was enriched for genes involved in different cellular pathways (Fig. S8). The group of genes with both hyper- and hypo-methylated sites was enriched for genes associated with regulation of development. Although less noticeable, a similar result was found for the group of genes containing only hypomethylated sites. In contrast, the group of genes with only hypermethylated sites was enriched for genes involved in cell-cell adhesion and signaling.
Next, we performed unsupervised clustering analysis for healthy colon tissues, non-transfected DLD-1 cells, and several transfectants using the 3,000 probes with the highest variance (E-F). The two DLD-1 lines expressing WT DME clustered with normal tissues on the x-axis (E). On the y-axis, hypermethylated CpG sites that upon DME expression reverted to normal levels (cluster 1) are enriched in promoters and CGIs (P < 0.0001), whereas hypomethylated sites that gained methylation to reach normal levels (cluster 2) are enriched in intergenic (P < 0.05) and intronic regions and non-CGIs (P < 0.0001) (F). Sites unmethylated in both normal tissues and DLD-1 cells but hypermethylated in DME-expressing cells (cluster 3), as well as hypermethylated sites that do not revert to normal levels upon DME expression (cluster 4) are also enriched in promoters and CGIs, although to a less extent. These results suggest that DME expression partially restores the methylation pattern observed in normal tissue.
DME expression alters the cell cycle response to anti-tumor agents
We next evaluated the effect of DME expression on the phenotype of DLD-1 cells. Measurements with the trypan blue exclusion assay showed that expression of DME increased cell proliferation in vitro (Fig. S9). We also analyzed the effect of DME expression on the response of DLD-1 cells to two drugs clinically effective against colorectal cancers: oxaliplatin and 5-fluorouracil (5-FU) (A). Cells expressing active DME displayed increased sensitivity to both oxaliplantin and 5-FU at all concentration tested. Pre-incubation of non-transfected cells with 5-aza-CdR also increased sensitivity to oxaliplatin, although to a lesser extent than DME expression, but did not have any significant effect on the sensitivity to 5-FU.
Figure 5. DME sensitizes cells to oxaliplatin and 5-FU and alters the cell cycle response to both anti-tumor drugs. (A) Upper panels: non-transfected DLD-1 cells and stable DME transfectants were treated with various concentrations of oxaliplatin or 5-FU for 48 h, and cell viability was measured. Lower panels: comparison of 5-azaCdR and DME on sensitivity to oxaliplatin or 5-FU. Cells were preincubated or not with 5-azaCdR (2.5 μM) for 72 h, and then treated with anticancer drug for 48 h before measuring cell viability. Data are the mean ± SE of three independent experiments. (B) Percentage of cells in each cell cycle phase after cytostatic treatment. DLD-1 cells and different transfectants were treated with oxaliplatin or 5-FU (25 mM) for 48 h, and analyzed by flow cytometry analysis. Values are the mean ± SE of three independent experiments. (C) Analysis of the phosphorylation status of Cdk2 at Tyr15 (Cdk2pTyr15) by immunoblotting.
To define the potential mechanisms underlying the sensitivity of DME-expressing cells to anti-tumor drugs, we evaluated their cell cycle profile in the absence and presence of either oxaliplatin or 5-FU (B). In the absence of anti-tumor drugs, no obvious differences in cell cycle phase distribution were observed between cells expressing active DME and control cells. However, significant differences were observed in drug-treated cells. Oxaliplatin induced S-phase arrest in control cells, but caused G2/M arrest in cells expressing active DME. On the other hand, exposure to 5-FU did not alter the phase distribution in control cells, but induced S-phase arrest in cells expressing DME. We also examined the phosphorylation status of Cdk2 at Tyr15 (Cdk2pTyr15) by immunoblot analysis (C). Cdk2, which operates in the transition from G1 to S phase and also in S phase progression, is subject to inhibitory phosphorylation at Thr14 and Tyr15 in proliferating cells [Citation33]. We found that treatment with either oxaliplatin or 5-FU caused loss of inhibitory Tyr15 phosphorylation of Cdk2 in DME-expressing cells, but not in control cells. All together, these results indicate that expression of active DME alters the cell cycle response to both oxaliplatin and 5-FU.
DME expression inhibits colonosphere formation in vitro and cancer growth in vivo
The majority of tumors, including CRC, are heterogeneous cell populations comprising a small sub-population of poorly differentiated cancer stem-like cells (CSCs). It has been proposed that CSCs are responsible for tumor-initiating and metastatic ability [Citation34,Citation35] of a cancer. CRC-CSCs can be grown to form floating spheroids (known as colonospheres) when cultured under anchorage-independent conditions in a serum-free defined medium [Citation36]. We compared the colonosphere forming ability of cells expressing active DME and control cells (A-B). There was no significant difference in the number of colonospheres, but primary and secondary colonospheres formed by DME-expressing cells were significantly smaller than those formed by control cells (B). These results indicate that DME-expressing cells have a reduced ability to form colonospheres and suggest an inhibition of their stemness properties.
Figure 6. Effect of DME expression on colonosphere formation in vitro and tumor growth in vivo. (A) Representative images of primary (left panel) and secondary (right panel) colonospheres formed by DLD-1 cells and different transfectants. (B) Size of primary and secondary colonospheres formed by the different cell lines. Data are the mean ± SE of 20 (primary) or 40 (secondary) colonospheres. Asterisks indicate statistical significance as determined by Student's t-test (**** P < 0.0001). (C) Stable DLD-1 transfectants (2.5 × 10⁶ cells) expressing either wild-type DME (DME 2) or a catalytically-inactive mutant version (mut 7) were injected subcutaneously into the left or right flank, respectively, of athymic nude mice (n = 10). (D) Tumor size was assessed at various time points after injection. Data are the mean ± SE.
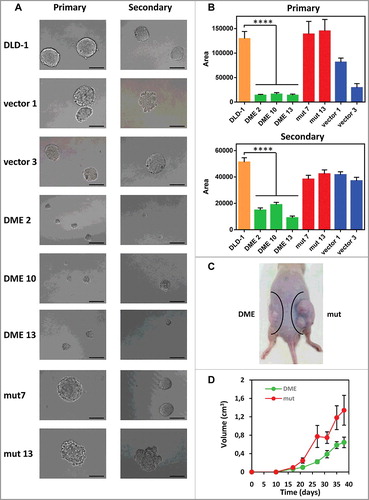
We next examined whether DME expression has an effect on tumor growth in vivo by injecting cells expressing active DME or its catalytically inactive mutant version in nude mice. The size of xenografts expressing active DME was significantly smaller than those expressing the inactive version (C-D). Importantly, the growth rate of tumors expressing active DME was strongly inhibited from early stages. These results indicate that DME expression inhibits cancer growth in vivo.
Discussion
In this study, we show that stable expression of a plant 5mC DNA glycosylase induces genome-wide changes in the methylome of CRC cells and important alterations of their phenotype. There are few reports analyzing genome-wide effects upon expression of enzymes involved in DNA demethylation. Two recent studies reported genome-wide induction of 5hmC in HEK293T cells upon transient expression of the TET1 catalytic domain (TET1-CD) [Citation37] and full-length TET2 [Citation38]. However, methods used in both studies do not allow unambiguous distinction between genuine DNA demethylation and 5mC oxidation.
One unexpected result of our study is that DME expression is associated with both losses and gains of DNA methylation. Interestingly, demethylated regions are enriched in promoters and CGIs, whereas hypermethylated sites tend to be located at intergenic regions and non-CGIs. This result suggests that two different mechanisms are involved. Although most hypomethylation changes are likely to be a direct effect of DME catalytic activity, it is more difficult to explain the extensive hypermethylation changes observed. A possible explanation is that demethylation initiated by DME leads to activation of DNA methylation pathways. In agreement with this idea, we found that DNMT3b, which is hypermethylated and silenced in DLD-1 cells [Citation30], becomes demethylated and reactivated upon DME expression. Interestingly, DNMT3b is required for remethylation observed after drug withdrawal in 5-aza-CdR-treated HCT116 colon cancer cells [Citation39].
Locations of DNA methylation changes induced by DME expression are mostly reciprocal to those observed in tumor cells. In fact, our unsupervised clustering analysis indicates that DME expression partially reverts the aberrant methylation patterns of DLD-1 cells. The mechanisms leading to the simultaneous appearance of focalized DNA hypermethylation and global DNA hypomethylation in cancer cells are poorly understood [Citation7]. However, there are hints that both processes are linked through developmentally regulated silencing programs, as suggested by methylation profiling of colorectal cancer and normal tissues [Citation40]. In this respect, it is interesting that genes whose promoters become hypomethylated upon DME expression are enriched in functions related to development regulation, whereas those hypermethylated are enriched for functions related to cell-cell signaling. Genomic distribution of active DNA demethylation mediated by DME and passive DNA demethylation induced by either mutation or inhibition of DNMTs is apparently different. HCT116 double-knockout cells for DNMT1 and DNMT3B (HCT116 DKO) show hypomethylation in 37% of CpG sites, equally distributed across promoter, gene body, and intergenic regions [Citation41]. On the other hand, 5-aza-CdR-demethylated sites in HCT116 cells are enriched in gene body regions, but not promoters [Citation39]. Interestingly, however, genes that remain demethylated 68 days after 5-aza-CdR withdrawal in HCT116 cells are, like those demethylated by DME in DLD-1 cells, enriched in functions related to developmental processes [Citation39].
A second key observation in our study is that DNA methylome-reprogramming induced by DME is accompanied by important changes in tumor-related properties. This result is perhaps not unexpected, since CpG sites differentially methylated upon DME expression cover about half of the genes examined (9,918 out of 21,231). Notably, DME expression causes increased sensitivity to chemotherapy agents such as oxaliplatin and 5-FU, concomitant with specific alterations of the cell-cycle response to these anti-tumor agents. These results suggest that such response is under epigenetic control. In fact, DME expression demethylates and reactivates two important cell-cycle regulators, such as p14 and p16. Interestingly, it has been reported that induced pluripotent stem (iPS) reprogramming of DLD-1 cells is accompanied by p16 reactivation and increased sensitivity to 5-FU [Citation42]. Another important feature of the altered phenotype of DME-expressing cells is the reduced size of the spheres formed under anchorage-independent conditions. This result suggests that methylation control is important for sphere formation and, presumably, for CSCs subpopulation maintenance in colon tumors. In fact, it has been previously reported that DNA methylation is essential for maintenance of human colon CSCs [Citation43].
A significant result is that DME expression inhibits the growth of tumor xenografts. In this respect, it is interesting that overexpression of TET1 in colorectal cancer cells also inhibits in vivo growth of tumors derived of colorectal cancer cells, as well as spheroid formation [Citation44]. The effect of TET1 has been linked to its capacity to de-repress inhibitors of the Wnt pathway by DNA hydroxymethylation [Citation44]. Indeed, our study shows that DME expression demethylates and reactivates ROR2, which inhibits the canonical β-catenin dependent Wnt signaling [Citation45]. These results agree with the notion that epigenetic disruption of the Wnt/β-catenin signaling pathway is implicated in numerous malignancies, including colorectal cancer [Citation25,Citation46]. Interestingly, DME expression increases cell proliferation in vitro but decreases tumor growth in vivo. Such discrepancy emphasizes the fact that tumor growth in vivo is affected by multiple factors, such as extracellular matrix and stromal cells, which cannot be recreated in vitro. Our observations also suggest that in vitro and in vivo growth are differentially affected by stable changes in the cancer cell methylome.
In summary, our data show that expression of a plant 5mC DNA glycosylase in human CRC cells partially reverts their aberrant methylation and alters their tumoral phenotype. Plant DNA demethylases, with no counterpart in human cells, may provide new options to study the functional role of DNA methylation cancer. We have previously shown that a paralog of DME (ROS1) may be targeted to demethylate specific DNA sequences in human cells by fusion to a DNA binding domain [Citation24]. Therefore, plant DNA demethylases may be a useful addition to the growing collection of effectors used for epigenetic editing.
Materials and methods
Ethics statement
All experiments and procedures involving animals were conducted in accordance with guidelines approved by the Animal Experimentation Service (SAEX) of the University of Cordoba (UCO), with current legislation (Directive 2010/63/EU, belong Commission Recommendation 2007/526/EC and Royal Decree 53/2013).
Cell culture
Cells were grown in Dulbecco's modified eagle's medium–high glucose (DMEM, 4.5 g/L d-glucose) (Sigma), supplemented with 10% fetal bovine serum (FBS, Sigma) and 1% penicillin/streptomycin (Sigma). Cells were maintained in a humidified atmosphere at 37°C and 5% CO2. After cultures became 80% confluent (usually 4 days), cells were trypsinized, centrifuged, and suspended in fresh medium.
Transfection and generation of stable cell lines
Wild-type DME cDNA and a catalytically inactive mutant version (D1562A) were subcloned into pcDNA3.1 vector (Invitrogen) from pET30b-DME and pET30b-DMED1562A, respectively [Citation20], by KpnI/NotI digestion. DLD-1 cells were transfected with the empty plasmid or the different constructs using Lipofectamine LTX (Invitrogen), following the manufacturer´s recommendations. Stable transfectants were obtained after 2 weeks selection with 1 mg/ml G418 (Calbiochem).
RNA Purification and Reverse Transcriptase-Polymerase chain reaction (RT-PCR)
Total RNA from cell lines was extracted using the RNeasy Minikit (Qiagen). Residual genomic DNA was removed by DNAse I digestion with RNase-free (Thermo Scientific) and cDNA was synthesized using the qScript™ cDNA Synthesis Kit (Quanta). Quantitative real time RT-PCR (qRT-PCR) analysis was performed in a CFX Connect™ Real-Time PCR Detection System (Biorad) by mixing cDNA (from 1 μg total RNA) with iQ™ SYBR Green Supermix (Biorad) and specific primers (Table S4). Data were normalized using GAPDH and quantification of relative expression was determined by the 2−ΔΔCt method [Citation47].
Western blot analysis
For DME detection, nuclear extracts prepared with the Qproteome Cell Compartment Kit (Qiagen) were separated by SDS-PAGE, transferred to a nitrocellulose membrane and incubated with a rabbit polyclonal antibody generated against the C-terminal region of Arabidopsis thaliana ROS1 (1:500); an anti-Histone H3 antibody (1:5000, Millipore) was used for loading control. For Cdk2 Tyr15 detection, cell lysates were prepared in RIPA Buffer (Sigma) and incubated with a monoclonal primary antibody against phosphor-Cdk2 Tyr15 (1:250, Abcam), using an anti-Actin antibody (1:2000, Sigma) for loading control. All immunocomplexes were detected by the Enhanced Chemiluminescence Plus Western Blotting Detection System (Amersham Biosciences), using the appropriate horseradish peroxidase-conjugated secondary antibodies. Images were captured on a ChemiDoc™ XRS Imaging System (Biorad).
DNA methylation analysis
DNA was purified following standard protocols and 750 ng of each sample were bisulfite-modified with the EZ DNA Methylation Gold Kit (Zymo Research). Quantitative methylation-specific PCR (qMSP) analysis was performed using allele-specific primers complementary to methylated promoter target sequences (Table S4). To quantify input DNA after bisulfite treatment, a region of the AluC4 locus free of CpG sites was amplified. The relative level of methylation at a specific locus was calculated by the 2−ΔΔCt method [Citation47]. Bisulfite sequencing of multiple clones was performed using primers shown in Table S4. At least twelve independent clones were sequenced for each sample. Bisulfite pyrosequencing was performed with primers shown in Table S4. The biotinylated PCR product was purified and made single-stranded to act as a template in a pyrosequencing reaction using the Pyrosequencing Vacuum Prep Tool (Qiagen). Methylation density was quantified using Pyrosequencing Analysis and the PyroMark Q24 system (Qiagen).
Global DNA methylation analysis by UPLC-MS/MS
Global 5mC levels were analyzed by high-performance liquid chromatography (UPLC 1290 Infinity System, Agilent Technology) coupled to a triple-quadrupole mass spectrometer (6460 Jet Stream Series, Agilent Technologies). The chromatographic conditions and the optimized source parameters were based on those described by Le et al. [Citation48] with some modifications. Briefly, a reverse phase column (Zorbax Eclipse plus C18, 2.1 × 50 mm, 1.8 µm particle size) was used with a mobile phase gradient of formic acid and methanol (up to 80% in 8 min) flowing at 200 µL/min. Multiple reaction monitoring mode transition pairs of deoxycytidine (dC) and 5mC were set as m/z 228.1→112.1 and m/z 242.1→126.1, respectively. The dwell times per channel were set at 100 ms and collision energy at 5V, for both analytes in positive polarity mode. Previous to this analytical procedure, DNA samples were hydrolyzed to nucleosides with Degradase Plus (Zymo Research). The DNA methylation level was expressed as (5mC) / [(5mC) + (dC)].
HumanMethylation450 BeadChip data preprocessing
IDAT files from the HumanMethylation450 BeadChip were processed using the R/Bioconductor package minfi (R package version 1.14.0). In order to adjust for the different probe design types present in the HumanMethylation450 BeadChip architecture, red and green signals from the IDAT files were corrected using the SWAN algorithm [Citation49]. No background correction or control probe normalization was applied. Probes where at least two samples had detection P values >0.01 were filtered out. Beta-values were computed and employed across the analysis pipeline.
Transient transfection with CMV-GFP reporter plasmid
In vitro methylation of pAcGFP1-C1 plasmid DNA (Clontech) was performed using M.SssI methyltransferase (New England Biolabs) and verified by HpaII digestion (New England Biolabs). DME stable cell lines were transfected with either non-methylated or in vitro methylated GFP plasmid using Lipofectamine LTX (Invitrogen). After 48 h cells were visualized in a Nikon ECLIPSE Ti inverted microscope and the numbers of GFP+ cells under different conditions were quantified using a FACSCalibur flow cytometer (BD Biosciences).
Drug treatments
Cells were seeded and let to attach for 24 h before adding the drug(s) at the indicated concentrations, and incubation continued for different time periods. 5-aza-2´-deoxycytidine, oxaliplatin, 5-fluorouracil, and CRT 0044876 were from Sigma, and ABT-888 was from Enzo Life Sciences.
Cell proliferation and cytotoxicity analysis
Cell proliferation rate was established by cell counting on consecutive days. Cells (7.5 × 10⁵) were seeded in T75 culture flasks and collected daily for 4 days. Viable cells, as assessed by trypan blue staining, were counted under a microscope in a hemocytometer. Cytotoxicity was assessed using a WST-1 colorimetric assay (Roche Applied Science). Cells were seeded on 96-well plates at a density of 8,000 cells/well and let to attach for 24 h. After treatment at indicated times and doses, the WST-1 assay was performed following the protocol supplied by the manufacturer. The dye produced by viable cells was spectrophotometrically (420-480 nm) detected using an Imark™ Microplate Reader (Biorad).
Cell cycle analysis
Cell cycle phase distribution was measured by cytometry. Briefly, 2.5 × 10⁵ cells were recovered by centrifugation and fixed with 70% ethanol for at least 24 h at 4ºC. Fixed cells were stained with 50 μg/ml propidium iodide (Sigma) and treated with 50 μg/ml RNase A (Sigma) for 20 minutes at room temperature protected from light. Analysis and measurement of propidium iodide fluorescence were performed on a FACSCalibur flow cytometer (BD Biosciences).
Colonosphere formation assay
The colonosphere formation assay was performed as previously described [Citation50].
Mouse xenograft model
Five-week-old athymic Nude-Foxn1nu/nu mice (Janvier Labs) were used for tumor xenograft experiments with pcDNA-DME and pcDNA-DME mutant transfected DLD-1 cells. Ten mice were used. Both flanks of each animal were injected subcutaneously with 2.5 × 10⁶ cells in 100 μl Matrigel® Matrix (Corning); DME-transfected cells were injected into the left flank and DME mutant-transfected cells into the right flank. Tumor width (W) and length (L) were measured every 5 days. Tumor volume was estimated according to the formula V = 0.4x LxW2 (L = maximum length; W = maximum width).
Conflict of Interest
The authors declare no conflict of interest.
Sup-mat-DNA_methylation_reprogramming_of_human_cancer_cells-Morales-Ruiz.rar
Download (1 MB)Acknowledgements
We thank Araceli Valverde Estepa and Dr. Antonio Rodríguez-Ariza for help and guidance with the colonosphere assay. We also thank members of our laboratories for helpful discussions and advice. This work was supported by the Spanish Ministry of Science and Innovation and the European Regional Development Fund [BFU2016-80728-P to T.RA and Pre-doctoral Fellowship BES-2014-067690 to I.D.G]; Junta de Andalucía and the European Regional Development Fund [P11-CVI-7576 to T.RA]; Ministry of Economy and Competitiveness [Juan de la Cierva postdoctoral fellowship FJCI-2015-26965 to JRT]; the Plan Nacional de I+D+I 2013–2016/FEDER [PI15/00892 to M.F.F.]; Instituto Universitario de Oncología del Principado de Asturias [to G.F.B. and M.I.S.]; and the Asturias Regional Government [GRUPIN14-052 to M.F.F.]. The IUOPA is supported by the Obra Social Cajastur, Spain. The funders had no role in study design, data collection and analysis, decision to publish, or preparation of the manuscript.
Additional information
Funding
Related Research Data
References
- Law JA, Jacobsen SE. Establishing, maintaining and modifying DNA methylation patterns in plants and animals. Nat Rev Genet. 2010;11:204–220. doi:10.1038/nrg2719. PMID:20142834
- Smith ZD, Meissner A. DNA methylation: roles in mammalian development. Nat Rev Genet. 2013;14:204–220. doi:10.1038/nrg3354. PMID:23400093
- Rodriguez-Cortez VC, Hernando H, de la Rica L, et al. Epigenomic deregulation in the immune system. Epigenomics. 2011;3:697–713. doi:10.2217/epi.11.99. PMID:22126290
- Robertson KD. DNA methylation and human disease. Nat Rev Genet. 2005;6:597–610. doi:10.1038/nrg1655. PMID:16136652
- Esteller M. Cancer epigenomics: DNA methylomes and histone-modification maps. Nat Rev Genet. 2007;8:286–298. doi:10.1038/nrg2005. PMID:17339880
- Sandoval J, Esteller M. Cancer epigenomics: beyond genomics. Curr Opin Genet Dev. 2012;22:50–55. doi:10.1016/j.gde.2012.02.008. PMID:22402447
- Baylin SB, Jones PA. Epigenetic determinants of cancer. Cold Spring Harbor Symp Quant Biol. 2016;8.
- Issa JP, Kantarjian HM. Targeting DNA methylation. Clin Cancer Res. 2009;15:3938–3946. doi:10.1158/1078-0432.CCR-08-2783. PMID:19509174
- Bell JS, Kagey JD, Barwick BG, et al. Factors affecting the persistence of drug-induced reprogramming of the cancer methylome. Epigenetics. 2016;11:273–287. doi:10.1080/15592294.2016.1158364. PMID:27082926
- Tahiliani M, Koh KP, Shen Y, et al. Conversion of 5-methylcytosine to 5-hydroxymethylcytosine in mammalian DNA by MLL partner TET1. Science. 2009;324:930–935. doi:10.1126/science.1170116. PMID:19372391
- Ito S, Shen L, Dai Q, et al. Tet proteins can convert 5-methylcytosine to 5-formylcytosine and 5-carboxylcytosine. Science. 2011;333:1300–1303. doi:10.1126/science.1210597. PMID:21778364
- Wu H, Zhang Y. Reversing DNA methylation: mechanisms, genomics, and biological functions. Cell. 2014;156:45–68. doi:10.1016/j.cell.2013.12.019. PMID:24439369
- Kohli RM, Zhang Y. TET enzymes, TDG and the dynamics of DNA demethylation. Nature. 2013;502:472–479. doi:10.1038/nature12750. PMID:24153300
- Pastor WA, Aravind L, Rao A. TETonic shift: biological roles of TET proteins in DNA demethylation and transcription. Nat Rev Mol Cell Biol. 2013;14:341–356. doi:10.1038/nrm3589. PMID:23698584
- Spruijt CG, Gnerlich F, Smits AH, et al. Dynamic readers for 5-(hydroxy)methylcytosine and its oxidized derivatives. Cell. 2013;152:1146–1159. doi:10.1016/j.cell.2013.02.004. PMID:23434322
- Hashimoto H, Olanrewaju YO, Zheng Y, et al. Wilms tumor protein recognizes 5-carboxylcytosine within a specific DNA sequence. Genes Dev. 2014;28:2304–2313. doi:10.1101/gad.250746.114. PMID:25258363
- Wang D, Hashimoto H, Zhang X, et al. MAX is an epigenetic sensor of 5-carboxylcytosine and is altered in multiple myeloma. Nucleic Acids Res. 2017;45:2396–2407. doi:10.1093/nar/gkw1184. PMID:27903915
- Choi Y, Gehring M, Johnson L, et al. DEMETER, a DNA glycosylase domain protein, is required for endosperm gene imprinting and seed viability in Arabidopsis. Cell. 2002;110:33–42. doi:10.1016/S0092-8674(02)00807-3. PMID:12150995
- Gong Z, Morales-Ruiz T, Ariza RR, et al. ROS1, a repressor of transcriptional gene silencing in Arabidopsis, encodes a DNA glycosylase/lyase. Cell. 2002;111:803–814. doi:10.1016/S0092-8674(02)01133-9. PMID:12526807
- Morales-Ruiz T, Ortega-Galisteo AP, Ponferrada-Marin MI, et al. DEMETER and REPRESSOR OF SILENCING 1 encode 5-methylcytosine DNA glycosylases. Proc Natl Acad Sci USA. 2006;103:6853–6858. doi:10.1073/pnas.0601109103. PMID:16624880
- Gehring M, Huh JH, Hsieh TF, et al. DEMETER DNA glycosylase establishes MEDEA polycomb gene self-imprinting by allele-specific demethylation. Cell. 2006;124:495–506. doi:10.1016/j.cell.2005.12.034. PMID:16469697
- Penterman J, Zilberman D, Huh JH, et al. DNA demethylation in the Arabidopsis genome. Proc Natl Acad Sci USA. 2007;104:6752–6757. doi:10.1073/pnas.0701861104. PMID:17409185
- Ortega-Galisteo AP, Morales-Ruiz T, Ariza RR, et al. Arabidopsis DEMETER-LIKE proteins DML2 and DML3 are required for appropriate distribution of DNA methylation marks. Plant Mol Biol. 2008;67:671–681. doi:10.1007/s11103-008-9346-0. PMID:18493721
- Parrilla-Doblas JT, Ariza RR, Roldan-Arjona T. Targeted DNA demethylation in human cells by fusion of a plant 5-methylcytosine DNA glycosylase to a sequence-specific DNA binding domain. Epigenetics. 2017;12:296–303. doi:10.1080/15592294.2017.1294306. PMID:28277978
- Lara E, Calvanese V, Huidobro C, et al. Epigenetic repression of ROR2 has a Wnt-mediated, pro-tumourigenic role in colon cancer. Mol Cancer. 2010;9:170. doi:10.1186/1476-4598-9-170. PMID:20591152
- Esteller M, Tortola S, Toyota M, et al. Hypermethylation-associated inactivation of p14(ARF) is independent of p16(INK4a) methylation and p53 mutational status. Cancer Res. 2000;60:129–133. PMID:10646864
- Merlo A, Herman JG, Mao L, et al. 5' CpG island methylation is associated with transcriptional silencing of the tumour suppressor p16/CDKN2/MTS1 in human cancers. Nat Med. 1995;1:686–692. doi:10.1038/nm0795-686. PMID:7585152
- Wiederhold L, Leppard JB, Kedar P, et al. AP endonuclease-independent DNA base excision repair in human cells. Mol Cell. 2004;15:209–220. doi:10.1016/j.molcel.2004.06.003. PMID:15260972
- Noren Hooten N, Fitzpatrick M, Kompaniez K, et al. Coordination of DNA repair by NEIL1 and PARP-1: a possible link to aging. Aging. 2012;4:674–685. doi:10.18632/aging.100492. PMID:23104860
- Huidobro C, Urdinguio RG, Rodriguez RM, et al. A DNA methylation signature associated with aberrant promoter DNA hypermethylation of DNMT3B in human colorectal cancer. Eur J Cancer. 2012;48:2270–2281. doi:10.1016/j.ejca.2011.12.019. PMID:22244828
- Urdinguio RG, Fernandez AF, Moncada-Pazos A, et al. Immune-dependent and independent antitumor activity of GM-CSF aberrantly expressed by mouse and human colorectal tumors. Cancer Res. 2013;73:395–405. doi:10.1158/0008-5472.CAN-12-0806. PMID:23108143
- Rodriguez RM, Huidobro C, Urdinguio RG, et al. Aberrant epigenetic regulation of bromodomain BRD4 in human colon cancer. J Mol Med (Berl). 2012;90:587–595. doi:10.1007/s00109-011-0837-0. PMID:22120039
- Gu Y, Rosenblatt J, Morgan DO. Cell cycle regulation of CDK2 activity by phosphorylation of Thr160 and Tyr15. EMBO J. 1992;11:3995–4005. PMID:1396589
- Visvader JE.. Cells of origin in cancer. Nature. 2011;469:314–322. doi:10.1038/nature09781. PMID:21248838
- Visvader JE, Lindeman GJ. Cancer stem cells: current status and evolving complexities. Cell Stem Cell. 2012;10:717–728. doi:10.1016/j.stem.2012.05.007. PMID:22704512
- Shaheen S, Ahmed M, Lorenzi F, et al. Spheroid-Formation (Colonosphere) Assay for in Vitro Assessment and Expansion of Stem Cells in Colon Cancer. Stem Cell Rev. 2016;12:492–499. doi:10.1007/s12015-016-9664-6. PMID:27207017
- Jin C, Lu Y, Jelinek J, et al. TET1 is a maintenance DNA demethylase that prevents methylation spreading in differentiated cells. Nucleic Acids Res. 2014;42:6956–6971. doi:10.1093/nar/gku372. PMID:24875481
- Kong L, Tan L, Lv R, et al. A primary role of TET proteins in establishment and maintenance of De Novo bivalency at CpG islands. Nucleic Acids Res. 2016;44:8682–8692. doi:10.1093/nar/gkw529. PMID:27288448
- Yang X, Han H, De Carvalho DD, et al. Gene body methylation can alter gene expression and is a therapeutic target in cancer. Cancer Cell. 2014;26:577–590. doi:10.1016/j.ccr.2014.07.028. PMID:25263941
- Berman BP, Weisenberger DJ, Aman JF, et al. Regions of focal DNA hypermethylation and long-range hypomethylation in colorectal cancer coincide with nuclear lamina-associated domains. Nat Genet. 2011;44:40–46. doi:10.1038/ng.969. PMID:22120008
- Sandoval J, Heyn H, Moran S, et al. Validation of a DNA methylation microarray for 450,000 CpG sites in the human genome. Epigenetics. 2011;6:692–702. doi:10.4161/epi.6.6.16196. PMID:21593595
- Miyoshi N, Ishii H, Nagai K, et al. Defined factors induce reprogramming of gastrointestinal cancer cells. Proc Natl Acad Sci U S A. 2010;107:40–45. doi:10.1073/pnas.0912407107. PMID:20018687
- Morita R, Hirohashi Y, Suzuki H, et al. DNA methyltransferase 1 is essential for initiation of the colon cancers. Exp Mol Pathol. 2013;94:322–329. doi:10.1016/j.yexmp.2012.10.004. PMID:23064049
- Neri F, Dettori D, Incarnato D, et al. TET1 is a tumour suppressor that inhibits colon cancer growth by derepressing inhibitors of the WNT pathway. Oncogene. 2015;34:4168–4176. doi:10.1038/onc.2014.356. PMID:25362856
- Ford CE, Qian Ma SS, Quadir A, et al. The dual role of the novel Wnt receptor tyrosine kinase, ROR2, in human carcinogenesis. Int J Cancer. 2013;133:779–787. doi:10.1002/ijc.27984. PMID:23233346
- Ying Y, Tao Q. Epigenetic disruption of the WNT/beta-catenin signaling pathway in human cancers. Epigenetics. 2009;4:307–312. doi:10.4161/epi.4.5.9371.
- Livak KJ, Schmittgen TD. Analysis of relative gene expression data using real-time quantitative PCR and the 2−ΔΔCT Method. Methods. 2001;25:402–408. doi:10.1006/meth.2001.1262. PMID:11846609
- Le T, Kim KP, Fan G, et al. A sensitive mass spectrometry method for simultaneous quantification of DNA methylation and hydroxymethylation levels in biological samples. Anal Biochem. 2011;412:203–209. doi:10.1016/j.ab.2011.01.026. PMID:21272560
- Maksimovic J, Gordon L, Oshlack A. SWAN: Subset-quantile within array normalization for illumina infinium HumanMethylation450 BeadChips. Genome Biol. 2012;13:R44. doi:10.1186/gb-2012-13-6-r44. PMID:22703947
- Lopez-Sanchez LM, Jimenez C, Valverde A, et al. CoCl2, a mimic of hypoxia, induces formation of polyploid giant cells with stem characteristics in colon cancer. PLoS One. 2014;9:e99143. doi:10.1371/journal.pone.0099143. PMID:24932611