
ABSTRACT
Family history, a well-established risk factor for breast cancer, can have both genetic and environmental contributions. Shared environment in families as well as epigenetic changes that also may be influenced by shared genetics and environment may also explain familial clustering of cancers. Epigenetic regulation, such as DNA methylation, can change the activity of a DNA segment without a change in the sequence; environmental exposures experienced across the life course can induce such changes. However, genetic-epigenetic interactions, detected as methylation quantitative trait loci (mQTLs; a.k.a. meQTLs) and haplotype-dependent allele-specific methylation (hap-ASM), can also contribute to inter-individual differences in DNA methylation patterns. To identify differentially methylated regions (DMRs) associated with breast cancer susceptibility, we examined differences in white blood cell DNA methylation in 29 candidate genes in 426 girls (ages 6–13 years) from the LEGACY Girls Study, 239 with and 187 without a breast cancer family history (BCFH). We measured methylation by targeted massively parallel bisulfite sequencing (bis-seq) and observed BCFH DMRs in two genes: ESR1 (Δ4.9%, P = 0.003) and SEC16B (Δ3.6%, P = 0.026), each of which has been previously implicated in breast cancer susceptibility and pubertal development. These DMRs showed high inter-individual variability in methylation, suggesting the presence of mQTLs/hap-ASM. Using single nucleotide polymorphisms data in the bis-seq amplicon, we found strong hap-ASM in SEC16B (with allele specific-differences ranging from 42% to 74%). These findings suggest that differential methylation in genes relevant to breast cancer susceptibility may be present early in life, and that inherited genetic factors underlie some of these epigenetic differences.
Abbreviations
| BCA | = | breast cancer |
| BCFH | = | breast cancer family history |
| bis-seq | = | bisulfite sequencing |
| BMI | = | body mass index |
| DMR | = | differentially methylated regions |
| EWAS | = | epigenome-wide association study |
| GWAS | = | genome-wide association study |
| hap-ASM | = | haplotype-dependent allele-specific methylation |
| LD | = | linkage disequilibrium |
| LEGACY | = | Lessons in Epidemiology and Genetics of Adult Cancer from Youth |
| mQTL | = | methylation quantitative trait loci |
| SNPs | = | single nucleotide polymorphisms |
| WBC | = | white blood cells |
Introduction
Family history is a well-established risk factor for breast cancer (BCA) [Citation1], increasing risk 2- to 4-fold, depending on the number of affected 1st- and 2nd-degree relatives and their ages at diagnosis [Citation1]. Three classes of BCA susceptibility genes—high, intermediate, and low—exhibit different levels of risk and prevalence in the general population (reviewed in [Citation2]): pathogenic variants in high-risk genes, including BRCA1, BRCA2, PTEN, and TP53, are relatively rare and explain about 20% of the proportion of the genetic variance in risk, whereas pathogenic variants in intermediate-risk genes, including ATM, BRIP1, CHEK2, and PALB2, explain a further 3% of the heritability of the disease. More recently, ∼100 common, low-risk single nucleotide polymorphisms (SNPs) have been associated with BCA risk through genome-wide association studies (GWAS) and explain an estimated 16–20% of heritability [Citation3]. The remaining familial clustering is likely driven by shared environment as well as epigenetic changes that may be influenced by both genetics and shared environment.
Epigenetic regulation, such as DNA methylation of BCA-associated genes [Citation4–Citation6], can change the activity of a DNA segment without changing the underlying DNA sequence and can be altered throughout life (reviewed in [Citation7,Citation8]). DNA methylation, occurs mostly at cytosine residues in CpG dinucleotides and has an important role in regulating gene expression and tumorigenesis [Citation6]. DNA methylation alterations in BRCA1 have been observed in BCA tissues [Citation4,Citation5], and modest case-control differences in BRCA1 methylation of white blood cells (WBCs) have also been reported [Citation9,Citation10]. In addition, several epigenome-wide association studies (EWAS) using WBCs have found that low average epigenome-wide methylation was associated with higher risk of BCA [Citation11,Citation12]. In addition, Xu et al. have reported that a specific CpG methylation signature using WBC DNA improves risk prediction for BCA [Citation13]. In addition to environmental factors modifying DNA methylation, a subset of CpG sites have strong associations with SNPs in cis [Citation 14 – Citation 16 ], suggesting that DNA methylation alterations can be driven by genetic differences. Haplotype-dependent allele-specific DNA methylation (hap-ASM) is the physical counterpart of such mQTLs [Citation14–Citation18]. Thus, to accurately identify environmental effects on epigenetic alterations, it is critical to identify the extent that mQTLs and hap-ASM drive epigenetic differences across individuals. In addition, disease associations involving mQTLs and/or hap-ASM can provide useful insights to genetic risk [Citation17].
Distinct from genomic imprinting, where the methylation of an allele is determined by its parent-of-origin, for loci with hap-ASM the local sequence context (haplotype) acts in cis to dictate the methylation status of local CpGs. Loci that show hap-ASM can be identified by bisulfite sequencing (bis-seq), in heterozygotes, if SNPs are present in the bis-seq amplicons. The closely related term mQTL (strictly, cis-mQTL) refers to loci in which the CpG methylation levels, which are typically scored in case series by microarray-based methods such as Illumina Methylation BeadChips, correlate strongly with genotypes at nearby SNPs, as assessed by SNP genotyping in the same series of individuals. Hap-ASM loci and mQTLs in linkage disequilibrium (LD) with disease associated SNPs from GWAS can translate into modest but important methylation differences between low- and high-risk populations. From a cautionary standpoint, reviews of EWAS design have discussed the potential pitfall of falsely concluding that epigenetic changes are due to environmental pathways or disease progression, rather than genetic differences between cases and controls [Citation19]. At the same time, the finding of hap-ASM in a haplotype block that also contains a relevant GWAS peak can be useful for providing biological support for that statistical peak, and for localizing regulatory DNA sequences within the haplotype block, which reveal themselves by conferring the physical asymmetry in methylation between the two alleles [Citation17,Citation18].
Measuring methylation in repetitive elements in WBC DNA, we previously found lower levels in young girls with a breast cancer family history (BCFH) compared to girls without a BCFH [Citation20]. In order to identify specific differentially methylated regions (DMRs) associated with BCA susceptibility, the current study examined differences in WBC DNA methylation and hap-ASM between girls with and without a BCFH at 29 candidate loci using massively parallel targeted bis-seq.
Results
shows descriptive statistics of LEGACY girls by BCFH and compares characteristics for those with and without blood specimens. Girls who provided blood were older (P < 0.0001), had higher body mass index (BMI; P < 0.0001) and were more likely to have a BCFH (P = 0.01) than those who did not. There were no differences in age and BMI by BCFH in girls who gave blood; 64.7% of the BCFH+ vs. 55.1% of the BCFH- girls were non-Hispanic White (P = 0.004).
Table 1. Characteristics of girls with and without baseline blood in the LEGACY Girls Study.
Identification of BCFH-DMRs in ESR1 and SEC16B
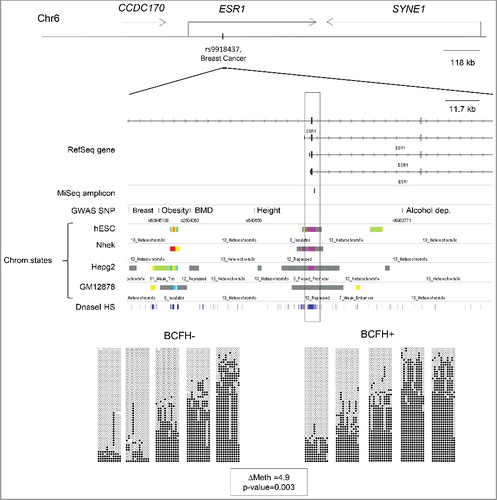
The distribution of methylation in the 29 genes by BCFH is summarized in . Methylation in ESR1 was, on average, 4.9% (P = 0.003, FDRQ P = 0.08), higher in BCFH+ girls than BCFH- girls. The median values of average DNA methylation in ESR1 were 55.0% [interquartile range (IQR) = 21.6%] for BCFH+ girls and 49.2% (IQR = 25.2%) for BCFH- girls. ( and ). The ESR1 BCFH-DMR is in a downstream alternative promoter region, which shows dynamic chromatin states with histone marks characteristic of poised chromatin in H1-ESC, HepG2, and NHEK cells but repressed marks in GM12878 lymphoblastoid cells (). The bottom panel of illustrates the variability in methylation across individual CpG sites for 10 individuals (5 with and 5 without a BCFH) with a shift in the distribution of methylation toward high net methylation in the BCFH+ group compared to the girls without a BCFH.
Table 2. Distribution of methylation levels (percent) in 29 genes by breast cancer family history (BCFH) in the LEGACY Girls Study.
Figure 1. Methylation differences between BCFH+ and BCFH- girls in ESR1, SEC16B, CYP1A1, DLGAP2, and CCNL1. Net CpG methylation values (percent) in BCFH- girls and BCFH+ girls in 5 gene regions examined in WBC DNA. The red line represents the median methylation. ESR1, SEC16B, and CYP1A1 showed high inter-individual variability of the methylation level, while the distribution of methylation levels of DLGAP2 and CCNL1 did not. For the CYP1A1, DLGAP2 and CCNL1, there is no difference between BCFH+ and BCFH- girls, while for ESR1 and SEC16B, there are small but statistically significant differences. Importantly, the range of methylation values for these loci is wide, suggesting the presence of hap-ASM, in which one local haplotype acts in cis and dictates a low methylation level while another haplotype dictates high methylation.
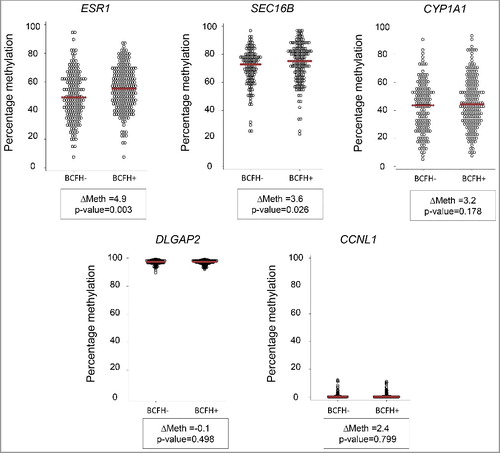
Figure 2. BCFH-DMR in an alternate promoter of ESR1. Map and bis-seq showing the BCFH-DMR in an alternate promoter of ESR1. Zoomed-in view of ESR1, showing relevant ENCODE tracks and the amplicons utilized for targeted bis-seq. The BCFH-DMR is located in a downstream ESR1 alternative promoter region and marked by poised chromatin marks. Graphical representation of bis-seq data for 10 examples of BCFH- girls (left) and BCFH+ girls (right) are shown. Each column represents a consecutive CpG covered by the amplicon, and each line a unique DNA fragment. White circles are unmethylated CpGs and black circles are methylated CpGs.
The mean of methylation in the DNA regions that we queried in SEC16B was 3.6% (P = 0.026, FDRQ P = 0.38) higher in girls with a BCFH than girls without a BCFH. ( and ). The median methylation levels in SEC16B were 75.1% for BCFH+ girls and 72.8% for BCFH- girls. The statistically significant associations with ESR1 and SEC16B remained after adjusting for age, race/ethnicity, and BMI, and further adjustment by pubertal breast development stage and age at menarche. Although our main comparisons were between girls with and without a BCFH, we also calculated a continuous risk score. The Spearman correlation coefficients between BOADICEA risk score, which includes both family history and any known BCA genes, and methylation were 0.11 (P = 0.04) for ESR1 and 0.11 (P = 0.06) for SEC16B, respectively, supporting the positive overall association with the binary construct of family history.
The above two BCFH-DMRs showed high inter-individual variability in methylation levels, while methylation levels in other genes such as DLGAP2 and CCNL1 showed little variation, both overall and when compared by BCFH (). Although there was high inter-individual variability of the methylation of CYP1A1, the levels of methylation did not differ by BCFH ().
BCFH-DMR and hap-ASM in SEC16B suggests a candidate genetic variant associated with BCA susceptibility
Methylation of the BCFH-DMRs showed high inter-individual variability (). Since our quality control metrics (Supplementary Methods) supported a biological, rather than technical, explanation for this inter-individual variability in methylation, we examined whether it might be explained by hap-ASM. The BCFH-DMR at SEC16B is in the upstream promoter/proximal enhancer region. The region shows dynamic chromatin marks associated with active enhancer in some cell types and quiescent chromatin in other cell types (). The amplicon of SEC16B also covered the common SNP, rs6682862 (), and thus could be assessed for hap-ASM (see Materials and methods). We found strong hap-ASM in SEC16B in 25 out of 32 heterozygous blood samples with significant absolute differences between the reference and alternate allele ranging from 20% to 75% (with bootstrapped Wilcoxon P value from 0.02 to 6 × 10⁻⁹). In addition, in all 25 samples with hap-ASM, the reference allele was methylated while the alternate allele was unmethylated, indicating hap-ASM and not genomic imprinting (for which a random, genotype-independent, pattern of ASM is expected) as the mechanism (). This conclusion was confirmed by binomial test (binomial test P value = 3 × 10⁻⁸). To determine if our findings in WBC are relevant for breast tissue, we performed bis-seq in 10 normal breast tissue samples and 10 peripheral blood T lymphocyte samples (relevant to the host immune response to cancers), from different individuals, to test for hap-ASM in SEC16B. Hap-ASM was present in 3 out of 4 heterozygous breast samples and 2 out 3 heterozygous T cell samples. Although the difference between alleles was slightly smaller in breast and T cells than in whole blood WBCs, ranging from 21.4% to 23.7%, the direction of this difference was consistent across all the tissues and cell types ( and Supplementary Figure 1). In addition, the net methylation was similar in breast and blood [70.1% (SD = 8) compared to 70% (SD = 13.9)]. These findings indicate that the polymorphism in SEC16B has similar effects in whole blood, T cells, and whole breast tissues.
Figure 3. Hap-ASM BCFH-DMR and mQTLs in the promoter of SEC16B. Map and results of bis-seq showing the BCFH-DMR and hap-ASM in the promoter of SEC16B. (A) Map of SEC16B, showing relevant ENCODE tracks and the amplicons utilized for targeted bis-seq. (B) Bis-seq data showing hap-ASM in the SEC16B promoter region. Graphical representation of 5 representative whole-blood samples and 1 human normal breast tissue. Additional representations in breast tissues and T cells from peripheral blood are shown in the Supplemental figure 1. This region overlaps with the common SNP, rs6682862. Allele A and B are analyzed and represented separately. The SNP dictates methylation level with the alternate allele (allele B) being significantly hypomethylated compared to the reference allele (allele A), suggesting the presence of hap-ASM in 25 out of 32 heterozygous samples. The low methylated allele is significantly biased toward allele B (P = 3 × 10−08, using binomial test), which ruled out imprinting. For each heterozygous sample, Wilcoxon P value and methylation difference between alleles were calculated by bootstrapping (1,000 sampling of 50 reads per allele) and are indicated only for significant hap-ASM defined as difference in percentage methylation >20%, >3 ASM CpGs, and P < 0.05. One representative random sample of each allele (20 reads per allele) is shown. ∆Meth (difference in percentage of methylation between alleles in heterozygous samples) and Wilcoxon P values are from bootstrapping. * indicates the position of the index SNP which overlap with a CpG site, which is, therefore, always unmethylated on allele B. (C) CpG methylation values (percent) by genotypes in BCFH- girls (Up) and BCFH+ girls (Bottom). The red line represents the median methylation. Methylation and genotype significantly correlate in both groups supporting mQTL/hap-ASM. Girls with the AA genotype had the highest methylation levels, while girls with BB genotype had lowest methylation levels. The number of samples for each genotype and the distribution (%) is indicated below each graph.
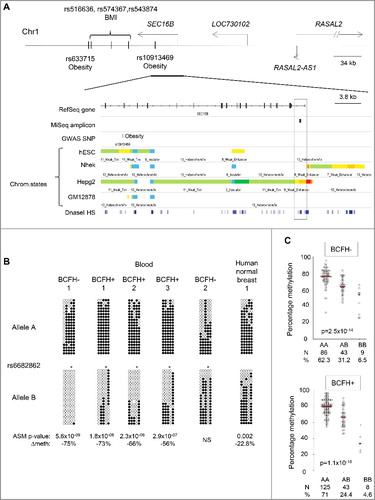
Methylation of SEC16B was negatively associated with age (Spearman's correlation coefficient of -0.13, P = 0.02). In multivariable models adjusting for BCFH, age, and rs6682862 genotype, only genotype was independently associated with DNA methylation (P value = 3.5 × 10⁻³⁰, R2 = 0.40), suggesting that inter-individual variations in SEC16B methylation are mostly attributable to cis-acting effects of nearby SNPs ().
In addition to SEC16B, 9 additional loci with no evidence of BCFH-DMRs were potentially informative for hap-ASM analysis, namely BRCA1, CCDC85A, CYP1A1, DLGAP2, RAD51L1, SLC39A14, and ZNF483, and the intergenic regions queried on chromosome 12 and 16 (referred as Chr12 and Chr16 loci) (Supplementary Table 2). Bis-seq revealed hap-ASM in BRCA1 for 19 of 136 heterozygous samples for and in CCDC85C for 13 of 97 heterozygous samples (Supplementary Table 2). The finding of hap-ASM in only a subset of heterozygotes is similar to previous observations for other loci [Citation17,Citation21] and can be explained by extended haplotype effects, in which a particular combination of more than one SNP is required in cis to confer significant ASM.
Discussion
Large epidemiologic studies have reported case-control difference in DNA methylation of WBC DNAs in BCA susceptibility gene such as BRCA1 in WBC DNAs [Citation9,Citation10]. In this study, we compared the methylation status between girls with and without a BCFH to identify specific DMRs associated with BCA susceptibility. We observed two BCFH DMRs: one region located in a BCA susceptibility gene, encoding estrogen signaling receptor 1 (ESR1), and one region located in SEC16B, encoding a transport protein involved in growth and development. While both of these DMRs showed small but statistically significant differences in net methylation between girls with and without a BCFH, these differences were not statistically significant after a stringent test for false positives. However, because we selected our list of candidate loci based on a priori criteria, correcting for false positives may be unnecessarily conservative. In any event, our findings need to be further tested in replication studies.
Multiple CpG sites in the amplicon of ESR1 showed consistently higher mean methylation in girls with a BCFH compared to girls without a BCFH. ESRs are involved in BCA [Citation22] and studies on BCA cell lines have observed that methylation in a promoter or enhancer of ESR1 is associated with decreased expression of ERα mRNA and protein [Citation23]. To assess the functional relevance of methylation in these regions, we first looked at the correlation between methylation and expression using public TCGA data. We used MEXPRESS [Citation24] (http://mexpress.be/) to visualize and examine DNA methylation and expression data from breast cancers. Methylation measured by Illumina 450K BeadChips was negatively correlated to gene expression in ESR1; the Pearson's correlation coefficients were -0.72 for cg00601836, -0.34 for cg15626350, and -0.37 for cg04063345. Thus, our observation of higher methylation in BCFH+ girls should indicate less expression of ESR1. This observation is consistent with decreased estrogen signaling associated with increased ESR1 methylation [Citation25], recruiting the ESR1 protein to AhR and away from estrogen receptor (ER) target genes, increased ER degradation, and synthesis of other inhibitory factors [Citation25].
Several SNPs associated with BCA that map to ESR1 have been reported in GWAS [Citation22,Citation26], and at least 5 SNPs, including rs9918437, have been found to be related to imbalances in ER expression [Citation22]. The ESR1 amplicon we studied here is located within 58 kb of rs9918437. In addition, rs10913469, a GWAS SNP related to weight and BMI, is located within a 150 kb window [Citation27,Citation28]. Although there are no informative SNPs in the ESR1 amplicon and LD data are not available in the 1000 genomes project for the closest common SNPs [Citation29], hap-ASM might be present, with the hap-ASM index SNP being in LD with these GWAS SNPs. Using an array-based indirect approach, Day et al. identified mQTLs in blood lymphocytes at cg04063345 and cg15626350, which are located in our DMR, suggesting the presence of hap-ASM in this ESR1 region [Citation30]. In addition, mRNA levels differ between two ESR1 alleles marked by rs2077647, which is about 1.2 kb 5’ of our amplicon [Citation31]. Environmental exposures might also contribute to inter-individual variation in methylation of ESR1 [Citation 32 ,Citation 33 ]. For example, an animal study reported that, in utero, bisphenol A (BPA) exposure disrupted epigenetic programming of ESR1 in the brain [Citation32]. DNA methylation alterations in multiple CpG sites of ESR1 were also reported to be correlated with maternal smoking during pregnancy and offspring's methylation patterns in ESR1 [Citation33].
The second BCFH-DM we observed is in SEC16B, a gene associated with obesity and age at menarche [Citation34,Citation35]. A GWAS peak SNP associated with menarche and obesity, rs633715, and one for BMI, rs10913469, are located 85 kb and 25 kb upstream of the hap-ASM region, respectively [Citation28], although these SNPs appear to lie just outside of the haplotype block that contains the hap-ASM index SNP, rs6682862. Interestingly, allele-specific expression (assessed by eQTL) of SEC16B has been described in peripheral blood monocytes [Citation36]. The BCFH-DMR at SEC16B is located in the gene promoter. In the TCGA data, methylation at cg00647232, which is covered by our bis-seq amplicon, showed a significant positive correlation to gene expression (Pearson's coefficient = 0.09). Our findings of hap-ASM in this locus in blood and breast tissues, together with multiple eQTLs associated with SEC16B expression [Citation37], suggest that the small but significant DNA methylation difference that we have observed in this gene between the BCFH + and BCFH- girls could manifest functionally as differences in genetic susceptibility. Although no SNP in SEC16B has yet been reported as linked to BCA susceptibility, the presence of eQTLs and hap-ASM in this gene nominates it as a candidate for further scrutiny, which could be done by genetic fine-mapping and testing for associations with BCA after taking age at menarche and BMI into account. Importantly, our breast tissue samples are from whole excisions and contain not only epithelial cells but also fibroblasts, endothelial cells, and adipocytes. Future work on isolated breast epithelial cells, and on purified adipocytes and fibroblasts, will be necessary to gain insight on the underlying mechanisms of SEC16B associated susceptibility. The analysis of hap-ASM in adipocytes could be particularly important since this gene has been associated with obesity by GWAS and, indeed, the effect on breast cancer risk may be biologically linked to adiposity [Citation38]. In fact, we directly examined methylation at SEC16B locus in adipose tissue using ENCODE whole-genome bisulfite sequencing generated by the ENCODE consortium (https://www.encodeproject.org/). Although only 3 samples were sequenced, the high inter-individual variability in the methylation level and pattern is suggestive of hap-ASM. Regarding the functional relevance of hap-ASM in T cells, results from recent clinical trials using immune checkpoint inhibitors in multiple cancers, including BCA [Citation39], support an active role of immune infiltration in cancers.
We downloaded TCGA public data from the cancer browser (https://genome-cancer.ucsc.edu/). We compared methylation between the 22 BCA bearing mutation in BRCA1 or BRCA2 and 630 cancers without any of these mutations. For ESR1, we did not observe a significant effect of BRCA1/2 mutations on methylation (difference between mutated vs. non-mutated cancers = −2.1%, P = 0.2). In addition, this non-significant trend was in the opposite direction to the one observed in BCFH+ vs. BCFH- comparison, suggesting that our findings for ESR1 is unlikely due to a higher prevalence of BRCA1/2 mutation in BCFH + compared to BCFH- girls. For SEC16B, we observed a non-significant relative hypermethylation in the BRCA1/2 mutated vs. non mutated cancers (7%, P = 0.12). Although this hypermethylation was not significant, we cannot exclude that part of the difference that we observed in BCFH+ vs. BCFH- comparison is driven by the unbalanced distribution of BRCA1/2 mutations in our groups. However, although we expect a higher prevalence of these mutations in BCFH+ girls, the low prevalence of BRCA1 and BRCA2 in the general population (1.56% and 1.87% in TCGA data, respectively) suggests, if present, a modest confounding effect. We acknowledge that future work should assess the effect of BRCA1/2 mutations on net methylation difference as well as on the presence and strength of hap-ASM in SEC16B.
We observed possible hap-ASM in BRCA1 and CCDC85C; however, since the magnitude of the hap-ASM was variable and the proportion of samples showing it was low for these genes, further exploration of these loci is required. Other loci that showed a wide range of methylation but lacked informative SNPs in the amplicons (e.g., ESR1) will also need to be examined for possible hap-ASM using additional amplicons. We believe that a non-negligible part of differentially methylated loci identified by large sample size case/control methylation studies (EWAS) are in fact hap-ASM dictated by disease-associated SNPs, the difference between case and control reflecting the unbalanced distribution in cases vs. controls of these disease associated SNPs [Citation21]. Therefore, mapping hap-ASM can help prioritizing disease-associated SNPs and unravel biological pathways disrupted by genetic variants.
A key strength of our study is that it is enriched with girls with a BCFH, permitting identification of genes or loci for which dysregulated methylation might partially explain family clustering of cancer. Using bis-seq, we assessed ASM and examined the potential genetic effect on the BCFH-DM. Advantages of the bis-seq method that we used here are the ability to examine methylation across multiple CpGs and to separate the sequencing reads by allele. An important limitation with using WBC DNA is that both net methylation and hap-ASM can be tissue- and cell type-specific [Citation17]. However, an advantage of using WBC DNA is that it can be collected repeatedly, particularly across development. For example, using a repeated sample design of 51 children before and after puberty, Almstrup et al. [Citation40] identified methylation changes associated with puberty in a total of 457 CpG sites, including 5 CpG sites located in the promoter of thyroid receptor-interacting protein (TRIP6), a gene involved in cell signaling, cell invasiveness and transcriptional activation. We did not examine this gene here but plan on examining repeated measures of DNA methylation pre- and post-puberty in the LEGACY girls. Other types of regulatory sequences will also need to be examined; for example, higher methylation variability in dysregulation in DNA methylation of BCA genes, such as ATM in WBC DNA was observed in intragenic repetitive elements rather than in promoter regions [Citation41]. Although we selected the list of candidate genes based on a priori considerations including pilot data using genome-wide DNA methylation platform, if we were to conservatively divide the P value by the number of tests we conducted, our results for SEC16B may be due to chance. Thus, although our findings suggest a potential role for mQTLs in genes important to BCA, they need to be replicated in independent series. Here, we examined an a priori list of targeted genes based on criteria described in the methods. Our results suggest that larger scale of screening of mQTLs/hap-ASM may be fruitful for characterizing differences that may be evident early in life, and may be partly genetically determined, in individuals with a cancer family history.
We recognize that the abundance of specific cell subtypes, which may have different levels of methylation in the genes of interest, likely impacts our results. However, we evaluated differences in methylation related to BCFH and, even if differences are partially the result of large changes in methylation of a small subset of cells, we have no reason to expect that these subsets differ by BCFH. We examined whether the ESR1 region where we found differences in methylation could be explained by cell type differences by examining publically available methylation data (GEO accession: GSE35069) and did not find any differences in methylation by cell type, including WBC, peripheral blood mononuclear cells, monocytes, and neutrophils [Citation42]. Our findings, if replicated, suggest that methylation in BCA related genes may differ between individuals with and without a BCFH, in part due to genetic-epigenetic interactions. To understand whether genetic or environmental factors early in life may be associated with changes in DNA methylation, prospective studies are needed that measure within-individual changes in exposures and DNA methylation over time and that carefully consider the role of genetic variation in explaining the inter-individual epigenetic variation.
Materials and methods
Study participants
Participants were girls ages 6–13 years participating in the LEGACY Girls Study, which is a multicenter prospective study following 1,040 girls and their participating parent or guardian, with data collection every six months on clinical and epidemiological factors (for details see www.legacygirlsstudy.org and [Citation43,Citation44]). Girls were invited to provide biospecimens, including blood at baseline and at follow-up visits. Almost half of the girls have a BCFH, defined as at least one first- or second-degree relative diagnosed with BCA. Forty-one percent of the girls (n = 426) provided blood at baseline. We also collected demographic and epidemiological information, including family history of breast cancer, by interviews, and anthropometric measurements (height and weight) using standardized protocols. Because we have already reported differences between blood and saliva DNA methylation [Citation45], we did not include girls who only provided saliva at baseline (n = 509). All participating institutions obtained Institutional Review Board approval to conduct the study.
Bis-seq for DNA methylation analysis
The selection criteria we used to develop a panel of DNA methylation levels in 29 candidate loci was based on published genetic or epigenetic association, with at least one or more of the following categories: (i) genes that are associated with GWAS SNPs or mutations related to BCA risk [Citation46,Citation47]; (ii) genes related to age at menarche from GWAS [Citation34]; (iii) genes related to growth and development from GWAS [Citation48] or EWAS [Citation49]; (iv) genes involved in DNA recombination and repair (http://sciencepark.mdanderson.org/labs/wood/dna_repair_genes.html); and (v) the top 8 candidate CpG sites that showed evidence of methylation changes between girls with and without a BCFH in our exploratory genome-wide DNA methylation profiling from pilot work in 48 girls, but outside the above selection criteria (Supplementary Table 1). For each locus, we selected the bis-seq primer locations based on the chromatin states defined by Ernst et al. [Citation50] and available in the UCSC human genome browser [Citation51]. We focused on active promoters and enhancers, insulators, and poised chromatin, since these regions are implicated in gene regulation in cancers and are often enriched in disease‐associated DMRs and mQTLs/hap-ASM [Citation17,Citation52]. In addition, we covered a few loci with repressed chromatin or transcription associated chromatin states. When indicated, annotation of GWAS peaks was performed using the NHGRI-EBI catalog [Citation27] and literature searches for smaller-scale genetic association studies.
We examined DNA methylation for an amplicon (approximately 200–300 bp) for these 29 selected loci using massive parallel targeted bis-seq on genomic DNA from the WBC samples, as described [Citation17]. Unlike Methylation BeadChips, bis-seq provides a qualitative and quantitative approach to identify 5-methylcytosine at single base-pair resolution over multiple contiguous CpG sites, as well as the potential to assess methylation level after separation by alleles [Citation17,Citation53]. We also measured DNA from breast normal tissues in 10 women: 8 from adjacent non tumor tissues, 1 from breast reduction, and 1 from benign tumor and 10 T cells from adults without BCA [Citation17]. Details of the DNA methylation measurements are in the Supplementary Methods. We calculated methylation percentages by averaging across all CpGs in the amplicon.
Statistical methods
Identification of differentially methylated regions (DMRs) associated with BCFH
To assess BCFH-DMRs, we compared average methylation difference for each amplicon between girls with and without a BCFH using the Wilcoxon rank-sum test. We calculated false discovery rate (FDR) q value using PROC MULTTEST procedure. For each DMR, we carried out a multivariable analysis using linear regression models with DNA methylation percentage as the outcome, and categorical variables for BCFH, race/ethnicity, and pubertal development, and continuous variables for age and body mass index [BMI; weight (kg)/height squared (m)] as covariates. Using the Breast and Ovarian Analysis of Disease Incidence and Carrier Estimation Algorithm (BOADICEA) risk model [Citation54], we previously had estimated the absolute risk based on family pedigree information for each girl [Citation55]. We also examined the correlation between BCFH-DMRs and the BOADICEA risk model. In addition, for loci with available genotyping data, SNP genotype was also included in the model (see genotyping method below). We set the significance level 2-sided P value<0.05.
Identification of hap-ASM
To identify hap-ASM we used an approach similar to that in Do et al. [Citation17] Genotype calling for informative SNPs in the bis-seq amplicons was carried out after alignment of the sequencing reads. Overall, 10 amplicons covered at least one informative SNP and were included for hap-ASM analysis (Supplementary Table 2). Details of assessing hap-ASM are provided in the Supplementary Methods. All analyses were performed with SAS software 9.4 (SAS Institute, Cary, NC) and R.3.10.
Disclosure of Potential Conflicts of Interest
The authors declare that they have no competing interests.
Sup-mat-Breast_Cancer_Family_History-Wu.rar
Download (2.2 MB)Acknowledgments
The authors thank the LEGACY girls and their family members for their continuing contributions to the study and our colleagues at the participating family genetics and oncology clinics. The authors thank the Epigenetics Shared Resource and the Molecular Pathology Share Resource of the Herbert Irving Comprehensive Cancer Center for performing the targeted bisulfite sequencing and the Columbia University Tissue Bank for normal breast tissue. We also thank the staff at each LEGACY study site, including Alex Blacker, Connie Cady, Jocelyn Koo, Lisa Moy, Meera Sangaramoorthy, Enid Satariano (California site); Ann Johnson, Jasmine MacDonald, Melissa White (New York site); Gordon Glendon, Danielle Hanna, Teresa Selander (Ontario site); Colleen Sands (Philadelphia site); and Briar Doi, Karen O'Toole (Utah site). The authors also thank the members of the Scientific Advisory Board (Drs. Tim A. Ahles, Christopher K. Daugherty, Michele Forman, Marcia E. Herman-Giddens, Robert Hiatt, Lawrence H. Kushi, Mary S. Wolff, Susan L. Teitelbaum, Martin J. Yaffe) and the Event Monitoring Committee (Drs. Jeffrey Botkin, Christopher K. Daugherty, Branlyn DeRosa, Malcolm Pike, and Ms. Cheryl Schuman). The authors thank the contributing clinical centers for their efforts in recruiting our LEGACY participants (Ontario site: Clinical Genetics at Trillium Health Partners – Credit Valley Hospital, The Cancer Risk Assessment Centre at the Juravinski Cancer Centre, The Princess Margaret Hospital Familial Breast and Ovarian Cancer Clinic, The Mount Sinai Familial Breast Cancer Clinic and The Granovsky Gluskin Family Medicine Centre of Mount Sinai Hospital; Philadelphia site: the Clinical and Translational Research Center (CTRC) [UL1TR000003 (NCATS) and UL1RR024134] and the Pediatric Research Consortium (PeRC) at The Children's Hospital of Philadelphia.
Additional information
Funding
Related Research Data
References
- Cancer CGoHFiB. Familial breast cancer: collaborative reanalysis of individual data from 52 epidemiological studies including 58 209 women with breast cancer and 101 986 women without the disease. The Lancet. 2001;358:1389–1399. doi:http://dx.doi.org/10.1016/S0140-6736(01)06524-2.
- Stratton MR. Rahman N. The emerging landscape of breast cancer susceptibility. Nature Genet. 2008;40:17–22. doi:10.1038/ng.2007.53. PMID:18163131.
- Shiovitz S, Korde LA. Genetics of breast cancer: a topic in evolution. Ann Oncol. 2015;26:1291–1299. doi:10.1093/annonc/mdv022. PMID:25605744
- Esteller M, Silva JM, Dominguez G, et al. Promoter hypermethylation and BRCA1 inactivation in sporadic breast and ovarian tumors. J Natl Cancer Inst. 2000;92:564–569. doi:10.1093/jnci/92.7.564. PMID:10749912
- Rice JC, Ozcelik H, Maxeiner P, et al. Methylation of the BRCA1 promoter is associated with decreased BRCA1 mRNA levels in clinical breast cancer specimens. Carcinogenesis. 2000;21:1761–1765. doi:10.1093/carcin/21.9.1761. PMID:10964110
- Widschwendter M, Jones P. DNA methylation and breast carcinogenesis. Oncogene. 2002;21:5462–5482. doi:10.1038/sj.onc.1205606. PMID:12154408
- Terry MB, Delgado-Cruzata L, Vin-Raviv N, et al. DNA methylation in white blood cells: association with risk factors in epidemiologic studies. Epigenetics : official journal of the DNA Methylation Society. 2011;6:828–837. doi: 16500 [pii]. PMID: 21636973; PMCID: 3154425. doi:10.4161/epi.6.7.16500.
- Ruiz-Hernandez A, Kuo C-C, Rentero-Garrido P, et al. Environmental chemicals and DNA methylation in adults: a systematic review of the epidemiologic evidence. Clin Epigenetics. 2015;7:55. PMID: doi:10.1186/s13148-015-0055-7. PMID:25984247
- Wong EM, Southey MC, Fox SB, et al. Constitutional methylation of the BRCA1 promoter is specifically associated with BRCA1 mutation-associated pathology in early-onset breast cancer. Cancer Prev Res. 2011;4:23–33. doi:10.1158/1940-6207.capr-10-0212; PMCID: PMC4030007. PMID:20978112
- Cho YH, McCullough LE, Gammon MD, et al. Promoter hypermethylation in white blood cell DNA and breast cancer risk. J Cancer. 2015;6:819–824. doi:10.7150/jca.12174. PMID: PMC4532978. PMID:26284132
- Severi G, Southey MC, English DR, et al. Epigenome-wide methylation in DNA from peripheral blood as a marker of risk for breast cancer. Breast Cancer Res Treat. 2014;148. doi:10.1007/s10549-014-3209-y.
- van Veldhoven K, Polidoro S, Baglietto L, et al. Epigenome-wide association study reveals decreased average methylation levels years before breast cancer diagnosis. Clin Epigenetics. 2015;7:67. doi:10.1186/s13148-015-0104-2. PMID:26244061
- Xu Z, Bolick SCE, DeRoo LA, et al. Epigenome-wide association study of breast cancer using prospectively collected sister study samples. JNCI J Natl Cancer Inst. 2013;105:694–700. doi:10.1093/jnci/djt045. PMID: PMC3653821. PMID:23578854
- Fraser HB, Lam LL, Neumann SM, et al. Population-specificity of human DNA methylation. Genome Biol. 2012;13:R8–R8. doi:10.1186/gb-2012-13-2-r8. PMID: PMC3334571. PMID:22322129
- Rushton MD, Reynard LN, Young DA, et al. Methylation quantitative trait locus (meQTL) analysis of osteoarthritis links epigenetics with genetic risk. Hum Mol Gen. 2015;24:7432–7444. doi:10.1093/hmg/ddv433. PMID:26464490
- Bell JT, Pai AA, Pickrell JK, et al. DNA methylation patterns associate with genetic and gene expression variation in HapMap cell lines. Genome Biol. 2011;12:R10–R10. doi:10.1186/gb-2011-12-1-r10. PMID: PMC3091299. PMID:21251332
- Do C, Lang CF, Lin J, et al. Mechanisms and disease associations of haplotype-dependent allele-specific DNA methylation. Am J Hum Genet. 2016;98:934–955. doi:10.1016/j.ajhg.2016.03.027. PMID: 27153397; PMCID: 4863666. PMID:27153397
- Tycko B. Mapping allele-specific DNA methylation: a new tool for maximizing information from GWAS. Am J Hum Genet. 2010;86:109–112. doi:10.1016/j.ajhg.2010.01.021. PMID: 20159108; PMCID: 2820186. PMID:20159108
- Cortijo S, Wardenaar R, Colomé-Tatché M, et al. Mapping the epigenetic basis of complex traits. Science. 2014;343:1145–1148. doi:10.1126/science.1248127. PMID:24505129
- Wu HC, John EM, Ferris JS, et al. Global DNA methylation levels in girls with and without a family history of breast cancer. Epigenetics : official journal of the DNA Methylation Society. 2011;6:29–33. doi:10.4161/epi.6.1.13393. PMID: 20930546; PMCID: PMC3052913.
- Do C, Shearer A, Suzuki M, et al. Genetic–epigenetic interactions in cis: a major focus in the post-GWAS era. Genome Biol. 2017;18:120. doi:10.1186/s13059-017-1250-y. PMID: PMC5477265. PMID:28629478
- Dunning AM, Michailidou K, Kuchenbaecker KB, et al. Breast cancer risk variants at 6q25 display different phenotype associations and regulate ESR1, RMND1 and CCDC170. Nature Genet. 2016;48:374–386. doi:10.1038/ng.3521. PMID: PMC4938803. PMID:26928228
- Stone A, Zotenko E, Locke WJ, et al. DNA methylation of oestrogen-regulated enhancers defines endocrine sensitivity in breast cancer. Nat Commun. 2015;6:7758. doi:10.1038/ncomms8758. http://www.nature.com/articles/ncomms8758#supplementary-information. PMID:26169690
- Koch A, De Meyer T, Jeschke J, et al. MEXPRESS: visualizing expression, DNA methylation and clinical TCGA data. BMC Genomics. 2015;16:636. doi:10.1186/s12864-015-1847-z. PMID: PMC4549898. PMID:26306699
- Jeffy BD, Chirnomas RB, Romagnolo DF. Epigenetics of breast cancer: polycyclic aromatic hydrocarbons as risk factors. Environ Mol Mutagen. 2002;39:235–244. doi:10.1002/em.10051. PMID:11921194
- Li T, Zhao J, Yang J, et al. A Meta-Analysis of the Association between ESR1 genetic variants and the risk of breast cancer. PloS one. 2016;11:e0153314. doi:10.1371/journal.pone.0153314. PMID: PMC4829239. PMID:27070141
- MacArthur J, Bowler E, Cerezo M, et al. The new NHGRI-EBI Catalog of published genome-wide association studies (GWAS Catalog). Nucleic Acids Res. 2017;45:D896–D901. doi:10.1093/nar/gkw1133. PMID:27899670
- Thorleifsson G, Walters GB, Gudbjartsson DF, et al. Genome-wide association yields new sequence variants at seven loci that associate with measures of obesity. Nat Genet. 2009;41:18–24. doi: http://www.nature.com/ng/journal/v41/n1/suppinfo/ng.274_S1.html. doi:10.1038/ng.274. PMID:19079260
- The Genomes Project C. A global reference for human genetic variation. Nature. 2015;526:68–74. doi:10.1038/nature15393. PMID: PMC4750478. PMID:26432245
- Day K, Waite LL, Alonso A, et al. Heritable DNA Methylation in CD4(+) cells among complex families displays genetic and non-genetic effects. PloS one. 2016;11:e0165488. doi:10.1371/journal.pone.0165488. PMID: PMC5085095. PMID:27792787
- Zhai Y, Zhou G, Deng G, et al. Estrogen receptor α polymorphisms associated with susceptibility to hepatocellular carcinoma in hepatitis B birus carriers. Gastroenterology. 2009;130:2001–2009. doi:10.1053/j.gastro.2006.02.030.
- Kundakovic M, Gudsnuk K, Franks B, et al. Sex-specific epigenetic disruption and behavioral changes following low-dose in utero bisphenol A exposure. Proc Natl Acad Sci USA. 2013;110:9956–9961. doi:10.1073/pnas.1214056110. PMID: PMC3683772. PMID:23716699
- Joubert Bonnie R, Felix Janine F, Yousefi P, et al. DNA methylation in newborns and maternal smoking in pregnancy: genome-wide consortium meta-analysis. Am J Hum Genet. 2016;98:680–696. doi: http://dx.doi.org/10.1016/j.ajhg.2016.02.019. PMID:27040690
- Dvornyk V. Waqar-ul-Haq. Genetics of age at menarche: a systematic review. Hum Reprod Update. 2012;18:198–210. doi:10.1093/humupd/dmr050. PMID:22258758
- Lv D, Zhang D-D, Wang H, et al. Genetic variations in SEC16B, MC4R, MAP2K5 and KCTD15 were associated with childhood obesity and interacted with dietary behaviors in Chinese school-age population. Gene. 2015;560:149–155. doi:http://dx.doi.org/10.1016/j.gene.2015.01.054. PMID:25637721
- Leslie R, O'Donnell CJ, Johnson AD. GRASP: analysis of genotype–phenotype results from 1390 genome-wide association studies and corresponding open access database. Bioinformatics (Oxford, England). 2014;30:i185–i194. doi:10.1093/bioinformatics/btu273. PMID: PMC4072913. PMID:24931982
- Lonsdale J, Thomas J, Salvatore M, et al. The Genotype-Tissue Expression (GTEx) project. Nature Genet. 2013;45:580–585. doi:10.1038/ng.2653. http://www.nature.com/ng/journal/v45/n6/abs/ng.2653.html#supplementary-information. PMID:23715323
- Choi J, Cha YJ, Koo JS. Adipocyte biology in breast cancer: from silent bystander to active facilitator. Prog Lipid Res. 2018;69:11–20. doi:https://doi.org/10.1016/j.plipres.2017.11.002.
- Jia H, Truica CI, Wang B, et al. Immunotherapy for triple-negative breast cancer: existing challenges and exciting prospects. Drug Resist Updat. 2017;32:1–15. doi:https://doi.org/10.1016/j.drup.2017.07.002. PMID:29145974
- Almstrup K, Lindhardt Johansen M, Busch AS, et al. Pubertal development in healthy children is mirrored by DNA methylation patterns in peripheral blood. Sci Rep. 2016;6:28657. doi:10.1038/srep28657. http://www.nature.com/articles/srep28657#supplementary-information. PMID:27349168
- Flanagan JM, Munoz-Alegre M, Henderson S, et al. Gene-body hypermethylation of ATM in peripheral blood DNA of bilateral breast cancer patients. Hum Mol Gen. 2009;18:1332–1342. doi:10.1093/hmg/ddp033. PMID:19153073
- Reinius LE, Acevedo N, Joerink M, et al. Differential DNA methylation in purified human blood cells: implications for cell lineage and studies on disease susceptibility. PloS one. 2012;7:e41361. doi:10.1371/journal.pone.0041361. PMID:22848472
- John EM, Terry MB, Keegan THM, et al. The LEGACY girls study: examining early-life exposures, growth and development, and psychosocial well-being in the context of breast cancer family history. Epidemiology. 2016;27:438–448. doi:10.1097/EDE.0000000000000456. PMID:26829160
- Terry MB, Goldberg M, Schechter S, et al. Comparison of clinical, maternal, and self pubertal assessments: implications for health studies. Pediatrics. 2016;138. doi:10.1542/peds.2015-4571. PMID:27544347
- Wu H-C, Wang Q, Chung WK, et al. Correlation of DNA methylation levels in blood and saliva DNA in young girls of the LEGACY Girls study. Epigenetics : official journal of the DNA Methylation Society. 2014;9:929–933. doi:10.4161/epi.28902; PMCID: PMC4143407.
- Purrington KS, Slager S, Eccles D, et al. Genome-wide association study identifies 25 known breast cancer susceptibility loci as risk factors for triple-negative breast cancer. Carcinogenesis. 2014;35:1012–1019. doi:10.1093/carcin/bgt404. PMID: PMC4004200. PMID:24325915
- Welter D, MacArthur J, Morales J, et al. The NHGRI GWAS Catalog, a curated resource of SNP-trait associations. Nucleic Acids Res. 2014;42(Database issue):D1001–D1006. doi:10.1093/nar/gkt1229. PMID: PMC3965119. PMID:24316577
- Horikoshi M, Yaghootkar H, Mook-Kanamori DO, et al. New loci associated with birth weight identify genetic links between intrauterine growth and adult height and metabolism. Nature Genet. 2013;45:76–82. doi:10.1038/ng.2477. PMID: PMC3605762. PMID:23202124
- Engel SM, Joubert BR, Wu MC, et al. Neonatal genome-wide methylation patterns in relation to birth weight in the norwegian mother and child cohort. Am J Epidemiol. 2014;179:834–842. doi:10.1093/aje/kwt433. PMID:24561991
- Ernst J, Kheradpour P, Mikkelsen TS, et al. Systematic analysis of chromatin state dynamics in nine human cell types. Nature. 2011;473:43–49. doi:10.1038/nature09906. PMID: PMC3088773. PMID:21441907
- Karolchik D, Hinrichs AS, Kent WJ. The UCSC genome browser. Curr Protoc Bioinformatics. 2009;CHAPTER:Unit1.4–Unit1.4. doi:10.1002/0471250953.bi0104s28. PMID: PMC2834533.
- Robertson KD. DNA methylation and human disease. Nat Rev Genet. 2005;6:597–610. doi: http://www.nature.com/nrg/journal/v6/n8/suppinfo/nrg1655_S1.html. doi:10.1038/nrg1655. PMID:16136652
- Li Y, Tollefsbol TO. DNA methylation detection: Bisulfite genomic sequencing analysis. Methods Mol Biol (Clifton, NJ). 2011;791:11–21. doi:10.1007/978-1-61779-316-5_2. PMID: PMC3233226.
- Antoniou AC, Pharoah PPD, Smith P, et al. The BOADICEA model of genetic susceptibility to breast and ovarian cancer. Br J Cancer. 2004;91:1580–1590. doi:10.1038/sj.bjc.6602175. PMID: PMC2409934. PMID:15381934
- Terry MB, Keegan THM, Houghton LC, et al. Pubertal development in girls by breast cancer family history: the LEGACY girls cohort. Breast Cancer Res: BCR. 2017;19:69. doi:10.1186/s13058-017-0849-y. PMID: PMC5465536. PMID:28595647