
 ?Mathematical formulae have been encoded as MathML and are displayed in this HTML version using MathJax in order to improve their display. Uncheck the box to turn MathJax off. This feature requires Javascript. Click on a formula to zoom.
ABSTRACT
Altered expression of microRNAs (miRNAs) is implicated in fetal growth. However, the mechanisms by which placenta-derived miRNAs regulate birthweight are not well understood. In Phase 1, we compared the expression of 754 miRNAs in the placenta from two extreme birthweight groups (0.8–2.2 kg vs. 3.3–3.9 kg, n = 77 each) selected from an arsenic-exposed Bangladeshi birth cohort (n = 1,141). We identified 49 miRNAs associated with the extreme birthweight groups and/or gestational age in Phase 1, which were further analyzed in Phase 2 among 364 randomly selected mother-infant pairs. Gestational age was determined by ultrasound. Causal mediation analysis was used to estimate the effect of miRNAs on birthweight considering gestational age a mediator, adjusting for cord blood arsenic and other risk factors. miR-1290, miR-195, and let-7g showed significant inverse associations with gestational age, while miR-328 showed significant positive association [false discovery rate (FDR) <0.05]. Via changing gestational age, miR-1290, miR-195, and miR-27a showed significant inverse associations with birthweight, while miR-328 and miR-324-5p showed significant positive associations (FDR <0.05). The effect of miRNAs on birthweight varied by gestational age (for miR-1290, miR-195, miR-328) and in utero arsenic exposure (for miR-1290): stronger effect was observed among infants delivered early in gestation or exposed to higher concentrations of arsenic in cord blood. Gene enrichment analysis with in silico predicted targets identified cell proliferation, inflammation, apoptosis, insulin, and IGF family signaling cascades associated with these miRNAs. Future studies are warranted to replicate these findings and assess these miRNAs as early biomarkers of fetal growth.
Introduction
Low birthweight is an important population indicator of neonatal mortality and morbidity and an established risk factor for later-life chronic diseases, particularly cardiovascular disease and metabolic syndrome [Citation1, Citation2]. Birthweight is governed by two main causal processes: shortening of gestation and intra-uterine growth restriction [Citation3]. The placenta is thought to play a critical role in both processes, as it is involved in facilitating the supply of oxygen and nutrients to the fetus, secreting hormones and growth factors, and detoxifying potentially harmful maternal and environmental factors [Citation4,Citation5]. However, the molecular mechanisms by which the placenta regulates birthweight are not well understood, although epigenetic alterations – changes that regulate gene activity without the change in underlying DNA sequence – are potential players to influence fetal growth and the programming of health throughout the life-course [Citation6].
One such epigenetic mechanism is the aberrant expression of microRNAs (miRNAs). microRNAs are 18–25 nucleotides long small noncoding RNA molecules that are involved in the regulation of gene expression at the posttranscriptional level [Citation7]. Binding to the 3'-untranslated region of the messenger RNA (mRNA) target, miRNAs can effectively silence gene expression either by translational repression or mRNA degradation [Citation8]. It is estimated that up to 60% of all human protein-coding genes are regulated by miRNAs [Citation9], essentially controlling a variety of cellular processes, including metabolism, cell proliferation, differentiation, apoptosis, and development [Citation10,Citation11]. miRNAs are ubiquitously expressed in human tissues, although some are largely unique to the placenta [Citation12]. Placenta-derived miRNAs have been implicated in normal placental development, function, and remodeling; trophoblast cell proliferation, migration, and invasion; apoptosis; and angiogenesis [Citation13–Citation15].
Several studies have investigated the link between miRNA expression profiles in maternal and fetal tissues and adverse maternal and perinatal outcomes. Most of these studies have focused on preeclampsia [Citation12,Citation14,Citation16–Citation20], although a few studies examined the associations with preterm birth (<37 weeks of gestation) [Citation12,Citation14,Citation16–Citation20], fetal growth restriction [Citation18,Citation21,Citation22], and low birthweight (<2500 g) [Citation23], reporting dysregulated expression of some miRNA species in relation to these outcomes. However, results from these studies are often conflicting or irreproducible, mainly because of small sample size, differences in miRNA source tissue and expression technology, inadequate adjustment for confounders, and targeted miRNA expression analysis approach adopted by most studies. Nonetheless, combined evidence suggests a role for miRNAs in determining birthweight, possibly involving both preterm birth and fetal growth restriction within the causal pathways. However, epidemiological studies investigating the causal relation between placenta-derived miRNAs and birthweight are lacking.
Furthermore, the expression of miRNAs is sensitive to environmental exposures, including inorganic arsenic [Citation24], which is an independent risk factor for preterm birth [Citation25] and lower birthweight [Citation26,Citation27]. Therefore, it is possible that the effect of placenta-derived miRNAs on birthweight can be modified by in utero arsenic exposure. In this study, we aimed to investigate the causal relation between placenta-derived miRNAs and birthweight, adjusting for in utero arsenic exposure and other risk factors, using data from mother-infant pairs enrolled in a prospective birth cohort in Bangladesh. We hypothesized that placenta-derived miRNAs will regulate birthweight involving pathways mediated through gestational age and pathways independent of gestational age (). We also aimed to investigate whether the effect of placenta-derived miRNAs on birthweight was modified by in utero arsenic exposure.
Results
Phase 1 results
The characteristics of the study participants are summarized in . The median (range) birthweight of the two extreme birthweight groups selected in Phase 1 was 2.1 (0.8–2.2) kg and 3.5 (3.3–3.9) kg, respectively. The two extreme birthweight groups significantly (P value <0.05) differed by gestational age, maternal enrollment BMI, education, study site, and cord blood arsenic exposure.
Table 1. Distributions of selected characteristics of the study participants by study phases. Data were expressed as Mean ± SD or Median (range) except where indicated.
Associations between miRNA expression and gestational age
In Phase 1, we selected 25 placenta-derived miRNAs for further analysis based on their associations with gestational age at the level of permutation P <0.01 (Table S1). Twenty-four of these miRNAs were associated with gestational age in at least 2 out of 4 normalization methods, while 16 miRNAs (let-7g, miR-16, miR-27a, miR-34b, miR-138, miR-181a, miR-181c, miR-195, miR-199a, miR-205, miR-296, miR-328, miR-331, miR-489, miR-542-3p, and miR-886-3p) were associated with gestational age in at least 3 normalization methods.
Associations between miRNA expression and the extreme birthweight groups
In Phase 1, we also selected 33 miRNAs for further analysis based on their associations with the extreme birthweight groups (Table S2). Twenty-three of these miRNAs were associated with the extreme birthweight groups in ≥2 normalization methods at the level of permutation P <0.01. Thirteen of these miRNAs (miR-124a, miR-625, miR-524, miR-518f, miR-376b, miR-34c, miR-337-3p, miR-324-5p, miR-30c, miR-205, miR-195, and miR-185) showed significant associations in ≥3 normalization methods. Among these 33 miRNAs, 9 miRNAs (let-7g, miR-138, miR-195, miR-205, miR-324-5p, miR-337-3p, miR-34b, miR-522, and miR-625) were also associated with gestational age in ≥2 normalization methods (Figure S1). We also selected 10 miRNAs that showed significant associations with the extreme birthweight groups in any normalization method but have known biological significance.
Phase 2 results
The median (range) birthweight of the participants selected in Phase 2 was 2.9 kg (1.0–4.3). Other characteristics of Phase 2 participants are presented in .
Associations between miRNA expression and gestational age
In Phase 2, we identified 9 miRNAs (let-7g, miR-1290, miR-195, miR-200c, miR-27a, miR-30c, miR-324-5p, miR-328, and miR-424) significantly associated with gestational age at the level of P <0.05 (). While 4 of these miRNAs (let-7g, miR-1290, miR-195, and miR-27a) were negatively associated with gestational age, 5 miRNAs (miR-200c, miR-30c, miR-324-5p, miR-328, and miR-424) showed significant positive associations at the level of P <0.05. After adjusting for multiple testing, the associations for let-7g, miR-1290, miR-195, and miR-328 remained statistically significant (FDR (false discovery rate) <0.05). Our results showed that a 1-standard deviation (SD) increment in placental expression of let-7g, miR-1290, miR195, and miR-328 in the placenta was associated with a change in gestation age of −0.46 weeks (95% CI: −0.78, −0.14), − 0.67 weeks (95% CI: −0.96, −0.38), −0.56 weeks (95% CI: −0.82, −0.30), and + 0.45 weeks (95% CI: + 0.26, + 0.64), respectively.
Table 2. The effects of a 1-SD increment in placental expression of miRNA on gestational age and birthweight in Phase 2 study (n = 364). The indirect, direct, and total effects of miRNA expressions on birthweight were estimated using causal mediation analysis considering gestational age a mediator.
Associations between miRNA expression and birthweight
Causal mediation analysis revealed that placenta-derived miRNAs were associated with birthweight via changing gestational age and via pathways independent of gestational age. For example, let-7g, miR-1290, miR-195, miR-199a, miR-27a, miR-324-3p, miR-328, and miR-424 were significantly associated with birthweight via changing gestational age (indirect effect) at the level of P <0.05 (). After adjusting for multiple testing, the associations for 5 miRNAs – miR-1290, miR-195, miR-27a, miR-324-3p, and miR-328 – remained statistically significant (FDR <0.05). Three miRNAs – miR-1290, miR-138, and miR-720 – showed significant associations with birthweight (P <0.05) via pathways independent of gestational age (direct effect); none of the associations remained statistically significant after adjusting for multiple testing. Six miRNAs – miR-1290, miR-138, miR-181a, miR-181c, miR-489, and miR-720 – showed significant total effect associations with birthweight at the level of P <0.05. After adjusting for multiple testing, the total effect of associations for miR-1290 and miR-720 remained statistically significant (FDR <0.05). The indirect and direct effect associations for let-7g, miR-199a, miR-27a, miR-324-5p, and miR-424 were in the opposite direction, attenuating the total effect associations for these miRNAs on birthweight. miR-1290 was the only miRNA that showed statistically significant associations with birthweight via indirect, direct, and total effect pathways at the level of P <0.05. Specifically, a 1-SD increment in placental expression of miR-1290 was associated with an average of 160.1g (95% CI: −235.6, −74.0; FDR = 0.01) lower birthweight (total effect); 33.1% of the effect was mediated by a shortening of gestational age (β = −52.9g, 95% CI: −95.4, −22.6; FDR = 0.003), while the effect via pathways independent of gestational age was −107.1g (95% CI: −174.3, −31.8; FDR = 0.08). Sensitivity analysis indicated that the estimated mediation effects for our top-hit miRNAs were robust to the assumption of no unmeasured confounding effect (results not shown).
Gestational age also moderated the effect of placenta-derived miRNAs on birthweight. Specifically, the effects of miR-1290, miR-195, miR-328, and miR-489 on birthweight were stronger in magnitude and statistical significance among infants delivered early in gestation (all P-for-interaction <0.05) (; Table S3). For example, higher expression of miR-1290 and miR-195 and lower expression of miR-328 in the placenta was associated with more than additively lower birthweight among infants born, roughly, before 38 weeks of gestation.
The effect of miR-1290 on birthweight was additionally moderated by in utero arsenic exposure. Specifically, the negative association between miR-1290 and birthweight was stronger when cord blood arsenic exposure was also higher (P-for-interaction <0.05) (; Table S3). For instance, among infants delivered at 37th week of gestation, a 1-SD increment in placental expression of miR-1290 was associated with 86.8 g (95% CI: −164.1, −9.5; P = 0.028), 120.8 g (95% CI: −197.8, −43.8; P = 0.002), and 162.9 g (95% CI: −249.9, −75.9; P <0.001) lower birthweight when cord blood arsenic concentrations were at 25th, 50th, and 75th percentiles, respectively.
Figure 1. Directed acyclic graph (DAG) showing conceptual models for causal mediation analysis. We hypothesized that placenta-derived miRNAs will affect birthweight directly or indirectly via changing gestational age.
Figure 2. Controlled Direct Effects (CDEs) of selected placenta-derived miRNAs in relation to birthweight at gestational age ranging from 29 to 41 weeks. Panel A1, A2, and A3 illustrate the changes in mean birthweight [g] for a 1-SD increment in placental expression miR-1290 when cord blood arsenic exposure is at 25th, 50th, and 75th percentiles, respectively. Panel B, C, and D illustrate the changes in mean birthweight [g] for a 1-SD increment in placental expression of miR-195, miR-328, and miR-489, respectively. Solid black lines surrounded by shaded area represent the effect estimates and 95% confidence intervals. The horizontal blue dashed lines show the reference values and the vertical blue dashed lines represent the gestational age of 37 weeks. Models were adjusted for natural log cord blood arsenic exposure, maternal age, education, enrollment BMI, number of past pregnancies, infant sex, study site and surrogate variables.
![Figure 2. Controlled Direct Effects (CDEs) of selected placenta-derived miRNAs in relation to birthweight at gestational age ranging from 29 to 41 weeks. Panel A1, A2, and A3 illustrate the changes in mean birthweight [g] for a 1-SD increment in placental expression miR-1290 when cord blood arsenic exposure is at 25th, 50th, and 75th percentiles, respectively. Panel B, C, and D illustrate the changes in mean birthweight [g] for a 1-SD increment in placental expression of miR-195, miR-328, and miR-489, respectively. Solid black lines surrounded by shaded area represent the effect estimates and 95% confidence intervals. The horizontal blue dashed lines show the reference values and the vertical blue dashed lines represent the gestational age of 37 weeks. Models were adjusted for natural log cord blood arsenic exposure, maternal age, education, enrollment BMI, number of past pregnancies, infant sex, study site and surrogate variables.](/cms/asset/b21571f1-e834-4b0e-9b71-27205df06030/kepi_a_1481704_f0002_c.jpg)
We conducted a sensitivity analysis to determine the temporal relation between placenta-derived miRNAs and gestational age in relation to birthweight. Our results showed that the effect estimate of gestational age in relation to birthweight was consistent whether or not a miRNA was added to the model. This pattern was consistent for all miRNAs significantly associated with birthweight (). On the other hand, the effect estimate of a miRNA in relation to birthweight considerably changed whether or not gestational age was added to the model. These results suggest that gestational age is likely an intermediate or mediating variable for the associations between our top-hit miRNAs and birthweight.
In silico target mapping and miRNA-target gene enrichment analysis
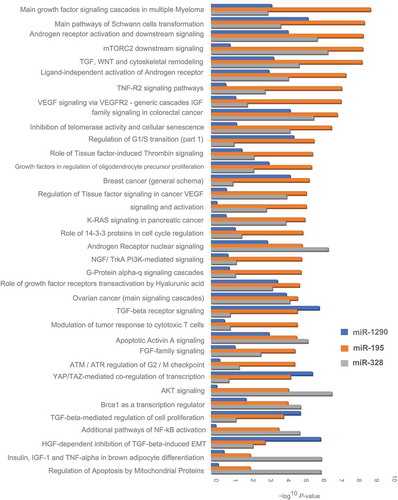
Gene enrichment by process networks of candidate miRNAs with their in silico predicted targets revealed several biological processes, such as regulation of cell growth and proliferation, apoptosis, angiogenesis, embryonic development, erythropoiesis, reproduction and neurohormonal signaling, and inflammation that were associated with miR-1290, miR-195, and miR-328 (Table S4). These network processes involved several biological pathways, including growth factor signaling, insulin and IGF family signaling, WNT signaling, VEGF signaling, and TGF signaling cascades that were implicated in fetal growth (; Table S4).
Figure 3. Gene enrichment pathways for selected miRNAs with in silico predicted targets. The vertical axis represents a description of the pathways, and the horizontal axis represents the – Log10(P value) of the significant enrichment pathways.
Discussion
In our two-phase study involving a total of 454 mother-infant pairs, placental expression of miR-1290, miR-195, and let-7g was significantly and negatively associated with gestational age, while miR-328 was significantly and positively associated with gestational age (FDR <0.05). Causal mediation analysis revealed that placental expression of miR-1290, miR-195, and miR-27a was significantly and negatively associated with birthweight, while miR-328 and miR-324-5p was significantly and positively and associated with birthweight, primarily via gestational age. The effect of miR-1290, miR-195, and miR-328 on birthweight was modified by gestational age, whereas the effect of miR-1290 was additionally modified by in utero arsenic exposure. A stronger effect of these miRNAs on birthweight was observed among infants delivered early in gestation or exposed to higher concentration of arsenic in cord blood. Overall, our results indicated that a higher expression of miR-1290 and miR-195 and a lower expression of miR-328 in the placenta was not only associated with early termination of pregnancy but also associated with more than additively lower birthweight. Gene ontology enrichment analysis of these miRNAs with in silico predicted targets revealed several biological pathways, including growth factor signaling, insulin and IGF family signaling, WNT signaling, and VEGF and TGF signaling cascades implicated in fetal growth.
We identified several miRNAs (e.g., let-7g, miR-30c, miR-138, miR-181c, and miR-489) that were not previously implicated in fetal growth. We also identified miRNAs that were previously reported to be associated with fetal growth (miR-1290, miR-324, miR-424, miR199a) [Citation21,Citation28–Citation30] or implicated in fetal growth based on their associations with preeclampsia (miR-181a [Citation20,Citation31,Citation32], miR-424 [Citation33,Citation34], miR-27a [Citation35], miR-199a [Citation33], miR-200c [Citation20,Citation34], miR-195 [Citation36,Citation37], and miR-328 [Citation14]). However, most of these studies employed a targeted miRNA expression analysis approach with limited sample size, often resulting in conflicting or irreproducible results. In this two-stage study, we identified several placenta-derived miRNAs associated with birthweight in Phase 1, which were further confirmed in Phase 2, minimizing the chance of false positive results.
We observed most robust associations for miR-1290, miR-195, and miR-328 in relation to birthweight, where, respectively, 33.1%, 46.5%, and 64.8% of the total effect of these miRNAs were mediated via gestational age. Our data showed that gestational age not only mediated but also moderated the effect of these miRNAs on birthweight. Specifically, a stronger effect of these miRNAs on birthweight was observed among infants who were delivered early in gestation (all P-for-interaction <0.05). These three miRNAs also showed significant associations with gestational age, where higher expression of miR-1290 and miR-195 and lower expression of miR-328 was associated with early termination of pregnancy. Future studies are warranted to validate our findings and assess miR-1290, miR-195, and miR-328 as potential biomarkers to predict fetal growth and the risk of early delivery. Studies have shown that placenta-derived miRNAs can be detected in maternal circulation, as they are released from placental tissues into the circulation encased in small vesicles, known as exosomes [Citation15]. A nested case-control study in Mexico reported that the expression of miR-1290 in the extracellular vesicles collected from 2nd trimester maternal blood was negatively associated with birthweight-for-gestational age Z-score [Citation21]. However, the study was exploratory in nature and the observed association was not confirmed in a validation cohort. We also found significant positive association for miR-720 in relation to birthweight; however, this miRNA has recently been identified as a fragment of a transfer RNA (tRNA) and subsequently removed from the miRbase database [Citation38].
The mechanisms how placenta-derived miRNAs may regulate birthweight are not well understood. Evidence from observational and experimental studies indicates that fetal hypoxia plays a critical role in fetal growth [Citation39–Citation41]. Hypoxia triggers oxidative stress by generating oxygen-derived free radicals. Placental oxidative stress is considered to be one of the major factors responsible for placental dysfunction and remodeling [Citation42]. Interestingly, of the 49 miRNAs we selected in Phase 1 for further analysis based on their associations with gestational age and/or the extreme birthweight groups, 13 miRNAs (let-7g, miR-15a, miR-16, miR-20b, miR-21, miR-27a, miR-181a, miR-181c, miR-195, miR-199a, miR-320, miR-373, and miR-424) were reported to be regulated by hypoxia [Citation43,Citation44]. Six of these miRNAs (miR-27a, miR-181a, miR-181c, miR-195, miR-199a, miR-424) showed significant associations with birthweight and/or gestational age at the level of P <0.05, while miR-27a and miR-195 showed significant indirect effect associations with birthweight at the level of FDR <0.05 in Phase 2 analysis.
miR-195 is a member of the miR-15 gene family, along with miR-424 and miR-15a, and has been reported to be dysregulated in response to cellular hypoxia in experimental studies [Citation44,Citation45]. For example, in ATDC 5 cell, a resident cartilage cell adapted to function in chronic hypoxic condition, miR-195 was downregulated, coupled with a reciprocal upregulation of its direct target, hypoxia initiation factor 1 alpha (HIF-1α)[Citation13]. HIF1α is a transcription factor and considered to be the master regulator of cellular hypoxia. HIF1α has been linked with transcription of many genes, including genes that encode erythropoietin (EPO), vascular endothelial growth factor (VEGF), and glucose transporter 1 (GLUT1) [Citation46]; the protein products of these genes are responsible for oxygen and nutrient transfer and glucose entry across cell membrane [Citation47–Citation49]. Therefore, downregulation of miR-195 in the placenta could potentially lead to increased oxygen and nutrient supply to the fetus via upregulation of HIF1α in the placenta and vice versa. Observational and experimental studies have also reported downregulation of FLT3, BCL-2, M-Ras, and A-Raf-1 in relation to higher cellular expression of miR-195 (); the protein products of these genes are responsible for cell growth and differentiation, apoptosis, proliferation, and bone marrow hematopoietic cell differentiation [Citation50–Citation52].
Figure 4. Networks of miR-1290 and miR-195 with experimentally validated target genes. The green lines connecting the nodes represent activation, whereas the red lines connecting the nodes represent inhibition. The arrow indicates the direction of the association.
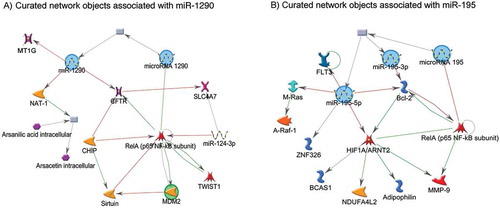
On the other hand, experimental studies have validated that miR-1290 has binding sites on MT1G, MT1H, CYP4F11, NAT-1 genes, and thereby downregulates the expression of these genes [Citation53,Citation54]. The protein product of these genes are responsible for arsenic and folate metabolism [Citation55], metal transport and elimination [Citation53], and cellular protection from free radical-induced oxidative damage [Citation56]. Therefore, higher expression of miR-1290 in the placenta may result in increased arsenic toxicity. In this study, we observed that the effect of miR-1290 on birthweight was stronger when the arsenic concentration was higher in cord blood. In utero arsenic exposure has been associated with increased risk of preterm birth [Citation57] and lower birthweight [Citation27] in this population. Therefore, higher expression of miR-1290 in the placenta could potentially influence birthweight via shortened gestational age and increased arsenic toxicity. Future studies are needed to experimentally validate these postulations.
Our study has some limitations. Study participants selected in Phase 1 and Phase 2 were not completely independent: 52 participants were included in both study phases. In Phase 1, we implemented an extreme phenotype sampling design and selected two extreme birthweight groups from both tails of the birthweight distribution. In Phase 2, we selected a random sample of the full cohort without excluding samples that were selected in Phase 1. While this sampling strategy limited our ability to replicate findings in an independent cohort, it gained us predictive power in Phase 1 (because of the extreme phenotype design) and protected us from penalization for any loss of variance in birthweight distribution in Phase 2 analyses (because of not excluding participants with extreme birthweight). It also enabled our Phase 2 results to have a population-level inference. We conducted a sensitivity analysis excluding the 52 duplicate samples from our Phase 2 cohort and found consistent results in relation to gestational age (Table S5). However, the association between miRNA expression and birthweight was largely attenuated in terms of both the strength of association and statistical significance for most miRNAs. This could be due to the loss of variance in birthweight distribution in our Phase 2 cohort in addition to the loss of power because of a loss of sample size. We encourage validating our findings in external population to address this limitation. Other limitations of the study include the lack of epigenome-wide coverage of our selected miRNA expression platform in Phase 1, which likely have limited our ability to identify some miRNAs, especially the novel ones.
Our study has several strengths. The two-stage study design allowed us to validate our Phase 1 results in the Phase 2 cohort, reducing the risk of false discovery. In a two-stage design, however, technical variations may arise when different expression platforms are used, which potentially could introduce bias if not accounted for during the data analysis stage. In both phases of our study, we used miRNA expression platform based on qRT-PCR technology, which is considered as the ‘gold standard’ for small RNA quantification. Furthermore, we constructed surrogate variables and included those variables in all phases of data analysis as covariates to account for known or unknown, biological or technical variations that are common in high throughput gene expression studies [Citation58]. Furthermore, epigenetic signatures are tissue-specific; it is important to measure these signatures in the tissue biologically most relevant to the exposure and outcome of interest. The placenta is likely the organ to express the strongest signal of any in utero perturbations related to fetal growth. Moreover, we examined the link between placenta-derived miRNAs and birthweight accounting for environmental exposure during the in utero period, when the critical window is narrow, and the fetus is most susceptible to environmental exposures.
Our results suggested that some placenta-derived miRNAs were significantly associated with birthweight, and that the effects of these miRNAs were primarily mediated via changing gestational age. The effect of placenta-derived miRNAs on birthweight was also modified by gestational age and in utero arsenic exposure, where a stronger effect was observed among infants delivered early in gestation or exposed to a higher level of arsenic in cord blood. Future studies are warranted to replicate these findings in external population and evaluate placenta-derived miRNAs as early biomarkers of fetal growth.
Materials and methods
All protocols were reviewed and approved by the Human Research Committees at Harvard T.H. Chan School of Public Health and Dhaka Community Hospital Trust. All participants provided written informed consent before participating in the study.
Study population and subject selection
The study population was derived from a prospective birth cohort established in Pabna and Sirajdikhan Upazilas of Bangladesh. During 2008–2011, we enrolled 1,613 pregnant women aged ≥ 18 years with an ultrasound-confirmed singleton pregnancy of ≤ 16 weeks of gestation and followed them throughout pregnancy. Details of this study, including recruitment and enrollment criteria were previously reported [Citation25,Citation27]. At the end of follow-up, 1,184 singleton live births were recorded after exclusions due to loss of contact before delivery (n = 99), participation withdrawal (n = 121), miscarriage (n = 132), stillbirth (n = 72), and multiple pregnancies (n = 5). Placental tissue samples were collected from 1,141 participants.
We applied a two-phase study design: Phase 1 and Phase 2, with a total of 466 mother-infant pairs without a history of maternal diabetes, gestational hypertension, or preeclampsia. More details of the study design and analytical approaches appear in . In Phase 1, we applied extreme-phenotype sampling design and selected participants from both tails of the birthweight distribution. We selected 77 participants with the lowest birthweights (birthweight range: 0.8–2.2 kg) and 77 participants with the highest birthweights (birthweight range: 3.3–3.9 kg) after excluding 24 participants with low RNA quality and 8 participants with birthweight >4,000 g. This design was chosen to maximize the predictive power in Phase 1. Top-hit miRNAs screened out in Phase 1 were further analyzed in Phase 2 in a cohort of 364 participants randomly selected from the full cohort, without removing participants already selected in Phase 1. Thus, 52 participants with extreme birthweights who were already selected in Phase 1 were also selected in Phase 2.
Table 3. Effect estimates of gestational age and selected miRNAs in relation to birthweight.
Table 4. Study design and analysis work flow.
Outcome and covariates
We collected participant’s socio-demographic and medical history, including maternal age, education, and the number of past pregnancies using a structured questionnaire. Trained healthcare workers measured maternal height and weight at the time of enrollment. Total inorganic arsenic was measured in cord blood using a dynamic reaction cell inductively coupled plasma mass spectrometer (DRC-ICP-MS, DRC II, Perkin Elmer) and subsequently transformed to their natural log for analysis. Gestational age was determined by ultrasonography using crown-rump length at median 12 (range: 4–16) weeks of pregnancy. Birthweight was measured on a pediatric scale calibrated before each measurement and rounded to the nearest 10 g.
MicroRNA expression in the placenta
Placental tissue was sampled from the fetal side of the placenta within 2 hours after delivery. Two placental tissue specimens, one from the inner region proximal to the umbilical cord insertion point and one from the outer region closer to the edge, were collected to control for within-placenta variability. Methods and rationale for the sampling scheme were described previously [Citation59]. Tissue specimens were preserved in RNAlater (Ambion) to stabilize RNA and then stored at −80°C until analysis.
Total RNA, containing small RNA, was extracted from 50 mg of thawed and homogenized placenta using Qiagen miRNeasy kit (Qiagen) following manufacturer’s guidelines. RNA purity and concentration were evaluated by spectrophotometry using NanoDrop ND-2000 (ThermoFisher). RNA samples with an A260/230 ratio between 1.8–2.2 and a minimum concentration of >38 ng/μl (range: 38–687) were used to quantify miRNA expression. The quality and related size of total RNA, including small RNA was assessed by Agilent 2100 Bioanalyzer microfluidics-based platform (Agilent Technologies). RNA was transcribed into cDNA in 2 multiplex reactions, each containing 3 μL of the small RNA preparation and either TaqMan Megaplex RT primers, Human Pool A, or Pool B, and then preamplified using TaqMan Megaplex PreAmp Primers, Human Pool A, and Pool B. A total of 200 ng total RNA, containing the small RNA fraction, was used for each sample for reverse transcription with MegaplexTM.
In Phase 1, we used TaqMan Human MicroRNA assay (Applied Biosystems) to quantify 754 preconfigured human miRNAs. This system can perform multiple simultaneous real-time polymerase chain reaction (qRT-PCR) running TaqMan assays. In Phase 2, we used TaqMan qRT-PCR based QuantStudio 12K Flex OpenArray platform (Applied Biosystems) to confirm the expression of top-hit miRNAs screened out in Phase 1. A total of 54 participants out of 364 Phase 2 participants were analyzed in duplicate, while 310 participants were analyzed in triplicate. Technical duplicates were used to assess confounding and bias from technical variations within and across the phases. The quality of qRT-PCR data between Phase 1 and Phase 2 appears in Table S6.
Statistical analysis
Phase 1 analyses
The demographic characteristics between the two extreme birthweight groups were assessed by ANOVA, Chi-square tests, or Fisher’s exact test, and a two-tailed P value was reported. Data were checked for outliers using box plots, and samples with low RNA yield or absorbance were excluded. One sample with very few detectable miRNAs was also excluded from analysis. microRNA expression data were quality controlled using the following criteria: cycle threshold (Ct) <30, amplification score > 1.1, Cq confidence >0.8, and detectable expression in ≥50% samples in the extreme birthweight groups. In Phase 1, 306 miRNAs passed the quality control criteria and were used for statistical analyses. To minimize the risk of false-positive results in the evaluation of 306 miRNAs due to multiple testing, we used an arbitrary conservative cut-off of permutation P value <0.01 to determine statistical significance. Because miRNA expressions are highly correlated, and Phase 1 study was designed for screening purpose, we did not use stringent criteria to define statistical significance in this phase. To estimate permutation-based P value, we conducted 1,000 permutation tests for each miRNA and randomly paired the outcome status with each miRNA within each study participant. Observed P values were estimated for each miRNA 1,000 times using permutation simulations. Permutation-based P value was then estimated for each miRNA given the distribution of 1,000 observed P values.
Imputation was used to assess missing value effect. Two imputation strategies were applied in Phase 1. Assuming that Ct values were not missing at random but missing due to no or low expression, we imputed the missing value based on the 95th percentile of that miRNA among the extreme birthweight groups without missing value. We also used multivariate imputation by chained equation (MICE) [Citation60] under the assumption that missing values were at random as a result of a failed measurement. Test statistics for both imputed strategies were compared with that obtained in complete case analysis. Surrogate variables were constructed and were included in all association models to adjust for known/unknown biological or technical variations (e.g., batch effects) [Citation58]. Endogene normalization was applied as primary data normalization technique. The geometric mean of 3 most stable internal control miRNAs (miR-364, miR-532, miR-532-3p) was used to normalize miRNA expression data following the method described by Vendesompele et al. [Citation61]. To test the sensitivity of our results due to technical variations, we also analyzed the data on raw Ct values as well as after implementing global and quantile normalization in Phase 1 using R/Bioconductor.
In Phase 1, we screened out miRNAs associated with the extreme birthweight groups and/or gestational age using three sets of models (Model 1–3) based on our hypothesis that gestational age will mediate the effect of miRNA expressions on birthweight. Multivariate linear regression was applied to assess the association between miRNA expression and the extreme birthweight groups using miRNA expression as the dependent variable, adjusting for maternal age (continuous), infant sex (male, female), study site (Pabna vs. Sirajdikhan), and with (Model 1) and without gestational age (Model 2). Multivariate linear regression was also applied to assess the association between miRNA expression and gestational age using gestational age as the dependent variable, adjusting for maternal age, infant sex, study site, and the extreme birthweight groups (Model 3). All models were additionally adjusted for surrogate variables previously constructed. Statistical analyses were applied separately for each miRNA for each normalization method.
Top-hit microRNAs were selected for further analysis in Phase 2 if the following criteria were met: 1) a miRNA showed statistically significant association with either the extreme birthweight groups or gestational age in at least 2 out of 4 normalization methods at the level of permutation P <0.01; or 2) a miRNA showed statistically significant association with either the extreme birthweight groups or gestational age in any normalization method at the level of permutation P <0.01, but has known biological significance.
Phase 2 analyses
In Phase 2, we applied the same data quality control criteria as Phase 1. We calculated mean Ct value of each miRNA for each sample. Endogenous normalization was applied taking the geometric mean of the same three internal control miRNAs (miR-364, miR-532, miR-532-3p). Multivariate imputation by chained equation (MICE) was used to predict three missing values in miRNA expression [Citation60]. Surrogate variables were estimated and included as covariates in all association models [Citation58]. We used a significance level of false discovery rate (FDR) <0.05 to account for multiple testing.
The associations between miRNA expression and birthweight were analyzed using causal mediation analysis technique considering gestational age a mediator [Citation62]. The directed acyclic graph (DAG) in illustrates our conceptual model [Citation63]. We fit two sets of multivariate linear regressions models: the model for gestational age (mediator model, Model 4) and the model for birthweight (outcome model, Model 5).
We selected a priori the following list of covariates that were previously found to be associated with birthweight: natural log of cord blood arsenic exposure (continuous), maternal age (continuous), education (no formal education, primary, secondary or higher), enrollment BMI (<18.5, 18.5–24.9, >24.9), number of past pregnancies (0, 1, >1), infant sex, and study site in addition to the surrogate variables previously constructed to adjust for both the mediator and outcome models. The model for birthweight was additionally adjusted for gestational age. The natural direct, indirect effect, and total effects of mediation analysis were estimated combining the mediator and the outcome models (Supplemental file). Analyses were conducted with and without an interaction term between miRNA expression and gestational age. For miRNAs with statistically significant interaction with gestational age, controlled direct effect of that miRNA on birthweight was estimated at the gestational age ranging from 29 to 41 weeks. We also tested for interaction between miRNA expression and cord blood arsenic exposure in relation to birthweight. A significant interaction was present for miR-1290, but not for other miRNAs; hence, a miRNA-arsenic interaction term was added to the model for birthweight for miR-1290.
The direct and indirect effects were averaged across all study participants. Bias-corrected standard errors were computed from 10,000 bootstraps. Mediation analysis assumes that conditional on the covariates, there is no confounding of the exposure-outcome relation, exposure-mediator relation, or mediator-outcome relation and that there are no mediator-outcome confounders affected by the exposure [Citation62]. The R-package ‘mediation’ was used to conduct causal mediation analysis [Citation64]. The ‘medsens’ function of the ‘mediation’ package was used to conduct sensitivity analysis to test for unmeasured confounding assumptions for direct and indirect effects of mediation analysis.
The expression of miRNAs in the placenta was rescaled to their standard deviation (SD) to aid in interpretation and comparison of point estimates across miRNAs. Thus, effects estimate for each miRNA was presented as the mean change in the outcome of interest (gestational age or birthweight) for a 1-SD increment in the expression of respective miRNA in the placenta. The average expression of a miRNA in the placenta in full-term pregnancies (40 weeks) was considered as the baseline expression for that miRNA under the normal physiological condition, assuming that the expression of placenta-derived miRNAs temporarily precedes gestational age. To test whether our assumption of the temporal relation between miRNA expression and gestational age in relation to birthweight was valid, we conducted a sensitivity analysis using three sets of models (Model 5–7).
We compared the effect estimate of gestational age in relation to birthweight between models adjusted for miRNA expression and not adjusted for miRNA expression (Model 7 vs. Model 5), in addition to previously selected confounding variables (C). Similarly, we compared the effect estimate of a miRNA in relation to birthweight between models adjusted for gestational and not adjusted for gestational age, in addition to the same set of covariates (Model 7 vs. Model 6). If miRNA expression were an intermediate variable for the association between gestational age and birthweight, we would see a change in the effect estimate of gestational age in relation to birthweight between Model 7 vs. Model 5. Similarly, if gestational age were an intermediate variable for the association between miRNA expression and birthweight, we would see a change in the effect estimate for a specific miRNA in relation to birthweight between Model 7 vs. Model 6. We conducted this analysis for each miRNA that was significantly associated with birthweight.
We used MetaCore (GeneGo) bioinformatics tool to identify experimentally validated mRNA targets of top-hit miRNAs and constructed miRNA-mRNA interaction networks. MetaCore was also used to conduct gene enrichment analysis by process networks and pathway maps of top-hit miRNAs with in silico predicted targets with a TargetScan total context score <-0.2 [TargetScan v7.1]). All analyses were conducted in R, version 3.2.2 (Austria, Vienna) and STATA, version 14.0 (College Station, TX).
Supplemental Material
Download Zip (172.8 KB)Disclosure statement
No potential conflict of interest was reported by the authors.
Supplementary material
supplemental data for this article can be accessed here.
Additional information
Funding
Related Research Data
References
- Barker DJ. The developmental origins of chronic adult disease. Acta Paediatr Suppl. 2004;93:26–33.
- Curhan GC, Willett WC, Rimm EB, et al. Birth weight and adult hypertension, diabetes mellitus, and obesity in US men. Circulation. 1996;94:3246–3250.
- Kramer MS. Determinants of low birth weight: methodological assessment and meta-analysis. Bull World Health Organ. 1987;65:663–737.
- Gude NM, Roberts CT, Kalionis B, et al. Growth and function of the normal human placenta. Thromb Res. 2004;114:397–407.
- Morgan TK. Role of the Placenta in preterm birth: a review. Am J Perinatol. 2016;33:258–266.
- Marsit CJ. Placental epigenetics in children’s environmental health. Semin Reprod Med. 2016;34:36–41.
- Baccarelli A, Bollati V. Epigenetics and environmental chemicals. Curr Opin Pediatr. 2009;21:243–251.
- Lee RC, Feinbaum RL, Ambros V. The C. elegans heterochronic gene lin-4 encodes small RNAs with antisense complementarity to lin-14. Cell. 1993;75:843–854.
- Friedman RC, Farh KK, Burge CB, et al. Most mammalian mRNAs are conserved targets of microRNAs. Genome Res. 2009;19:92–105.
- Calin GA, Croce CM. MicroRNA signatures in human cancers. Nat Rev Cancer. 2006;6:857–866.
- Hagen JW, Lai EC. microRNA control of cell-cell signaling during development and disease. Cell Cycle. 2008;7:2327–2332.
- Pineles BL, Romero R, Montenegro D, et al. Distinct subsets of microRNAs are expressed differentially in the human placentas of patients with preeclampsia. Am J Obstet Gynecol. 2007;196:261 e1–6.
- Bai Y, Yang W, Yang HX, et al. Downregulated miR-195 detected in preeclamptic placenta affects trophoblast cell invasion via modulating ActRIIA expression. PLoS One. 2012;7:e38875.
- Enquobahrie DA, Abetew DF, Sorensen TK, et al. Placental microRNA expression in pregnancies complicated by preeclampsia. Am J Obstet Gynecol. 2011;204:178.e12–21.
- Fu G, Brkic J, Hayder H, et al. MicroRNAs in human placental development and pregnancy complications. Int J Mol Sci. 2013;14:5519–5544.
- Betoni JS, Derr K, Pahl MC, et al. MicroRNA analysis in placentas from patients with preeclampsia: comparison of new and published results. Hypertens Pregnancy. 2013;32:321–339.
- Chen DB, Wang W. Human placental microRNAs and preeclampsia. Biol Reprod. 2013;88:130.
- Hromadnikova I, Kotlabova K, Ivankova K, et al. First trimester screening of circulating C19MC microRNAs and the evaluation of their potential to predict the onset of preeclampsia and IUGR. PLoS One. 2017;12:e0171756.
- Li Q, Long A, Jiang L, et al. Quantification of preeclampsia-related microRNAs in maternal serum. Biomed Rep. 2015;3:792–796.
- Mayor-Lynn K, Toloubeydokhti T, Cruz AC, et al. Expression profile of microRNAs and mRNAs in human placentas from pregnancies complicated by preeclampsia and preterm labor. Reprod Sci. 2011;18:46–56.
- Rodosthenous RS, Burris HH, Sanders AP, et al. Second trimester extracellular microRNAs in maternal blood and fetal growth: an exploratory study. Epigenetics. 2017.
- Wang D, Na Q, Song WW, et al. Altered Expression of miR-518b and miR-519a in the placenta is associated with low fetal birth weight. Am J Perinatol. 2014;31:729–734.
- Song GY, Song WW, Han Y, et al. Characterization of the role of microRNA-517a expression in low birth weight infants. J Dev Orig Health Dis. 2013;4:522–526.
- Rager JE, Bailey KA, Smeester L, et al. Prenatal arsenic exposure and the epigenome: altered microRNAs associated with innate and adaptive immune signaling in newborn cord blood. Environ Mol Mutagen. 2014;55:196–208.
- Rahman ML, Kile ML, Rodrigues EG, et al. Prenatal arsenic exposure, child marriage, and pregnancy weight gain: associations with preterm birth in Bangladesh. Environ Int. 2018;112:23–32.
- Kile ML, Cardenas A, Rodrigues E, et al. Estimating effects of arsenic exposure during pregnancy on perinatal outcomes in a Bangladeshi cohort. Epidemiology. 2016;27:173–181.
- Rahman ML, Valeri L, Kile ML, et al. Investigating causal relation between prenatal arsenic exposure and birthweight: are smaller infants more susceptible? Environ Int. 2017;108:32–40.
- Hromadnikova I, Kotlabova K, Hympanova L, et al. Cardiovascular and cerebrovascular disease associated microRNAs are dysregulated in placental tissues affected with gestational hypertension, preeclampsia and intrauterine growth restriction. PLoS One. 2015;10:e0138383.
- Hromadnikova I, Kotlabova K, Hympanova L, et al. Gestational hypertension, preeclampsia and intrauterine growth restriction induce dysregulation of cardiovascular and cerebrovascular disease associated microRNAs in maternal whole peripheral blood. Thromb Res. 2016;137:126–140.
- Huang L, Shen Z, Xu Q, et al. Increased levels of microRNA-424 are associated with the pathogenesis of fetal growth restriction. Placenta. 2013;34:624–627.
- Choi SY, Yun J, Lee OJ, et al. MicroRNA expression profiles in placenta with severe preeclampsia using a PNA-based microarray. Placenta. 2013;34:799–804.
- Wu L, Zhou H, Lin H, et al. Circulating microRNAs are elevated in plasma from severe preeclamptic pregnancies. Reproduction. 2012;143:389–397.
- Li H, Ge Q, Guo L, et al. Maternal plasma miRNAs expression in preeclamptic pregnancies. Biomed Res Int. 2013;2013:970265.
- Zhang C, Li Q, Ren N, et al. Placental miR-106a approximately 363 cluster is dysregulated in preeclamptic placenta. Placenta. 2015;36:250–252.
- Ura B, Feriotto G, Monasta L, et al. Potential role of circulating microRNAs as early markers of preeclampsia. Taiwan J Obstet Gynecol. 2014;53:232–234.
- Xu P, Zhao Y, Liu M, et al. Variations of microRNAs in human placentas and plasma from preeclamptic pregnancy. Hypertension. 2014;63:1276–1284.
- Hu Y, Li P, Hao S, et al. Differential expression of microRNAs in the placentae of Chinese patients with severe pre-eclampsia. Clin Chem Lab Med. 2009;47:923–929.
- Schopman NC, Heynen S, Haasnoot J, et al. A miRNA-tRNA mix-up: tRNA origin of proposed miRNA. RNA Biol. 2010;7:573–576.
- de Grauw TJ, Myers RE, Scott WJ. Fetal growth retardation in rats from different levels of hypoxia. Biol Neonate. 1986;49:85–89.
- Liu S, Wen SW, Demissie K, et al. Maternal asthma and pregnancy outcomes: a retrospective cohort study. Am J Obstet Gynecol. 2001;184:90–96.
- Vaezi A, Haghighi L, Beigmohammadi F, et al. Maternal asthma, pregnancy, delivery and birth outcomes: a retrospective cohort study. Iran J Allergy Asthma Immunol. 2017;16:92–98.
- Wu F, Tian FJ, Lin Y, et al. Oxidative stress: placenta function and dysfunction. Am J Reprod Immunol. 2016;76:258–271.
- Whitehead CL, Teh WT, Walker SP, et al. Circulating MicroRNAs in maternal blood as potential biomarkers for fetal hypoxia in-utero. PLoS One. 2013;8:e78487.
- Kulshreshtha R, Davuluri RV, Calin GA, et al. A microRNA component of the hypoxic response. Cell Death Differ. 2008;15:667–671.
- Bai R, Zhao AQ, Zhao ZQ, et al. MicroRNA-195 induced apoptosis in hypoxic chondrocytes by targeting hypoxia-inducible factor 1 alpha. Eur Rev Med Pharmacol Sci. 2015;19:545–551.
- Nakayama K. Cellular signal transduction of the hypoxia response. J Biochem. 2009;146:757–765.
- Gaither K, Quraishi AN, Illsley NP. Diabetes alters the expression and activity of the human placental GLUT1 glucose transporter. J Clin Endocrinol Metab. 1999;84:695–701.
- Ostlund E, Lindholm H, Hemsen A, et al. Fetal erythropoietin and endothelin-1: relation to hypoxia and intrauterine growth retardation. Acta Obstet Gynecol Scand. 2000;79:276–282.
- Regnault TR, de Vrijer B, Galan HL, et al. The relationship between transplacental O2 diffusion and placental expression of PlGF, VEGF and their receptors in a placental insufficiency model of fetal growth restriction. J Physiol. 2003;550:641–656.
- McCubrey JA, Steelman LS, Chappell WH, et al. Roles of the Raf/MEK/ERK pathway in cell growth, malignant transformation and drug resistance. Biochim Biophys Acta. 2007;1773:1263–1284.
- Zhang GL, He ZM, Shi XM, et al. Discordant HIF1A mRNA levels and oxidative stress in placental shares of monochorionic twins with selective intra-uterine growth restriction. Placenta. 2015;36:297–303.
- Zamudio S, Wu Y, Ietta F, et al. Human placental hypoxia-inducible factor-1alpha expression correlates with clinical outcomes in chronic hypoxia in vivo. Am J Pathol. 2007;170:2171–2179.
- Zhang WC, Chin TM, Yang H, et al. Tumour-initiating cell-specific miR-1246 and miR-1290 expression converge to promote non-small cell lung cancer progression. Nat Commun. 2016;7:11702.
- Endo Y, Yamashita H, Takahashi S, et al. Immunohistochemical determination of the miR-1290 target arylamine N-acetyltransferase 1 (NAT1) as a prognostic biomarker in breast cancer. BMC Cancer. 2014;14:990.
- Sim E, Abuhammad A, Ryan A. Arylamine N-acetyltransferases: from drug metabolism and pharmacogenetics to drug discovery. Br J Pharmacol. 2014;171:2705–2725.
- Ruttkay-Nedecky B, Nejdl L, Gumulec J, et al. The role of metallothionein in oxidative stress. Int J Mol Sci. 2013;14:6044–6066.
- Rahman ML, Kile ML, Rodrigues EG, et al. Prenatal arsenic exposure, child marriage, and pregnancy weight gain: associations with preterm birth in Bangladesh. Environ Int. 2017;112:23–32.
- Leek JT, Storey JD. Capturing heterogeneity in gene expression studies by surrogate variable analysis. PLoS Genet. 2007;3:1724–1735.
- Adibi JJ, Hauser R, Williams PL, et al. Placental biomarkers of phthalate effects on mRNA transcription: application in epidemiologic research. Environ Health. 2009;8:20.
- White IR, Royston P, Wood AM. Multiple imputation using chained equations: issues and guidance for practice. Stat Med. 2011;30:377–399.
- Vandesompele J, De Preter K, Pattyn F, et al. Accurate normalization of real-time quantitative RT-PCR data by geometric averaging of multiple internal control genes. Genome Biol. 2002;3. research0034.1–research0034.11.
- Valeri L, Vanderweele TJ. Mediation analysis allowing for exposure-mediator interactions and causal interpretation: theoretical assumptions and implementation with SAS and SPSS macros. Psychol Methods. 2013;18:137–150.
- Hernan MA. A definition of causal effect for epidemiological research. J Epidemiol Community Health. 2004;58:265–271.
- Tingley D, Yamamoto T, Hirose K, et al. mediation: R package for causal mediation analysis. J Stat Softw. 2013;59:1–38.