
 ?Mathematical formulae have been encoded as MathML and are displayed in this HTML version using MathJax in order to improve their display. Uncheck the box to turn MathJax off. This feature requires Javascript. Click on a formula to zoom.
ABSTRACT
Telomere length (TL) has been established as a biomarker of aging and aging-related health outcomes, but showed only a weak or inconsistent association with all-cause mortality in previous epidemiological studies. Recently, an epigenetic ‘mortality risk score’ (MS) based on whole blood DNA methylation at 10 mortality-related CpG sites has been demonstrated to be strongly related to all-cause mortality at the population level. This study aimed to address the association between TL and this MS, and to assess and compare their associations with all-cause mortality. The MS was derived from the DNA methylation profiles measured by Illumina Human Methylation450K Beadchip and TL was measured by quantitative PCR at baseline among 1517 participants aged 50–75 of the German ESTHER cohort study. In cross-sectional bi- and multivariable analyses, the MS was strongly associated and showed monotonic dose-response relationships with TL (p-values <0.05). However, only the MS but not TL was associated with all-cause mortality during a median follow-up of 12.5 years. After controlling for potential covariates and TL, hazard ratios (95% CI) for all-cause mortality for low, moderate and high levels of the MS defined by 1, 2–5 and >5 CpG sites with aberrant methylation were 2.24 (1.13–4.41), 3.31 (1.76–6.22) and 6.33 (3.22–12.41) compared to a MS of 0, respectively. Our investigation shows that the epigenetic-based MS is strongly associated with TL, a broadly accepted aging biomarker, and at the same time shows much stronger associations with all-cause mortality than the latter.
Introduction
Telomeres are nucleo-protein complexes located at the ends of eukaryotic chromosomes which are actively involved in chromosomal protection, replication and integration [Citation1]. In peripheral blood lymphocytes, telomere length (TL) varies among individuals, and gradually shortens by 50 to 100 base pairs (bp) with each cell division; this results in a gradual telomere attrition with increasing age [Citation2]. Critically short telomere can cause cell senescence and apoptosis [Citation3]. To date, TL has been increasingly recognized as one of the most prominent aging-related biomarkers because of its identified associations with a number of aging-related diseases, including cardiovascular disease (CVD), diabetes, Alzheimer’s disease, cancers and disease-specific mortality [Citation4–Citation9]. However, its association with all-cause mortality was found to be weak and inconsistent based on previous meta-analyses [Citation10,Citation11].
DNA methylation, one of the most studied and stable epigenetic modifications, is capable of controlling gene expression of common traits and influencing the development of aberrant health outcomes under external exposures [Citation12]. Previous epigenome-wide association studies (EWASs) based on whole blood DNA methylation have identified numerous CpG sites that are associated with aging [Citation13], various cancers and other chronic diseases [Citation14,Citation15], as well as with many forms of exogenous exposures and lifestyle-related factors, such as environmental pollutants [Citation16], body mass index (BMI) [Citation17], alcohol consumption [Citation18] and smoking [Citation18,Citation19]. DNA methylation signatures have furthermore been considered as potential indicators of mortality from specific diseases and consequently with all-cause mortality [Citation20]. In a recent EWAS with approximately 1900 older adults followed for 14 years and an external validation among 1727 participants, we found a total of 58 CpG sites within 19 chromosomes that were associated with all-cause mortality [Citation21]. We further constructed a ‘mortality risk score’ (MS) based on the 10 most robustly mortality-related loci, which was a strong and informative predictor of all-cause, cancer and CVD mortality. As the identified CpG sites were mapped in genes known to be related to various diseases, this MS linked the DNA methylation of common disease related genes and the mortality risks in the general population.
TL has been found to be associated with epigenetic alterations across different populations and environmental exposures [Citation22–Citation24]. TL was not only associated with the global methylations among young adults [Citation23], but also associated with specific DNA methylation changes in response to gestational age among placental samples and in response to smoking exposure among older adults [Citation22,Citation24], respectively. Given that, we hypothesized that TL might be associated with the MS and hence the MS might be able to reflect the aging process which the TL is involved in. In the present study, we performed a comprehensive investigation to determine the cross-sectional association of the TL with MS in a large population-based study of older adults in Germany, and to assess and compare the associations of both indicators with all-cause mortality during a median follow-up of 12.5 years.
Results
Participant characteristics
Baseline characteristics of the 1517 participants and the subsets based on TL quintiles are shown in . Overall, the average age at baseline was about 62 years. More than half of the participants were ever smokers (current or former smokers). The majority of participants were overweight or obese, consumed no or low amounts of alcohol and reported no or only low physical activity. As described in the Method section, the MS can take values from 0 to 10. More than half of the participants had a MS more than 1, and around 45% had a MS of 2–5. During a median follow-up time of 12.5 years until 2014, 284 participants died, of whom 94 died from CVD, 107 died from cancers and 83 died from other diseases.
Table 1. Characteristics of the ESTHER study participants at baseline according to quintiles of telomere length a.
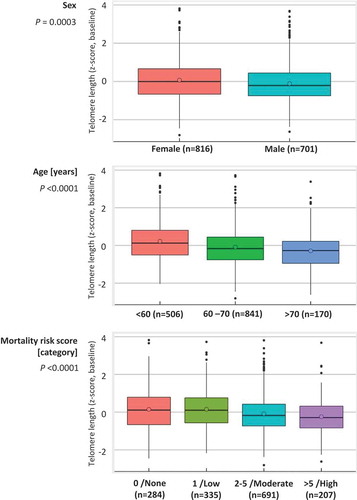
The participants with longer TL (quintiles 4 & 5) less often had a moderate (2–5)/high (>5) MS compared to the remaining participants (quintiles 1–3) in the total population and both subgroups of the ESTHER study ( & S1). demonstrates the distributions of the TL z-score according to sex, age group and the MS category. Median values of the TL z-score at baseline were higher in female than in male participants. TL z-scores at baseline showed inverse associations with age and the MS. In line with this, Table S2 shows that people with moderate/high MS had shorter TL compared to the remaining participants. People with high MS included higher proportions of men and current smokers, and more often had major diseases than other participants.
Figure 1. Distributions of telomere length of the ESTHER study participants at baseline according to sex, age and mortality risk score.
Association of the mortality risk score with telomere length
Results of the multivariable linear regression analyses for the cross-sectional associations are shown in . The MS was strongly associated with the baseline TL z-score after controlling for age, sex and the study population subgroup. Additional adjustment for other potential covariates did not alter this pattern in any relevant manner. Additionally analyses for the association between the MS and TL z-score were performed in subgroups of participants. TL showed strong associations with the MS among both participants who stayed alive and participants who died during follow-up (Table S3), as well as among both never and ever smokers (Table S4).
Table 2. Association of mortality risk score with telomere length (z-score) at baseline.
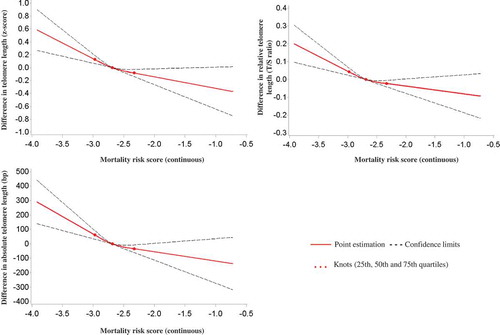
Furthermore, we explored the dose-response relationships of the continuous MS with the TL z-score by employing restricted cubic spline regression. As illustrated in , monotonic negative dose-response relationships with respect to TL were observed. A 0.5-unit increase in the continuous MS was roughly associated with a 0.3-unit decrease in the TL z-score, which corresponds with a 0.1-T/S ratio unit decrease in RTL and a 100-bp decrease in ATL.
Figure 2. Graphs of the best-fitting models for the associations of the continuous mortality risk score with telomere length (z-score, relative & absolute).
Associations of telomere length and the mortality risk score with all-cause mortality
presents the associations of the TL z-score and the MS with all-cause mortality among the 1517 participants during a median follow-up time of 12.5 years. No association was observed between the TL (quintiles/continuous) and all-cause mortality. By contrast, a robust and very strong association was observed between the MS and all-cause mortality, which persisted after controlling for multiple covariates including TL. Hazard ratios (95% CI) for low, moderate and high MS were 2.24 (1.13–4.41), 3.31 (1.76–6.22) and 6.33 (3.22–12.41) compared to a MS of 0, respectively, and a one unit increase in the continuous MS went along with a 2.64 (95% CI: 1.98–3.52) fold increase in the mortality after full adjustment for potential covariates and the TL. The associations of the TL z-score and the MS with CVD and cancer mortality showed similar patterns but with wider confidence intervals (Table S5).
Table 3. Associations of baseline telomere length (z-score) and mortality risk score with all-cause mortality.
A sensitivity analysis was performed by further controlling for other mortality risk factors (i.e.: fasting glucose, CRP, total cholesterol, triglycerides, HDL and systolic blood pressure) in the fully-adjusted model. The MS still showed strong associations with all-cause mortality. For the categorial MS, hazard ratios (95% CI) for the low, moderate and high MS were 2.95 (0.98–8.93), 4.94 (1.74–13.98) and 11.34 (3.68–34.95) compared to a MS of 0, respectively, and a one unit increase in the continuous MS indicated a 3.71 (95% CI: 2.36–5.85) fold increase in the mortality risk.
We additionally performed subgroup analyses on the association between the MS and the mortality based on smoking status. Table S6 demonstrates that the MS remained strongly associated with all-cause mortality in both subgroups of never and ever smokers.
Discussion
In this study, we investigated the associations of TL with an epigenetic MS in a population-based cohort of older adults. In a cross-sectional analysis of 1517 participants, we observed that this MS was strongly associated with TL at baseline after controlling for multiple potential confounders, and the continuous MS further manifested a monotonic dose-response association with TL. Whereas TL at baseline was not associated with all-cause mortality, the MS showed strong, monotonic associations with all-cause mortality during a median follow-up of 12.5 years. Similar results were observed with respect to CVD and cancer mortality, even though confidence intervals became wider due to the lower numbers of deaths. This study may thus shed some light on the association between epigenetic changes and aging-related outcomes that are tagged by telomeres, and provide evidence for the potential use of the MS in the assessment of accelerated aging and mortality risks.
To our best knowledge, this is the first study providing a direct comparison of TL and mortality-related DNA methylation changes. Aging is a complex, dynamic and multifaceted process that is related to increased all-cause mortality via gradual accumulation of various molecular and cellular damages [Citation25,Citation26]. The identified linkages between the MS and TL in our study might partly indicate the epigenetic mechanisms underlying the association between accelerated aging and TL. As previously reported, tobacco smoking is one of the strongest factors that account for aging by accelerating the shortening of telomeres [Citation27,Citation28]. A recent systematic review and meta-analysis based on 84 studies even showed that TL was shorter among ever smokers compared to never smokers [summary standard mean difference: −0.11 (95% CI: −0.16 to −0.07)] [Citation29]. Among the 10 CpG sites that were used to build the MS, four loci are smoking-related CpG sites, including cg01612140 (6q14.1), cg05575921 (AHRR), cg06126421 (6p21.33) and cg19572487 (RARA) [Citation19]. More intriguingly, their combination with another six mortality-related CpG sites manifested a clearer dose-response relationship with the TL at baseline and was highly associated with all-cause mortality. Subgroup analyses by smoking status showed consistent associations of the MS with both TL and mortality among both never and ever smokers, which suggests that the MS reflects more than the smoking-related mortality risks. As TL was associated with the MS but not with mortality, the associations of MS with TL and mortality might reflect different mechanisms whose elucidation should be aimed for in further research.
A key question is to what extent and in which direction the cross-sectional association between TL and the MS observed in this analysis, as well as the association between the MS and mortality, are causal. A possible approach to explore this causality is Mendelian randomization (MR) by using selected genetic traits (i.e. SNP) as instrumental variables (IVs). This method enables us to examine causal relationships in observational studies and is less vulnerable to confounding and reverse causation than ‘classical’ observational studies. Although genetic variants associated with TL have been identified [Citation30], the proximal genetic variants that are related to DNA methylation changes, termed as the methylation quantitative trait loci (mQTLs), have not been fully disclosed with respect to the 10 mortality-related loci yet. Only the mQTLs for three smoking-related CpG sites out of the 10 loci have been identified within the window of ± 50 kb from each site [Citation31]. More mQTLs for other mortality-related CpG sites along with other identified SNPs are required for the purpose of performing comprehensive MR analyses to clarify the causal association between both indicators as IVs and the nature of the association between the MS and risk of death from any causes.
Our findings additionally revealed the discrepancies between the MS and another popular epigenetic-based parameter for health risks, the DNA methylation age [Citation32]. Previous investigations have found that the connection between TL and DNA methylation age was quite weak and therefore suggested that DNA methylation age was not able to reflect the alterations of mitotic age, a major determinant of age-dependent telomere shortening [Citation33,Citation34]. In contrast, the MS demonstrated strong associations with TL in our study and would thereby be useful in the prediction of TL changes in the lifetime. As previously pointed out [Citation21,Citation35], the DNA methylation age was initially created for tracking chronological age rather than indicating disease-related factors. Only the latter might indeed be highly associated with telomere attrition and be reflected by the MS based on mortality-related CpG sites. Our previous study also demonstrated that the MS predicted mortality better than the DNA methylation age [Citation21].
Major strengths of the present study include comprehensive information on a broad range of covariates in a population-based cohort and the long follow-up period. Some limitations still have to be acknowledged in the interpretation of study results. First, shifts of leukocyte distribution might affect the DNA methylation and the T/S ratio of TL in whole blood samples [Citation36,Citation37]. Hence, we adjusted for leukocyte distribution by the Houseman algorithm to restrict potential confounding from differential blood counts to the greatest possible extent [Citation38]. Furthermore, the lack of follow-up DNA methylation profiles and TL data might hinder exploration of the dynamic of MS and the longitudinal association between MS and the dynamics of TL. Additionally, due to the heterogeneity of populations, further studies are needed to evaluate to what extent the MS can be generalized to other populations: in particular younger individuals and the descent of non-Europeans. Finally, our participants partly overlapped with the participants utilized in the EWAS for all-cause mortality which might raise concern about potential overestimation of the association with all-cause mortality [Citation21]. However, in our previous analysis, the MS was also highly associated with all-cause mortality in a totally independent cohort from Germany, the KORA study. Hazard ratios of KORA (95% CI) for low, moderate and high MS were 0.71 (0.20–2.46), 3.19 (1.22–8.35) and 6.33 (3.22–12.41) compared to a MS of 0, respectively, which therefore suggests major overestimation in ESTHER to be unlikely.
In recent years, there has been an increasing interest in identifying environmental, genetic and epigenetic markers that can improve our ability to predict the risks of aging and mortality. In this study, we observed that the MS not only showed a robust association with TL, one of the best established aging-related parameters, but was also a much more relevant indicator for predicting all-cause mortality compared to TL. Our finding extends evidence linking TL and epigenetic changes. Although more efforts are needed to elucidate the biological mechanisms and causality underlying their relationships, this investigation demonstrated that the epigenetic MS might provide a biologically informative, statistically robust and clinically relevant approach for predicting aging-related health outcomes in which the TL is involved and all-cause mortality at the population level. Our results need to be further validated and confirmed in additional larger cohorts with repeated estimates of TL and MS in longitudinal settings.
Methods
Study design and population
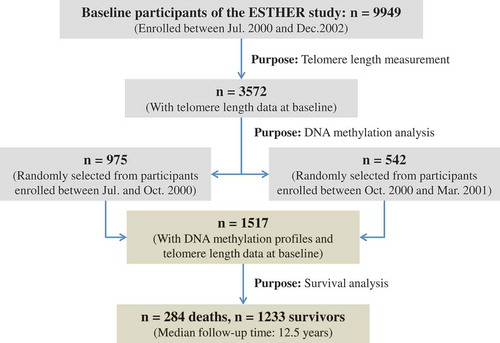
Study subjects were chosen from the ESTHER study, an ongoing statewide population-based cohort study conducted in Saarland, a state located in southwestern Germany. Details of the study design have been reported previously [Citation21,Citation39]. As shown in , 9949 older adults (aged 50–75 years) were enrolled by their general practitioners during a routine health check-up between July 2000 and December 2002, and followed up thereafter. The cross-sectional analysis of this study is based on the data and biospecimen of two subgroups collected at baseline, from 1517 participants (N group 1 = 975 and N group 2 = 542) who were randomly selected for the measurements of DNA methylation and TL among participants recruited consecutively at the start of the ESTHER study from July 2000 to October 2000 (group1) and from October 2000 to March 2001 (group2) [Citation40]. The selected participants were then regularly followed up with respect to the incidence of major chronic diseases and mortality. In particular, the 975 participants of group 1 were included in our previous EWAS on the all-cause mortality [Citation24]. The study was approved by the ethics committees of the University of Heidelberg and the state medical board of Saarland, Germany. Written informed consent was obtained from all participants.
Figure 3. Overview of the sampling procedures of participants for analysis.
Data collection
Information on socio-demographic characteristics, lifestyle factors and health status at baseline was obtained by standardized self-administered questionnaires [Citation40]. Participants were asked about their past and present smoking behaviors and were then categorized into current, former and never smokers. Information on BMI was extracted from a standardized form filled by the general practitioners during the health check-ups. Prevalent CVD at baseline was defined by either physician-reported coronary heart disease or a self-reported history of a major cardiovascular event, such as myocardial infarction, stroke, pulmonary embolism or revascularization of coronary arteries. Prevalent diabetes was defined by physician diagnosis or the use of glucose-lowering drugs. Prevalent cancer [ICD-10 C00-C99 except non-melanoma skin cancer (C44)] was determined by self-report or record linkage with data from the Saarland Cancer Registry (http://www.krebsregister. saarland.de/ziele/ziel1.html; in German).
Deaths during the follow-up of 14 years (2000–2014) were retrieved by record linkage with population registries in Saarland. Participants who moved out of Saarland were considered as censored at the date last known to be alive. Information on the causes of death was obtained from death certificates provided by local public health offices and was coded with ICD-10 codes.
Telomere length
Blood samples were taken during the health check-up and stored at -80°C until further processing. DNA from whole blood samples was collected using a salting out procedure. Both relative telomere length (RTL) and absolute telomere length (ATL) of enrolled participants were measured. As previously described [Citation28], RTL was defined as the ratio between the telomere repeat copy number measured by quantitative PCR and the number of single-copy genes (T/S ratios). Terminal Restriction Fragment Southern Blot analysis was thereafter performed in a subsample of 20 participants to validate the results from the PCR measurements and to obtain ATL in bp [Citation41]. ATL was extrapolated from RTL measures, by using the equation that was derived from linear regression of RTL against ATL among the subsample of 20 participants [Citation28].
A z-transformation was applied to standardize TL measurements across panels for eliminating batch effects, which transformed the RTL in a way that the mean is zero and the standard deviation is one (z-score) [Citation24]. In more detail, for samples from a certain batch, the z-score for each sample (s) on this batch was defined as:
where µ and σ represent the RTL mean value and standard deviation for each batch, respectively. Since ATL was extrapolated from RTL by a linear model, the z-transformed ATL was identical to the score based on RTL.
DNA methylation data
DNA methylation profiles were determined by the Illumina HumanMethylation450K Beadchip (Illumina, San Diego, CA, USA). As previously described [Citation40], samples of the two subgroups were seperately analyzed following the manufacturer’s instruction at the Genomics and Proteomics Core Facility of the German Cancer Research Center, Heidelberg, Germany. Illumina’s GenomeStudio® (version 2011.1; Illumina.Inc.) was employed to extract DNA methylation signals from the scanned arrays (Module version 1.9.0; Illumina.Inc.). The methylation level of a specific CpG site was quantified as a β value ranging from 0 (no methylation) to 1 (full methylation). According to the manufacturer’s protocol, no background correction was done and data were normalized to internal controls provided by the manufacturer. All controls were checked for inconsistencies in each measured plate. Illumina normalization and preprocessing methods implemented in Illumina’s GenomeStudio® were utilized.
As described by Zhang et al, 10 CpG sites (cg01612140, cg05575921, cg06126421, cg08362785, cg10321156, cg14975410, cg19572487, cg23665802, cg24704287 and cg25983901) were selected from the epigenome-wide data to build the MS which was defined as the cumulative number of aberrant methylated loci according to the cutoff provided in the publication (0–10) [Citation21]. The participants were further classified into four categories [MS = 0 (none), MS = 1 (low), MS = 2–5 (moderate) and MS >5 (high)]. In addition, for dose-response relationship analyses, a continuous MS was additionally constructed as the sum of the β values multiplied with the LASSO regression coefficients for all-cause mortality of each of the 10 CpG sites [Citation21].
Statistical analysis
First, major socio-demographic characteristics, lifestyle factors and the MS at baseline of all 1517 participants and subsets based on the quintiles of TL were summarized by descriptive statistics, and differences among subsets were tested for statistical significance by Kruskal-Wallis test (continuous variables) and Chi-square test (categorical variables). Distributions of the TL z-score at baseline were assessed by sex, age group (<60, 60–70 and >70 year-old) and MS category.
We then investigated the cross-sectional association of the MS with the TL z-score at baseline. Three linear regression models increasingly controlling for potential confounding factors were employed, in which the MS (category/continuous) was the predictor and the TL z-score (continuous) was the outcome. Model 1 adjusted for age (years), sex (male/female) and population subgroups. Model 2 additionally adjusted for alcohol consumption (g/day), smoking status (current/former/never smoker), BMI class [kg/m2, underweight (<18.5, <1% of the study population) or normal weight (18.5 to <25), overweight (25 to <30), obese (≥30)] and physical activity [inactive (<1h of physical activity/week), medium or high (≥2 h of vigorous or ≥2 h of light physical activity/week), low (other)]. Model 3 additionally adjusted for the leukocyte distribution estimated by the Houseman algorithm [Citation38], the prevalence of CVD (yes/no), diabetes (yes/no) and cancer (yes/no).
Furthermore, we employed restricted cubic spline regression using the SAS macro by Desquilbet et al. to evaluate the dose-response relationship of continuous MS with TL at baseline [Citation42]. All models for dose-response analyses were adjusted for age, sex, alcohol consumption, smoking status, BMI class, physical activity, the prevalence of various diseases, and the leukocyte distribution estimated by Houseman’s algorithm [Citation38]. The 25th, 50th and 75th percentiles of the MS were selected as knots.
Finally, we examined the associations of TL (quintile/continuous) and MS (category/continuous) with all-cause mortality using three multivariate Cox regression models which increasingly adjusted for potential covariates as described in the cross-sectional analyses. In addition to models including either TL or MS as predictor variable, we also evaluated their independent associations with all-cause mortality in models containing both predictors simultaneously.
All analyses were performed by SAS version 9.4 (SAS Institute Inc., Cary, NC, USA), and all statistical tests were two-sided with p-values of <0.05.
Supplemental Material
Download Zip (97.1 KB)Acknowledgements
The authors gratefully acknowledge contributions of DKFZ Genomics and Proteomics Core Facility, especially Melanie Bewerunge-Hudler and Matthias Schick, in the processing of DNA samples and performing the laboratory work, Dr. Jonathan Heiss for providing the estimation of leukocyte distribution and Ms. Chen Chen for the language assistance.
Disclosure statement
No potential conflict of interest was reported by the authors.
Supplementary Material
Supplementary data for this article can be accessed here.
Additional information
Funding
Related Research Data
References
- Blackburn EH. Structure and function of telomeres. Nature. 1991;350(6319):569–573.
- Greider CW. Telomere length regulation. Annu Rev Biochem. 1996;65:337–365.
- di Fagagna F, Reaper PM, Clay-Farrace L, et al. A DNA damage checkpoint response in telomere-initiated senescence. Nature. 2003;426(6963):194–198.
- Aviv A. Telomeres, sex, reactive oxygen species, and human cardiovascular aging. J Mol Med (Berl). 2002;80(11):689–695.
- Salpea KD, Humphries SE. Telomere length in atherosclerosis and diabetes. Atherosclerosis. 2010;209(1):35–38.
- Thomas P, O’ Callaghan NJ, Fenech M. Telomere length in white blood cells, buccal cells and brain tissue and its variation with ageing and Alzheimer’s disease. Mech Ageing Dev. 2008;129(4):183–190.
- Blasco MA. Telomeres and human disease: ageing, cancer and beyond. Nat Reviews: Genet. 2005;6(8):611–622.
- Cawthon RM, Smith KR, O’Brien E, et al. Association between telomere length in blood and mortality in people aged 60 years or older. Lancet. 2003;361(9355):393–395.
- Willeit P, Willeit J, Mayr A, et al. Telomere length and risk of incident cancer and cancer mortality. JAMA. 2010;304(1):69–75.
- Mons U, Muezzinler A, Schottker B, et al. Leukocyte telomere length and all-cause, cardiovascular disease, and cancer mortality: results from individual-participant-data meta-analysis of 2 large prospective cohort studies. Am J Epidemiol. 2017;85(12):1317–1326.
- Mather KA, Jorm AF, Parslow RA, et al. Is telomere length a biomarker of aging? A review. J Gerontol A Biol Sci Med Sci. 2011;66(2):202–213.
- Ladd-Acosta C. Epigenetic signatures as biomarkers of exposure. Curr Environ Health Rep. 2015;2(2):117–125.
- Hannum G, Guinney J, Zhao L, et al. Genome-wide methylation profiles reveal quantitative views of human aging rates. Mol Cell. 2013;49(2):359–367.
- Mikeska T, Craig JM. DNA methylation biomarkers: cancer and beyond. Genes. 2014;5(3):821–864.
- Hedman AK, Mendelson MM, Marioni RE, et al. Epigenetic patterns in blood associated with lipid traits predict incident coronary heart disease events and are enriched for results from genome-wide association studies. Circ Cardiovasc Genet. 2017;10(1):e001487. 1-13.
- Bollati V, Baccarelli A. Environmental epigenetics. Heredity (Edinb). 2010;105(1):105–112.
- Huang RC, Garratt ES, Pan H, et al. Genome-wide methylation analysis identifies differentially methylated CpG loci associated with severe obesity in childhood. Epigenetics. 2015;10(11):995–1005.
- Endo K, Li J, Nakanishi M, et al. Establishment of the methylight assay for assessing aging, cigarette smoking, and alcohol consumption. Biomed Res Int. 2015;2015:451981.
- Gao X, Jia M, Zhang Y, et al. DNA methylation changes of whole blood cells in response to active smoking exposure in adults: a systematic review of DNA methylation studies. Clin Epigenetics. 2015;7(1):113.
- Zhang Y, Schöttker B, Florath I, et al. Smoking-Associated DNA methylation biomarkers and their predictive value for all-cause and cardiovascular mortality. Environ Health Perspect. 2016;124(1):67–74.
- Zhang Y, Wilson R, Heiss J, et al. DNA methylation signatures in peripheral blood strongly predict all-cause mortality. Nat Commun. 2017;8:14617.
- Wilson SL, Liu Y, Robinson WP. Placental telomere length decline with gestational age differs by sex and TERT, DNMT1, and DNMT3A DNA methylation. Placenta. 2016;48:26–33.
- Dong Y, Huang Y, Gutin B, et al. Associations between global DNA methylation and telomere length in healthy adolescents. Sci Rep. 2017;7(1):4210.
- Gao X, Mons U, Zhang Y, et al. DNA methylation changes in response to active smoking exposure are associated with leukocyte telomere length among older adults. Eur J Epidemiol. 2016;31(12):1231–1241.
- Steves CJ, Spector TD, Jackson SH. Ageing, genes, environment and epigenetics: what twin studies tell us now, and in the future. Age Ageing. 2012;41(5):581–586.
- Vasto S, Scapagnini G, Bulati M, et al. Biomarkes of aging. Front Biosci (Schol Ed). 2010;2:392–402.
- Babizhayev MA, Yegorov YE. Smoking and health: association between telomere length and factors impacting on human disease, quality of life and life span in a large population-based cohort under the effect of smoking duration. Fundam Clin Pharmacol. 2011;25(4):425–442.
- Muezzinler A, Mons U, Dieffenbach AK, et al. Smoking habits and leukocyte telomere length dynamics among older adults: results from the ESTHER cohort. Exp Gerontol. 2015;70:18–25.
- Astuti Y, Wardhana A, Watkins J, et al. Cigarette smoking and telomere length: A systematic review of 84 studies and meta-analysis. Environ Res. 2017;158:480–489.
- Codd V, Nelson CP, Albrecht E, et al. Identification of seven loci affecting mean telomere length and their association with disease. Nature Genetics. 2013;45(4):422–7, 7e1–2.
- Gao X, Thomsen H, Zhang Y, et al. The impact of methylation quantitative trait loci (mQTLs) on active smoking-related DNA methylation changes. Clin Epigenetics. 2017;9(1):87.
- Horvath S. DNA methylation age of human tissues and cell types. Genome Biol. 2013;14(10):R115.
- Marioni RE, Harris SE, Shah S, et al. The epigenetic clock and telomere length are independently associated with chronological age and mortality. Int J Epidemiol. 2016;45(2):424–432.
- Breitling LP, Saum KU, Perna L, et al. Frailty is associated with the epigenetic clock but not with telomere length in a German cohort. Clin Epigenetics. 2016;8:21.
- Kim S, Myers L, Wyckoff J, et al. The frailty index outperforms DNA methylation age and its derivatives as an indicator of biological age. Geroscience. 2017;39(1):83–92.
- Schwartz J, Weiss ST. Cigarette smoking and peripheral blood leukocyte differentials. Ann Epidemiol. 1994;4(3):236–242.
- Lin J, Cheon J, Brown R, et al. Systematic and cell type-specific telomere length changes in subsets of lymphocytes. J Immunol Res. 2016;2016:5371050.
- Houseman EA, Accomando WP, Koestler DC, et al. DNA methylation arrays as surrogate measures of cell mixture distribution. BMC Bioinformatics. 2012;13:86.
- Schottker B, Haug U, Schomburg L, et al. Strong associations of 25-hydroxyvitamin D concentrations with all-cause, cardiovascular, cancer, and respiratory disease mortality in a large cohort study. Am J Clin Nutr. 2013;97(4):782–793.
- Gao X, Gao X, Zhang Y, et al. Associations of self-reported smoking, cotinine levels and epigenetic smoking indicators with oxidative stress among older adults: a population-based study. Eur J Epidemiol. 2017;32(5):443–456.
- Kimura M, Stone RC, Hunt SC, et al. Measurement of telomere length by the Southern blot analysis of terminal restriction fragment lengths. Nat Protoc. 2010;5(9):1596–1607.
- Desquilbet L, Mariotti F. Dose-response analyses using restricted cubic spline functions in public health research. Stat Med. 2010;29(9):1037–1057.