
 ?Mathematical formulae have been encoded as MathML and are displayed in this HTML version using MathJax in order to improve their display. Uncheck the box to turn MathJax off. This feature requires Javascript. Click on a formula to zoom.
ABSTRACT
Myalgic Encephalomyelitis/Chronic Fatigue Syndrome (ME/CFS) is a complex disease of unknown etiology. Multiple studies point to disruptions in immune functioning in ME/CFS patients as well as specific genetic polymorphisms and alterations of the DNA methylome in lymphocytes. However, potential interactions between DNA methylation and genetic background in relation to ME/CFS have not been examined. In this study we explored this association by characterizing the epigenetic (~480 thousand CpG loci) and genetic (~4.3 million SNPs) variation between cohorts of ME/CFS patients and healthy controls. We found significant associations of DNA methylation states in T-lymphocytes at several CpG loci and regions with ME/CFS phenotype. These methylation anomalies are in close proximity to genes involved with immune function and cellular metabolism. Finally, we found significant correlations of genotypes with methylation modifications associated with ME/CFS. The findings from this study highlight the role of epigenetic and genetic interactions in complex diseases, and suggest several genetic and epigenetic elements potentially involved in the mechanisms of disease in ME/CFS.
Introduction
Chronic Fatigue Syndrome (also known as Myalgic Encephalomyelitis, hereafter referred to as ME/CFS) is a canonical example of a complex, multifactorial disease with symptoms that can vary substantially between patients. ME/CFS is a debilitating multisystem disease affecting millions to tens of millions of people globally [Citation1–Citation6], with an annual economic impact between $17 and $24 billion [Citation7]. Yet the biological basis of ME/CFS remains largely unknown.
Multiple studies point to disruptions in the immune and neuroendocrine systems in ME/CFS patients [Citation8–Citation19]. ME/CFS appears to be associated with specific genetic polymorphisms [Citation20–Citation22], as well as with alterations of the DNA methylome in lymphocytes [Citation11,Citation23,Citation24]. Understanding the contribution of genetic background in ME/CFS patients as a predisposing factor for epigenetic abnormalities associated with the disease is a fundamental step to elucidate its causes. This understanding is also key for the development of tools to identify risk factors and potential treatments.
T-cell lymphocytes appear to be a primary cell type underlying immune and neuroendocrine abnormalities observed in ME/CFS patients. Functional impairment in T-cell glucocorticoid receptor and increased dexamethasone sensitivity are characteristic of some ME/CFS patients [Citation11,Citation25]. Furthermore, genetic polymorphisms within non-coding regions of T-cell receptor loci [Citation20], as well as differential methylation in CD4+ T helper lymphocytes [Citation24], have been associated with the disease. The possible interactions between genomic and T-cell epigenomic variation in ME/CFS remain unknown.
In this study, we aimed to explore the association between DNA methylation profiles of T-cells and single nucleotide polymorphisms (SNPs) in ME/CFS patients. We quantified relative proportions of major lymphocyte cell types examined in previous studies, and isolated CD3+ T-cells (including both CD4+ T helper cells and CD8+ T killer cells) via fluorescence activated cell sorting. We characterized the variation in genomic (~4.3 million SNPs) and epigenomic (~480 thousand CpG loci) variability among ME/CFS patients and healthy controls. Using this approach, we: 1) tested the association of differentially methylated CpG loci and regions in CD3+ T-cells with ME/CFS disease status; 2) tested the association of SNP genotypes with ME/CFS disease status; 3) performed a methylation quantitative trait analysis to investigate the possible interactions between genetic background and methylation phenotypes of CD3+ T-cells associated with ME/CFS disease status.
Results & discussion
Subjects, health-related quality of life survey and lymphocyte proportions
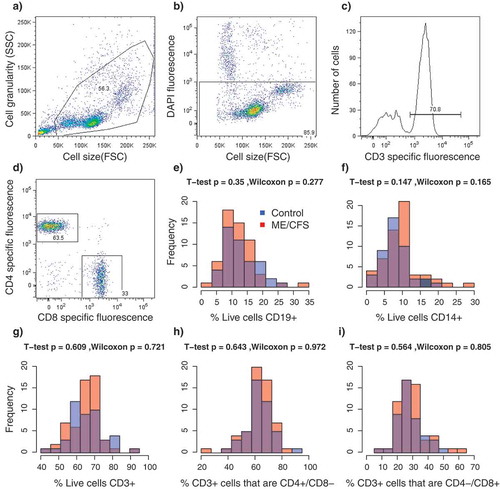
In total, 109 subjects were recruited for this study, which included 61 ME/CFS diagnosed patients receiving care at the Bateman Horne Center, Utah (46 females, 15 males) and 48 matched healthy control (36 females, 12 males) individuals. To quantify functional impairment, individuals completed the RAND-36 standardized health-related quality of life survey [Citation26]. ME/CFS patients showed significant impairment in health-related quality of life on all 8 RAND_36 scales compared to healthy controls (), In contrast, there were no differences between patients and controls in the relative proportions of CD19+ B-cells, CD14+ monocytes, CD3+ T-cells, CD4+/CD8- ‘helper’ T-cells or CD4-/CD8+ T-cells in PBMC lymphocyte samples (). Previous studies investigating potential differences in the relative proportions of these lymphocyte types in ME/CFS patients have produced incongruent results which have ranged from an increased proportion of CD8+ T cells [Citation14] to no significant differences [Citation14,Citation27]. These observations suggest that alterations of general lymphocyte type proportions may not be a common feature of ME/CFS. Rather, abnormalities in immune system functioning associated with ME/CFS might involve alterations in the activity and abundance of specific sub-populations [Citation12,Citation13,Citation28].
Figure 1. Frequency distributions of demographic and health-related indexes in the study population. (a) Body mass index; (b) Age; (c–h) RAND-36 quality of life scales. Colours indicate the healthy control (blue, n = 48) and ME/CFS (red, n = 61) subpopulations; violet indicates the overlap in distributions. p-values from T-tests and Wilcoxon rank-sum tests.
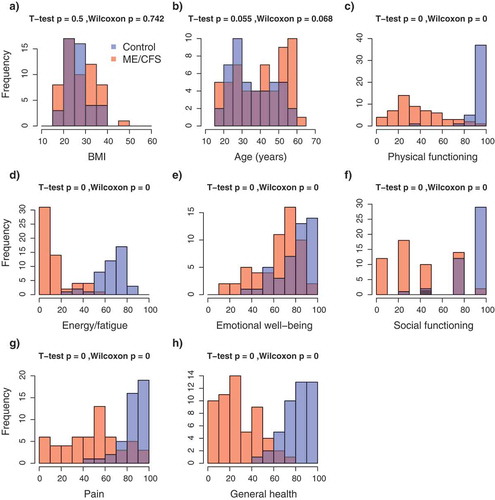
Figure 2. Results from florescence-activated cell sorting (FACS) of PBMCs. a-d Representative example of sorting parameters from one individual. (a) Total particle composition of sample before gating; (b) Gated cells showing live cells in rectangle; (c) Frequency of gated T-cells (CD3+); (d) CD4/CD8 expression on CD3+ gated cells. (e–i) Frequency distributions of relative proportions of cell types per individual. Colors indicate the healthy control (blue, n = 48) and ME/CFS (red, n = 61) subpopulations. p-values from T-tests and Wilcoxon rank-sum tests. (e) CD19+ B-cells; f) CD14+ monocytes; (g) CD3+ T-cells; (h) CD4+/CD8- T-cells; (i) CD4-/CD8+ T-cells.
Data filtering and individual exclusions
To minimize the number of false positive and negative associations, we identified and excluded data from individuals that had poor data quality, were outliers or had significant relatedness to other individuals. In addition, we excluded individuals with health-related quality of life RAND-36 measurements that overlapped between cases and controls. This exclusion of intermediate illness phenotypes was aimed at increasing the power to detect possible associations between disease status and (epi)genotypes by decreasing the heterogeneity in phenotype symptomatology within each group (see Methods section for details). In total, data from 30 individuals were excluded using this approach: 18 cases (12 females, 6 males) and 12 controls (9 females, 3 males).
Genetic associations with ME/CFS
None of the more than 2 million variable SNP loci targeted in this study with the Human Omni 5–4 Array (Illumina Inc.) had a significant association (α = 0.05) with ME/CFS after p-value corrections with Bonferroni, Holm, Benjamini and Hochberg, or permutation methods when data from both sexes were analysed together (healthy control, n = 48 vs. ME/CFS, n = 61). This result was consistent across all the χ2 and logistic regression tests ( summarize the results of the simple χ2 genotypic test as a representative example). Because of the known increased prevalence of ME/CFS in females [Citation29–Citation31], we performed independent analyses of data from females only (healthy control, n = 27 vs. ME/CFS, n = 34). These analyses revealed a significant association (χ2 genotypic test, permutation-corrected p-value = 0.0374, OR = 0.1845, 1/OR = 5.42) of one SNP (rs11712777, chr3:42347678) with the ME/CFS disease phenotype.
These results contrast with previous genotype association analyses in ME/CFS populations which have found statistically significant associations in multiple loci. The earliest study by Smith et al. [Citation22] evaluated 116,204 SNPs (n = 40 CFS, n = 40 non-ME/CFS) using the Affymetrix GeneChip Mapping 100K array, and found 65 SNPs associated with ME/CFS (p < 0.001). Rajeevan et al. [Citation21] used the Affymetrix Immune and Inflammation Chip to focus on ~11,000 SNPs located in genes involved in immune and inflammation pathways (n = 121 ME/CFS, n = 50 non-ME/CFS). Of these, 32 were associated with ME/CFS (p < 0.05). Most recently, Schlauch et al. [Citation20] evaluated 906,600 SNPs with the Affymetrix Genome-Wide SNP Array 6.0 (n = 42 ME/CFS, n = 38 non-ME/CFS) and found 442 SNPs that were associated with ME/CFS (P < 3.3 × 10⁻⁵). The SNP that we found in significant association with ME/CFS in females, rs11712777, was not included in any of these datasets. One SNP in the Schlauch et al. [Citation20] data, rs1468604, is in linkage disequilibrium (LD) with rs11712777 (r2 = 0.8716; European population). The apparent discrepancy could be explained by the imperfect linkage between the two SNPs, and therefore we recommend rs11712777 as a candidate for direct genotyping in future studies.
There were no other overlaps in the SNPs or genes associated with ME/CFS between this study and previous genetic association studies. This observation may be confounded by a combination of multiple factors, including: 1) Differences in the types of arrays utilized in each study (our study, with the largest genetic coverage to date, evaluated two-orders of magnitude more SNPs than the Rajeevan et al. [Citation21] study); 2) Differences among cohorts due to the heterogeneity of ME/CFS; 3) Reduced statistical power to discriminate the effects of multiple small-effect variants due to relatively small sample sizes in each of these studies; and 4) Interactions with environmental and epigenetic factors. Additional larger-scale genome-wide association studies with overlapping SNP probes and larger sample sizes will further our understanding of the interaction between genetic factors and ME/CFS.
Characterisation of SNP rs11712777
We used a variety of online reference resources to characterize the current knowledge of rs11712777, and how it may influence ME/CFS phenotype (see Methods section). We also examined SNPs in high LD with SNP rs11712777 (R2 ≥ 0.8; ). The Genotype-Tissue-Expression database (GTEx) indicates that rs11712777, and the genes in LD with it, form an expression quantitative trail loci (eQTL) altering the expression of the CCK (cholecystokinin peptide hormone) gene. CCK has a number of active forms, expressed in a variety of tissues, including the intestine and blood [Citation32], and plays a role in appetite, body weight and immune system function [Citation32,Citation33]. A rat knockout (KO) of the cholecystokinin B receptor (CCKBR) shows attenuated sickness behaviour [Citation34]. This sickness behaviour in rats has remarkable similarity to some of the symptoms of ME/CFS [Citation35], including fatigue, malaise, hyperalgesia, sleepiness, anhedonia, weight loss and diminished activity [Citation35]. CCK is also co-localized with sleep-promoting preoptic neurons in the hypothalamus [Citation36], which may relate to fatigue and unrefreshing sleep symptoms in ME/CFS. Finally, recent evidence suggests that CCK has a role regulating the differentiation of CD4+ T-cells [Citation37], and that CCK-expressing neurons are a critical cellular component of the hypothalamic–pituitary–adrenal axis [Citation38]. These roles of CCK in components of the immune system are consistent with suggested immune dysregulation in ME/CFS [Citation8,Citation9,Citation11–Citation15]. While CCK-associated variant rs11712777 may be a biologically relevant candidate influencing susceptibility to ME/CFS, our findings suggest that it only accounts for a small fraction of the risk (OR = 0.1845). However, it constitutes a potential target for future research.
Table 1. SNPs in high LD (R2 ≥ 0.8) with candidate SNP rs11712777 identified in this study. MAF = Minor allele frequency. Adapted from https://analysistools.nci.nih.gov/LDlink/.
In addition to rs11712777, SNP rs17223780 (R2 = 0.8799) binds DNase in CD14+ monocytes (http://www.regulomedb.org/snp/chr3/42363368), indicating a possible regulatory role in the immune system. Another SNP in the vicinity of rs11712777 (D’ = 0.7211, R2 = 0.0126), rs33449 (chr3:42400801), is associated with increased daytime resting duration (http://www.ebi.ac.uk/gwas/search?query=3:42347678-42372207; [Citation39]). This is a phenotype that may be related to the fatigue aspect of ME/CFS.
Epigenetic associations with ME/CFS
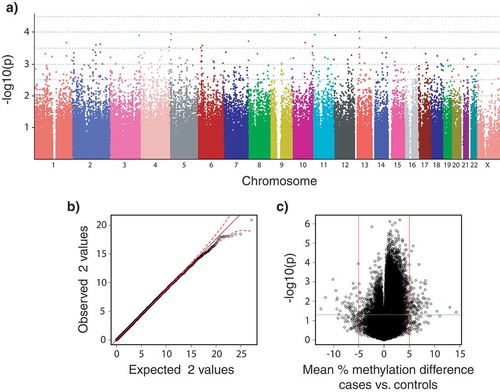
Of the 467,971 CpG loci targeted with the Human Methylation 450K Array (Illumina Inc.), 141 had significant associations with the ME/CFS phenotype (raw p-value < 0.05) and a mean percentage methylation difference between cases and controls greater than 5% when data from both sexes were analysed together ()). None of these differentially methylated loci were significant after FDR corrections, however 133 had significant empirical p-values < 0.05 calculated through permutation analyses (these are referred to as differentially methylated probes – DMPs; Supplementary Table S1). A total of 15 CpG loci were found to have significantly different variances between ME/CFS cases and controls after Benjamin and Hochberg FDR p-value adjustment. All of these overlapped with DMPs (Supplementary Table S1). Analyses of methylation data from females alone indicated that 108 CpG loci had significant asso-ciations with the ME/CFS phenotype (raw p-value ≤ 0.05) and a mean percentage methylation difference between cases and controls greater than 5%. None of these differentially methylated loci were significant after FDR corrections, however 94 DMPs had significant empirical p-values ≤ 0.05 after permutation analyses (Supplementary Table S2). Out of these 94 DMPs, 29 were common to the DMPs found when analysing the data from both sexes combined.
Figure 3. Plots summarizing the strength of associations between SNP genotypes and DNA methylation levels to disease phenotypes (healthy controls, n = 36; vs. ME/CFS cases, n = 43; sample sizes after individual exclusions) in data from males and females subpopulations. (a) Manhattan plot of p-values calculated from the simple χ2 genotypic test of association for 2,505,395 SNPs (PLINK analysis). Currently accepted genome-wide significance threshold is 5 × 10⁻⁸ (7.3 in – log10 units). Bonferroni’s adjustment significance threshold for this study is 2 × 10⁻⁸ (7.7 in – log10); (b) Quantile-quantile plots of expected vs. observed χ2 test statistics from the simple χ2 genotypic test of association. Red solid line indicates the middle of the first and third quartile of the expected distribution of the χ2 test statistics. Red dashed lines indicate the 95% confidence intervals of the expected distribution of the χ2 test statistics; (c) Volcano plot of effect size (mean percentage DNA methylation difference between ME/CFS and controls) vs. association empirical p-values calculated after 10,000 random permutations. Vertical red lines indicate biological significance threshold of 5% absolute difference in methylation at each locus. Horizontal green line indicates nominal significance threshold of p < 0.05.
Approximately half of the DMP were clustered in differentially methylated regions (DMRs). We found 17 DMRs with significant association with the ME/CFS phenotype (p-value < 0.05) when data from both sexes were analysed together (Supplementary Table S3). There were 22 DMRs when only females were considered (Supplementary Table S4). All of these regions were located nearby genes. 5 DMRs were found upstream of genes, 3 in promoters, 3 overlapping the 5ʹ end and 1 the 3ʹ end of genes, 10 inside introns, and 3 downstream of genes. DMR length, in terms of number of CpG loci ranged between 2 and 10 (average 2.72). 7 DMRs containing CpG loci identified as DMPs were detected in common between analyses of methylation data from both sexes and from females only ().
These results are in contrast with previous findings by our group, which revealed thousands to tens of thousands of differentially methylated CpG loci associated with ME/CFS in PBMCs, using the same 450K array [Citation11,Citation23]. It is possible that due to the relatively small methylation differences observed in DMPs (less than 15%, see Supplementary Table S1) in these studies may not be directly comparable when examined in the context of greater differences in ME/CFS symptom profiles [Citation40]. Alternatively, the differences between the targeted cell populations (i.e. PBMCs vs. isolated T-cells) may have contributed to the differences in the number of differentially methylated CpGs. The number of cell types within PBMCs may broaden the spectrum of epigenetic marks and thus increase the number of possible associations with the ME/CFS disease phenotype. Consistent with this idea, Brenu et al. [Citation24] found 120 differentially methylated CpGs associated with ME/CFS in CD4+ T-cells (p < 0.001) using the 450K array (n = 25 ME/CFS, n = 18 non-ME/CFS). This number of differentially methylated CpGs is similar to the 133 DMPs we found in this study, which targeted a broader T-cell population (including CD4+ and CD4- T-cells). However, the only overlap between our study and the study from Brenu et al. [Citation24] corresponded to the HLA-DQB1 (major histocompatibility complex, class II, DQ beta 1) gene. HLA-DQB1 encodes a protein that is part of the DQ heterodimer, a cell surface receptor that is essential in immune signalling. We found two contiguous differentially methylated regions within an intron of this gene (Supplementary Tables S1 and S3, ). One region was hypermethylated whereas the other was hypomethylated in the ME/CFS group. Interestingly, the gene HLA-DQB1 contained cis-mQTLs significantly associated with these two DMRs (see next section, as well as Supplementary Table S5, and ). Brenu et al. [Citation24] found CpG hypermethylation associated with the HLA-DQB1 gene, however the specific location of this association was not reported. Recent studies focusing on CD4+ T-cells of patients affected by immune disorders such as rheumatoid arthritis [Citation41] and multiple sclerosis [Citation42] have found differential methylation in HLA-DQB1. This result is thus consistent with a potential immune dysregulation in ME/CFS.
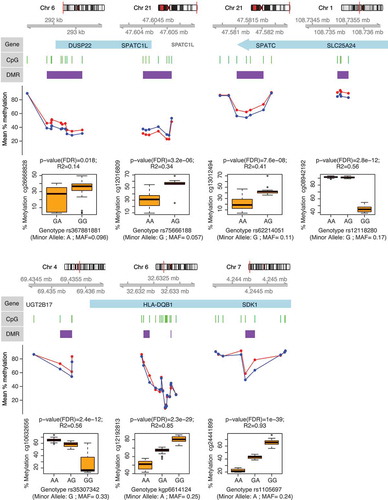
Figure 4. Genes associated with differentially methylated regions (DMR) in ME/CFS. Figure shows DMP-containing DMRs identified from the analysis of DNA methylation data from both sexes (healthy controls, n = 36; vs. ME/CFS cases, n = 43; sample sizes after individual exclusions) that were also identified from analysis of data females alone (healthy controls, n = 27; vs. ME/CFS cases, n = 34). Each panel shows (in descending order): 1) The chromosomal location of the gene/DMR; 2) The position of the DMPs (green bars) and DMR (purple bars) with respect to the gene (blue bars); 3) The mean percentage methylation difference between ME/CFS cases (red) and controls (blue) at each DMP; 4) The most significant meQTL association (as indicated by the R2 and p-values) between SNP genotype and the individual percentage methylation at the most significant DMP (as indicated by the p-value) within each DMR.
We found 31 genes associated with DMPs in T-cells that were common to this study and a previous study by our group [Citation11]. These genes, which include PAX8 (paired box 8), and ATP4B (ATPase H+/K+ transporting beta subunit) (Supplementary Table S1), are involved in the regulation of cellular processes and cell signaling. This is in line with recent ME/CFS research that observed differences in cellular metabolism in ME/CFS [Citation43–Citation45].
Our results suggest that DNA methylation modifications in T-cells in ME/CFS are associated with the cellular metabolism differences that are observed in the disease and may play a role in the development of these phenotypic differences.
Genetic and epigenetic interactions associated with ME/CFS
To identify associations between SNP genotypes and DNA methylation levels at significantly differentially methylated CpG loci, we performed methylation quantitative trait loci (mQTLs) analysis using linear additive regression models. All the DMPs identified according to empirical p-values had significant associations (FDR corrected p-values < 0.05) with SNP genotypes (independent of disease phenotype). In total there were 13,060 significant cis-mQTLs (Supplementary Table S5). shows the strongest SNP-DMPs cis-mQTLs associations (according to correlation coefficient R2) in each of the 7 DMP-containing DMRs that were common in analyses of methylation data from both sexes and from females only.
SPATC1L (spermatogenesis and centriole associated 1 like) and DUSP22 (dual specificity phosphatase 22) were the two genes containing cis-mQTLs with the largest differentially methylated regions: 11 DMPs (7 hypermethylated probes in 5' UTR and 4 hypomethylated probes in 3' UTR region) in SPATC1L and 10 hypermethylated probes in the 5' UTR of DUSP22 (Supplementary Table S3 and ). While the exact function of SPATC1L is not well understood, it has been previously associated with xenobiotic response and differential methylation in the promoter of this gene is characteristic of certain ethnic groups in human populations [Citation46]. DUSP22 hypermethylation has also been observed in the 5' UTR region in T-cells of rheumatoid arthritis patients [Citation47]. In T-cells, DUSP22 is known to inhibit proliferation and autoimmunity through inactivating Lck and preventing the activation of the T-cell receptor [Citation48]. However, it remains to be confirmed how hypermethylation in the 5' UTR region affects the overall activity of DUSP22 in T-cells of ME/CFS patients.
These results suggest that ME/CFS patients have differential methylation patterns in T-cells that are strongly correlated with the underlying genotype. Understanding the mechanisms of these interactions is a promising direction of research in ME/CFS.
Conclusions
We identified over one hundred differentially methylated CpG loci associated with ME/CFS in T lymphocytes. Approximately half of these were clustered in differentially methylated regions of 500 bp in size or less. We found no substantial large-effect direct associations of specific genotypes with ME/CFS disease phenotype. However, our data and analyses suggest that there is an indirect role of genotype influencing DNA methylation profiles associated with ME/CFS. All of the methylation values at differentially methylated loci in T lymphocytes had significant correlations with specific genotypes at neighboring SNPs (within a window of 1 Mbp), indicating that particular genetic backgrounds may influence methylation levels differently in ME/CFS patients than in controls.
This study constitutes one of the largest to investigate DNA methylation modifications associated with ME/CFS to date. The aim of this study was to identify genotype-epigenotype interactions associated with ME/CFS rather than to identify biomarkers. Future studies to identify biomarkers will necessitate the use of methods for targeted validation (e.g. targeted bisulfite sequencing) that can enable assessment in large replication cohorts. In addition, larger scale genome-wide association studies are necessary to test for potential small-effect associations between genotype and ME/CFS phenotype. As such, these findings should be considered preliminary. Nevertheless, the genomic elements associated with genetic and epigenetic variation in ME/CFS patients identified in this study constitute new targets for future research. Understanding the molecular mechanisms of genetic-epigenetic interactions of these targets will be key to develop new treatments for ME/CFS, and can serve as a model to understand the molecular basis of related complex diseases.
Methods
Ethics approval and consent to participate
This study adhered to the human experimentation guidelines as outlined by the Helsinki Declaration of 1975. The collection of and analysis of clinical information and biological samples by the SolveCFS BioBank was ethically approved by the Genetic Alliance ethics review board (IRB # IORG0003358) and the University of Toronto (IRB #27391), which also approved all procedures for obtaining written informed consent from all participants in the study. Two copies of the consent form were signed, with one copy provided to the participants and one copy under secure storage at the SolveCFS Biobank.
Study population
In total, 61 ME/CFS diagnosed patients receiving care at the Bateman Horne Center, Utah (46 females, 15 males) and 48 healthy control (36 females, 12 males) individuals were recruited for this study. Female to male ratios were nearly identical in both cases and controls (3:1). The sex ratio in our population of ME/CFS patients (cases) is consistent with previously reported ratios indicating predominance of this illness in females [Citation29–Citation31]. Diagnosis of ME/CFS was performed according to the 1994 Fukuda [Citation49] and 2003 Canadian [Citation50] criteria. To quantify functional impairment, individuals completed the standardized health-related quality of life survey RAND-36 [Citation26]. All individuals met the following criteria: 1) were HIV and Hepatitis-C negative; and 2) had no intake history of immunomodulatory or immunosuppressive medications. The Body Mass Index (BMI) of individuals ranged between 16.4 and 46 ( = 27.2, s = 6.4), with no significant differences between case and control groups (t-test p = 0.5; Wilcoxon p = 0.74) (). Similarly, age, which ranged between 18 and 62 years (
= 32.2, s = 13.6), was not significantly different between cases and controls (t-test p = 0.06; Wilcoxon p = 0.07) ().
Sample processing
Whole blood from each individual was collected at the Bateman Horne Center and shipped overnight to Precision for Medicine, Maryland for Peripheral Blood Mononuclear Cells (PBMC) separation following procedures described in [Citation11]. PBMCs were separated into two aliquots of approximately 7 million cells each, and shipped in liquid nitrogen to the Centre for Environmental Epigenetics and Development at the University of Toronto.
The first PBMC aliquot per patient was used for single nucleotide polymorphism (SNP) genotyping using the Human Omni 5–4 Array (Illumina Inc.). This array examines Single Nucleotide Polymor-phisms at ~4.3 million loci throughout the human genome. Genomic DNA purification was performed with the MasterPure™ Complete DNA and RNA Purification Kit (Epicentre) following the standard protocol for cell samples. DNA quantity and purity was assessed using a NanoDrop 2000c Spectro-photometer (Thermo Scientific). Genotyping with the Omni 5–4 array was performed at the Princess Margaret Genomics Centre in Toronto.
The second PBMC aliquot was used for DNA methylation profiling of T-cells (CD3+) using the Human Methylation 450K Array (Illumina Inc.). This array quantifies methylation at ~480 thousand CpG loci throughout the human methylome. To quantify the relative proportions of cell type in the PBMC sample (i.e. CD4+ T-cells, CD8+ T-cells, CD19+ B-cells, and CD14+ monocytes) and isolate CD3+ T-cells, each sample was stained with fluorescently labelled antibodies and sorted in a FACSAria (BD Biosciences) flow cytometer at the Centre for Flow Cytometry and Microscopy of the Sunnybrook Research Institute in Toronto. Genomic DNA from T-cells was purified following the same procedure described above. Bisulfite conversion of purified DNA and CpG methylation profiling with the 450K Array was performed at the McGill University and Genome Quebec Innovation Centre in Montreal.
Genotype association analyses
Analyses of SNP data quality and of association with ME/CFS disease phenotypes were performed with different parameters in the programs GenABEL [Citation51] and PLINK [Citation52], following standardized protocols [Citation53,Citation54]. To minimize the number of false positive and negative associations, we first identified and excluded data from individuals that met one or more of the following criteria: 1) Inferred sex, as determined by the heterozygosity of the X chromosome, was incongruent with the known sex of the individual; 2) Heterozygosity rates or amount of missing data were outliers with respect to the whole population (); 3) More than 10% of marker data was missing; 4) Relatedness to other samples, as measured by the identity by descent (IBD) statistic, was greater than that of a second- to third-degree relative (IBD > 0.1875); 5) Ancestry, as determined by a principal components analysis (PCA) () performed with EIGENSOFT [Citation55,Citation56], was substantially different than that of the majority population in our cohort (i.e. European ancestry). Data from 10 individuals were excluded from all analyses: 4 cases (2 females, 2 males) and 6 controls (6 females). In addition to these criteria, we re-analysed the data excluding individuals with health-related quality of life measurements that overlapped between cases and controls. This exclusion of intermediate illness phenotypes was aimed at increasing the power to detect possible associations between disease status and (epi)genotypes by decreasing the heterogeneity in phenotype symptomatology within each group. We utilized the scores of RAND-36 scales (physical functioning, energy/fatigue, emotional well-being, social functioning, pain, and general health) as quantitative measurements of ME/CFS phenotypes because these were significantly different (α = 0.05) between case and control groups, prior to excluding individuals with intermediate phenotypes (). RAND-36 scale scores were summarized into principal components (PC) using the stats package in R. We excluded data from case and control individuals with overlapping values along PC1 (), which explained ~80% of variance in the RAND-36 data. In total, data from 30 individuals were excluded using this approach: 18 cases (12 females, 6 males) and 12 controls (9 females, 3 males). These data were re-analysed in PLINK.
Figure 5. Quality control plots for SNP and CpG methylation data. (a) Scatterplot of the proportion of missing genotypes vs. heterozygosity rate, per individual. Dot colour intensity indicates individual sample density. Horizontal red dotted lines indicate quality thresholds of ± 2 standard deviations. Vertical red dotted line indicates a 2% missing data threshold; (b) Inferred ancestry of individuals according to a principal components analysis of genotypes. The first two principal components are plotted. Genotype data from individuals from reference populations (African, Asian and European) were obtained from the HapMap Phase III (HapMap3) database. Black crosses indicate individuals from this study. Horizontal red dotted line indicates European ancestry threshold; (c) Frequency distribution of the fraction of missing data per SNP locus. Red dotted line indicates the 3% quality threshold; (d) Scatterplot of median methylated and unmethylated fluorescence signals per individual. Dotted red line indicates quality threshold suggested in minfi; (e) Methylation percentage (beta-values x 100) density distribution per individual; (f) Scatterplot of the two principal components summarizing the variability in the methylation data per individual. For (e-f) colours indicate ME/CFS case (red, n = 61) or control (blue, n = 48) status of each individual.
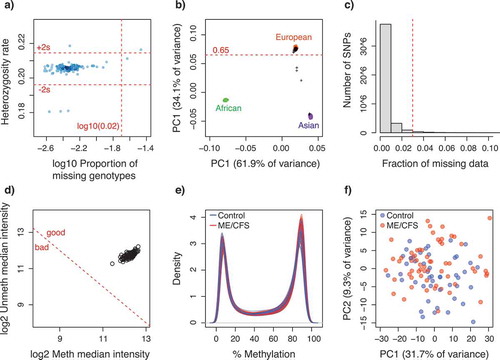
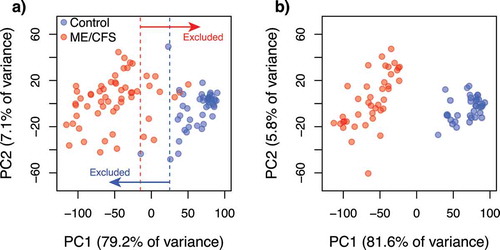
Figure 6. Scatterplots of the two principal components summarizing the variability in the standardized health-related quality of life surveys (RAND-36) per individual. (a) Before exclusion of data from individuals with intermediate (overlapping) phenotypes along PC1. Dotted lines indicate the thresholds used to define intermediate phenotypes; (b) After exclusion of data from individuals with intermediate phenotypes. Colours indicate the healthy control (blue, a) n = 48; b) n = 36) and ME/CFS (red, a) n = 61; b) n = 43) subpopulations.
fter excluding individuals with sub-optimal data, we identified and excluded data from SNP loci that met one or more of the following criteria following [Citation53,Citation54]: 1) Rate of missing genotypes was greater than 3% in PLINK (5% in GenABEL) (); 2) Rate of missing data was significantly different (p < 0.00001) between cases and controls; 3) Allelic frequencies significantly deviated from Hardy-Weinberg equilibrium (χ2 p < 0.00001 in PLINK, FDR < 0.2 in GenABEL); and 4) Minimum allele frequency was smaller than 1% in PLINK (2% in GenABEL). Out of 4,284,426 genotyped SNP loci, 1,779,031 SNP loci were excluded from PLINK analyses, and 2,142,548 from GenABEL analyses.
We examined possible associations between SNP genotypes and ME/CFS disease phenotypes (case or control) using χ2 testing as well as logistic regression tests that included covariates of age, sex and BMI in both PLINK and GenABEL (healthy control, n = 48 vs. ME/CFS, n = 61). Including these factors as covariates is important as they may influence the results of regression analyses. To account for the uncertainty in the potential genetic model of inheritance of ME/CFS, we performed multiple tests with different underlying models: Genotypic, dominant, recessive, Cochram-Armitage trend, and allelic for the simple χ2 tests; and genotypic, dominant, recessive and multiplicative for logistic regressions. No inflation of test statistics was observed in any test (λ ranged between 1 and 1.01). To assess the significance of associations we: 1) Adjusted raw p-values for multiple testing following the Bonferroni [Citation57], Holm [Citation58], and Benjamini and Hochberg false discovery rate (FDR) corrections [Citation59]; and 2) Calculated corrected (empirical) p-values (family wise) after 10,000 permutations. We generated spatial visualizations of raw p-values for all associations across chromosomes using the program Haploview [Citation60]. Due to the higher prevalence of ME/CFS in females than males [Citation29–Citation31], association tests were also performed in data from females only (healthy control, n = 27 vs. ME/CFS, n = 34).
SNP characterisation
SNPs with significant associations were examined using the following reference tools: the NHGRI-EBI catalogue of genome-wide association studies (http://www.ebi.ac.uk/gwas/home; [Citation61], the Ensembl genome browser (http://www.ensembl.org/Homo_sapiens/Info/Index; [Citation62], the Single Nucleotide Polymorphisms Annotator SNiPA (http://snipa.helmholtz-muenchen.de/snipa3/; [Citation63], the Genotype-Tissue-Expression database GTEx (https://www.gtexportal.org/home/; [Citation64], the genome-wide association study of blood plasma proteome database pGWAS (http://metabolomics.helmholtz-muenchen.de/pgwas/; [Citation65], and the developing brain methylation quantitative trait loci database (http://epigenetics.essex.ac.uk/mQTL/; [Citation66].
Re-analysis of published genetic data
Data from the ME/CFS genotype association study by Schlauch et al. [Citation20], were acquired from dbGAP (phs001015.v1.p1), and re-analysed following the pipeline described above to identify commonalities. The crlmm R Bioconductor package [Citation67,Citation68] was used for genotyping, and analysed in GenABEL, using the same thresholds as above. 704,464 SNP markers from 66 subjects passed our quality controls (44 females and 22 males, 36 cases and 30 controls). Because of the different arrays used (Illumina Human Omni 5–4 Array in this study vs. Affymetrix Genome-Wide Human SNP Array 6.0 used by Schlauch et al. [Citation20]) we constructed linkage disequilibrium (LD) proxies using LDlink [Citation69], with R2 ≥ 0.8, to make the results comparable.
Epigenome-wide association analyses
Analyses of CpG methylation data quality and of association with ME/CFS disease phenotypes were performed in the R package minfi [Citation70], following the pipeline suggested by [Citation71]. All individuals identified for exclusion during the genotype association analyses were also excluded from this dataset to increase the power of detection of possible associations. In addition, we attempted to identify data from individuals that could represent potential outliers by the following graphical approaches (as suggested by [Citation70]): 1) Comparing inferred sex versus known sex; 2) Examining intensity distributions of control CpG probes; 2) Plotting median methylated and unmethylated fluorescence signals; 3) Plotting methylation percentage density distributions; and 4) Summarizing the variability in the methylation data through a principal component analysis. No individuals were identified as outliers (). We discarded data from CpG loci that: 1) Contained known SNPs at the methylation dinucleotide; 2) Contained missing data; 3) were known to cross-hybridize with other probes; or 4) were linked to sex chromosomes. Raw probe florescence intensities were normalized by Subset-Quantile Within Array Normalization [Citation72], which takes into account the differences between Infinium type I and II probes. The level of methylation in each CpG locus was measured as beta-values, ranging from 0 to 1, which represent the proportion of methylation. In total, 467,971 CpG loci (out of 485,512) were retained for further analyses.
We examined possible associations between mean methylation levels at CpG loci and ME/CFS disease phenotypes (case or control) through F-tests of logit-transformed beta-values [Citation73] as implemented in the dmpFinder function. To correct for potential confounding effects of multiple methylation array batches (two in this study), as well as covariates of age, sex and BMI, we utilized the empirical Bayes procedure implemented in the R package ComBat [Citation74]. To assess significance of associations (α = 0.05) we: 1) adjusted raw p-values for multiple testing by performing Benjamini and Hochberg false discovery rate (FDR) corrections; and 2) calculated empirical p-values after 10,000 permutations as described in [Citation11]. In addition to testing for associations at individual CpG loci, we performed tests of association at differentially methylated genomic regions using the R package bumphunter as described in [Citation75]. Genomics regions were defined as clusters of CpG loci within a 500 bp region. We assessed the significance of associations (α = 0.05) by calculating empirical p-values from null distributions of test statistics after 1,000 bootstrap pseudoreplicates. In addition, we tested for associations between the variance of methylation levels at CpG loci and ME/CFS disease phenotypes (case or control) using DiffVar method implemented in the R package missMethyl [Citation76].
Additional validation of methylation results obtained with the 450K array was not performed for the following reasons: First, the reliability of the 450K data has been validated in several independent studies [Citation77,Citation78]; Second, the sample handling, DNA purification, 450K array and QA/QC protocols utilized in this study are the same as those utilized in previous publications by our group where 450K was the primary source of data [Citation11,Citation23]. In those early studies, pyrosequencing was utilized to validate 450K results. The pyrosequencing consistently indicated that the 450K data were reliable to identify mean percentage methylation difference between cases and controls equal or greater than 5%, which is the same threshold utilized in this study. These early validation steps demonstrate that the 450K data produced through the protocols implemented by our group are of good quality and are statistically reliable assessments of methylation levels.
Genome-epigenome association analyses
To identify associations between SNP genotypes and methylation levels at significantly differentially methylated CpG loci, we performed a methylation quantitative trait loci (mQTLs) analysis using linear additive regression models (including covariates) in the R package Matrix eQTL [Citation77]. Only local cis-mQTL were considered, i.e. CpG-SNP pairs that are within 1 Mbp of each other. Both CpG loci and SNPs were mapped to the UCSC human genome assembly version hg19 (Genome Reference Consortium GRCh37) [Citation78]. mQTLs were considered significant when FDR corrected p-values were smaller than α = 0.05.
Author contributions
P.O.M. designed and supervised the research; S.H. performed research; S.H. analyzed the data with contributions from W.C.D.V. and D.A.; S.D.V. contributed reagents/materials; S.H. wrote the manuscript with contributions from W.C.D.V., P.O.M., D.A. and S.D.V. All authors read and approved the final manuscript.
Accession Codes
SNP data will be made available through the NCBI dbSNP database, and methylation data through the NCBI GEO database, upon acceptance for publication.
Supplemental Material
Download Zip (1.5 MB)Acknowledgments
We would like to thank Dr. Geneve Awong, Centre for Flow Cytometry and Microscopy at Sunnybrook Research Institute, for her help with fluorescence activated cell sorting. We would like to thank Dr Lucinda Bateman, the Bateman Horne Center Research Department and the patients that agreed to participate in this research.
Disclosure statement
No potential conflict of interest was reported by the authors.
Supplementary material
Supplemental data for this article can be accessed here.
Additional information
Funding
Related Research Data
References
- Nacul LC, Lacerda EM, Pheby D, et al. Prevalence of myalgic encephalomyelitis/chronic fatigue syndrome (ME/CFS) in three regions of England: a repeated cross-sectional study in primary care. BMC Med. 2011;9:91.
- Njoku MGC, Jason LA, Torres-Harding SR. The prevalence of chronic fatigue syndrome in Nigeria. J Health Psychol. 2007;12:461–474.
- Huibers MJH, Kant IJ, Swaen GMH, et al. Prevalence of chronic fatigue syndrome-like caseness in the working population: results from the Maastricht cohort study. Occup Environ Med. 2004;61:464–466. Available from: http://oem.bmj.com/content/61/5/464
- Hamaguchi M, Kawahito Y, Takeda N, et al. Characteristics of chronic fatigue syndrome in a Japanese community population : chronic fatigue syndrome in Japan. Clin Rheumatol. 2011;30:895–906.
- Rusu C, Gee ME, Lagacé C, et al. Chronic fatigue syndrome and fibromyalgia in Canada: prevalence and associations with six health status indicators. Heal Promot Chronic Dis Prev Canada Res Policy Pract. 2015;35:3–11. Available from: http://www.ncbi.nlm.nih.gov/pubmed/25811400%0Ahttp://www.pubmedcentral.nih.gov/articlerender.fcgi?artid=PMC4939456
- Lloyd AR, Hickie I, Boughton CR, et al. Prevalence of chronic fatigue syndrome in an Australian population. Med J Aust. 1990;153:522—528. Available from: http://europepmc.org/abstract/MED/2233474
- Jason LA, Benton MC, Valentine L, et al. The economic impact of ME/CFS: individual and societal costs. Dyn Med. 2008;7:6.
- Hornig M, Montoya JG, Klimas NG, et al. Distinct plasma immune signatures in ME/CFS are present early in the course of illness. Sci Adv. 2015;1:e1400121. Available from: http://advances.sciencemag.org/content/1/1/e1400121.abstract
- Landi A, Broadhurst D, Vernon SD, et al. Reductions in circulating levels of IL-16, IL-7 and VEGF-A in myalgic encephalomyelitis/chronic fatigue syndrome. Cytokine. 2016;78:27–36.
- Visser J, Lentjes E, Haspels I, et al. Increased sensitivity to glucocorticoids in peripheral blood mononuclear cells of chronic fatigue syndrome patients, without evidence for altered density or affinity of glucocorticoid receptors. J Investig Med. 2001;49:195–204. Available from: http://jim.bmj.com/lookup/doi/10.2310/6650.2001.34047
- de Vega WC, Herrera S, Vernon SD, et al. Epigenetic modifications and glucocorticoid sensitivity in Myalgic Encephalomyelitis/Chronic Fatigue Syndrome (ME/CFS). BMC Med Genomics. 2017;10:11. Available from: http://bmcmedgenomics.biomedcentral.com/articles/10.1186/s12920-017-0248-3
- Brenu EW, Huth TK, Hardcastle SL, et al. Role of adaptive and innate immune cells in chronic fatigue syndrome/myalgic encephalomyelitis. Int Immunol. 2014;26:233–242.
- Brenu EW, van Driel ML, Staines DR, et al. Immunological abnormalities as potential biomarkers in Chronic Fatigue Syndrome/Myalgic Encephalomyelitis. J Transl Med. 2011;9:81. Available from: http://www.pubmedcentral.nih.gov/articlerender.fcgi?artid=3120691&tool=pmcentrez&rendertype=abstract
- Klimas NG, Salvato FR, Morgan R, et al. Immunologic abnormalities in chronic fatigue syndrome. J Clin Microbiol. 1990;28:1403–1410.
- Fluge Ø, Bruland O, Risa K, et al. Benefit from b-lymphocyte depletion using the anti-CD20 antibody rituximab in chronic fatigue syndrome. a double-blind and placebo-controlled study. PLoS One. 2011;6:e26358.
- Gaab J, Hüster D, Peisen R, et al. Low-dose dexamethasone suppression test in chronic fatigue syndrome and health. Psychosom Med. 2002;64:311–318.
- Sánchez JA, Dorado D. Intragenomic ITS2 variation in Caribbean seafans. Proc 11th Int Coral Reef Symp Ft Lauderdale. 2008;1383–1387. Available from: http://www.nova.edu/ncri/11icrs/proceedings/files/m26-11.pdf
- Brothers LL, Van Dover CL, German CR, et al. Evidence for extensive methane venting on the southeastern U.S. Atlantic margin. Geology. 2013;41:807–810. Available from: http://geology.gsapubs.org/cgi/doi/10.1130/G34217.1
- Van Den Eede F, Moorkens G, Van Houdenhove B, et al. Hypothalamic-pituitary-adrenal axis function in chronic fatigue syndrome. Neuropsychobiology. 2007;55:112–120.
- Schlauch KA, Khaiboullina SF, De Meirleir KL, et al. Genome-wide association analysis identifies genetic variations in subjects with myalgic encephalomyelitis/chronic fatigue syndrome. Transl Psychiatry. 2016;6:e730. Available from: http://www.ncbi.nlm.nih.gov/pubmed/26859813
- Rajeevan MS, Dimulescu I, Murray J, et al. Pathway-focused genetic evaluation of immune and inflammation related genes with chronic fatigue syndrome. Hum Immunol. 2015;76:553–560.
- Smith AK, Fang H, Whistler T, et al. Convergent genomic studies identify association of GRIK2 and NPAS2 with chronic fatigue syndrome. Neuropsychobiology. 2011;64:183–194.
- de Vega WC, Vernon SD, McGowan PO. DNA Methylation Modifications Associated with Chronic Fatigue Syndrome. PLoS One. 2014;9:e104757. [ cited 2014 Aug 13]. Available from: http://dx.plos.org/10.1371/journal.pone.0104757
- Brenu EW, Staines DR, Marshall-Gradisnik SM. Methylation Profile of CD4+ T Cells in Chronic Fatigue Syndrome/Myalgic Encephalomyelitis. J Clin Cell Immunol. 2014;5. Available from: http://omicsonline.org/open-access/methylation-profile-of-cd-t-cells-in-chronic-fatigue-syndromemyalgic-encephalomyelitis-2155-9899.1000228.pdf
- Viser J. CD4 T lymphocytes from patients with chronic fatigue syndrome have a decreased interferon gamma production and increased sensitivity to dexamethasone. J Infect Dis. 1998;177:451–454.
- Hays RD, Sherbourne CD, Mazel RM. The rand 36-item health survey 1.0. Health Econ. 1993;2:217–227. [ cited 2016 Jul 28]. Available from: http://doi.wiley.com/10.1002/hec.4730020305
- Curriu M, Carrillo J, Massanella M, et al. Screening NK-, B- and T-cell phenotype and function in patients suffering from Chronic Fatigue Syndrome. J Transl Med. 2013;11:68. Available from: http://www.pubmedcentral.nih.gov/articlerender.fcgi?artid=3614537&tool=pmcentrez&rendertype=abstract
- Hardcastle SL, Brenu EW, Johnston S, et al. Characterisation of cell functions and receptors in Chronic Fatigue Syndrome/Myalgic Encephalomyelitis (CFS/ME). BMC Imunol. 2015;16:35. Available from: http://www.pubmedcentral.nih.gov/articlerender.fcgi?artid=4450981&tool=pmcentrez&rendertype=abstract
- Evengard B, Jacks A, Pedersen NL, et al. The epidemiology of chronic fatigue in the Swedish Twin Registry. Psychol Med. 2005;35:1317. Available from: http://www.journals.cambridge.org/abstract_S0033291705005052
- Reyes M, Nisenbaum R, Hoaglin DC, et al. Prevalence and incidence of chronic fatigue syndrome in Wichita, Kansas. Arch Intern Med. 2003;163:1530–1536.
- Reeves WC, Jones JF, Maloney E, et al. Prevalence of chronic fatigue syndrome in metropolitan, urban, and rural Georgia. Popul Health Metr. 2007;5:5. Available from: http://www.pubmedcentral.nih.gov/articlerender.fcgi?artid=1904178&tool=pmcentrez&rendertype=abstract
- Little TJ, Horowitz M, Feinle-Bisset C. Role of cholecystokinin in appetite control and body weight regulation. Obes Rev. 2005;6:297–306.
- Lignon MF, Bernad N, Martinez J. Cholecystokinin receptors in cells of the immune system. Ann N Y Acad Sci. 1994;713:334–337.
- Weiland TJ, Voudouris NJ, Kent S. CCK(2) receptor nullification attenuates lipopolysaccharide-induced sickness behavior. Am J Physiol Regul Integr Comp Physiol. 2007;292:R112–R123. Available from: http://www.ncbi.nlm.nih.gov/pubmed/16857893
- Morris G, Anderson G, Galecki P, et al. A narrative review on the similarities and dissimilarities between myalgic encephalomyelitis/chronic fatigue syndrome (ME/CFS) and sickness behavior. BMC Med. 2013;11:64.
- Chung S, Weber F, Zhong P, et al. Identification of preoptic sleep neurons using retrograde labelling and gene profiling. Nature. 2017;545:477–481.
- Zhang J-G, Liu J-X, Jia -X-X, et al. Cholecystokinin octapeptide regulates the differentiation and effector cytokine production of CD4(+) T cells in vitro. Int Immunopharmacol. 2014;20:307–315.
- Geibel M, Badurek S, Horn JM, et al. Ablation of TrkB signalling in CCK neurons results in hypercortisolism and obesity. Nat Commun. 2014;5:3427.
- Spada J, Scholz M, Kirsten H, et al. Genome-wide association analysis of actigraphic sleep phenotypes in the LIFE Adult Study. J Sleep Res. 2016;25:690–701.
- de Vega WC, Erdman L, Vernon SD, et al. Integration of DNA methylation & health scores identifies subtypes in myalgic encephalomyelitis/chronic fatigue syndrome. Epigenomics. 2018;10:539–557.
- Guo C, Hu F, Yi H, et al. Myeloid-derived suppressor cells have a proinflammatory role in the pathogenesis of autoimmune arthritis. Ann Rheum Dis. 2016;75:278–285. Available from: http://ard.bmj.com/lookup/doi/10.1136/annrheumdis-2014-205508
- Graves MC, Benton M, Lea RA, et al. Methylation differences at the HLA-DRB1 locus in CD4+ T-Cells are associated with multiple sclerosis. Mult. Scler. 2014;20:1033–1041. Available from: http://www.ncbi.nlm.nih.gov/pubmed/24336351
- Maes M. Inflammatory and oxidative and nitrosative stress pathways underpinning chronic fatigue, somatization and psychosomatic symptoms. Curr Opin Psychiatry. 2009;22:75–83.
- Morris G, Berk M, Klein H, et al. Nitrosative stress, hypernitrosylation, and autoimmune responses to nitrosylated proteins: new pathways in neuroprogressive disorders including depression and Chronic Fatigue Syndrome. Mol Neurobiol. 2017;54:4271–4291.
- Naviaux RK, Naviaux JC, Li K, et al. Metabolic features of chronic fatigue syndrome. Proc Natl Acad Sci. 2016;201607571. Available from: http://www.pnas.org/lookup/doi/10.1073/pnas.1607571113
- Heyn H, Moran S, Hernando-Herraez I, et al. DNA methylation contributes to natural human variation. Genome Res. 2013;23:1363–1372.
- Glossop JR, Emes RD, Nixon NB, et al. Genome-wide DNA methylation profiling in rheumatoid arthritis identifies disease-associated methylation changes that are distinct to individual T- and B-lymphocyte populations. Epigenetics. 2014;9:1228–1237.
- Li J-P, Yang C-Y, Chuang H-C, et al. The phosphatase JKAP/DUSP22 inhibits T-cell receptor signalling and autoimmunity by inactivating Lck. Nat. Commun. 2014;5:1–13. Available from: http://www.nature.com/doifinder/10.1038/ncomms4618
- Fukuda K, Straus SE, Hickie I, et al. The chronic fatigue syndrome: a comprehensive approach to its definition and study. International Chronic Fatigue Syndrome Study Group. Ann Intern Med. 1994;121:953–959. Available from: http://www.ncbi.nlm.nih.gov/pubmed/7978722%5Cnhttp://annals.org/data/Journals/AIM/19820/0000605-199412150-00009.pdf
- Carruthers BM, Jain AK, DeMeirleir KL, et al. Myalgic Encephalomyelitis/Chronic Fatigue Syndrome : clinical working case definition, diagnostic and treatment protocols. J Chronic Fatigue Syndr. 2003;11:7–36. Available from: http://informahealthcare.com/doi/abs/10.1300/J092v11n01_02
- Karssen LC, van Duijn CM, Aulchenko YS. The GenABEL Project for statistical genomics. F1000Res. 2016;5:914. Available from: http://f1000research.com/articles/5-914/v1
- Purcell S, Neale B, Todd-Brown K, et al. PLINK: A tool set for whole-genome association and population-based linkage analyses. Am J Hum Genet. 2007;81:559–575.
- Anderson CA, Pettersson FH, Clarke GM, et al. Data quality control in genetic case-control association studies. Nat Protoc. 2010;5:1564–1573.
- Clarke GM, Anderson CA, Pettersson FH, et al. Basic statistical analysis in genetic case-control studies. Nat Protoc. 2011;6:121–133.
- Patterson N, Price AL, Reich D. Population structure and eigenanalysis. PLoS Genet. 2006;2:2074–2093.
- Price AL, Patterson NJ, Plenge RM, et al. Principal components analysis corrects for stratification in genome-wide association studies. Nat Genet. 2006;38:904–909. Available from: http://www.ncbi.nlm.nih.gov/pubmed/16862161
- Dunn OJ. Multiple comparisons among means. J Am Stat Assoc. 1961;56:52–64.
- Holm S. A simple sequentially rejective multiple test procedure. Scand J Stat. 1979;6:65–70.
- Benjamini Y, Hochberg Y. Controlling the false discovery rate: a practical and powerful approach to multiple testing. J R Stat Soc B. 1995;57:289–300. Available from: http://www.stat.purdue.edu/~doerge/BIOINFORM.D/FALL06/Benjamini and Y FDR.pdf%5Cnhttp://engr.case.edu/ray_soumya/mlrg/controlling_fdr_benjamini95.pdf.
- Barrett JC, Fry B, Maller J, et al. Haploview: analysis and visualization of LD and haplotype maps. Bioinformatics. 2005;21:263–265.
- MacArthur J, Bowler E, Cerezo M, et al. The new NHGRI-EBI Catalog of published genome-wide association studies (GWAS Catalog). Nucleic Acids Res. 2017;45:D896–D901.
- Aken BL, Achuthan P, Akanni W, et al. Ensembl 2017. Nucleic Acids Res. 2017;45:D635–D642.
- Arnold M, Raffler J, Pfeufer A, et al. SNiPA: an interactive, genetic variant-centered annotation browser. Bioinformatics. 2015;31:1334–1336.
- GTEx Consortium. The Genotype-tissue expression (GTEx) project. Nat Genet. 2013;45:580–585.
- Suhre K, Arnold M, Bhagwat AM, et al. Connecting genetic risk to disease end points through the human blood plasma proteome. Nat Commun. 2017;8:14357.
- Hannon E, Spiers H, Viana J, et al. Methylation QTLs in the developing brain and their enrichment in schizophrenia risk loci. Nat Neurosci. 2016;19:48–54.
- Carvalho BS, Louis TA, Irizarry RA. Quantifying uncertainty in genotype calls. Bioinformatics. 2010;26:242–249.
- Scharpf RB, Irizarry RA, Ritchie ME, et al. Using the R Package crlmm for genotyping and copy number estimation. J Stat Softw. 2011;40:1–32.
- Machiela MJ, Chanock SJ. LDlink: a web-based application for exploring population-specific haplotype structure and linking correlated alleles of possible functional variants. Bioinformatics. 2015;31:3555–3557.
- Aryee MJ, Jaffe AE, Corrada-Bravo H, et al. Minfi: A flexible and comprehensive Bioconductor package for the analysis of Infinium DNA methylation microarrays. Bioinformatics. 2014;30:1363–1369.
- Wilhelm-Benartzi CS, Koestler DC, Karagas MR, et al. Review of processing and analysis methods for DNA methylation array data. Br J Cancer. 2013;109:1394–1402.
- Maksimovic J, Gordon L, Oshlack A. SWAN: subset-quantile within array normalization for illumina infinium HumanMethylation450 BeadChips. Genome Biol. 2012;13:R44. Available from: http://genomebiology.com/2012/13/6/R44
- Du P, Zhang X, Huang -C-C, et al. Comparison of Beta-value and M-value methods for quantifying methylation levels by microarray analysis. BMC Bioinformatics. 2010;11:587. Available from: http://www.biomedcentral.com/1471-2105/11/587
- Johnson WE, Li C, Rabinovic A. Adjusting batch effects in microarray expression data using empirical Bayes methods. Biostatistics. 2007;8:118–127.
- Jaffe AE, Murakami P, Lee H, et al. Bump hunting to identify differentially methylated regions in epigenetic epidemiology studies. Int J Epidemiol. 2012;41:200–209.
- Phipson B, Oshlack A. DiffVar: a new method for detecting differential variability with application to methylation in cancer and aging. Genome Biol. 2014;15:465.
- Shabalin AA. Matrix eQTL: ultra fast eQTL analysis via large matrix operations. Bioinformatics. 2012;28:1353–1358.
- Kuhn RM, Karolchik D, Zweig AS, et al. The UCSC genome browser database: update 2009. Nucleic Acids Res. 2009;37:D755–D761. Available from: http://nar.oxfordjournals.org/lookup/doi/10.1093/nar/gkn875