
ABSTRACT
Heterobasidion parviporum is the most devastating fungal pathogen of conifer forests in Northern Europe. The fungus has dual life strategies, necrotrophy on living trees and saprotrophy on dead woods. DNA cytosine methylation is an important epigenetic modification in eukaryotic organisms. Our presumption is that the lifestyle transition and asexual development in H. parviporum could be driven by epigenetic effects. Involvements of DNA methylation in the regulation of aforementioned processes have never been studied thus far. RNA-seq identified lists of highly induced genes enriched in carbohydrate-active enzymes during necrotrophic interaction with host trees and saprotrophic sawdust growth. It also highlighted signaling- and transcription factor-related genes potentially associated with the transition of saprotrophic to necrotrophic lifestyle and groups of primary cellular activities throughout asexual development. Whole-genome bisulfite sequencing revealed that DNA methylation displayed pronounced preference in CpG dinucleotide context across the genome and mostly targeted transposable element (TE)-rich regions. TE methylation level demonstrated a strong negative correlation with TE expression, reinforcing the protective function of DNA methylation in fungal genome stability. Small groups of genes putatively subject to methylation transcriptional regulation in response to saprotrophic and necrotrophic growth in comparison with free-living mycelia were also explored. Our study reported on the first methylome map of a forest pathogen. Analysis of transcriptome and methylome variations associated with asexual development and different lifestyle strategies provided further understanding of basic biological processes in H. parviporum. More importantly, our work raised additional potential roles of DNA methylation in fungi apart from controlling the proliferation of TEs.
Introduction
The basidiomycete species Heterobasidion parviporum Niemelä & Korhonen is a white-rot fungus, causing the root and stem rot of Norway spruce (Picea abies (L.) Karst.), the economically most important timber species in Europe, and extensive revenue losses every year [Citation1]. The fungus infects fresh stump surfaces by means of aerial basidiospores being released from fruiting bodies, whereas it reproduces asexually by production of asexual spores called conidiospores. Under appropriate conditions, the conidiospores germinate to form a network of interconnected hyphae called mycelia. This pathogen feeds on dead wood substrates as a saprotroph, but can also establish a necrotrophic interaction with the host provided the living plant cells are encountered [Citation1]. Despite its outstanding economic significance, the complex dual lifestyles plus the unavailability of an efficient transformation system in H. parviporum have rendered many fundamental biological questions of this pathogen unanswered or not sufficiently addressed.
Emerging studies have made the presence of assorted gene regulatory mechanisms well recognized. Epigenetic regulations encompassing the chromatin-based regulatory events without alterations in DNA sequence such as chromatin remodeling, histone modification and DNA methylation are essential for precise and stable control of various nuclear processes [Citation2]. DNA cytosine methylation is a common epigenetic regulation that has been found in diverse eukaryotic species including animals, plants and fungi [Citation3], and appears to be involved in the silencing of transposable elements (TEs) and repeat sequences, genome stability, development, and regulation of transcription [Citation3–Citation5]. It has been reviewed that DNA methylation occurred in gene bodies, promoters and repetitive elements of studied vertebrates and plants, whereas invertebrate lineages showed DNA methylation preferences mainly for gene bodies [Citation3,Citation6]. The methylated promoter is perceived as the repressive transcriptional mark of genes and methylation in TEs is considered as a defense mechanism against their deleterious proliferation in genomes [Citation6].
Compared to the higher eukaryotic counterparts, DNA methylation in fungi is relatively less frequently studied. With the exception of Uncinocarpus reesii, most of methylated cytosines were originally found localized in transcriptionally silent, repetitive loci and absent within active genes, leading to a consensus notion that DNA methylation in fungi is primarily dedicated to TE suppression to maintain genome integrity [Citation3,Citation7]. Nonetheless, recent studies in increasing number of fungal species not only revealed the significantly varied number of the methylated genomic cytosines (e.g., 0.22% in Magnaporthe oryzae [Citation8], 0.38–0.42% in Metarhizium robertsii [Citation9], 1.8% in Ganoderma sinense [Citation10], 6.4–7.7% in Cryphonectria parasitica [Citation11], 36.9–39.6% in Tuber melanosporum [Citation12]), but also the occurrences of methylation in and around genes [Citation8–Citation11,Citation13], suggesting that DNA methylation in fungi may have more complicated patterns and divergent functions than we previously thought. For example, in addition to the roles in genome defense [Citation8,Citation10,Citation12], DNA methylation as a dynamic epigenetic entity may contribute to fungal development in M. oryzae [Citation8,Citation9], regulation of secondary metabolism in G. sinense [Citation10], and cell morphology transition in Candida albicans [Citation13] via modulation of transcriptional activities of relevant genes.
The recently published reference genome of H. parviporum 96026 [Citation14] enables a wider range of studies conducted in this species. Therefore, in our study, by employing whole-genome bisulfite sequencing, we uncovered the genome-wide DNA methylation pattern associated with different lifestyles (saprotrophy and necrotrophy) and asexual lifecycle stages (free-living mycelia and conidiospores) of H. parviporum 96026. We also performed RNA-seq and identified key genes or pathways that were deemed as specific to each stage under study. With the comparison of the transcriptomic profiles to methylation patterns, we predicted the general function of DNA methylation in H. parviporum fungal genome and possible implications in the transcriptional regulation of its asexual development and lifestyle transition. Our study highlights the function of DNA methylation in fungi and also presents the first methylome map of a conifer fungal pathogen that provides the basis for expanding the perspective on the regulation of several of its essential biological processes.
Results
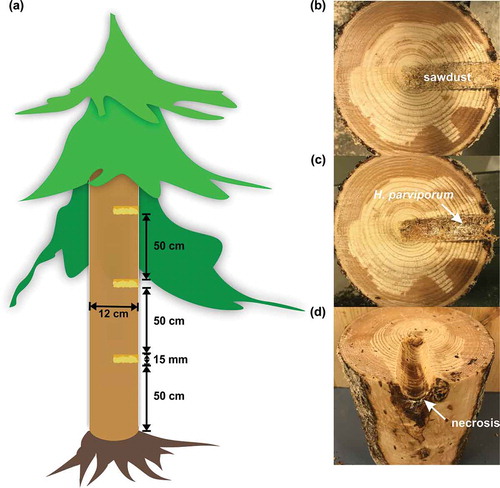
In the present study, we utilized the freshly harvested conidiospores (SPORE) of H. parviporum 96026 as the starting point. A considerable mycelial biomass derived from germination of conidiospores was observed after three-week growth in Hagem liquid medium (MYCEL). Norway spruce sawdust inoculated with mycelia was fully colonized and turned brownish after one-month incubation. The pre-colonized sawdust was then used as inocula to infect standing Norway spruce trees in the forest (–). Obvious necrosis was developed over the three and half months of infection period in all inoculated trees ()). Therefore, fungal samples recovered from sawdust inocula and invaded necrotic stem tissue surrounding inoculated holes represented saprotrophic growth (SAP) and necrotrophic growth (NECT), respectively.
Figure 1. Inoculation and harvesting of samples. (a) Illustration of field inoculation. (b) Inoculated holes filled with sawdust pre-colonized by H. parviporum. (c) Area surrounding the inoculated holes after harvesting of sawdust. The arrow indicated the necrotrophic growth of H. parviporum (d) Stem after harvesting of the area surrounding the inoculated holes. The arrow indicated the necrosis caused by fungal infection.
Whole-genome bisulfite sequencing
Bisulfite sequencing (BS-seq) enabled the generation of genome-wide DNA methylation profiles of H. parviporum MYCEL, SPORE, SAP and NECT samples at single-base resolution. After trimming and filtering, BS-seq yielded about 15–18 million clean reads for MYCEL and SPORE samples, and 36–43 million clean reads for SAP. As the NECT samples contained a majority of cells from Norway spruce and H. parviporum did not necessarily infect evenly in the harvested stem tissues, 54–224 million clean reads were generated to ensure the concordant coverage and sequencing depth among the three NECT replicates. Mapping of those reads to H. parviporum 96026 genome resulted in 86.82% to 88.81% coverage of the 37.76 Mb genome at the depth of 7.35 to 32.20. In addition, 79.16% to 87.49% of the cytosines present in the whole genome were covered by at least one read (). All samples were reported to have at least 99.31% of conversion rate by Beijing Genomic Institute (BGI, Shen-Zhen, China) using an unmethylated lambda genome spike-in.
Table 1. BS-seq, RNA-seq reads and mapping to the H. parviporum reference.
Genome-wide DNA methylation pattern
The global methylation level (mC/total C in all reads) of all samples ranged from 3.3% to 5.2% (Supplementary Table S1). When the nucleotide contexts were considered, methylation demonstrated a strong preference for CpG sites (6.7–9.3%) than non-CpG sites (CHG and CHH; H = A, T and C) (2.0–3.7%) in all conditions (Supplementary Table S1). As the global methylation level is only an indirect indicator of methylation in genome, the methylated cytosine (mC) sites across the genome were further examined. MYCEL and SPORE samples had 2,204,776–2,663,573 and 2,319,664–2,735,650 mC sites detected, accounting for 11.02–13.32% and 11.60–13.68% of all genomic cytosines, respectively, followed by SAP samples (1,957,905–2,046,579 mC; 9.79–10.23%) (Supplementary Table S2). The NECT samples had markedly the lowest number of mC sites (1,321,889–1,527,846 mC; 6.61–7.64%) (Supplementary Table S2), which might be slightly underestimated considering the comparatively smaller number of C sites covered by reads (). The relative proportion of mC sites in the three nucleotide contexts were similar in all samples (47–52% in CHH, 30–36% in CpG, and 17–18% in CHG) ()), indicating a methylation homogeneity in terms of the three types of nucleotide contexts.
Figure 2. H. parviporum DNA methylation pattern. (a) Relative proportions of mC sites in the three nucleotide contexts. R1, R2 and R3 indicated the three biological replicates of each condition. (b) Methylation density in CpG, CHG and CHH contexts. (c) Average methylation level in different functional genomic regions including TEs, 1.5 kb upstream of genes, gene, 1.0 kb downstream of genes, exons and introns. (d) Zoomed in average methylation level in gene and gene upstream till 1.5 kb and downstream till 1.0 kb. Vertical dash line represented the transcribed region of genes. Biological replicates were shown in the same color.
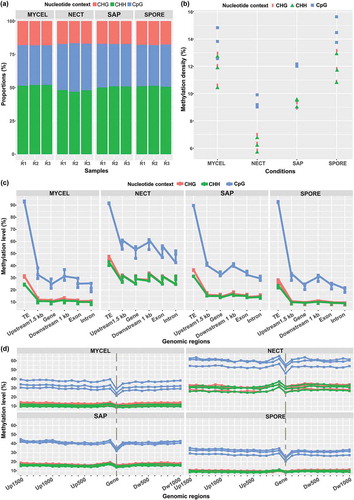
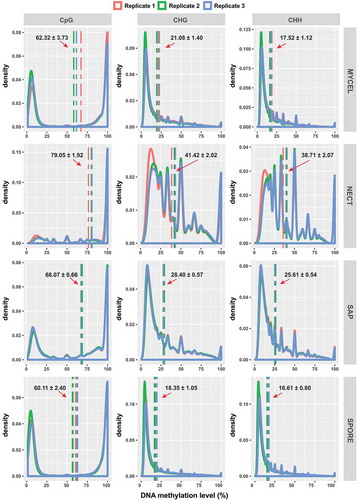
Despite a substantial proportion of methylation in non-CpG contexts, CpG context showed the highest methylation density (mCpG/total genomic CpG sites) in all conditions (), Supplementary Table S2). In addition, the distribution of methylation levels of each mC site revealed that CpG methylation level displayed a bimodal distribution, consisting of either highly (>80%) or weakly methylated (<20%) CpG sites (). However, non-CpG contexts were generally dominated by cytosines with lower methylation level (<50%) (). NECT showed the highest average methylation level, followed by SAP. MYCEL and SPORE both had similarly lower average methylation level with SPORE being slightly less methylated (). This result was consistent with the principal component analysis (PCA) of methylation level of all mC sites, where MYCEL and SPORE clustered together, separated from NECT with SAP located in between these two groups (Supplementary Figure S1A).
Figure 3. Distribution of DNA methylation levels in CpG, CHG and CHH contexts of all samples. Vertical dash lines represented the average methylation level in each biological replicate. The arrows denoted the average methylation level among the three biological replicates together with its standard error.
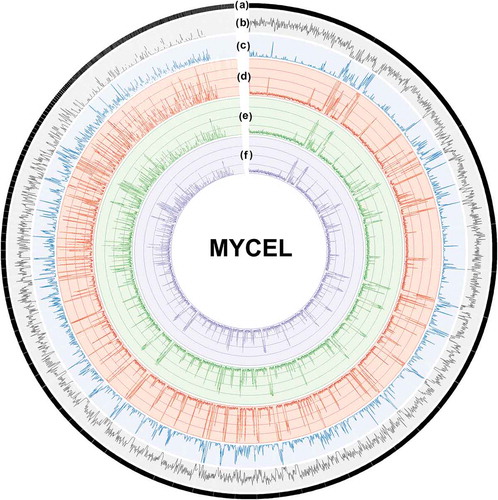
The mC sites were not evenly distributed in the H. parviporum genome. The gene and TE densities together with methylation density in CpG, CHG and CHH contexts were calculated in 10-kb windows across the genome. Notably, the methylation densities of the three replicates in each condition were coherently distributed, which all exhibited similar trend with TE density, suggesting that mC sites generally concentrated in TE-rich, gene-poor regions in all conditions (, Supplementary Figure S2). Further Spearman correlation test revealed a stronger correlation of CpG methylation density with TE density (rho = 0.45–0.54) than non-CpG context (CHG rho = 0.27–0.42; CHH rho = 0.21–0.36). The average methylation level in distinct genomic features (TEs, genes, exons, introns, 1.5 kb up- and 1.0 kb downstream of genes) further confirmed that TEs were heavily methylated in both CpG (>90%) and non-CpG (>20%) sites in all samples ()). Strikingly, there were certain extent of methylation in genic features. However, the methylation level of gene transcribed regions in CpG context were lower than their flanking regions ()). Taken together, H. parviporum DNA methylation occurred in the sequence contexts of CpG, CHG and CHH, but showed a drastically stronger preference for CpG context irrespective of the asexual lifecycle stages and lifestyles. Those methylated sites, particularly in CpG context, were found extensively clustered in TE-rich regions with a certain amount of sites situated in genes and gene-flanking regions. Nonetheless, variation of H. parviporum methylome was observed during its asexual development and different lifestyles, reinforcing the dynamic nature of DNA methylation.
Figure 4. Genome-scale map of DNA methylation density in 10-kb windows of three biological replicates of MYCEL. Each circle from the outside to the inside depicts: (a) H. parviporum 287 scaffolds from the largest to the smallest size arranged in clockwise; (b) gene density; (c) transposable elements density; (d–f) methylation density in CpG, CHG and CHH context, respectively.
Transcriptomic profiles associated with fungal development and different lifestyle strategies
The transcriptomes obtained using RNA-seq revealed a total of 18–21, 10–15, 28–34 and 32–40 million clean read pairs from MYCEL, NECT, SAP, SPORE samples, respectively, that were uniquely mapped onto the H. parviporum 96026 genome (). The PCA of the transcriptomes distinctly clustered all 12 samples into a MYCEL group, a SPORE group and a third group comprised of NECT and SAP samples, demonstrating a more similar transcriptional pattern shared by NECT and SAP samples (Supplementary Figure S1B). Accordantly, there were remarkably less differentially expressed genes when NECT were compared to SAP samples (469 genes) than when NECT or SAP were compared with either MYCEL or SPORE samples (e.g., NECT vs MYCEL, 3663 genes; NECT vs SPORE, 5565 genes).
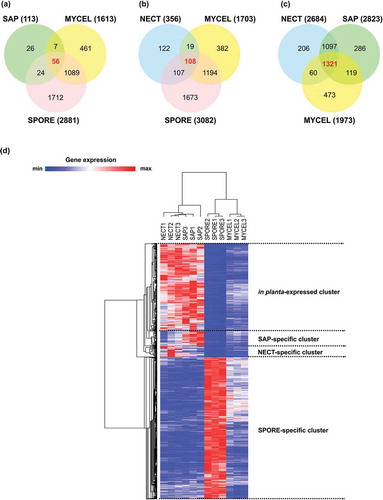
As our transcriptomic data represented H. parviporum growth under different conditions apart from the axenic culture, we then focused on identifying highly expressed genes specific to each condition. Those condition-specific genes were significantly up-regulated under that particular condition when compared with all remaining studied conditions. As a result, 56, 108 and 1321 genes were obtained and designated as NECT-, SAP- and SPORE-specific genes, respectively (–). As NECT and SAP displayed similar transcriptional profile, we also inspected genes that were up-regulated in both NECT and SAP when compared with both MYCEL and SPORE, and defined the resulting 896 genes as in planta-expressed genes. Hierarchical clustering of the TPM values of those genes clearly yielded four clusters corresponding to these four individual gene sets ()).
Figure 5. Selection of condition-specific genes and in planta-expressed genes. (a) Venn diagram showing the number of significantly up-regulated (unique and common) genes during mycelial growth in living trees (NECT) relative to mycelial growth in liquid media (MYCEL), sawdust (SAP) and conidiospores (SPORE). (b) Venn diagram showing the number of significantly up-regulated (unique and common) genes in SAP relative to MYCEL, NECT and SPORE. (c) Venn diagram showing the number of significantly up-regulated (unique and common) genes in SPORE relative to MYCEL, NECT and SAP. The numbers in bold red indicated the number of condition-specific genes. (d) Hierarchical clustering of condition-specific and in planta-expressed genes using their TPM values.
Functional categorization of selected gene sets from transcriptomic analysis
We closely inspected the selected gene sets and categorized their main functions based on the available annotations from a previous study [Citation14] and overrepresented GO terms or KEGG pathways. The SPORE-specific genes dramatically outnumbered the NECT- and SAP-specific genes, having 1321 genes (Supplementary Table S3A), which presented GO enrichment of Small molecule metabolic process (GO:0044281), Secondary metabolic process (GO:0019748), Protein folding (GO:0006457) and Translation factor activity, RNA binding (GO:0008135) and KEGG pathway enrichment of Oxidative phosphorylation (hir00190), Spliceosome (hir03040), RNA polymerase (hir03020), Pyrimidine metabolism (hir00240) and Purine metabolism (hir00230) (). Although not significantly enriched, other main KEGG pathways (at least 8 involved genes) were found involved in similar activities as above enriched terms, such as Ribosome (hir03010, 14 genes), RNA transport (hir03013, 14 genes), Protein processing in endoplasmic reticulum (hir04141, 13 genes), Ubiquitin mediated proteolysis (hir04120, 8 genes), and Biosynthesis of amino acids (hir01230, 18 genes) (Supplementary Table S3A). The main KEGG pathway of Carbon metabolism (hir01200, 19 genes) including Citrate cycle, Glyoxylate cycle and Pentose phosphate pathways were also up-regulated in conidiospores of H. parviporum, further supplying energy and metabolic intermediates for various biosynthetic processes. Pathways of Lipid metabolism such as Glycerophospholipid metabolism (hir00564, 6 genes), Sphingolipid metabolism (hir00600, 4 genes) and Glycerolipid metabolism (hir00561, 4 genes) were expectedly up-regulated as spore membrane components, energy storage or signaling molecules.
Table 2. Significantly enriched GO terms and KEGG pathways of selected gene sets.
Intriguingly, SAP-specific genes displayed significant overrepresentation of the GO terms of DNA binding transcription factor activity (GO:0003700) (). In total, 12 out of 108 genes (Supplementary Table S3B) were predicted to have DNA binding domains related to transcription factors such as the Zn(2)-C6 fungal-type DNA binding domain, Zinc finger C2H2-type and Basic-leucine zipper domain [Citation15]. The genes associated with signaling and other regulatory processes were also highly induced and equally dominant in the SAP-specific gene subset. There were three genes encoding proteins affiliated with Protein kinase-like domain family, members of which could catalyze the phosphorylation of a wide range of protein substrates [Citation16]. Opposite to the phosphorylation process, one tyrosine-specific and one serine/threonine-specific phosphatase were also found. Moreover, one up-regulated gene encoded a Rho GTPase-activating protein domain, which catalyzes the hydrolysis of GTP attached to the GTPase from Rho family, thereby inactivating the Rho GTPase [Citation17]. Antagonistically, one gene was found to contain the Dbl homology (DH) followed by the Pleckstrin homology (PH) domains that have been shown to engage in guanine nucleotide exchange factors (GEFs) activity and activate Rho GTPase [Citation17,Citation18]. An Arrestin-related protein might also involve in signaling pathways [Citation19]. In addition to signal transduction, H. parviporum overexpressed two genes with predicted families of Histone-lysine N-methyltransferase SETD1-like and Histone methyltransferase complex subunit ASH2, respectively, that could both act in the methylation of lysine 4 of histone H3 in yeast [Citation20,Citation21]. One leucine carboxyl methyltransferase that functions in the regulation of the serine/threonine protein phosphatase 2A (PP2A) activity in yeast [Citation22] and one subunit of the Mediator regulatory module that represses the transcription of a subset of genes regulated by the Mediator complex in eukaryotes [Citation23] were also strongly induced. Not surprisingly, H. parviporum was also equipped with a minority of genes from other categorized functional groups, such as the three proteins implicated in biosynthesis of secondary metabolites (putative terpenoid synthase/cyclase), two transporters (one ammonium and one sugar transporter), one guanine deaminase (hydrolyzing guanine to xanthine and ammonia [Citation24]) and two proteases (one secreted aspartyl protease and one metallopeptidase) potentially contributing to fungal nutrient acquisition. Taken together, the predominant number of genes of diverse regulatory activities underlined that H. parviporum has established an extensive invasive mycelial network from their sawdust inoculum source, where a variety of responses were triggered or altered to maximize the usage of available resources.
The NECT-specific gene set was enriched in genes involved in carbohydrate metabolic process (GO:0005975) and genes possessing hydrolase activities, acting on glycosyl bonds (GO:0016798) (). Close inspection of NECT-specific genes (Supplementary Table S3C) showed that 15 out of 56 genes encoded putative carbohydrate-active enzymes (CAZymes), 12 of which could be secreted. These CAZymes were predicted mainly to target plant cell wall polysaccharide complex, including cellulose, hemicellulose, pectin and lignin (Supplementary Table S3C) [Citation25]. The sugars derived from plant cell wall degradation might then be translocated and utilized as carbon source as two sugar transporters were also highly induced. One gene coding for hydroxyisourate hydrolase that normally functions in the purine catabolism pathway was highly expressed, indicating that purine might serve as a nitrogen source for fungal necrotrophic interaction [Citation24]. Additionally, H. parviporum up-regulated several genes encoding proteins associated with detoxification and stress tolerance, such as the secreted cytochrome P450 and the glutathione S-transferase that could conjugate the reduced form of glutathione (GSH) to xenobiotic substrates for detoxification. To facilitate necrotrophic development and subvert plant defense response, pathogens need to deploy an arsenal of pathogenicity factors involving secondary metabolites and small secreted proteins. In agreement with this, three genes encoding secreted hypothetic proteins and one gene that appeared to have 97% similarity to a nonribosomal peptide synthetase-like gene (protein id:57251) of H. irregulare TC 32-1 [Citation26] were highly induced. Interestingly, two genes related to NADH dehydrogenase participating in mitochondrial oxidative phosphorylation might be triggered to provide more energy needed for confronting with trees.
Similarly, in planta-expressed 896 genes (Supplementary Table S3D) showed overrepresentation of genes engaged in carbohydrate metabolic process (GO:0005975) and of hydrolase activities, acting on glycosyl bonds (GO:0016798) with additional enriched terms of transmembrane transport (GO:0055085) and ion binding (GO:0043167) (). The in planta-expressed genes were dominated by genes spanning all the functional categories mentioned in NECT- and SAP-specific list along with a few additional categories (e.g., CAZymes, hydrophobins, proteinases, cytochrome P450, MFS transporters, sugar and amino acid transporters, kinases/phosphatases, transcription factors, and secreted hypothetic proteins).
Associations of TE expression with DNA methylation
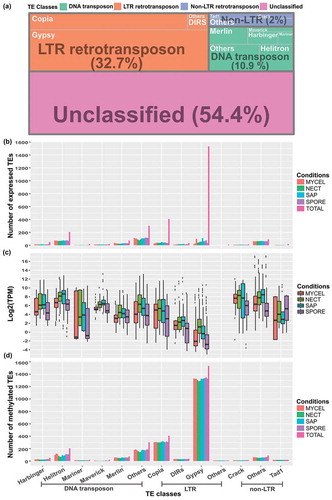
With the demonstrated DNA methylation in TE-rich regions, we next examined the expression of the predicted TEs and their connections to DNA methylation. In H. parviporum 96026, more than half of the predicted TEs (54.4%) were uncategorized, occupying approximately 5% of the fungal genome [Citation14]. Among the categorized TEs, the long terminal repeat (LTR) retrotransposon (32.7%) was the most abundant class, accounting for 14.6% of genome, followed by DNA transposon (10.9%) and non-LTR retrotransposon (2.0%) covering 0.92% and 0.28% of the full genome, respectively ()). We analyzed the expression and methylation of the classified TEs in more detail in this study. In each subclass, only a few TEs were expressed in studied conditions with the exception of the ‘Others’ of LTR retrotransposons that were all silent ()). Particularly, Gypsy, the most abundant superfamily, merely had 1.3–7.2% of its members expressed with the lowest expression levels (0.53–1.77 TPM) among all TE subclasses (,). Differently, most of TEs in each subclass were methylated ()). For example, 83.8–87.9% of Gypsy members have been found methylated in CpG context with average methylation level of 50.1–56.7%. The unexpressed elements of ‘Others’ LTR retrotransposons subclass had the average methylation level of 87.4–97.1%. The significant negative association between TE expression levels and TE methylation levels was present in all TE (sub)classes (except for the ‘Others’ LTR retrotransposons) and in all conditions (Supplementary Figure S3), and the Rho correlation coefficients ranged from -0.72 to -0.73 in those conditions (p < 0.001).
Figure 6. Expression levels and methylation status of different classes of TEs. (a) Occurrences of predicted TEs in H. parviporum 96026 genome. (b) Barplot showing the number of expressed TEs in the studied four conditions. ‘TOTAL’ represented the total number of TEs in each subclass. The biological replicates of each condition were indicated by using the same bar color. (c) Boxplot of TEs expression level represented by Log2 TPM values in the studied conditions. (d) Barplot showing the number of methylated TEs. ‘TOTAL’ represented the total number of TEs in each subclass. The biological replicates of each condition were indicated by using the same bar color.
Associations of gene expression with DNA methylation
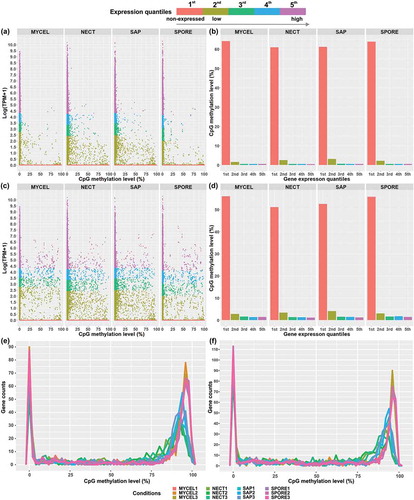
The certain level of DNA methylation found in genes and gene-flanking regions subsequently led us to check the relationship between the gene expression level and their methylation status as well. In both the transcribed regions and within 1.5 kb upstream of genes, the non-expressed genes (1st group) showed a wide range of methylation level (,) with a majority of genes either heavily or weakly methylated (,), resulting in markedly higher average CpG methylation level (gene body: 60.9–64.1%; gene upstream: 51.1–56.0%) than the expressed genes (,). Nonetheless, the most highly expressed genes (5th group) were least methylated (gene body: 0.45–0.57%; gene upstream: 1.10–1.44%) (–). Noticeably, the moderately expressed genes (3rd and 4th groups) had similar average methylation level (gene body: 0.50–0.61%; gene upstream: 1.30–1.77%) to the most highly expressed genes, but smaller than the lowly expressed genes (2nd group; gene body: 1.56–3.12%; gene upstream: 2.80–4.09%) (,). The Rho correlation coefficients between gene expression level and methylation level for transcribed regions (−0.080 to −0.118) and for 1.5 kb upstream of genes (−0.084 to −0.113) were dramatically smaller than those of TEs. Consequently, it is likely that DNA methylation exerts essentially little regulatory effects on the expression of most of genes, except for a small population of genes, the expression of which might be subject to repressive control under specific conditions.
Figure 7. Association of expression level represented by Log (TPM+1) with CpG methylation levels of (a,b) transcribed region of genes and (c,d) 1.5 kb upstream of genes in the four conditions. The gene expression levels were divided into five groups. The 1st group represented the non-expressed genes, and 2nd to 5th groups included the lowest 25% to the highest 25% of expressed genes in the four conditions. Genes of all biological replicates were plotted. (e) The distribution of DNA methylation level of transcribed region of 1st group of genes (non-expressed genes). (f) The distribution of DNA methylation level of 1.5 kb upstream of 1st group of genes (non-expressed genes).
We next inspected those heavily methylated (CpG methylation level ≥75%) and non- or lowly expressed (TPM≤1) genes in at least one condition (hereinafter called amenable genes). In total, 278 and 254 predicted amenable genes having high methylation level in their transcribed regions and within 1.5 kb upstream, respectively, were singled out, of which 232 genes were strongly methylated in both regions. The GO term of DNA metabolic process (GO:0006259) was enriched in this amenable gene set (). However, only 79 genes were predicted to encode InterPro domains (Supplementary Table S4A,B), among which a large fraction of genes (23 genes) were found to possess domains associated with TEs such as reverse transcriptase domain, integrase catalytic core domain, ribonuclease H-like domain and retrotransposon gag domain (Supplementary Table S4A). It appeared that most of those genes were flanked by, partially overlapped or completely embedded in the predicted TE sequences. Additionally, genes containing helicase-related domains including DEAD/DEAH RNA helicase domain and DNA helicase Pif1-like domain were also found abundant (Supplementary Table S4A). Intriguingly, four CAZymes (namely, one secreted GH51, one secreted PL1, and two GMC oxidoreductases), one secreted serine protease (S53), three proteins from cytochrome P450 superfamily (one secreted) and six Zinc finger C2H2-type domain containing proteins were among the list (Supplementary Table S4A), potentially amenable to transcriptional suppression effects inflicted by DNA methylation.
Lastly, to reveal the involvement of DNA methylation in the modulation of gene expression in response to our different studied conditions, we identified differentially methylated cytosine sites (DMS, FDR<0.01) from the pairwise comparisons of our interest, namely, NECT vs MYCEL, SAP vs MYCEL and SPORE vs MYCEL. To improve the statistical efficiency, we only considered the cytosine sites that had methylation occurred in at least one sample of the compared conditions. There were 76,969, 185,815 and 89,861 DMS in the above-mentioned comparisons, respectively, with 10,870, 17,222 and 6091 DMS located in the gene transcribed regions, and 8060, 14,656 and 5685 DMS situated within 1.5 kb upstream of genes (Supplementary Figure S4). We then selected the DMS-associated genes (harboring at least six DMS in either transcribed regions or within 1.5 kb upstream of genes) and compared them with the differentially expressed genes in corresponding comparisons.
In total, there were 23 DMS-associated, up-regulated genes when NECT (16 genes), SAP (22 genes) and SPORE (0 genes) were compared with MYCEL, of which 15 genes were shared by NECT vs MYCEL and SAP vs MYCEL comparisons (Supplementary Table S5A). Interestingly, 13 out of the 23 genes also belong to the amenable genes aforementioned, further supporting their transcriptional propensity to be repressed by DNA methylation in a condition-dependent manner. As the example shown in ), these 13 genes together with another five expressed genes following the methylation pattern that their transcribed regions or within 1.5 kb upstream or both regions were methylated in all conditions with NECT and SAP being less methylated than MYCEL and SPORE (methylation pattern I), presumably rendering their higher transcript abundance in NECT and SAP. The remaining five genes had slightly higher methylation levels in NECT and SAP than MYCEL and SPORE, despite being up-regulated in NECT and SAP (methylation pattern II). Nonetheless, the methylation level of the cytosine sites was generally very low (average CpG methylation level less than 10%) ()). The genes complying with the first methylation pattern included three amenable genes mentioned above (secreted serine protease S53, secreted cytochrome P450 and GMC oxidoreductase), and genes encoding ATPase related domain of AAA type, Ankyrin repeat-containing domain, F-box domain, and WD40-repeat-containing domain (Supplementary Table S5A). Genes of pattern II also included a member of cytochrome P450 superfamily (Supplementary Table S5A).
Figure 8. Examples of methylation patterns in relation to expression level under different conditions. (a) Methylation pattern I: One GMC oxidoreductase (evm.scaffold20.13) was heavily methylated in all conditions with lower methylation level and higher transcript abundances in NECT and SAP. (b) Methylation pattern II: One protein from cytochrome P450 superfamily (evm.scaffold2.271) had slightly higher methylation levels and higher transcript abundance in NECT and SAP. (c) Methylation pattern III: RNA polymerases III RPC1 subunit encoding gene (evm.scaffold29.111) had higher methylation levels and lower transcript abundance in NECT and SAP.
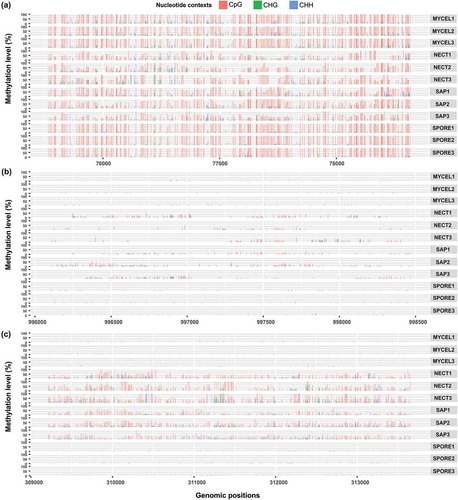
On the other hand, there were 28 DMS-associated, down-regulated genes in the comparison of NECT vs MYCEL and 39 genes in SAP vs MYCEL with 25 genes shared by both comparisons (Supplementary Table S5B). Similarly as the up-regulated genes, not a single DMS-associated gene could be pinpointed to link to the down-regulation of genes when SPORE was compared to MYCEL. Moreover, we noticed another distinct methylation pattern that NECT and SAP displayed higher methylation levels than MYCEL and SPORE (methylation pattern III, )), which was functionally in agreement with their reduced expression level. However, none of those genes was observed to be as heavily methylated (CpG methylation level ≥75%) as the DMS-associated, up-regulated genes to completely silence their expression (TPM≤1). In analogy to the up-regulated genes, genes encoding WD40-repeat-containing domain, Ankyrin repeat-containing domain and F-box domain were present in the down-regulated gene list. Strikingly, one gene encoding DNA-directed RNA polymerase III subunit RPC1 possessed the highest number of DMS (842 DMS in NECT vs MYCEL and 987 DMS in SAP vs MYCEL) among all down-regulated genes (), Supplementary Table S5B). Other than that, one secreted protein and one acetyl-CoA synthetase-like protein also had more than 200 DMS in both comparisons among genes having InterPro annotations.
It is worth mentioning that as NECT vs SAP had only 469 differentially expressed genes and 265 DMS (not shown), no DMS-associated genes could be identified to clearly correspond to the transition of saprotrophic sawdust growth to necrotrophic growth within host trees. Additionally, our highly expressed condition-specific genes classified from transcriptomics had almost no detectable or very low methylation level.
DNA methyltransferases
Three putative DNA methyltransferases (DNMTs)-coding genes with RNA transcript support were identified in H. parviporum genome. Based on the signature domains, we assigned two genes (evm.scaffold1.83 and evm.scaffold4.208) to the Dnmt1/Dim2-like group and the remaining one gene (evm.scaffold1.1154) to the Dnmt2/RID-like group. Phylogenetic analysis of these two groups of H. parviporum DNMTs revealed that the two DNMTs from Dnmt1/Dim2-like group clustered with the Ascobolus immersus Masc2 belonging to Dnmt1 family [Citation27], Dnmt1a and Dnmt1b of other two basidiomycetes Coprinopsis cinerea and Laccaria bicolor [Citation12], supporting the presence of two copies of Dnmt1 for maintenance methylation in H. parviporum (Supplementary Figure S5A). The DNMT from Dnmt2/RID-like group is the ortholog of C. cinerea and L. bicolor DNMTs from Dnmt2 family responsible for tRNAAsp methylation, and is distant from the well-characterized RID1 of Neurospora crassa, Masc1 of A. immersus as well as Dnmt3 from plants and animals (Supplementary Figure S5B). Interestingly, in contrast to evm.scaffold1.1154 that was expressed in all our studied conditions, evm.scaffold1.83 was mainly expressed in MYCEL and SPORE, whereas evm.scaffold4.208 showed preferential expression in NECT and SAP, implying the alternative activities of Dnmt1 DNMTs in different conditions (Supplementary Figure S5C). Furthermore, one additional gene (evm.scaffold16.93) was found to contain the catalytic DNA methylase domain together with the SNF2_N and Helicase_C domains that are characteristic domains of Snf2 superfamily. This gene could be classified as a member of Rad8 subfamily as described by Huang et al. [Citation28] with putative novel yet undefined function.
Discussion
The lifestyles of fungal biota are known to be plastic. Many fungal species are capable of employing multi-trophic strategies such as necrotrophy and saprotrophy as these strategies are not necessarily mutually exclusive [Citation29–Citation31]. Similarly, host-pathogen interactions are highly plastic, attributed to constant selection pressure imposed by both interacting organisms. The phenotypic plasticity of fungal pathogens could be derived from their rapidly altered and tactically regulated gene expression profiles in response to changing conditions. Here, we performed an in-depth transcriptomic analysis of the economically significant H. parviporum-Norway spruce interaction via saprotrophic sawdust inocula. This not only enabled the identification of fungal genes that are critical during necrotrophic interactions and saprotrophic sawdust growth, but also allowed us to relate a group of genes to the transition from saprotrophy to necrotrophy lifestyles. Additionally, genes and their associated pathways highly induced in conidiospores could constitute a starting point for more detailed studies in the asexual lifecycle of H. parviporum.
Spores are generally considered to be dormant and metabolically inactive [Citation32]. However, asexual spores could readily germinate upon exposure to suitable conditions (e.g., lab conditions) [Citation32]. Germ tube emergence from H. parviporum conidiospores was previously observed after 18-hour incubation in Hagem medium [Citation33]. During the initial stage of conidial germination, progressive increase of nucleic acid and protein synthesis, energy utilization and fatty acid metabolism were observed in F. oxysporum f. sp. ciceris [Citation35]. Genes implicated in fundamental cellular processes such as ribosome and nucleotide biogenesis, ubiquitin, and translation factors were found to be conidial germination-associated in three Aspergillus species [Citation34]. In our study, a total of 1321 SPORE-specific genes were obtained, indicative of the occurrences of dramatic metabolic and physiological variation in H. parviporum non-resting conidiospores. The GO and KEGG enrichment analysis revealed abundant genes involved in the primary cellular activities including nucleic acid synthesis, transcription, translation, protein processing and degradation as well as metabolism of small molecules and secondary metabolites, which were possibly driven by energy produced by oxidative phosphorylation. Interestingly, although secondary metabolites produced by pathogenic fungi are normally considered to contribute to virulence, examples for potential link of secondary metabolites (e.g., melanin, mycotoxins) to fungal development have also been reported [Citation36]. Distinct connections of SPORE-specific genes implicated in secondary metabolite metabolism to H. parviporum conidial germination remains undefined and could be highlighted for further study.
In the SAP-specific genes, a large group of encoded proteins were surprisingly found engaged in signal transduction (e.g., kinase-like proteins, tyrosine-specific and serine/threonine-specific phosphatases) or transcriptional regulation (e.g., proteins containing transcription factor-related domains). Interestingly, apart from the genes mediating the phosphorylation/dephosphorylation cycles, another pair of highly expressed genes possess inverse functions in terms of regulating Rho GTPase activity (a negative regulator containing the Rho GTPase-activating protein domain and a positive regulator encoding the Dbl-family guanine nucleotide exchange factor) [Citation18]. Rho-family GTPases, albeit with varied contribution, were shown to modulate hyphal morphogenesis such as cell wall integrity, septation formation and polarized hyphal growth in basidiomycetes Cryptococcus neoformans and Ustilago maydis [Citation17]. One protein containing the Usd1 (Up-regulated during septation protein 1) domain (evm.scaffold20.9) originally observed up-regulated during the onset of septation in Schizosaccharomyces pombe [Citation37] and one subunit of COP9 signalosome complex (evm.scaffold10.170) serving for mediating metabolic response to oxidative stress and cell wall rearrangement during development in Aspergillus nidulans [Citation38] also appeared up-regulated in H. parviporum saprotrophic sawdust growth. Thus, it is likely that H. parviporum growing in sawdust might coordinate certain hyphal morphogenesis events with growth condition upon sensing ambient stressors from neighboring saprotrophic or even necrotrophic hyphae. This might be attributed to the concerted regulation of Rho-related GTPases by Rho GTPase-activating protein and guanine nucleotide exchange factor. Furthermore, one type of stress during fungal infection is the elevated pH as a host inhibitory response [Citation39]. Consequently, an Arrestin-related protein containing the arrestin N-terminal and C-terminal domains, similar to A. nidulans PalF protein involved in ambient pH signaling pathway [Citation19], might be triggered for pH signal transduction in H. parviporum. Strikingly, two genes (Set1-like and Ash2-like) putatively affiliated with yeast Set1/COMPASS complex, which is specific for histone H3 lysine 4 methylation (H3K4me) [Citation20,Citation21], were observed in SAP-specific list. H3K4me is a conserved epigenetic mark generally associated with active transcription in eukaryotes [Citation40]. Recent studies reported that Set1 responsible for H3K4me in Fusarium graminearum was required for hyphal growth, full virulence, biosynthesis of the secondary metabolite deoxynivalenol and regulation of cell wall stress response [Citation41]. The Set1 in Magnaporthe oryzae was found to play crucial roles in infection-related morphogenesis and pathogenicity [Citation42]. Therefore, we speculated that histone methylation might be another employed regulatory means by H. parviporum, although more evidence is needed to support this hypothesis. In a nutshell, H. parviporum in the sawdust might undergo a series of developmental re-programming to secure its continuous aggression by virtue of robust signaling and regulatory machineries, the coding genes of which could be of key relevance to fungal virulence and lifestyle transition, and merits future experimental investigation.
As reflected by both in planta-expressed and NECT-specific genes, H. parviporum was mainly steered by the needs of plant penetration (e.g., cell wall degrading CAZymes), flexible utilization of fluctuating nutrients (e.g., sugar transporters), and evasion and tolerance of host-derived defenses and stresses (e.g., cytochrome P450, glutathione S-transferase) to maximize its survivorship during the course of invasive growth. Particularly, those highly induced secreted proteins such as CAZymes, proteases, cytochrome P450 and hypothetic proteins might directly serve as frontline players in interactions with trees, and the functions of these secreted hypothetic proteins deserve further functional characterization. It is noteworthy that when propagated from sawdust to neighboring living tree tissues in our case, H. parviporum might tend to use a majority of overlapping molecular repertoire as indicated by the comparatively larger number of in planta-expressed genes than NECT- or SAP-specific genes.
With the transcriptomic profiles determined, we then switched to profiling DNA cytosine methylation, for which a growing body of evidence have demonstrated its dynamic patterns and diverse functionalities in fungi [Citation7–Citation13]. A range of global methylation levels of 3.3%–5.2% was observed in the four conditions of H. parviporum with a pronounced preference for CpG dinucleotides (6.7–9.3%) over non-CpG nucleotide contexts (2.0–3.7%), which is a phenomenon also shared by the majority of other species having methylation pattern studied [Citation6,Citation7,Citation12]. Analysis of the distribution of mC sites at different functional genomic regions uncovered both the clearly elevated methylation level and methylation density in TE-rich regions, particularly in CpG context (), ), indicating its potential function of controlling the unchecked proliferation of TEs in genome. TEs are often perceived as groups of genomic parasites and have profound effects on genome organization and gene expression [Citation43]. As expected, most of the classified TEs especially the most abundant Gypsy superfamily in H. parviporum were shown to be transcriptionally inactive yet methylated in all conditions (,). Those highly expressed TEs appeared to be less methylated, demonstrating a general negative correlation between TE expression and TE methylation (Supplementary Figure S3). Moreover, a large proportion of amenable genes (CpG methylation level ≥75%, TPM≤1) were identified to be TEs-associated (e.g., reverse transcriptase domain, integrase catalytic core domain). All lines of evidence taken together, our results underpinned the consensus view of DNA methylation as a fungal genome defense mechanism via transcriptional repression of TEs.
Recently, the presence of cytosine methylation in gene bodies has been increasingly reported in many eukaryotic organisms including fungi [Citation13,Citation44]. In H. parviporum, the occurrences of methylation in genes, markedly increased methylation level in gene flanking regions, together with varied methylation level in different conditions, particularly in NECT and SAP conditions (,) made us speculate that DNA methylation may, to a certain extent, play a role in condition-specific gene expression. Indeed, we were able to identify a small group of amenable genes that have been extensively methylated (CpG methylation level ≥75%) and barely expressed (TPM≤1) in at least one condition, despite the very low correlation coefficients (−0.080 to −0.118) between the methylation level (upstream or transcribed regions of genes) and expression level of all genes in H. parviporum. The GO term of DNA metabolic process enriched in our amenable genes was also found enriched in the heavily methylated genes of the parasitic nematode Trichinella spiralis [Citation45]. The representative amenable genes, in addition to the TE-associated genes discussed above, also include those encoding helicase-related domains, particularly DEAD/DEAH box helicase domain and Zinc finger C2H2-type domain involved in RNA metabolism and transcriptional regulation [Citation46,Citation47]. Those genes were basically silent in almost all our conditions, implying their redundant or non- functionality at least in those conditions. However, it remains undetermined if the methylation is a cause or the consequence of their silence.
We then focused on identifying differentially methylated (DMS-associated) and differentially expressed genes cued by our different conditions, among which we categorized three methylation patterns with regards to their expression levels. Methylation pattern I and II were presented by genes that were up-regulated when NECT and SAP were compared with MYCEL. Genes showing pattern I included 13 amenable genes and were extensively methylated in all four conditions but slightly less methylated under NECT and SAP conditions. The expression of such genes (e.g., a secreted serine protease S53, an ATPase, a GMC oxidoreductase) might be silenced by DNA methylation in free-living mycelia (MYCEL) and conidiospores (SPORE) and somewhat de-repressed after transitioning to saprotrophic sawdust or necrotrophic growth (NECT and SAP) as required. Conversely, genes fulfilling pattern II (e.g., a cytochrome P450) had higher methylation level in samples of NECT and SAP than MYCEL and SPORE. However, their methylation levels were rather low (<10%), and DNA methylation alone might not be sufficient for repression. As it is unclear if any threshold exists for DNA methylation to take effect, the influence of DNA methylation on those genes should be interpreted with caution. Genes of the last pattern were down-regulated when NECT and SAP were compared with MYCEL, which coincided with the increased methylation levels in NECT and SAP, implying the potential transcriptional suppressive role of DNA methylation in those genes under NECT and SAP conditions. However, this group of genes such as the DNA-directed RNA polymerase and acetyl-CoA synthetase-like protein still appeared to be expressed constitutively in all conditions, probably attributed to their intermediate methylation level (<75%). Additionally, genes encoding WD40 repeat-containing domain, Ankyrin repeat-containing domain and F-box domain were present in both differentially expressed, DMS-associated gene sets, suggesting that those repeat domains might be more prone to the regulations of DNA methylation. Proteins containing these repeat domains are known to serve as scaffolds in assembling functional complexes and provide sites for protein-protein interactions in various important processes such as signal transduction, cell cycle control and ubiquitination [Citation48–Citation50]. Their methylation therefore might act as shortcuts to regulate wider intracellular processes.
The clearly different methylation patterns detected between samples of MYCEL, SPORE and of NECT, SAP might be indirectly reflected by the two alternatively induced H. parviporum DNA methyltransferases from Dnmt1 family with one being more active in MYCEL and SPORE samples and the other in NECT and SAP samples. Additionally, we did not find any DMS-associated, differentially expressed genes during the conidiospores germination (SPORE vs MYCEL) and transition of saprotrophic sawdust growth to necrotrophic growth (NECT vs SAP), further evidence of which is undoubtedly an important future endeavor.
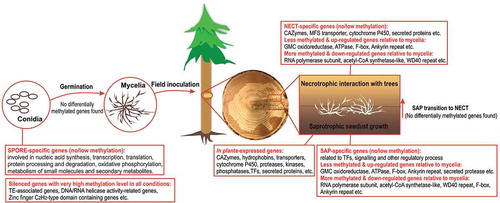
To summarize, in the work herein, we described and compared the transcriptomic and cytosine methylation profiles from multiple conditions (free-living mycelia, conidiospores, saprotrophic sawdust growth and necrotrophic interaction with host trees) of the conifer fungal pathogen H. parviporum. We presented lists of key genes specific to conidiospores, saprotrophic growth, and necrotrophic growth (condition-specific) as well as highly induced genes in both saprotrophic and necrotrophic growth (in planta-expressed) (). We showcased that DNA methylation mainly concentrated on TE-rich regions as a conventional genome defense mechanism. We further demonstrated the implication of DNA methylation in gene transcription by identifying sets of genes with varied methylation level during saprotrophic and necrotrophic growth in comparison with free-living mycelia (). A group of silent genes in all conditions probably ascribed to DNA methylation was also explored (). Our data characterized the first and differential methylomes of a conifer pathogen under different conditions, and opened the possibility of DNA methylation as a regulatory mechanism for different lifestyle strategies in this and potentially other fungi for future assessment.
Figure 9. Summary of representative genes or biological processes in the generated gene sets of our study. All analyzed genes sets were summarized in square blocks.
Materials and methods
Fungal strain, sample preparations, genomic DNA and total RNA extractions
The H. parviporum 96026 (HAMBI nr 2359) was cultured on Hagem plates (glucose 5 g/l, NH4NO3 0.5 g/l, KH2PO4 0.5 g/l, MgSO4∙7H2O 0.5 g/l, malt extract 5 g/l, pH 5.5) for three weeks at 22 °C for abundant conidiospore formation. Thereafter, conidiospores (SPORE) were collected by flooding the surface of plates with sterile MilliQ, followed by filtering with Miracloth to remove hyphal fragments and further concentrated by centrifuging at 4000 × g for 20 min. The free-living mycelia (MYCEL) derived from spore suspensions were then harvested from three-week old Hagem liquid culture and ground in sterile mortars pre-cooled with liquid nitrogen. The homogenized and concentrated spore suspensions and hyphae powder were subject to genomic DNA and total RNA extractions using Fungal/Bacterial DNA MiniPrep kit (Zymo Research) and TRI Reagent (Sigma Aldrich), respectively, as per manufacturer’s instructions.
Additionally, to collect the samples originated from different lifestyles, H. parviporum 96026 was cultivated in flasks containing 12 g of sterilized Norway spruce sawdust and 50 ml of nutrient solution (glucose 5 g/l, NH4NO3 0.5 g/l, KH2PO4 0.5 g/l, MgSO4∙7H2O 0.5 g/l) for one month at 22 °C prior to field inoculation. In the field, 12 Norway spruce trees with stem diameter of around 12 cm were chosen in a forest in Lapinjärvi, Finland (60.5967 N, 26.1517 E) owned by Natural Resources Institute Finland (Luke). Inoculation was performed as shown in ) in August by deep drilling till reaching the center of the stem, creating 15 mm in diameter holes. Subsequently, the drilled holes were quickly filled with H. parviporum pre-colonized sawdust and sealed with parafilm. Each tree has three inoculations at 50 cm, 100 cm and 150 cm above the ground level. After three and half months, stem tissues containing the inoculated holes were cut from trees. The inoculated holes were then cut open after transportation ()). Sawdust in the drilled holes ()) and the surrounding areas of drilled holes containing the mixture of necrotic stem tissues and fungal mycelia (,) were collected separately. The collected samples were ground into powder by a sterile liquid nitrogen-cooled IKA® A11 basic mill (IKA-Werke GmbH & Co. KG, Germany) and immediately stored at −80 °C until further use. The genomic DNA and total RNA from fungal colonized sawdust (representing fungal saprotrophic growth, SAP) and from the invaded necrotic stem tissue mixture (representing fungal necrotrophic growth, NECT) of these 12 trees (three biological replicates with each replicate consisting of four pooled trees) were extracted simultaneously by a previously described protocol [Citation51]. The extracted DNA concentration and integrity were determined by Qubit™ Fluorimeter (Thermo Fisher Scientific Inc.) and gel electrophoresis (1% Tris-acetate-EDTA agarose gel), respectively. The total RNA quality was assessed by Agilent 2100 bioanalyzer.
Whole-genome bisulfite sequencing and data analysis
Whole-genome bisulfite sequencing (100-bp paired-end) was carried out for the samples of MYCEL, SPORE, SAP and NECT (three biological replicates per type of sample) using an Illumina HiSeq 4000 platform (San Diego, CA). All library constructions and sequencing were performed at BGI.
The generated reads were preprocessed by BGI to discard reads with adapter contamination, or with more than 10% of either low quality (Q score <20) or ambiguous bases. Since wrong base calls can introduce incorrect methylation calls, the preprocessed reads were further trimmed by Trim Galore v.0.4.5 (https://www.bioinformatics.babraham.ac.uk/projects/trim_galore/) to trim off low-quality bases (Phred score <20). The resulting sequences shorter than 20 bp were removed. The quality of processed reads was assessed by FASTQC v.0.11.2 (http://www.bioinformatics.babraham.ac.uk/projects/fastqc/).
As DNA methylation is strand-specific, the trimmed reads were in silico transformed into fully bisulfite-converted reads (i.e., cytosine residues on the forward reads were replaced by thymine and guanine residues on the reverse reads were replaced by adenosine). Subsequently, the converted reads were mapped against the similarly converted versions of H. parviporum 96026 reference genome [Citation14] (i.e., every cytosine in plus strand was converted to thymine and every guanine in minus strand was converted to adenosine) by Bowtie2v.2.3.2 [Citation52] incorporated in Bismark v.0.19.0 pipeline [Citation53], allowing 0 mismatches in seed alignment (-I 0 -X 2000 -N 0). The resulting BAM files were deduplicated and methylation statuses per cytosine site were extracted (ignoring the first 2 bp from 5′ end of read2) by Bismark v.0.19.0.
Methylation was reflected by the methylation level and methylation density. Methylation level of a specific cytosine site was defined as the number of methylated reads divided by total number of reads covering that particular site, whereas methylation density was described as the number of methylated cytosine sites (mC) divided by total number of cytosine sites in the fungal genome and in CpG, CHG and CHH nucleotide contexts across the genome. Principal component analysis (PCA) of the methylome of all samples was performed with the prcomp function in R v.3.0.2 [Citation54]. The average methylation level of different functional genomic regions (TEs, genes, exons, introns, 1.5 kb upstream of genes relative to putative transcription start sites and 1.0 kb downstream of genes relative to putative transcription termination sites) in CpG, CHG and CHH contexts were determined. Furthermore, TE and gene densities in 10 kb window together with the methylation density of CpG, CHG and CHH in corresponding 10 kb window were visualized with Circos v.0.69.5 [Citation55].
To identify the differentially methylated cytosine sites (DMS) between different conditions, cytosine sites that have no reads mapped in any samples or were globally unmethylated were filtered out. Thereafter, DMS were identified by RADMeth [Citation56] (-bins 1:100:1; false discovery rate, FDR<0.01). Genes having at least six DMS in transcribed regions or within 1.5 kb upstream were defined as DMS-associated genes.
RNA-seq, gene and transposable elements (TEs) expression analysis
The RNA-seq of free-living mycelia (three biological replicates) was conducted in a previous study [Citation14]. Paired-end libraries were prepared for the total RNA extracted from samples of SPORE, SAP and NECT (three biological replicates per type of sample) and sequenced with an Illumina HiSeq 4000 platform (100 bp) at BGI. Reads yielded from RNA-seq were preprocessed by BGI using the same criteria as for bisulfite sequencing reads, followed by assessment with FASTQC v.0.11.2.
The processed RNA-seq reads were mapped against the H. parviporum 96026 genome with STAR v.2.5.2b [Citation57] and uniquely mapped reads were counted at gene level by HtSeq-count script within HTSeq v.0.6.1p1 [Citation58]. The resulting raw read count table of 10,502 predicted genes was normalized by Transcripts Per Million (TPM) method, followed by PCA to assess the variability of the transcriptome among samples. Moreover, the raw read count was also used to identify differentially expressed genes when the samples of four conditions were pairwise compared using edgeR package [Citation59] in R v.3.0.2. Genes with less than 1 read per million in at least 3 of the 12 samples were excluded for further analysis [Citation60]. The cutoff values for defining differentially expressed genes were FDR <0.01 (Benjamini-Hochberg adjustment) and log2-fold-changes (logFC) >1.
Among the differentially expressed genes from all possible pairwise comparisons, genes that were commonly up-regulated in one condition when compared with the remaining three conditions were designated as condition-specific genes. Genes that were significantly up-regulated both during sawdust growth and invasive growth in living stem tissues compared with free-living mycelia and conidiospores were considered as in planta-expressed genes. Hierarchical clustering was performed with Morpheus (https://software.broadinstitute.org/morpheus) using TPM values (Pearson correlation, average linkage).
To identify the enriched Gene Ontology (GO) terms in selected gene sets, the whole proteome of H. parviporum was first blastp against the curated SWISS-PROT protein database v.2017.10 (E ≤ 10–5). The associated GO terms of top hits were mapped and assigned to protein sequences by BLAST2GO v.4.0.7 [Citation61]. Additional terms were retrieved by InterProScan v.5.26.65 [Citation62] and merged to the existing GO annotations. All GO terms were ultimately condensed to corresponding broad functional categories using GO-Slim generic database in Blast2GO. GO (biological process and molecular function) enrichment analysis was achieved with topGO v.2.30.0 [Citation63] (p < 0.01) using Fisher’s exact test. Enriched KEGG pathways were detected by KOBAS v.3.0 [Citation64] (Benjamini-Hochberg adjusted p < 0.05).
The predicted TEs in H. parviporum 96026 were extracted by a Perl script (parseRM_ExtractSeqs_P.pl, available at https://github.com/4ureliek/Parsing-RepeatMasker-Outputs). RNA reads were mapped to the extracted TEs by Bowtie2 v.2.3.2 incorporated in the TEtools pipeline [Citation65] and quantified by the TEcount program in TEtools. The generated TE raw count was normalized with TPM method.
TEs and genes were deemed as expressed or methylated if their TPM values or average methylation levels were higher than 0. The correlation between the expression levels and methylation levels was examined by Spearman correlation test in R v.3.0.2.
Phylogenetic analysis of DNA methyltransferases
The putative C5-DNA methyltransferases (DNMTs) in H. parviporum 96026 were identified based on the domain annotations. Afterwards, protein sequences of DNMTs from selected species of bacteria, fungi, plants and animals were retrieved from UniProt knowledgebase [Citation66] and Joint Genome Institute (JGI) Genome Portal (https://genome.jgi.doe.gov/portal/) (Supplementary Table S6). Domain attribute was deduced by InterProScan v.5.26.65. Dnmt1/Dim2-like and Dnmt2/RID-like proteins were separately subject to phylogenetic analysis by MEGA v.7 [Citation67]. Full-length protein sequences were aligned by MUSCLE [Citation68], and constructed into Neighbor-joining trees. The bootstrap was set as 500 to assess the reliability of constructed trees.
Author’s contributions
FOA conceived of the study, participated in its design and coordination and helped draft the manuscript; ZZ participated in the design of experiment, performed the lab work, data analyses and wrote the manuscript; JW conducted the phylogenetic analysis of DNA methyltransferases; AK contributed to the interpretation of data; TR participated in its design and lab work; ZW and ML helped with the lab work; JW, AK, ZW, ML edited the manuscript. All authors read and approved the final manuscript.
Availability of data and materials
The datasets generated and analyzed during the current study are available in the NCBI SRA database (https://www.ncbi.nlm.nih.gov/sra/) under the accession number SRP161908 and Bioproject PRJNA491463 (https://www.ncbi.nlm.nih.gov/bioproject/) as well as its additional files. The RNA-seq reads of three biological replicates of MYCEL are available in Bioproject PRJNA400846, accession number of SRX3148484, SRX3148494 and SRX3148495.
Supplemental Material
Download Zip (3.6 MB)Acknowledgments
We are grateful to CSC (IT Center for Science, Finland) for computational resources. The authors thank Dr. R Kasanen at the University of Helsinki for assistance during field work.
Disclosure statement
No potential conflict of interest was reported by the authors.
Supplementary material
Supplementary data for this article can be accessed here.
Additional information
Funding
Related Research Data
References
- Asiegbu FO, Adomas A, Stenlid J. Conifer root and butt rot caused by heterobasidion annosum (fr.) bref. s.l. Mol Plant Pathol. 2005 Jul;6(4):395–409. PubMed PMID: WOS:000230765100003; English.
- Berger SL, Kouzarides T, Shiekhattar R, et al. An operational definition of epigenetics. Genes Dev. 2009 Apr 1;23(7):781–783. PubMed PMID: 19339683; PubMed Central PMCID: PMCPMC3959995.
- Zemach A, Zilberman D. Evolution of eukaryotic DNA methylation and the pursuit of safer sex. Curr Biol. 2010 Sep 14;20(17):R780–5. PubMed PMID: 20833323.
- Finnegan EJ, Peacock WJ, Dennis ES. DNA methylation, a key regulator of plant development and other processes. Curr Opin Genet Dev. 2000 Apr;10(2):217–223. PubMed PMID: 10753779.
- Weber M, Schubeler D. Genomic patterns of DNA methylation: targets and function of an epigenetic mark. Curr Opin Cell Biol. 2007 Jun;19(3):273–280. PubMed PMID: WOS:000247775200005; English.
- Su Z, Han L, Zhao Z. Conservation and divergence of DNA methylation in eukaryotes: new insights from single base-resolution DNA methylomes. Epigenetics-Us. 2011 Feb;6(2):134–140. PubMed PMID: 20962593; PubMed Central PMCID: PMCPMC3278781.
- Zemach A, McDaniel IE, Silva P, et al. Genome-wide evolutionary analysis of eukaryotic DNA methylation. Science. 2010 May 14;328(5980):916–919. PubMed PMID: WOS:000277618800056; English.
- Jeon J, Choi J, Lee GW, et al. Genome-wide profiling of DNA methylation provides insights into epigenetic regulation of fungal development in a plant pathogenic fungus, magnaporthe oryzae. Sci Rep-Uk. 2015 Feb 24;5. Artn 8567. DOI:10.1038/Srep08567. PubMed PMID: WOS:000349798800001; English.
- Li WZ, Wang YL, Zhu JY, et al. Differential DNA methylation may contribute to temporal and spatial regulation of gene expression and the development of mycelia and conidia in entomopathogenic fungus metarhizium robertsii. Fungal Biol-Uk. 2017 Mar;121(3):293–303. PubMed PMID: WOS:000395614700008; English.
- Zhu YJ, Xu J, Sun C, et al. Chromosome-level genome map provides insights into diverse defense mechanisms in the medicinal fungus ganoderma sinense. Sci Rep-Uk. 2015 Jun 5;5. UNSP 11087. DOI:10.1038/srep11087. PubMed PMID: WOS:000355879400001; English.
- So KK, Ko YH, Chun J, et al. Global DNA methylation in the chestnut blight fungus cryphonectria parasitica and genome-wide changes in DNA methylation accompanied with sectorization. Front Plant Sci. 2018;9:103. PubMed PMID: 29456549; PubMed Central PMCID: PMCPMC5801561.
- Montanini B, Chen PY, Morselli M, et al. Non-exhaustive DNA methylation-mediated transposon silencing in the black truffle genome, a complex fungal genome with massive repeat element content. Genome Biol. 2014;15(7). ARTN 411. DOI:10.1186/s13059-014-0411-5. PubMed PMID: WOS:000346603300007; English.
- Mishra PK, Baum M, Carbon J. DNA methylation regulates phenotype-dependent transcriptional activity in candida albicans. Proc Natl Acad Sci USA. 2011 Jul 19;108(29):11965–11970. PubMed PMID: 21730141; PubMed Central PMCID: PMCPMC3141964.
- Zeng Z, Sun H, Vainio EJ, et al. Intraspecific comparative genomics of isolates of the Norway spruce pathogen (Heterobasidion parviporum) and identification of its potential virulence factors. Bmc Genomics. 2018 Mar 27;19. ARTN 220. DOI:10.1186/s12864-018-4610-4. PubMed PMID: WOS:000428709900004; English.
- Shelest E. Transcription factors in fungi. Fems Microbiol Lett. 2008 Sep;286(2):145–151. . PubMed PMID: WOS:000258402200001; English.
- Turra D, Segorbe D, Di Pietro A. Protein kinases in plant-pathogenic fungi: conserved regulators of infection. Annu Rev Phytopathol. 2014;52:267–288. PubMed PMID: WOS:000348457000013; English.
- Harris SD. Cdc42/Rho GTPases in fungi: variations on a common theme. Mol Microbiol. 2011 Mar;79(5):1123–1127. PubMed PMID: WOS:000287589000002; English.
- Chhatriwala MK, Bow L, Worthylake DK, et al. The DH and PH domains of trio coordinately engage rho GTPases for their efficient activation. J Mol Biol. 2007 May 18;368(5):1307–1320. PubMed PMID: WOS:000246443200009; English.
- Herranz S, Rodriguez JM, Bussink HJ, et al. Arrestin-related proteins mediate pH signaling in fungi. Proc Natl Acad Sci USA. 2005 Aug 23;102(34):12141–12146. PubMed PMID: WOS:000231476500034; English.
- Krogan NJ, Dover J, Khorrami S, et al. COMPASS, a histone H3 (lysine 4) methyltransferase required for telomeric silencing of gene expression. J Biol Chem. 2002 Mar 29;277(13):10753–10755. PubMed PMID: WOS:000174613100002; English.
- Roguev A, Schaft D, Shevchenko A, et al. The saccharomyces cerevisiae set1 complex includes an Ash2 homologue and methylates histone 3 lysine 4. Embo J. 2001 Dec 17;20(24):7137–7148. PubMed PMID: 11742990; PubMed Central PMCID: PMCPMC125774.
- Leulliot N, Quevillon-Cheruel S, Sorel I, et al. Structure of protein phosphatase methyltransferase 1 (PPM1), a leucine carboxyl methyltransferase involved in the regulation of protein phosphatase 2A activity. J Biol Chem. 2004 Feb 27;279(9):8351–8358. PubMed PMID: WOS:000189103300117; English.
- Samuelsen CO, Baraznenok V, Khorosjutina O, et al. TRAP230/ARC240 and TRAP240/ARC250 mediator subunits are functionally conserved through evolution. Proc Natl Acad Sci U S A. 2003 May 27;100(11):6422–6427. PubMed PMID: WOS:000183190700026; English.
- Chitty JL, Fraser JA. Purine acquisition and synthesis by human fungal pathogens. Microorganisms. 2017 Jun 8;5(2):33. PubMed PMID: 28594372; PubMed Central PMCID: PMCPMC5488104.
- Rytioja J, Hilden K, Yuzon J, et al. Plant-polysaccharide-degrading enzymes from basidiomycetes. Microbiol Mol Biol R. 2014 Dec;78(4):614–649. PubMed PMID: WOS:000345596000003; English.
- Olson A, Aerts A, Asiegbu F, et al. Insight into trade-off between wood decay and parasitism from the genome of a fungal forest pathogen. New Phytol. 2012 Jun;194(4):1001–1013. PubMed PMID: WOS:000303435400014; English.
- Amselem J, Lebrun MH, Quesneville H. Whole genome comparative analysis of transposable elements provides new insight into mechanisms of their inactivation in fungal genomes. Bmc Genomics. 2015 Feb 28;16:141. ARTN 141. PubMed PMID: WOS:000350722700001; English.
- Huang RR, Ding QQ, Xiang YN, et al. Comparative analysis of DNA methyltransferase gene family in fungi: a focus on basidiomycota. Front Plant Sci. 2016 Oct 21;7. ARTN 1556. DOI:10.3389/fpls.2016.01556. PubMed PMID: WOS:000385889300001; English.
- Kuo HC, Hui S, Choi J, et al. Secret lifestyles of neurospora crassa. Sci Rep-Uk. 2014 May 30;4. Artn 5135. DOI:10.1038/Srep05135. PubMed PMID: WOS:000336529300007; English.
- Vasiliauskas R, Menkis A, Finlay RD, et al. Wood-decay fungi in fine living roots of conifer seedlings. New Phytol. 2007;174(2):441–446. PubMed PMID: 17388906.
- Jaber E, Xiao CW, Asiegbu FO. Comparative pathobiology of heterobasidion annosum during challenge on pinus sylvestris and arabidopsis roots: an analysis of defensin gene expression in two pathosystems. Planta. 2014 Mar;239(3):717–733. PubMed PMID: WOS:000331648500015; English.
- Deacon J. Fungal spores, spore dormancy, and spore dispersal in: fungal biology. Malden, MA: Blackwell Pub; 2005. p. 184–212.
- Li GS, Osborne J, Asiegbu FO. A macroarray expression analysis of novel cDNAs vital for growth initiation and primary metabolism during development of heterobasidion parviporum conidiospores. Environ Microbiol. 2006 Aug;8(8):1340–1350. PubMed PMID: WOS:000238885300004; English.
- Hagiwara D, Takahashi H, Kusuya Y, et al. Comparative transcriptome analysis revealing dormant conidia and germination associated genes in Aspergillus species: an essential role for AtfA in conidial dormancy. Bmc Genomics. 2016 May;17;17. ARTN 358. DOI:10.1186/s12864-016-2689-z. PubMed PMID: WOS:000376356000001; English..
- Sharma M, Sengupta A, Ghosh R, et al. Genome wide transcriptome profiling of fusarium oxysporum f sp ciceris conidial germination reveals new insights into infection-related genes. Sci Rep-Uk. 2016 Nov 17;6. ARTN 37353. DOI:10.1038/srep37353. PubMed PMID: WOS:000388272400001; English.
- Calvo AM, Wilson RA, Bok JW, et al. Relationship between secondary metabolism and fungal development. Microbiol Mol Biol R. 2002 Sep;66(3):447-+. PubMed PMID: WOS:000177857300005; English.
- Bicho CC, Alves FD, Chen ZA, et al. A genetic engineering solution to the “Arginine Conversion Problem” in stable isotope labeling by Amino Acids in Cell Culture (SILAC). Mol Cell Proteomics. 2010 Jul 9;(7):1567–1577. DOI:10.1074/mcp.M110.000208. PubMed PMID: WOS:000279397200016; English.
- Nahlik K, Dumkow M, Bayram O, et al. The COP9 signalosome mediates transcriptional and metabolic response to hormones, oxidative stress protection and cell wall rearrangement during fungal development. Mol Microbiol. 2010 Nov;78(4):964–979. PubMed PMID: 21062371.
- Shain L. Dynamic-responses of differentiated sapwood to injury and infection. Phytopathology. 1979;69(10):1143–1147. PubMed PMID: WOS:A1979HU86600024; English.
- Shilatifard A. The COMPASS family of histone H3K4 methylases: mechanisms of regulation in development and disease pathogenesis. Annu Rev Biochem. 2012;81:65–95. PubMed PMID: WOS:000305765500005; English.
- Liu Y, N L, Yin YN, et al. Histone H3K4 methylation regulates hyphal growth, secondary metabolism and multiple stress responses in fusarium graminearum. Environ Microbiol. 2015 Nov;17(11):4615–4630. PubMed PMID: WOS:000366139500035; English.
- Pham KTM, Inoue Y, Vu BV, et al. MoSET1 (Histone H3K4 methyltransferase in magnaporthe oryzae) regulates global gene expression during infection-related morphogenesis. Plos Genet. 2015 Jul;11(7). ARTN e1005385. DOI:10.1371/journal.pgen.1005385. PubMed PMID: WOS:000360622200043; English.
- Raffaele S, Kamoun S. Genome evolution in filamentous plant pathogens: why bigger can be better. Nat Rev Microbiol. 2012 Jun;10(6):417–430. PubMed PMID: WOS:000304189900016; English.
- Veluchamy A, Lin X, Maumus F, et al. Insights into the role of DNA methylation in diatoms by genome-wide profiling in Phaeodactylum tricornutum. Nat Commun. 2013 Jul;4. ARTN 2091. DOI:10.1038/ncomms3091. PubMed PMID: WOS:000323714900001; English.
- Gao F, Liu XL, Wu XP, et al. Differential DNA methylation in discrete developmental stages of the parasitic nematode trichinella spiralis. Genome Biol. 2012;13(10):R100. ARTN R100. PubMed PMID: WOS:000313183900019; English.
- Seetharam A, Stuart GW. A study on the distribution of 37 well conserved families of C2H2 zinc finger genes in eukaryotes. Bmc Genomics. 2013 Jun 24;14. Artn 420. DOI:10.1186/1471-2164-14-420. PubMed PMID: WOS:000321390000001; English.
- Sarkar M, Ghosh MK. DEAD box RNA helicases: crucial regulators of gene expression and oncogenesis. Front Biosci-Landmrk. 2016 Jan 1;21:225–250. PubMed PMID: WOS:000369078400001; English.
- Xu C, Min JR. Structure and function of WD40 domain proteins. Protein Cell. 2011 Mar;2(3):202–214. PubMed PMID: WOS:000310519700005; English.
- Jonkers W, Rep M. Lessons from fungal F-box proteins. Eukaryot Cell. 2009 May;8(5):677–695. PubMed PMID: WOS:000265906000001; English.
- Voronin DA, Kiseleva EV. Functional role of proteins containing ankyrin repeats. Cell Tissue Biol. 2008;2(1):1–12.
- Zeng Z, Raffaello T, Liu MX, et al. Co-extraction of genomic DNA & total RNA from recalcitrant woody tissues for next-generation sequencing studies. Future Sci OA. 2018;FSO306.
- Langmead B, Salzberg SL. Fast gapped-read alignment with bowtie 2. Nat Methods. 2012 Mar 4;9(4):357–359. PubMed PMID: 22388286; PubMed Central PMCID: PMCPMC3322381.
- Krueger F, Andrews SR. Bismark: a flexible aligner and methylation caller for bisulfite-seq applications. Bioinformatics. 2011 Jun 1;27(11):1571–1572. . PubMed PMID: WOS:000291062400018; English.
- R-Core-Team. R: A language and environment for statistical computing. Vienna: R Foundation for Statistical Computing; 2013.
- Krzywinski M, Schein J, Birol I, et al. Circos: an information aesthetic for comparative genomics. Genome Res. 2009 Sep;19(9):1639–1645. PubMed PMID: WOS:000269482200015; English.
- Dolzhenko E, Smith AD. Using beta-binomial regression for high-precision differential methylation analysis in multifactor whole-genome bisulfite sequencing experiments. Bmc Bioinformatics. 2014 Jun 24;15:215. Artn 215. PubMed PMID: WOS:000339406300001; English.
- Dobin A, Davis CA, Schlesinger F, et al. STAR: ultrafast universal RNA-seq aligner. Bioinformatics. 2013 Jan;29(1):15–21. PubMed PMID: WOS:000312654600003; English.
- Anders S, Pyl PT, Huber W. HTSeq-a Python framework to work with high-throughput sequencing data. Bioinformatics. 2015 Jan 15;31(2):166–169. PubMed PMID: WOS:000347832300003; English.
- Robinson MD, McCarthy DJ, Smyth GK. edgeR: a bioconductor package for differential expression analysis of digital gene expression data. Bioinformatics. 2010 Jan 1;26(1):139–140. PubMed PMID: WOS:000273116100025; English.
- Anders S, McCarthy DJ, Chen YS, et al. Count-based differential expression analysis of RNA sequencing data using R and bioconductor. Nat Protoc. 2013 Sep;8(9):1765–1786. PubMed PMID: WOS:000323768600011; English.
- Conesa A, Gotz S, Garcia-Gomez JM, et al. Blast2GO: a universal tool for annotation, visualization and analysis in functional genomics research. Bioinformatics. 2005 Sep 15;21(18):3674–3676. PubMed PMID: WOS:000231694600016; English.
- Jones P, Binns D, Chang HY, et al. InterProScan 5: genome-scale protein function classification. Bioinformatics. 2014 May 1;30(9):1236–1240. PubMed PMID: WOS:000336095100007; English.
- Alexa A, R J. topGO: enrichment analysis for gene ontology. R Package Version. 2016;2:30.
- Xie C, Mao XZ, Huang JJ, et al. KOBAS 2.0: a web server for annotation and identification of enriched pathways and diseases. Nucleic Acids Res. 2011 Jul;39:W316–W322. PubMed PMID: WOS:000292325300051; English.
- Lerat E, Fablet M, Modolo L, et al. TEtools facilitates big data expression analysis of transposable elements and reveals an antagonism between their activity and that of piRNA genes. Nucleic Acids Res. 2017 Feb 28;45(4):e17. PubMed PMID: 28204592; PubMed Central PMCID: PMCPMC5389681.
- Consortium U. UniProt: the universal protein knowledgebase. Nucleic Acids Res. 2017 Jan 4;45(D1):D158–D169. PubMed PMID: WOS:000396575500025; English.
- Kumar S, Stecher G, Tamura K. MEGA7: molecular evolutionary genetics analysis version 7.0 for bigger datasets. Mol Biol Evol. 2016 Jul;33(7):1870–1874. PubMed PMID: WOS:000378767100018; English.
- Edgar RC. MUSCLE: multiple sequence alignment with high accuracy and high throughput. Nucleic Acids Res. 2004 Mar;32(5):1792–1797. PubMed PMID: WOS:000220487200025; English.