
ABSTRACT
Molecular characterizations, including microsatellite instability (MSI) and the CpG island methylator phenotype (CIMP) showed strong associations in colorectal carcinoma (CRC) and provided a deeper understanding of the etiology of disease. However, the global relationship between epigenetic alternations and changes in mRNA expression in CRC remains largely undefined, especially regarding the roles of DNA methyltransferases (DNMTs). Here, we conducted a systematic network comparison to explore the global conservation between co-expressed and co-methylated modules. We successfully identified immune-related modules that were regulated by DNMTs and had strong associations with immune-infiltrating neutrophils and dendritic cells in CRC. Moreover, we found that genes in those modules were prognostic for CRC, with 97.1% (168/173) being significantly influenced by DNMTs. Thus, this study resolved an interaction between DNA methylation and mRNA expression through DNMTs. Additionally, we provided evidence that DNMTs control the global hypomethylation of oncogenes, including ALOX5AP and CSF3R that otherwise have high methylation in normal colons. Such genes were also more sensitive to DNMT changes, such as in CRC. Collectively, our analyzes provided a systems biology approach to investigate the association among different molecular phenotypes in diseases.
Introduction
Colorectal carcinoma (CRC) is a considerable contributor to cancer mortality and morbidity. Extensive evidence suggests that the accumulation of multiple genetic and epigenetic alterations drive CRC initiation and progression. Common molecular alterations in CRC have been detected by sequential genome-wide studies, including recurrent somatic mutations in genes such as APC, TP53, BRAF and KRAS [Citation1–Citation5].
CRCs are classified into subtypes by the presence of consensus molecular features such as microsatellite instability (MSI), somatic mutation, mRNA expression, and promoter DNA methylation, among others. To gain a more comprehensive understanding of CRC, previous studies successfully linked some of such features to disease [Citation1,Citation6]. For example, CRC patients with MSI frequently exhibited hypermutation and a CpG island methylator phenotype (CIMP). Nevertheless, systematic analyzes revealing the relationships between altered genome-wide DNA methylation patterns and mRNA expression in CRC remain scarce.
DNMTs are a family of enzymes that include DNMT1, DNMT3A and DNMT3B in mammals and play key roles in the generation and maintenance of DNA methylation patterns. Somatic mutations and altered gene expressions of DNMTs have been identified in different types of cancers [Citation7–Citation9]; however, the effects of DNMTs on global DNA methylation and gene expression patterns remain to be explored.
We performed a direct global co-correlation network comparison of DNA methylation and mRNA expression in CRC. Those analyzes indicated that most co-methylated modules were largely different from co-expressed modules in CRC, and vice versa. However, we found modules with strong conservation that overlapped significantly between two networks associated with DNMTs, and were enriched in immune functions regulating infiltrating immune cells in CRC. Collectively, these findings revealed the effects of DNMTs on DNA methylation patterns and mRNA expression profiles of immune-related genes.
Results
Co-expression network in colorectal cancer
We conducted a weighted gene co-expression network analysis [Citation10] (WGCNA) for the expression dataset of colorectal cancer (CRC). The expressions of 7,716 genes among 214 samples were hierarchically clustered by their topological overlap. A total of 28 modules from 3,415 genes were identified in the co-expression network, while 4,301 genes (presented as grey color; ) were not assigned to any modules. All modules were then annotated with gene ontology (GO) terms in R using the clusterProfiler package [Citation11]. Thus, module function was represented by the most significantly enriched GO term. All GO terms corresponding to each module are presented in Supplementary Table 1.
Figure 1. WGCNA resolves co-expressed modules in CRC. (a) Cluster dendrogram of mRNA expression in 7,716 genes across 214 tumor samples established on topological overlap (TO) distance. The y-axis height corresponds to the distance (1-TO). The x-panel describes modules defined by dynamic tree cutting and the grey color represents genes not belonging to any modules. (b) Heatmap of modules correlated with molecular features of CRC. Modules are outlined based on their correlation with molecular traits (exp, expression; mut, mutation; cna, copy number alteration) when adjusted for a P-value < 0.05.
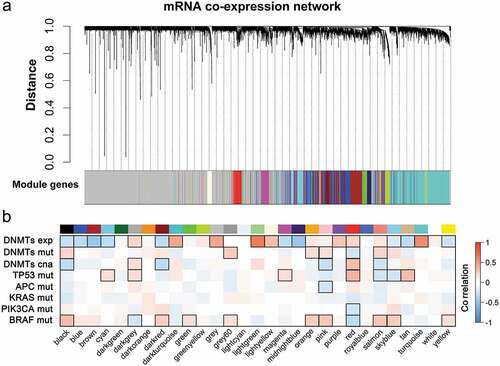
WGCNA is largely applied to investigating the relationship between co-expressed modules and phenotypic traits [Citation12,Citation13]. We collected the recurrent somatic mutation data of CRC, including TP53, APC, KRAS, PIK3CA and BRAF. Pearson’s correlation was calculated between the mutation trait and module eigengene, which represented the expression of all genes clustered into each module. As shown in , 39.3% (11/28) of modules were associated with BRAF mutations, whereas seven modules were significantly correlated to TP53 mutations. Notably, BRAF and TP53 shared four opposite correlated modules consisting of ncRNA processing (darkgrey), histone methyltransferase complex (red), leukocyte differentiation (salmon) and chromosome centromeric regions (skyblue). Those data suggested that the tumor suppressor gene, TP53, and the proto-oncogene, BRAF, regulated opposite pathways associated with CRC in a wide range of biological processes. Additionally, we observed one module, T cell activation (pink) and the histone methyltransferase complex (red) related to APC and PIK3CA mutation, respectively. Collectively, those data indicated that mutations in BRAF and TP53 played more diverse roles in mRNA expression in CRC, compared to other frequently-observed mutations, including APC, KRAS and PIK3CA.
To verify the influence of DNA methylation on mRNA expression in CRC, we extracted mRNA expression data, somatic mutation data and the copy-number data of DNMTs to correlate each datatype with each module in the co-expressed network. As shown in , we identified 60.7% (21/28) of modules associated with DNMT expression, supporting the idea that DNMTs have a broad impact on the expression pattern of tumors. Two modules, including the positive regulation of responses to external stimuli (black) and the histone methyltransferase complex (red), had expression data overlap with DNMT mutations and copy-number variations. The results for individual DNMTs are presented in Supplementary Table 2.
Co-methylation network in colorectal cancer
WGCNA is also suitable and useful for DNA methylation analyzes [Citation14], and the method is similar to co-expression network construction. We identified 17 modules from 2,748 genes with promoter methylation values, while 4,968 genes (shown as grey color; ) were not classified into any modules. We also used the most enriched GO term to emblematize each module into co-methylation networks. The list of completed GO terms are presented in Supplementary Table 1.
Figure 2. WGCNA reveals co-methylated modules in CRC. (a) WGCNA clustered 7,716 genes by promoter DNA methylation values across 214 tumor samples based on topological overlap (TO) distance. The y-axis height corresponds to the distance (1-TO). The x-panel describes modules defined by dynamic tree cutting and the grey color indicates genes not belonging to any co-methylated modules. (b) Heatmap of modules correlated with molecular features of CRC. Modules are outlined based on their correlation to molecular phenotypes (exp, expression; mut, mutation; cna, copy number alteration) when adjusted for a P-value < 0.05.
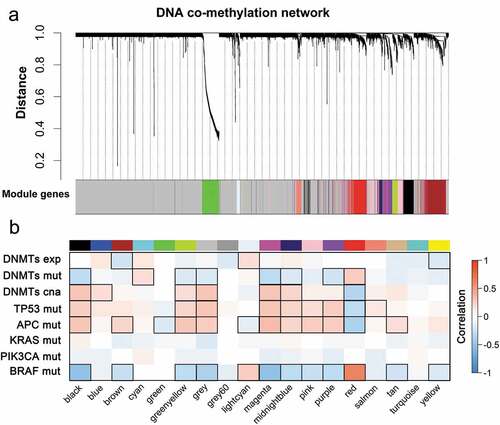
The result of the correlation between frequent mutation genes and co-methylation modules revealed that co-methylation networks of CRC were much different from the co-expressions (). Specifically, APC mutations showed strong associations with 64.7% (11/17) of modules, consistent with a previous report that APC regulates a global DNA methylation change in CRC through the DNA demethylase system [Citation15]. Moreover, TP53 and BRAF mutations affected modules in the co-methylation network, with 47.1% being anti-correlated (). We subsequently analyzed the modules associated with DNMTs’ traits. Only two modules were significantly correlated with DNMT expression levels, while 47.1% (8/17) of modules were significantly correlated with DNMT mutations and copy numbers, suggesting that DNMTs affected mRNA expression and promoter DNA methylation in a distinguishing way ( and Supplementary Table 2). Thus, based on the correlation results, the co-expression and co-methylation networks in CRC were dissimilar.
Modules comparison between expression and methylation networks
We hypothesized that most modules were not conserved between expression and methylation networks. Therefore, the degree of overlap was tested for each module between the two data sets. Consistent with the correlation results, the cross tabulation revealed that most expression modules did not have a consensus counterpart in the methylation network (Supplementary Figure 1). For example, nucleosome assembly (white) and translational elongation (midnight blue) modules did not significantly overlap with any methylation modules.
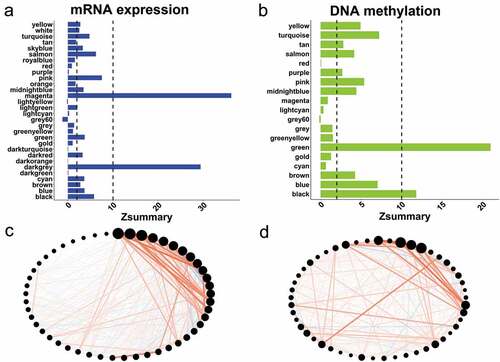
In addition to analyzing the standard cross tabulation data, we also examined the module preservation between two networks using Z-summary statistics [Citation16]. Consistent with the overlap analyzes, only two modules were strongly preserved (Z-summary>10) in the expression and methylation networks (). Those results showed the global differences between mRNA expression and DNA methylation data sets. To identify the expression and methylation modules that were mainly regulated by DNA methylation systems, we investigated the modules that were significantly correlated with DNMTs and preserved in the two data sets. We selected the leukocyte differentiation (black) co-methylation module, which was the only module to pass screening and its significantly-overlapping modules, including the positive regulation of responses to external stimuli (black), leukocyte differentiation (salmon), and T cell activation (pink) in expression networks. To further demonstrate their preservation, we compared the connectivity patterns of their overlapped genes. The global patterns of co-expression and methylation showed considerable similarity and connectivity to multiple genes (). Collectively, those data revealed that promoter DNA methylation controlled a small number of co-expressed modules mediated by DNMTs in CRC.
Figure 3. Module preservation in expression and methylation modules. (a) Bar graphs of the Z-summary statistic in co-expression networks using the methylation data set as the reference. The interpretation threshold for strong evidence (Z-summary > 10), moderate to weak evidence (2 < Z-summary < 10), and no evidence (Z-summary <2). (b) Bar graphs of the Z-summary statistic in co-methylation networks using the expression data set as the reference. The interpretation threshold for strong evidence (Z-summary > 10), moderate to weak evidence (2 < Z-summary < 10), and no evidence (Z-summary <2). (c) Co-expression patterns of genes overlapping in selected immune related modules. The red lines indicate the positive correlation between the genes (black dots), while line thickness indicates the strength of co-expression. The size of the dots represent the total connectivity of each gene. (d) Co-methylation patterns of genes overlapping in selected immune related modules.
DNMTs regulate the infiltrating immune cells in colorectal cancer
To gain a biological understanding of the overlapped modules regulated by DNMTs, we performed a functional comparison of two networks. As shown in , the enriched GO Term of four modules converged on immune functions related to different subtypes of immune cells, including T cells, neutrophils and dendritic cells, linking the interaction between DNA methylation and the immune system.
Figure 4. DNMTs influence intra-tumoral immune cells in colorectal cancer. (a) Dot plot of functional comparisons between conservative modules. The gene ratio represents the percentage of genes enriched in each significant GO-term. (b) Heatmap of each infiltrate correlated with immune-related molecular features of CRC. Modules are outlined based on their correlation with immune traits (exp, expression; mut, mutation; cna, copy number alteration) when adjusted for a P-value < 0.05. (c) Kaplan-Meier survival plot of two tumour groups classified by the abundance of infiltrating neutrophil. The P-value was calculated using the log-rank test. (d) Kaplan-Meier survival plot of two tumour groups categorized by the abundance of infiltrating dendritic cells. (e) Kaplan-Meier survival plot of two tumour classes grouped by the mRNA expression of DNMT1.
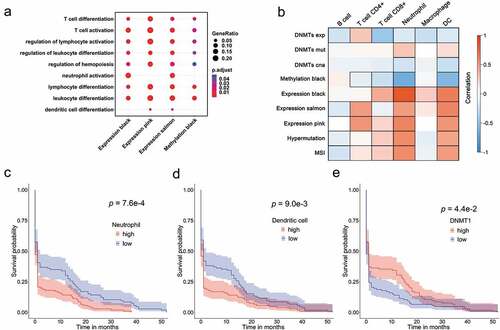
Since substantial evidence suggested that immune cells in tumor microenvironments play a critical role in the development and progression of CRC, TIMER [Citation17,Citation18] (Tumor IMmune Estimation Resource) was employed to estimate the abundances of six immune infiltrates (B cells, CD4 + T cells, CD8 + T cells, neutrophils, macrophages and dendritic cells) in CRC. To verify whether tumor-infiltrating immune cells were regulated by DNA methylation, the density of each infiltrating cell was then correlated with DNMT traits using Pearson’s correlation method ( and Supplementary Table 2). Notably, all six immune infiltrates were significantly associated with DNMT expression and infiltrating neutrophils and dendritic cells were significantly correlated to DNMT mutation and copy-number variations. Moreover, to test whether each infiltrating cell was represented by the overlapped modules that were enriched in immune functions, we conducted correlations between six cells and the above-mentioned four modules (). As expected, each cell was significantly correlated with at least one module, with infiltrating neutrophils and dendritic cells being significantly correlated to all four modules. Thus, we hereinafter refer to the four modules as the neutrophil and dendritic cell set. All infiltrates were also tested for their associations with hypermutations and MSI (microsatellite instability) in CRC (). The results revealed that the abundance of all infiltrating cells were strongly associated with tumor hypermutation or MSI status, with the exception of macrophages; thus, supporting that genetic instability and DNA damage were induced by infiltrated inflammatory cells in tumor stroma [Citation19–Citation21].
Immune infiltrates in the tumor tissues have been reported as good prognostic factors [Citation22–Citation24]. Thus, we next examined the prognostic power of immune infiltrates that were estimated using TIMER. Intriguingly, the Kaplan-Meier results indicated that elevated ratios of intra-tumoral neutrophil and dendritic cells significantly correlated with all traits and were associated with poorer overall patient survival (p = 7.6e-4 and p = 9.0e-3) (). Consistent with the correlation data, three co-expression modules in the neutrophil and dendritic cell set showed similar results to two infiltrates in the survival analysis (Supplementary Figure 2), further indicating that the abundances of infiltrating neutrophils and dendritic cells were mainly represented by the expression of the three modules. In contrast, we found that higher expression of DNMT1 was significantly correlated with the higher clinical survivals (p = 4.4e-2) (). Overall, the results demonstrated that infiltrating neutrophils and dendritic cells in CRC played adverse roles compared to DNMT1 expression in clinical outcome.
Survival associated genes in neutrophil and dendritic cell set show strong association with DNMTs
Having identified specific infiltrates with significant prognostic power, we further narrowed down the neutrophil and dendritic cell set to individual genes. We found that 56.5% (173/306) of genes were significantly associated with survival (). Given such results, we hypothesized that those genes were predominantly regulated by DNMTs. Thus, we conducted a comprehensive analysis of the relationship between survival associated genes and DNMTs. Importantly, 97.1% (168/173) of genes were significantly associated with either the expression, somatic mutation, and copy-number alteration of DNMTs at the level of expression or methylation. When considering individual sets of DNMTs, 89.6% (155/173) of genes were in the largest set, which was influenced by changes in DNMT copy numbers. An UpSet plot [Citation25] was also performed for six sets of DNMTs, which revealed that multiple genes were affected by more than three sets (). We identified that FCGR2A, a cell surface receptor found on neutrophils and OSM, a secreted cytokine that regulates the proliferation of tumors were significantly associated with five sets.
Figure 5. Comprehensive analysis of survival-associated genes in the neutrophil and dendritic cell sets. (a) Of the 306 genes in the expression modules of neutrophils and dendritic cell sets, 173 were significant in survival analyzes. (b) Upset plot of the interactions among six groups of the DNMT system (DNMTs cna mRNA, mRNA expression of genes significantly affected by the copy-number alterations of DNMTs; DNMTs cna methy, promoter DNA methylation of genes significantly affected by copy-number alterations of DNMTs; DNMTs exp mRNA, mRNA expression of genes significantly correlated to mRNA expression of DNMTs; DNMTs exp methy, promoter DNA methylation of genes significantly correlated to mRNA expression of DNMTs; DNMTs mut mRNA, mRNA expression of genes significantly affected by somatic mutations in DNMTs; DNMTs mut methy, promoter DNA methylation of genes significantly affected by somatic mutations in DNMTs). Boxplots of DNA methylation among significant, NS, and other module groups in normal adjacent tissue (c) and CRC (d). The star indicates statistical differences based on the Wilcoxon rank-sum test. (e). Boxplots of the mRNA expression comparison between significant and NS groups in lymph node and colon.
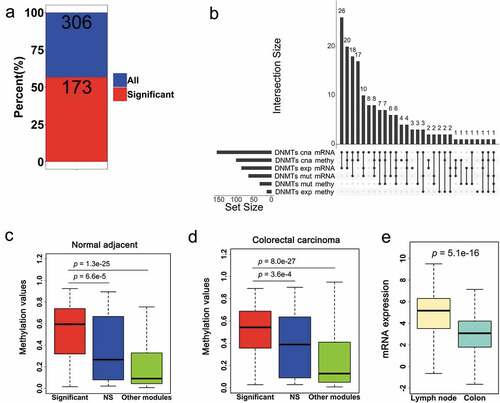
To address the question of why survival-associated genes were sensitive to changes in DNMTs, genes were categorized into three groups, including survival significant or insignificant genes in the neutrophil and dendritic cell set (significant and NS, respectively), and other modules in the data set (other modules). We compared the promoter methylation patterns for the three classes in CRC and normal adjacent cells. Notably, compared with the two other groups, survival-significant genes showed higher methylation patterns in cancer and normal tissues (). Moreover, we found that survival-associated genes were expressed lower in normal colon cells, compared to lymph nodes (). Those data supported that such genes controlled infiltrates in the tumor microenvironment.
Survival associated genes in the neutrophil and dendritic cell set tend to be a hub in the network
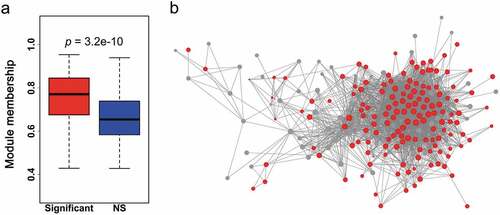
We next explored the network properties of genes in the neutrophil and dendritic cell set. Survival associated genes tended to have higher module membership in modules of the neutrophil and dendritic cell set, indicating that those genes play key roles in the progression of CRC (). The network properties of those were simultaneously visualized as a network. We filtered the 5% highest absolute gene-to-gene correlation from the whole network and it was observed that this sub-network contained far more survival significant genes than NSs. The significant genes also revealed greater connections ().
Figure 6. Network properties of survival-associated genes in neutrophil and dendritic cell sets. (a) Boxplots of module membership for comparison of survival-significant and NS genes in neutrophil and dendritic cell sets. The asterisks indicate the statistical difference based on the Wilcoxon rank-sum test. (b) Cytoscape network display for genes in the neutrophil and dendritic cell sets. The size of the nodes indicates the module membership of each node and the color corresponds to the gene group (red, significant and grey, NS).
DNMTs play a convergent role in tumorigenesis and prognosis of CRC
We next investigated genes with different mRNA expressions and promoter methylation patterns (DEGs and DMGs) between CRC and normal adjacent cells from the survival associated genes. A total of 46.2% (80/173) of DEGs and 49.1% (85/173) of DMGs were found in the CRC set with normal pairs (Supplementary Figure 3(a,b)). Notably, 44 overlapping genes existed between DEGs and DMGs (Supplementary Figure 3(c)). Moreover, we found that such overlaps comprised 26.2% (44/168) of the DNMT set (Supplementary Figure 3(d)). Overall, the data suggested that the survival-associated genes regulated by DNMTs also participated in the oncogenesis of CRC. To be more specific, we focused on the set of genes significantly associated with DNMT mutations, and identified that ALOX5AP and CSF3R overlapped with DEGs and DMGs in relation to CRC tumorigenesis.
ALOX5AP encodes for a protein necessary for the activation of 5-lipoxygenase and is required for leukotriene synthesis. Leukotrienes are lipid mediators that are implicated in multiple inflammatory responses. CSF3R is the receptor of colony stimulating factor 3, a cytokine that stimulates the survival, proliferation, differentiation and function of neutrophils. We found that the promoter methylation ALOX5AP (p < 0.01) and CSF3R (p < 0.01) were substantially decreased in CRC (). Conversely, CRC significantly elevated the mRNA expressions of ALOX5AP (p < 0.01) and CSF3R (p < 0.001) (). Similarly, patients with DNMT mutations showed lower methylation values of ALOX5AP (p < 0.05) and CSF3R (p < 0.05), whereas their expression values (p < 0.01 and p < 0.01) were increased in CRC ().
Figure 7. ALOX5AP and CSF3R were associated with oncogenesis and prognosis of CRC. (a) ALOX5AP had decreased promoter DNA methylation (N = 125 tumors and N = 29 normal tissues;unpaired t-test, P < 0.05, *; P < 0.01, **; P < 0.001, ***) and elevated expression (N = 26 tumors and N = 26 normal tissues;unpaired t-test) in CRC. When compared in DNMTs groups, ALOX5AP showed significantly downregulated methylation and upregulated expression in samples with DNMT mutation (N = 28 mutations and N = 186 non-mutations;unpaired t-test). (b) CSF3R showed decreased promoter DNA methylation and elevated expression in CRC. When compared in DNMTs groups, CSF3R had significantly downregulated methylation patterns and upregulated expressions in samples with DNMTs mutation. (c) Pearson correlations of ALOX5AP expression with the abundance of infiltrating neutrophils. (d) Pearson correlations of CSF3R expression with the abundance of infiltrating neutrophils. (e) Kaplan-Meier survival plot of two tumour groups classified by the mRNA expression of ALOX5AP. F. Kaplan-Meier survival plot of two tumour groups classified by the mRNA expression of CSF3R.
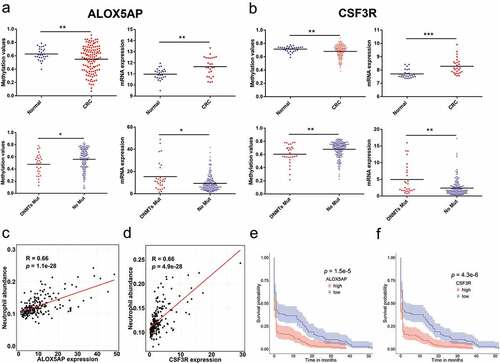
To test whether the genes could serve as key makers for infiltrating neutrophils and dendritic cells in CRC, we conducted Pearson’s correlation for their abundance of infiltrating neutrophils and dendritic cells. ALOX5AP and CSF3R were more strongly correlated with neutrophil infiltration (R = 0.66, p = 1.1e-28 and R = 0.66, p = 4.9e-28) (), compared to dendritic cells (R = 0.61, p = 5.6e-23 and R = 0.64, p = 4.9e-2) (Supplementary Figure 4). We also obtained consistent results from the COAD (colon adenocarcinoma) set in the TIMER web server. Moreover, ALOX5AP and CSF3R exhibited greater prognostic power than the overall estimated infiltrating level of neutrophils and dendritic cells. Those findings indicated that ALOX5AP and CSF3R linked DNMTs to tumorigenesis, infiltrating neutrophils and dendritic cells in the prognosis of CRC.
Discussion
A systems biology approach was employed to compare the module preservation between co-expression and co-methylation networks in CRC. This included most modules that correlated differently with recurrent mutations in CRC, including those in APC, TP53 and BRAF. Mutations in BRAF and KRAF have been reported to mediate a methylator phenotype in CRC [Citation26–Citation28]. We found co-expressed and co-methylated modules that were significantly affected by BRAF mutations, but not KRAS. Thus, the mechanism of BRAF regulating global DNA methylation and mRNA expression should be further explored.
Most DNA methylation abnormalities in cancers are mediated by DNMTs. Overexpression of DNMTs contributed to CIMP in CRC [Citation9]. Our correlation results indicated that the expression of DNMTs not only regulated DNA methylation levels, but also had a strong impact on the expression of genes.
DNMT3A has been reported to been frequently mutated in acute myeloid leukemia [Citation29]. Although DNMTs were not recurrently mutated genes in CRC, 13.1% (28/214) of patients had DNMT (DNMT1, DNMT3A or DNMT3B) mutations in this dataset, which significantly influenced the co-methylated modules that overlapped with BRAF mutations. Additionally, DNMTs and BRAF mutations were synchronous in the downloaded CRC set, suggesting their co-regulation in DNA methylation patterns related to CRC.
Traditional analyzes of expression and methylation focused on the overlapped genes between DEGs and DMGs or the correlation between them. This study was the first to use a comprehensive network-based method to explore the global relationship between expression and methylation. We profiled module-module conservation and correlation with external traits of CRC, particularly in DNMTs, which provided a number of advantages over traditional analyzes.
Inflammation has been considered as the seventh hallmark of cancer and inflammatory cells are a vital element of the tumor microenvironment [Citation30]. Intratumor infiltrates have been reported to affect tumor development and progression, and have strong associations with molecular phenotypes of cancer, including MSI and hypermutation. Elevated infiltrating T cells have been identified in CRC with high-levels of microsatellite instability (MSI-H) [Citation20]. Hypermutated and MSI-H tumors showed strong overlaps with infiltrating cells that were mostly associated with adaptive immunity [Citation31]. As an extension of those reports, our study used the TIMER web server to find that MSI and hypermutation had significant correlations in five infiltrating cells, including B cells, CD4 + T cells, CD8 + T cells, neutrophils and dendritic cells.
Immune infiltrates have shown strong prognostic impacts on diverse types of cancers, including CRC. Increased NLR (neutrophil-lymphocyte ratio) is a prognostic marker in CRC and has been associated with adverse survival outcomes in patients [Citation32,Citation33]. However, the occurrence and impact of neutrophil infiltration in CRC patients remain controversial [Citation34,Citation35]. The reason for conflicting reports is because no consensus markers are available to quantify neutrophil counts. Our study used TIMER based on the transcriptome profiles of tumors and purified immune cells to infer the abundance of immune infiltrates. Such an approach provided a comprehensive and systematic strategy to assess immune cell infiltration.
Unlike MSI and hypermutation, CIMP was not associated with infiltrating immune cells in CRC [Citation31]. Our network comparison identified conservative modules related to immune function between global expression and methylation sets. Those modules exhibited strong correlations with infiltrates, particularly in neutrophils and dendritic cells. Additionally, all molecular features used in our analyzes were significantly correlated to the abundance of the two cell types. Notably, the correlation and survival results suggested that DNMTs influenced the methylation of immune genes to change the infiltrating neutrophils and dendritic cells. For example, aberrant DNA methylation of FCGR2A and OSM have been found in cancers [Citation36,Citation37]. Our results further suggested that DNMTs regulated their expressions to affect the clinical outcome. Moreover, survival-associated genes showed vulnerability to DNMTs due to their higher levels of promoter methylation in CRC and normal adjacent cells. Overall, we identified the conserved modules connecting DNMTs and infiltrating cells in CRC. Our study also provided a systematic framework for cross-omic network comparisons, and the strategy can be widely applied to the integration of multi-omics data.
We highlighted ALOX5AP and CSF3R in CRC tumorigenesis and prognosis. ALOX5AP and CSF3R are regarded as oncogenes that are upregulated in many cancers [Citation38–Citation40]. We demonstrated that the methylation of ALOX5AP and CSF3R by DNMTs influenced CRC development and progression. Previous studies focused on CIMP, which contributed to the transcriptional silencing of tumor suppressor genes by focal hypermethylation in their promoters. Our study revealed that DNMTs regulated the global hypomethylation of oncogenes, including ALOX5AP and CSF3R in CRC, and hypermethylation in normal colons.
Collectively, our findings support the strong interaction between DNMTs and immune genes associated with infiltrating neutrophils and dendritic cells in CRC. Those findings suggest that the CRC microenvironment was largely influenced by the methylation of related genes. Our result also suggested that DNMTs have opposite roles in the methylation phenotype of oncogenes and tumor suppressors, and that drugs targeting DNMTs should overcome the contrasting properties.
Materials and methods
Data acquisition and preprocessing
The colorectal cancer data set was downloaded from the cBioPortal [Citation5,Citation8], and included somatic mutations, copy-number variations, mRNA expression, DNA methylation and clinical data. The 214 samples used in RNA-seq and DNA methylation bead arrays were selected for further analysis. The RSEM and beta-values were employed in RNA-seq and DNA methylation data analyzes, respectively. We used quantile normalizations to remove batch effects and filtered genes with a Pearson correlation of <0 between mRNA expression and DNA methylation. We had a total of 214 samples and 7,716 genes for further co-correlation network analysis and comparison.
Expression and methylation beadchip data with adjacent non-tumor colorectal tissues were obtained from GSE25070 and GSE25062, respectively. We then aggregated the probes to the gene level using the median value. RNA-seq data for lymph nodes and colons were downloaded from [Citation41].
Weighted gene co-expression network construction
The WGCNA package (version 1.63) was performed in R (version 3.5.1) for mRNA expression and DNA methylation network constructions. Briefly, we built the unsigned networks using the absolute value of the Pearson’s correlation. Next, the co-expression similarity was transformed into the weighed adjacency matrix through the soft threshold, which was chosen based on the scale-free topology criterion. We selected a soft threshold power of β = 9 in both mRNA expression and DNA methylation datasets to produce networks with a scale-free topology model fit that were greater than 0.8. The topological overlap (TOM) was then calculated from the adjacency matrix, which organized hierarchical clustered genes into modules by average linkage. Finally, we merged the similar modules with module eigengene distances less than 0.1.
Module analyzes and comparisons between two datasets
Eigengene, the first principal component of the module, was employed to correlate sample traits, including mutation and copy number alterations using Pearson’s method. The P-value was calculated by the T-statistic and adjusted using the Benjamini–Hochberg procedure. Each co-correlation module for the two datasets was annotated with enriched GO-terms and KEGG pathways using the clusterProfiler and an adjusted P-value < 0.05. Module preservation was determined using Z-summary statistics, and quantified by the modulePreservation function with 200 random permutations. We set the expression data as the reference and methylation data as the test to calculate the Z-summary of modules in the expression network (and vice versa). The Fisher’s exact test was applied to determine the significance of pairwise overlaps between the two datasets.
Analysis of immune infiltrates in CRC
We used TIMER (Tumor IMmune Estimation Resource) to estimate the immune infiltrates of B cells, CD4 + T cells, CD8 + T cells, neutrophils, macrophages and dendritic cells in CRC. RNA-seq data used in co-expression analyzes were uploaded to the TIMER website (https://cistrome.shinyapps.io/timer/). We chose the colon adenocarcinoma as the cancer type parameter for estimation and downloaded the result. The correlations between the abundance of six immune infiltrates and DNA methylation-related events, including DNMT mutation were determined by the Pearson’s correlation method.
Survival analysis
We used the survival package (version 3.5.1) in R for univariate survival analysis. Kaplan-Meier plots were generated using the survminer package (version 0.4.2). We divided samples into two groups based on the median value for all sets of genes and immune infiltrates. All survival differences were calculated using the logrank test.
UpSet plot of survival associated genes
We used the Student’s t-test and/or Pearson correlation method to determine the genes that were significantly related to DNMT expression, somatic mutations, and copy-number variations. UpSet plots were generated using the UpSetR package (version 1.3.3) in R to visualize the intersection between different DNMT sets.
Network analysis of survival significant genes
Gene module membership was based on the Pearson correlation between eigengenes and their expression. The Wilcoxon rank-sum test was employed to compare the module membership between survival-significant and non-significant genes in the conserved modules. We used Cytoscape 3.6.1 to visualize the network properties using the prefuse force directed layout.
Authors’ contributions
SZ, JL (Jie Lin) and QLS proposed and designed the project. QLS, LBS and JG performed data collection and analyzes. QLS, LRH, JL (Jing Lin) and SYG wrote the manuscript. SZ, JL (Jie Lin), QLS and ZX revised the manuscript. All authors read and approved the final manuscript.
Supplemental Material
Download Zip (314.9 KB)Disclosure statement
No potential conflict of interest was reported by the authors.
Supplementary material
Supplemental data for this article can be accessed here.
Additional information
Funding
Related Research Data
References
- Cancer Genome Atlas Network. Comprehensive molecular characterization of human colon and rectal cancer. Nature. 2012;487:330–337.
- Schell MJ, Yang M, Teer JK, et al. A multigene mutation classification of 468 colorectal cancers reveals a prognostic role for APC. Nat Commun. 2016;7:11743.
- Yaeger R, Chatila WK, Lipsyc MD, et al. Clinical sequencing defines the genomic landscape of metastatic colorectal cancer. Cancer Cell. 2018;33:125–136 e123.
- Seshagiri S, Stawiski EW, Durinck S, et al. Recurrent R-spondin fusions in colon cancer. Nature. 2012;488:660–664.
- Giannakis M, Mu XJ, Shukla SA, et al. Genomic correlates of immune-cell infiltrates in colorectal carcinoma. Cell Rep. 2016;15:857–865.
- Toyota M, Ahuja N, Ohe-Toyota M, et al. CpG island methylator phenotype in colorectal cancer. Proc Natl Acad Sci U S A. 1999;96:8681–8686.
- Roy DM, Walsh LA, Chan TA. Driver mutations of cancer epigenomes. Protein Cell. 2014;5:265–296.
- Nosho K, Shima K, Irahara N, et al. DNMT3B expression might contribute to CpG island methylator phenotype in colorectal cancer. Clin Cancer Res. 2009;15:3663–3671.
- Ibrahim AE, Arends MJ, Silva AL, et al. Sequential DNA methylation changes are associated with DNMT3B overexpression in colorectal neoplastic progression. Gut. 2011;60:499–508.
- Langfelder P, Horvath S. WGCNA: an R package for weighted correlation network analysis. BMC Bioinformatics. 2008;9:559.
- Yu G, Wang LG, Han Y, et al. clusterProfiler: an R package for comparing biological themes among gene clusters. OMICS. 2012;16:284–287.
- Saris CG, Horvath S, van Vught PW, et al. Weighted gene co-expression network analysis of the peripheral blood from amyotrophic lateral sclerosis patients. BMC Genomics. 2009;10:405.
- Yang Y, Han L, Yuan Y, et al. Gene co-expression network analysis reveals common system-level properties of prognostic genes across cancer types. Nat Commun. 2014;5:3231.
- Chuang YH, Paul KC, Bronstein JM, et al. Parkinson’s disease is associated with DNA methylation levels in human blood and saliva. Genome Med. 2017;9:76.
- Andersen A, Jones DA. APC and DNA demethylation in cell fate specification and intestinal cancer. Adv Exp Med Biol. 2013;754:167–177.
- Langfelder P, Luo R, Oldham MC, et al. Is my network module preserved and reproducible? PLoS Comput Biol. 2011;7:e1001057.
- Li B, Severson E, Pignon JC, et al. Comprehensive analyses of tumor immunity: implications for cancer immunotherapy. Genome Biol. 2016;17:174.
- Li T, Fan J, Wang B, et al. TIMER: a web server for comprehensive analysis of tumor-infiltrating immune cells. Cancer Res. 2017;77:e108–e110.
- Roncucci L, Mora E, Mariani F, et al. Myeloperoxidase-positive cell infiltration in colorectal carcinogenesis as indicator of colorectal cancer risk. Cancer Epidemiol Biomarkers Prev. 2008;17:2291–2297.
- Michel S, Benner A, Tariverdian M, et al. High density of FOXP3-positive T cells infiltrating colorectal cancers with microsatellite instability. Br J Cancer. 2008;99:1867–1873.
- Le Gouvello S, Bastuji-Garin S, Aloulou N, et al. High prevalence of Foxp3 and IL17 in MMR-proficient colorectal carcinomas. Gut. 2008;57:772–779.
- Pages F, Galon J, Dieu-Nosjean MC, et al. Immune infiltration in human tumors: a prognostic factor that should not be ignored. Oncogene. 2010;29:1093–1102.
- Vayrynen JP, Kantola T, Vayrynen SA, et al. The relationships between serum cytokine levels and tumor infiltrating immune cells and their clinical significance in colorectal cancer. Int J Cancer. 2016;139:112–121.
- Amicarella F, Muraro MG, Hirt C, et al. Dual role of tumour-infiltrating T helper 17 cells in human colorectal cancer. Gut. 2017;66:692–704.
- Lex A, Gehlenborg N, Strobelt H, et al. UpSet: visualization of intersecting sets. IEEE Trans Vis Comput Graph. 2014;20:1983–1992.
- Nagasaka T, Koi M, Kloor M, et al. Mutations in both KRAS and BRAF may contribute to the methylator phenotype in colon cancer. Gastroenterology. 2008;134:1950–1960, 1960 e1951.
- Fang M, Ou J, Hutchinson L, et al. The BRAF oncoprotein functions through the transcriptional repressor MAFG to mediate the CpG island methylator phenotype. Mol Cell. 2014;55:904–915.
- Serra RW, Fang M, Park SM, et al. A KRAS-directed transcriptional silencing pathway that mediates the CpG island methylator phenotype. Elife. 2014;3:e02313.
- Yamashita Y, Yuan J, Suetake I, et al. Array-based genomic resequencing of human leukemia. Oncogene. 2010;29:3723–3731.
- Mantovani A. Cancer: inflaming metastasis. Nature. 2009;457:36–37.
- Angelova M, Charoentong P, Hackl H, et al. Characterization of the immunophenotypes and antigenomes of colorectal cancers reveals distinct tumor escape mechanisms and novel targets for immunotherapy. Genome Biol. 2015;16:64.
- Ishizuka M, Nagata H, Takagi K, et al. Combination of platelet count and neutrophil to lymphocyte ratio is a useful predictor of postoperative survival in patients with colorectal cancer. Br J Cancer. 2013;109:401–407.
- Song Y, Yang Y, Gao P, et al. The preoperative neutrophil to lymphocyte ratio is a superior indicator of prognosis compared with other inflammatory biomarkers in resectable colorectal cancer. BMC Cancer. 2017;17:744.
- Rao HL, Chen JW, Li M, et al. Increased intratumoral neutrophil in colorectal carcinomas correlates closely with malignant phenotype and predicts patients’ adverse prognosis. PLoS One. 2012;7:e30806.
- Galdiero MR, Bianchi P, Grizzi F, et al. Occurrence and significance of tumor-associated neutrophils in patients with colorectal cancer. Int J Cancer. 2016;139:446–456.
- Song MA, Tiirikainen M, Kwee S, et al. Elucidating the landscape of aberrant DNA methylation in hepatocellular carcinoma. PLoS One. 2013;8:e55761.
- Cho YG, Chang X, Park IS, et al. Promoter methylation of leukemia inhibitory factor receptor gene in colorectal carcinoma. Int J Oncol. 2011;39:337–344.
- Jiang WG, Douglas-Jones AG, Mansel RE. Aberrant expression of 5-lipoxygenase-activating protein (5-LOXAP) has prognostic and survival significance in patients with breast cancer. Prostaglandins Leukot Essent Fatty Acids. 2006;74:125–134.
- Kleinstein SE, Heath L, Makar KW, et al. Genetic variation in the lipoxygenase pathway and risk of colorectal neoplasia. Genes Chromosomes Cancer. 2013;52:437–449.
- Dwivedi P, Greis KD. Granulocyte colony-stimulating factor receptor signaling in severe congenital neutropenia, chronic neutrophilic leukemia, and related malignancies. Exp Hematol. 2017;46:9–20.
- Fagerberg L, Hallstrom BM, Oksvold P, et al. Analysis of the human tissue-specific expression by genome-wide integration of transcriptomics and antibody-based proteomics. Mol Cell Proteomics. 2014;13:397–406.