
ABSTRACT
In the United States almost 33% of adults are considered obese (BMI > 30 kg/m2). Both animal models and to a lesser extent human studies, have associated BMI, a measure of obesity, with alterations in sperm DNA methylation and RNAs. Sperm RNAs from the Assessment of Multiple Gestations from Ovarian Stimulation trial, were isolated and sequenced. A Generalized Linear Model identified 487 BMI associated human sperm RNA elements (short exon-sized sequences). They partitioned into four patterns; a continual increase with BMI, increase once obese (BMI>30 kg/m2); a steady decrease with BMI; and decrease once overweight (BMI 25 - 30 kg/m2). Gene Ontology revealed a unique relationship between BMI and transcripts associated with chromosome organization, adipogenesis, cellular stress and obesity-related inflammation. Coregulatory networks linked by Chromatin remodeler cofactors, RNA interactors, Erasers and Writers (CREWs) were uncovered to reveal a hierarchical epigenetic response pathway.
Introduction
Obesity, commonly measured as Body Mass Index (BMI), is associated with the pathogenesis of a variety of diseases including diabetes and cardiovascular disease [Citation1–Citation3]. More recently, obesity and male infertility have been associated [Citation1,Citation4,Citation5]. Established hallmarks and associations of obesity including hormonal changes, metabolic and cellular stress, and inflammation have been suggested as endpoints [Citation4]. Epididymal fat pads are a type of white adipose tissue (eWAT) surrounding the epididymis and testis [Citation6]. As with other WAT depots, eWAT responds to changes in nutrition and is highly regulated [Citation6,Citation7]. Uniquely, eWAT, is important for spermatogenesis [Citation8] and may serve as a source of obesity-related sperm signaling.
Infertility impacts approximately 15% of couples worldwide [Citation5,Citation9] with approximately one third of all cases attributed solely to the male partner [Citation1]. Current sperm diagnostic tests rely on the assessment of standard semen parameters (such as sperm concentration and motility) and in some instances, DNA analysis (such as DNA fragmentation index and high DNA stainability) [Citation10,Citation11]. Associations between BMI and both sperm DNA fragmentation and common semen parameters, including semen volume, sperm concentration and total sperm count, have also been suggested [Citation4,Citation5,Citation12–Citation15]. Highlighting the importance of the paternal contribution to a child’s health, these have been extended to include paternal obesity associations with birth success, birth weight and a child’s phenotypic traits such as metabolic health and over-all longevity [Citation14,Citation16–Citation21]. Animal models have identified alterations in sperm DNA methylation and RNAs in response to high fat and protein diets [Citation21–Citation24], some of which are inherited by the next generation resulting in metabolic disorders [Citation23,Citation25–Citation27]. Studies by Ortega et al. [Citation28] identified a number of circulating miRNAs altered in response to obesity, while Donkin et al. [Citation29] identified altered DNA methylation and small RNAs in sperm when lean and obese men were compared.
We have previously identified sperm RNAs required for live birth [Citation30]. Gene ontology along with developmental and disease associations of sperm RNAs and DNA methylation analyses suggest a potential impact on child health and development [Citation29,Citation31,Citation32]. We sought to define the relationship between obesity as measured by BMI and human sperm RNAs to expand our understanding garnered from animal models of obesity [Citation33,Citation34] and other human studies [Citation4,Citation29,Citation35]. Here we present sperm RNAs responding to BMI as 8 co-regulatory networks, each representative of obesity-related adipogenesis, cellular stress, and inflammatory pathways. Chromatin remodelers, RNA interactors, Erasers and Writers (CREWs) are likely regulators driving the network.
Results
Subset demographics
Paternal obesity is associated with live birth, birth weight, a child’s metabolic health, and other phenotypic traits [Citation16,Citation18–Citation20] playing a significant role in a child’s life course. Mouse models [Citation23,Citation24,Citation26,Citation34], and to a lesser extent human studies [Citation28,Citation29], have suggested a correlation between obesity and DNA methylation and some small sperm RNAs. Longer RNAs, i.e., those above 100 nucleotides including mRNAs have remained an enigma. To clearly define the relationship of RNAs and obesity, the composition of idiopathic infertile male sperm RNAs from the Reproductive Medicine Network (RMN) Assessment of Multiple Gestations from Ovarian Stimulation (AMIGOS) trial [Citation36] was examined as a function of BMI. A representative subset of 32 semen samples from subjects with an average BMI of 28.55 kg/m2 (range 19.25–40.68 kg/m2) was selected (, Table S1). This approximated the AMIGOS study average BMI of 28.94 kg/m2 (range 15.79–63.70 kg/m2). This group was segregated into three BMI categories: healthy (BMI < 25 kg/m2, 8 samples), overweight (BMI 25–30 kg/m2, 11 samples) and obese (BMI > 30 kg/m2, 13 samples).
Table 1. Demographic characteristics of AMIGOS males. All values are reported as the mean (range) for A) the 32-sample subset and full AMIGOS study and B) the three BMI category groups; healthy (BMI < 25 kg/m2), overweight (BMI 25–30 kg/m2) and obese (BMI > 30 kg/m2).
SREs associated with BMI
Sperm RNA was isolated and sequenced as described [Citation30]. Each sequence was then directly mapped to the human genome and a series of exon sized RNA elements (REs) were defined using the RNA Element Discovery algorithm, REDa [Citation37]. REDa identifies novel transcribed orphan elements, elements within 10 kB of an exon, intronic elements as well as annotated exons. It does not solely rely on the prior knowledge of transcripts or splicing structure. This strategy simultaneously affords both hypothesis testing while providing an unbiased measure to evaluate the impact of BMI on the distribution of sperm REs. Using a Generalized Linear Model (GLM) [Citation38], SRE abundance was assessed in response to increasing BMI. This resolved a set of 487 BMI associated SREs (BH adjusted p-value < 0.05), comprised of 12 novel orphan SREs, 20 SREs within 10 kB of an exon, 43 intronic SREs and 412 exonic SREs, which in total correspond to 421 genes. As a function of increasing BMI, 333 SREs (283 genes) were upregulated and 155 SREs (155 genes) were down regulated (Table S2). They encoded 184 proteins from the human sperm proteome [Citation39], of which 132 were associated with upregulated transcripts and 57 with down regulated transcripts (Table S2). Genomatix Pathway Systems (GePS) Gene Ontology (GO) of the 421 SRE-associated gene name set highlighted cilium organization (GePS adjusted p-value < 0.001), cilium assembly (GePS adjusted p-value < 0.001), ciliopathies (GePS adjusted p-value < 0.001) and enrichment in chromosome organization (GePS adjusted p-value < 0.001). Signaling pathways related to the cellular response to stress (GePS adjusted p-value = 1.60e-2) were also identified.
To define the molecular pathways, the set of 421 BMI associated genes were evaluated across the Molecular Signature Database (MSigDB) that contains well-defined functional gene sets. This revealed a series of downstream adipogenesis responsive genes following transcription factor (TF) peroxisome proliferator activated receptor gamma (PPARG) and retinoid X receptor alpha (RXRA) activation [Citation40] (MSigDB p-value = 1.93e-11, Table S3). Significant enrichment was also observed with respect to inflammatory processes within the MSigDB immunological gene sets. These included those genes downstream from the activation of effector CD4+ Th1 cells [GSE32901, Citation41] (MSigDB p-value = 2.52e-9, Table S3), toll-like receptor-2 (TLR2) mediated signaling [GSE25146, Citation42] (MSigDB p-value = 3.27e-9, Table S3) and interferon-alpha (IFN-α) compared to interferon-gamma (IFN-γ) signaling [GSE3920, Citation43] (MSigDB p-value = 2.12e-8, Table S3). Together, the above was indicative of a complex epididymal fat pad (eWAT) modifier regulatory network.
To identify membership within the co-regulated networks, complexity was reduced and modeled using the Mfuzz algorithm. RNA levels were considered as a function of BMI partitioned into three categories, healthy, overweight and obese respectively [Citation2,Citation5,Citation29]. As shown in and summarized in Table S2, this resolved 8 unique expression patterns from 235 SREs, segregating into 4 general patterns. Three resolved as patterns derived from 88 SREs – 86 genes – 41 sperm proteome proteins that continually increased with increasing BMI ()); 2 patterns derived from 69 SREs – 68 genes – 32 sperm proteome proteins that increased once obese ) and patterns derived from 54 SREs – 51 genes – 20 sperm proteome proteins that steadily decreased with increasing BMI ()). Pattern 1D, was characterized by 24 SREs from 26 genes for which 6 sperm proteome proteins were identified. This was the only group of SREs that decreased once overweight. However, insufficient membership precluded meaningful ontological analysis.
Figure 1. BMI responsive sperm RNA element (SRE) clusters. Response clusters identified in Mfuzz include 235 SREs that follow 8 unique cluster patterns. General responses are comprised of (a) 3 cluster patterns that respond with a general steady increase with body mass index (BMI) indicated by the red section of the pie chart in the upper left-hand corner. (b) Two cluster patterns that follow a general BMI response of increasing once obese. These clusters are indicated by the orange pie chart section in the upper left-hand corner. (c) Two clusters indicated by the blue pie chart section in the lower left-hand corner comprise a general steady decrease as BMI increases. (d) One cluster indicated with the green slice of the pie chart in the lower left-hand corner responded to BMI with a decrease once overweight. Clusters were determined from the significant 487 SREs identified by the generalized linear model (GLM). BMI category; healthy (< 25 kg/m2), overweight (25–30 kg/m2) and obese (30+ kg/m2), group means were assigned. The Mfuzz algorithm was set to cluster only those SREs with mean reads per kilobase per million (RPKM) > 10 in at least one BMI group and follow the cluster pattern with a membership of 0.4. Graphs are visualized across BMI groups based on expression fold-change of the cluster pattern.
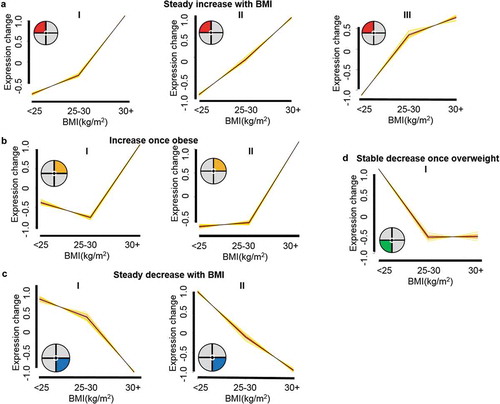
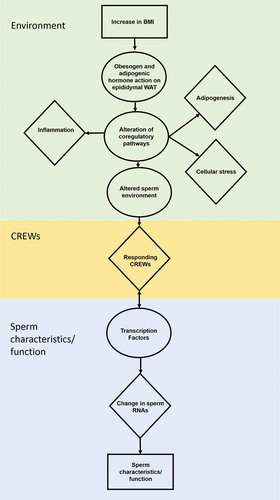
Figure 2. Obesity related impact on sperm. Increased BMI induces the obesity-related hallmarks adipogenesis, stress and low-grade systemic inflammation within the epididymal white adipose tissue (eWAT) to alter the sperm environment. The altered sperm environment changes sperm RNAs regulated by Chromatin remodeler cofactors, RNA interactors, Erasers and Writers (CREWs) of methylation, acetylation and ubiquination to impact sperm characteristics and function.
SREs that steadily increased with BMI shown in , cluster A_II (37 SREs/34 genes/18 sperm proteome) were attributed to ciliary processes related to cilium assembly (GePS adjusted p-value < 0.001) and cilium organization (GePS adjusted p-value < 0.001). The remaining A clusters were associated with a cellular response to stress (GePS adjusted p-value = 2.00e-3) and all A clusters associated with genes downstream of transforming growth factor – beta 1 (TGF-β1) as well as interleukin-6 (IL-6) (MSigDB p-value = 4.74e-6, Table S3) [GSE39820, Citation44]. Reiterating the enrichment in chromosome organization found within the 421 BMI associated genes, cluster B genes were enriched in the regulation of histone H3-K9 acetylation (GePS adjusted p-value < 0.001), chromosome organization (GePS adjusted p-value < 0.001) and regulation of chromosome organization (GePS adjusted p-value = 2.00e-3). Adipogenesis related gene set enrichment was evident in both B clusters that showed increased expression once obese in response to adipogenic hormones (MSigDB p-value = 2.04e-5, Table S3) [Citation45] and C clusters that steadily decreased as BMI increased bound by the TFs PPARG and RXRA [Citation40] (MSigDB p-value = 8.44e-6, Table S3), suggesting a possible TF coregulatory network.
The MSigDB TF binding motif gene set module was then used to identify enriched TF binding motifs in the promoter region of the 421 BMI associated genes and the 224 Mfuzz BMI responsive cluster genes (Table S2). In total, 70 TF binding motif associated gene sets were identified as enriched in both the 421 correlated and 224 responsive gene sets, with 55 assigned to a known TF [Citation46,Citation47]. Of the 55 binding motifs, only 8 with evidence of TF transcript presence were considered further (Table S4). These 8 TFs were evident in the sequencing data outside of the 421 BMI correlated genes; specificity protein 1 (SP1), lymphoid enhancer binding factor 1 (LEF1), GA binding protein (GABP, subunits alpha (GABPA), beta 1 (GABPB1) and beta 2 (GABPB2)), MYC associated zinc finger protein (MAZ), paired box 4 (PAX4), nuclear factor of activated T cells (NFAT, family members NFATC1, NFATC2, NFAT3, NFAT4, NFAT5 and NFAT2 interacting protein (NFATC2IP)), E2F transcription factor 1 (E2F1) and meis homeobox 1 (MEIS1), with MAZ also present within the sperm proteome. Of these lymphoid enhancer binding factor 1 antisense RNA 1 (LEF1-AS1), GABPB2, MAZ (short isoform only), NFAT3 and NFAT4 were full length (Table S5). Interestingly, LEF1-AS1, a non-coding RNA that acts to attenuate LEF1 expression [Citation48], is an important mediator of Wnt signaling involved in early development [Citation49]. Only the TFs MAZ, NFAT3 and NFAT4 retain functional capacity following fertilization as GABP is an obligate heterotetramer of the GABPA subunit and one GABPB, GABPB1 or GABPB2 subunit [Citation50]. BMI response of the genes within these 8 TF:gene associated pairs was assessed. GABP is associated with 7 TF A cluster associated genes, MAZ with 11 and PAX4 with 8, that predominantly respond with a steady increase with BMI (). Similarly, of those pairs primarily responding with an increase once obese (), SP1 is associated with 15, LEF1 with 9, and MEIS1 with 5 B cluster responsive genes. In comparison, of the TF:gene associated pairs that steadily decreased as BMI increased (), E2F1 is associated with 5 and NFAT with 8 C cluster responsive genes.
While the corresponding TF encoding SREs were present within the total sperm SRE profile (343,102 SREs), they were not within the 487 BMI associated SREs suggesting that, while necessary, they are likely not a master regulator of the BMI response. CRREWs (Chromatin remodeler cofactors, RNA interactors, Readers, Erasers and Writers) were then considered since they act prior to TFs, together regulating chromatin state as necessary for expression [Citation51–Citation54]. To determine whether CRREWs might function in the regulation of these pathways, the 421 BMI associated, and 224 BMI responsive genes were tested for the presence of CRREW function (). A list of 650 potential CRREWs [Citation39,Citation52,Citation53,Citation55–Citation62] that are also reported in the human sperm proteome [Citation39] were compiled. Of the 421 genes that associate with BMI, 24 are CREWs, Chromatin remodeler cofactors, RNA interactors, Erasers and Writers (p = 0.001, ) as no Readers were identified, with 12 responding to the BMI responsive patterns (p = 0.0231, , ). Further, 21 of the 24 CREWs are reported within the sperm proteome with 9 exhibiting a unique BMI response (, ). Transcript integrity was evaluated () and 16 of the 24 CREWs were full length, with 6 directly observed within the BMI responsive clusters as necessary for translation.
Table 2. Transcript integrity for Chromatin remodeler cofactors, RNA interactors, Erasers and Writers (CREWs) also found in the sperm proteome that are associated with BMI. MAZ and NFAT are indicated with an * as the NFAT members NFAT3 and NFAT4, along with MAZ are present as a full-length transcript. Slope refers to the change in SRE abundance (RPKM) as BMI is increased by a single integer while BMI Response informs whether the SRE is present within one of the four over-all responses; steady increase with BMI, increase once obese, steady decrease with BMI and stable decrease once overweight, or is only associated (positive, negative) with BMI from the generalized linear model.
As summarized in , of the 11 Chromatin remodeler cofactors, 9 were full-length transcripts and all 11 were within the human sperm proteome. Of these Chromatin remodeler cofactors, 7 were positively correlated with BMI and 4 were negatively correlated with BMI. Cluster membership of the Chromatin remodeler cofactors segregated within the B clusters (DEAD (Asp-Glu-Ala-Asp)-box helicase 5 (DDX5) SRE within cluster B_II, structural maintenance of chromosome flexible hinge domain containing 1 (SMCHD1) SRE within cluster B_I, and zinc finger protein 451 (ZNF451) SREs within cluster B_I and cluster B_II) and cohesion loading factor (NIPBL) SRE was within the A_II clusters (, Table S2).
RNA interactors constituted of the smallest group containing the full-length negative elongation factor complex member E (NELFE) transcript and heterogeneous nuclear ribonucleoprotein C (C1/C2) (HNRNPC) (), which are within the sperm proteome. Both RNA interactors were positively correlated with BMI, and part of the ) clusters (NELFE SRE within cluster B_II and HNRNPC SRE within cluster B_I, Table S2). Seven methylation, acetylation or ubiquitin Erasers were identified, of which 5 were full-length and 5 were identified within the sperm proteome (). Based on cluster membership () histone deacetylase 5 (HDAC5) increased once obese ( cluster B_II, Table S2) whereas lysine demethylase 5A (KDM5A) and PHD finger protein 12 (PHF12) increased steadily as obesity increased ( cluster A_II, Table S2). The remaining positively correlated Erasers, lysine demethylase 2B (KDM2B) and ubiquitin specific peptidase 15 (USP15) (full-length transcripts) and the negatively correlated Erasers, lysine demethylase 4B (KDM4B) and ubiquitin specific peptidase 7 (USP7), did not show a cluster specific response to BMI but are within the sperm proteome (). This suggests that while these four Erasers are correlated with BMI, they are independent of the co-regulated clusters. The six methylation, acetylation or ubiquitin Writers included 3 full-length transcripts and 5 as present within the sperm proteome (). When considered as a function of cluster membership, cullin 4B (CUL4B, cluster B_II, Table S2) increased once obese (, ) while HECT, UBA and WWE domain containing 1, E3 ubiquitin protein ligase (HUWE1, cluster A_II, Table S2) and fibrillarin (FBL, cluster A_III, Table S2) steadily increased with BMI (, ). The remaining correlated Writers, DNA methyltransferase 1 (DNMT1), histone methyltransferase complex regulatory subunit (DPY30) and USP7 were not identified within any co-regulatory BMI responsive clusters (). Interestingly, USP7 is reported to function as a Writer of methylation [Citation39,Citation53], an Eraser of histone modifications [Citation53] and a chromatin remodeler cofactor [Citation39].
Of the 24 CREWs, 13 had binding sites for the TFs identified in this study (), with the majority sharing a MAZ, NFAT3 or NFAT4 site. TF binding to the CREW was confirmed using the Encyclopedia of DNA Elements (ENCODE) Transcription Factor Target gene set [Citation63]. MAZ has been shown to bind, DDX5, DNMT1, NIPBL, PHF12 and SWI/SNF related, matrix associated, actin dependent regulator of chromatin subfamily C member 1 (SMARCC1) (). The Chromatin remodeler cofactors CHD2, DDX5 and SMARCC1 are full-length transcripts and within the sperm proteome. NFAT3 and NFAT4 (Table S5) are the only members of the NFAT family that are full-length transcripts. This TF family was enriched in two separate gene sets (TGGAAA_NFAT_Q4_01 and NFAT_Q4_01, Table S4), both using the same binding motif. CDH2, myosin 1C (MYO1C), HNRNPC and FBL have the potential to be bound by the NFATs (), whereas CHD2, HNRNPC and FBL have been shown to be bound by the NFAT family member NFATC1, which shares a conserved DNA-binding domain [Citation64]. All members of the NFAT family share this DNA-binding domain, suggesting that the remaining NFAT members, including NFAT3 and NFAT4, should also bind to CHD2, HNRNPC and FBL by NFATC1. Of these 3 binding pairs with NFATC1, the Chromatin remodeler cofactor CHD2 is the only full-length transcript () and is also a known to be bound by MAZ. Together this shows the interplay of the CREWs with TFs orchestrating the BMI response.
Discussion
Our overweight population is a growing concern with ~33% of adults in the United States classified as obese [Citation2]. BMI is commonly used as a measure of obesity which in mice, is associated with altered small noncoding sperm RNA, DNA methylation and DNA fragmentation. Such effects may be epigenetically heritable [Citation14,Citation21,Citation23,Citation25–Citation27,Citation33]. Human studies have identified a series of associations of paternal BMI to birth outcome and offspring phenotype [Citation18–Citation20]. Similarly, common semen parameters have correlated with increasing BMI [Citation4,Citation5,Citation12,Citation13] and appear independent of total testosterone with the possible exception of Kruger’s strict morphology [Citation65]. Few human obesity studies have assessed epigenetic alterations. Of these studies, only circulating miRNAs or sperm DNA methylation and small non-coding RNAs have been evaluated [Citation28,Citation29]. Here, we identified 487 SREs responsive to BMI from our long RNA libraries.
RNAs associated with some of the key hallmarks of obesity (including adipogenesis, stress and low-grade systemic inflammation) were enriched within the 487 sperm-BMI associated SREs (i.e., 421 genes) identified. Their relationships are summarized in . Briefly, as BMI increases, adipogenic hormones such as insulin act directly in high lipid content tissues like abdominal and epidydimal adipose [Citation66]. eWAT, similar to abdominal WAT (aWAT), responds to insulin [Citation6] as part of a key metabolic regulatory pathway necessary for spermatogenesis [Citation45,Citation66]. As illustrated in , . Insulin like growth factor 1 receptor (IGF1R), a key receptor involved in insulin signaling within eWAT, is present at the core of the response. It is a member of ciliary associated cluster A_II (, Table S2). For example, IGF1R signaling is dependent on a functional cilium [Citation67,Citation68] and acts to regulate adipocyte differentiation [Citation69]. This directly affects pathways related to adipogenesis, cellular stress and inflammation.
Figure 3. Network of the 24 CREWs correlated with BMI. Chromatin remodeler cofactors, RNA interactors, Erasers and Writers (CREWs) involved in chromatin organization within the 487 SREs associated with BMI acting as key regulators of the obesity related pathways. Yellow boxes highlight the location of IGF1R (center) and the Chromatin remodeler cofactor DDX5 (center) which act as a feedback loop continuing the progression of obesity altered insulin signaling. Line color indicates whether the reported interaction is validated (solid brown) or predicted (dashed light grey).
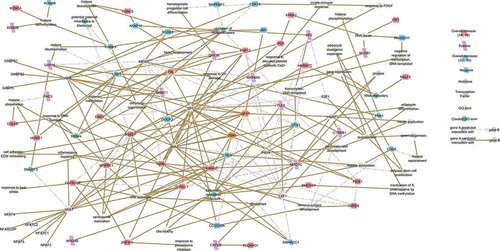
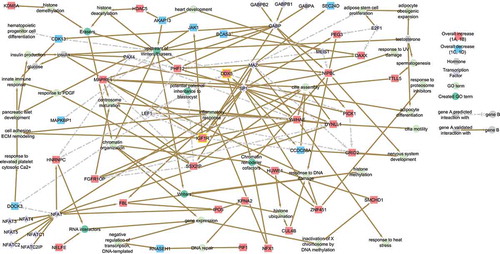
Figure 4. Network of the 12 CREWs responsive to BMI. Chromatin remodeler cofactors, RNA interactors, Erasers and Writers (CREWs) involved in chromatin organization within the 235 MFuzz BMI responsive SREs acting as key regulators of the obesity-related pathways. Yellow boxes highlight the location of IGF1R (center) and the Chromatin remodeler cofactor DDX5 (center) which act as a feedback loop continuing the progression of obesity-altered insulin signaling. Line color indicates whether the reported interaction is validated (solid brown) or predicted (dashed light grey).
The effects of obesogens and adipogenic hormones are often mediated through TFs, e.g., PPAR and RXR family members [Citation66]. Within the 421 BMI associated genes, downstream genes responding to PPARG and RXRA [Citation40] steadily declined with increasing BMI ()). In comparison, the SREs that increased once obese are downstream from insulin signaling [Citation45] ()). As expected, cellular stress RNAs, respond to insulin and other adipogenic hormones [Citation3,Citation4], was identified with increasing BMI ( clusters A_I and A_II).
As adipogenesis progresses, cell free DNA can be released which, if left unchecked, facilitates chronic low-grade systemic inflammation [Citation2,Citation70] mediated through the action of TLRs [Citation71]. Interestingly, the 421 BMI associated SREs associated with the downstream response follow activation of TLR2 [GSE25146, 42], a regulator of glucose and insulin [Citation72]. Similarly, these SREs were enriched in genes responding to the pro-inflammatory cytokine IFN-α [GSE3920, 43], are within the A cluster genes () that steadily increase with BMI, TGF-β1 and IL-6 [GSE39820, 44]. DDX5, a Chromatin remodeler cofactor [Citation73–Citation75] (, center) belonging to cluster B_II (), is an enriched downstream target of both IFN-α and active CD4+ Th1 cells . It increases in response to cyclooxygenase 2 (COX2) [Citation76] and is also associated with pro-inflammatory response [Citation77]. This is in accord with a TLR cell-free DNA inflammatory response through IFN-α, TGF-β1, IL-6 and COX2 cytokine signaling impacting sperm RNA.
The sperm’s, environment also changes utilizing CRREWs as epigenetic regulators of gene expression through chromatin accessibility. For example, the increase in the Chromatin remodeler cofactor DDX5 in response to obesity-mediated inflammation will act in a feedback loop to increase insulin signaling (, center) thus continuing the cycle. Specifically, insulin signaling through IGF1R (cluster A_II-member ) altered during obesity promotes an increase in pro-inflammatory cytokines, including COX2. DDX5, as part of the B clusters (), is then stimulated by COX2 to increase DDX5 production as BMI increases (, ). Through the depression of miR-183, DDX5 action will lead to an increased expression of insulin receptor substrate 1 (IRS1), a ligand of IGF1R [Citation76].
The interaction of CREWs and TFs in response to the effects of adipogenesis, stress and inflammation is summarized in (). A total of 24 CREWs were contained within the 421 BMI correlated SRE associated gene names, of which 16 are full length transcripts and 21 have been reported in the human sperm proteome (Table 3, ). Chromatin remodeler cofactors were the most prevalent, followed by Writers, Erasers and finally RNA interactors. Interestingly, Readers [Citation54] appear to be absent, within the silenced sperm genome. Twelve of these CREWs retained membership within 1 of the 8, clusters, primarily cluster B that directly increased when obese, in which 6 are full length transcripts and 9 CREWs are members of the sperm proteome (, ).
Using the mechanisms of obesity-induced inflammation (similar to those described in abdominal adipose tissue), this data supports the view that obesity related changes impacting eWAT will negatively affect sperm. As shown above these obesity-induced alterations connecting adipogenesis, stress and inflammatory pathways yields a BMI responsive alteration of chromatin modifiers, within the network of CREWs () that negatively affect the male gamete and potentially extend beyond as carried by human sperm.
Methods and materials
AMIGOS study and subset demographics
The Assessment of Multiple Gestations from Ovarian Stimulation (AMIGOS) trial [Citation36] was designed to address use of letrozole compared to clomiphene citrate or gonadotropins on multiple gestation rate during intrauterine insemination in idiopathic infertile couples. It included a total of 900 couples from which male characteristics including BMI, age, serum hormone levels and semen parameters were obtained. A subset of 32 available semen samples with an average BMI of 28.55 kg/m2 (range 19.25–40.68 kg/m2) representative of the entire AMIGOS study (average BMI 28.94 kg/m2, range 15.79–63.70 kg/m2) was obtained from the Reproductive Medicine Network (RMN) biorepository (, Table S1). BMI was used as a measure of obesity in this subset of 32 samples. This included eight samples within the healthy BMI range (< 25 kg/m2), 11 within the overweight BMI range (25–30 kg/m2) and 13 within the obese I (30–34.9 kg/m2) and II (> 35 kg/m2) BMI ranges. The deidentified frozen samples were processed and analyzed in accordance with HIC protocol 095701MP2E(5R).
Sequencing and SRE discovery
Sample preparation and RNA-seq library construction was accomplished as previously described [Citation30,Citation78,Citation79] followed by sequencing using the Illumina Hi-Seq 2500 platform. Sequence alignment to the human genome (hg38) and sperm RNA element (SRE) discovery was accomplished using an in-house pipeline and REDa, RNA Element Discovery algorithm [Citation37]. An average of 97.7% of sequences passed quality control with an average of 16.5% of sequences marked as unmapped. SRE expression was calculated using Reads per Kilobase Million (RPKM). Transcript integrity was evaluated on the University of California Santa Cruz (UCSC) Genome Browser (http://genome.ucsc.edu/) [Citation80] and SREs aligned to genomic regions (exonic, within 10kB of an exon and intronic), associated with a gene name were assigned the appropriate Ensembl ID. Genomic regions with no assigned gene were considered novel-orphan regions.
Statistical modeling
Principal component analysis prcomp() function in R [Citation38] was used to assess semen parameters, age, BMI, hormone levels, birth outcome, smoking/alcohol use and technical sequencing statistics such as percent genomic duplicated reads and percent unmapped reads, that may impact SRE variability. A Pearson correlation coefficient > |0.45| and p-value < 0.05 was considered as a significant impact. PC1 (principal component 1) contributed approximately 98% of SRE variability but did not meet this criterion and was excluded from the final model. Three parameters, percent mitochondria, percent sperm motility and percent genomic duplicated, had a p-value < 0.05 but a Pearson correlation coefficient < |0.45|.
The generalized linear model (GLM) in the R stats package [Citation38] was used to analyze the impact of BMI on SRE abundance using BMI as a continuous variable (Supplementary Methods). Obesity is associated with comorbidities such as diabetes and semen parameters. Additionally, within the full AMIGOS study, low total testosterone was correlated with BMI [Citation65]. To determine if BMI was associated with any of the measured parameters in this subset, Pearson correlations were evaluated between BMI with age, hormone levels, semen parameters, birth outcome, smoking/alcohol use and technical sequencing statistics. BMI was not significantly associated (p-value < 0.05, Pearson correlation coefficient > |0.45|) with any parameter indicating no interactions between BMI and the other parameters could be tested in this subset. A total of three GLMs were used to determine the influence of BMI on SRE abundance. As no significant Pearson correlations between BMI or for PC1 were identified, the first model did not regress out any parameters. No SREs were identified as associated with BMI from this model which we hypothesized was due to a large degree of background variance resulting from a large number of lowly contributing parameters. For the second model the effects of paternal age and hormone levels (total testosterone, insulin, glucose, SHBG, FSH, LH, TSH, INHB) were removed by regression. An initial threshold of SREs > 0 RPKM in 1/3 or more samples was applied prior to modeling to remove all lowly expressed SREs. As PC1 was not regressed out of the model, SRE variance was considered by requiring a mean and median RPKM to be within 20%. This was set as the mean/median RPKM difference being between 0.8 and 1.2. Significance was met if the mean > 10 RPKM and Benjamini-Hochberg (BH) [Citation81] adjusted p-value < 0.05. A total of 487 SREs were identified for further analysis. The third model regressed out age, hormones and the weakly correlated contributors to PC1 (percent mitochondria, percent sperm motility and percent genomic duplicated) in which the same 487 SREs were identified as associated with BMI.
Co-regulatory networks were identified with the Mfuzz algorithm [Citation82]. Briefly, mean RPKM was calculated for each of the BMI categories; healthy (8 samples, BMI < 25 kg/m2), overweight (11 samples, BMI 25–30 kg/m2) and obese (13 samples, BMI > 30 kg/m2). Fold changes between the BMI category mean were determined and like patterns (membership score > 0.4) were assessed. Initially, a default of 10 clusters was created within the Mfuzz program. Cluster number was systematically decreased until each cluster exhibited one specific pattern. Eight clusters were used for further analysis retaining all 4 major BMI response patterns.
An inclusive list of CRREWs (Chromatin remodeler cofactors, RNA interactors, Readers, Erasers and Writers) was compiled using the WERAM 1.0 database [Citation56], EpiFactors Database [Citation53], GeneCards [Citation62], SnapShot Archive: CellPress [Citation57–Citation61] and other literature sources [Citation39,Citation52,Citation55]. This list was further filtered to include only those found within the human sperm proteome [Citation39]. CRREW probability was determined using phyper() function [Citation38]. Briefly, this was calculated as the probability of identifying 24 CREWs (Chromatin remodeler cofactors, RNA interactors, Erasers and Writers) within the 421 BMI associated genes or the 12 CREWs from the 224 BMI responsive genes and their occurrence within the sperm proteome.
Gene ontology (functional) analysis
Gene set enrichment analysis was performed on the 487 BMI associated SREs, 235 BMI responsive SREs and BMI responsive patterns (Table S2). Enriched GO terms relating to Biological Processes and MeSH (Medical Subject Headings) terms were analyzed using Genomatix Pathway Systems [GePS, Citation83]. Enriched signaling pathways identified in GePS were supplemented with the Molecular Signature Database [MSigDB, Citation47, Citation84]. Enrichment was evaluated using the MSigDB curated datasets compiled from online publication pathway databases, publications in PubMed and from knowledge domain experts; immunological signature gene sets and TF binding motif gene sets. Gene sets that corresponded to the enriched signaling pathways identified in GePS were examined further. Harmonizome, the ENCODE Transcription Factor Target gene set [Citation63] was used to identify those TF: gene binding motifs that have been validated.
Gene network visualization of enriched Biological Processes and pathways was accomplished using Cytoscape [Citation85]. The BiNGO module in Cytoscape [Citation85,Citation86] was used for identification of the broad GO annotation terms that encompass the specific enriched pathways. CREWs and upstream interactors were defined first by 1) the specific type of function performed (e.g. histone methylation) and 2) the created term Chromatin remodeler cofactor, RNA interactors, Writer, Eraser and upstream interactor of Writers/Erasers.
Data availability
The data discussed in this publication have been deposited in NCBI's Gene Expression Omnibus (Edgar et al., 2002) and are accessible through GEO Series accession number GSE134580 (https://www.ncbi.nlm.nih.gov/geo/query/acc.cgi?acc=GSE134580).
Author contribution
SAK and GS designed the research; GS, RG processed sperm RNA samples; GS and ME performed and analyzed the data; GS and SAK wrote the manuscript. All authors contributed to the editing and review of the manuscript.
Supplemental Material
Download Zip (132.5 KB)Acknowledgments
The work was supported in part by National Institutes of Health (NIH)/Eunice Kennedy Shriver National Institute of Child Health and Human Development (NICHD) Grants U10 HD039005. Support from the Charlotte B. Failing Professorship and Wayne State University Grants Boost award 19-0381 to SAK is gratefully acknowledged. The content is solely the responsibility of the authors and does not necessarily represent the official views of the NICHD or NIH.
Disclosure statement
No potential conflict of interest was reported by the authors.
Supplementary material
Supplemental data for this article can be accessed here.
Additional information
Funding
References
- Katib A. Mechanisms linking obesity to male infertility. Cent European J Urol. 2015;68(1):79–85. PubMed PMID: 25914843; PubMed Central PMCID: PMCPMC4408383
- Nguyen DM, El-Serag HB. The epidemiology of obesity. Gastroenterol Clin North Am. 2010 Mar;39(1):1–7. PubMed PMID: 20202574; PubMed Central PMCID: PMCPMC2833287
- Liu Y, Ding Z. Obesity, a serious etiologic factor for male subfertility in modern society. Reproduction. 2017;154(4):R123. English
- Craig JR, Jenkins TG, Carrell DT, et al. Obesity, male infertility, and the sperm epigenome. Fertil Steril. 2017 Apr 01;107(4):848–859. .
- Eisenberg ML, Kim S, Chen Z, et al. The relationship between male BMI and waist circumference on semen quality: data from the LIFE study. Hum Reprod. 2014 Feb;29(2):193–200. PubMed PMID: 24306102; PubMed Central PMCID: PMCPMC3896223.
- Bjorndal B, Burri L, Staalesen V, et al. Different adipose depots: their role in the development of metabolic syndrome and mitochondrial response to hypolipidemic agents. J Obes. 2011;2011:490650. . PubMed PMID: 21403826; PubMed Central PMCID: PMCPMC3042633
- Sethi JK, Vidal-Puig AJ. Thematic review series: adipocyte biology. Adipose tissue function and plasticity orchestrate nutritional adaptation. J Lipid Res. 2007;48(6):1253–1262. PubMed PMID: 17374880
- Chu Y, Huddleston GG, Clancy AN, et al. Epididymal fat is necessary for spermatogenesis, but not testosterone production or copulatory behavior. Endocrinology. 2010;151(12):5669–5679. . PubMed PMID: 20881242
- Boivin J, Bunting L, Collins JA, et al. International estimates of infertility prevalence and treatment-seeking: potential need and demand for infertility medical care. Hum Reprod. 2007 Jun;22(6):1506–1512. PubMed PMID: 17376819.
- Cooper TG, Noonan E, von Eckardstein S, et al. World Health Organization reference values for human semen characteristics. Hum Reprod Update. 2010 May-Jun;16(3):231–245. PubMed PMID: 19934213.
- Buck Louis GM, Sundaram R, Schisterman EF, et al. Semen quality and time to pregnancy: the longitudinal investigation of fertility and the environment study. Fertil Steril. 2014 Feb;101(2):453–462. PubMed PMID: 24239161; PubMed Central PMCID: PMCPMC3946620.
- Ramaraju GA, Teppala S, Prathigudupu K, et al. Association between obesity and sperm quality. Andrologia. 2018 Apr;50(3):e12888. PubMed PMID: 28929508.
- Ma J, Zhou Y, Wu L, et al. Association between BMI and semen quality: an observational study of 3966 sperm donors. Hum Reprod. 2018;34(1):155–162.
- Terashima M, Barbour S, Ren J, et al. Effect of high fat diet on paternal sperm histone distribution and male offspring liver gene expression. Epigenetics. 2015;10(9):861–871. . PubMed PMID: 26252449; eng
- Duale N, Steffensen I-L, Andersen J, et al. Impaired sperm chromatin integrity in obese mice. Andrology. 2014;2(2):234–243.
- Kaati G, Bygren LO, Edvinsson S. Cardiovascular and diabetes mortality determined by nutrition during parents’ and grandparents’ slow growth period. Eur J Hum Genet. 2002 Nov;10(11):682–688. PubMed PMID: 12404098
- Pembrey ME, Bygren LO, Kaati G, et al. Sex-specific, male-line transgenerational responses in humans. Eur J Hum Genet. 2006 Feb;14(2):159–166. PubMed PMID: 16391557.
- Chen Y-P, Xiao X-M, Li J, et al. Paternal body mass index (BMI) is associated with offspring intrauterine growth in a gender dependent manner. PLoS One. 2012;7(5):e36329.
- Bakos HW, Henshaw RC, Mitchell M, et al. Paternal body mass index is associated with decreased blastocyst development and reduced live birth rates following assisted reproductive technology. Fertil Steril. 2011;95(5):1700–1704.
- Ornellas F, Carapeto PV, Mandarim-de-Lacerda CA, et al. Obese fathers lead to an altered metabolism and obesity in their children in adulthood: review of experimental and human studies. J Pediatr (Rio J). 2017 Nov 01;93(6):551–559. .
- Zhang Y, Zhang X, Shi J, et al. Dnmt2 mediates intergenerational transmission of paternally acquired metabolic disorders through sperm small non-coding RNAs. Nat Cell Biol. 2018;20(5):535–540. . PubMed PMID: 29695786; eng
- Radford EJ, Ito M, Shi H, et al. In utero effects. In utero undernourishment perturbs the adult sperm methylome and intergenerational metabolism. Science. 2014 Aug 15;345(6198):1255903. PubMed PMID: 25011554; PubMed Central PMCID: PMCPMC4404520.
- Rando OJ. Intergenerational Transfer of Epigenetic Information in Sperm. Cold Spring Harb Perspect Med. 2016 May 02;6(5):a022988. PubMed PMID: 26801897.
- Sharma U, Rando OJ. Metabolic Inputs into the Epigenome. Cell Metab. 2017 Mar;25(3):544–558. PubMed PMID: 28273477; eng
- Carone BR, Fauquier L, Habib N, et al. Paternally induced transgenerational environmental reprogramming of metabolic gene expression in mammals. Cell. 2010 Dec 23;143(7):1084–1096. PubMed PMID: 21183072; PubMed Central PMCID: PMCPMC3039484.
- Ng SF, Lin RCY, Laybutt DR, et al. Chronic high-fat diet in fathers programs beta-cell dysfunction in female rat offspring. Nature. 2010 Oct 21;467(7318):963–U103. PubMed PMID: WOS:000283254700038; English.
- Zhang Y, Shi J, Rassoulzadegan M, et al. Sperm RNA code programmes the metabolic health of offspring. Nat Rev Endocrinol. 2019;15:489–498. .
- Ortega FJ, Mercader JM, Catalán V, et al. Targeting the Circulating MicroRNA Signature of Obesity. Clin Chem. 2013;59(5):781–792.
- Donkin I, Versteyhe S, Ingerslev LR, et al. Obesity and bariatric surgery drive epigenetic variation of spermatozoa in humans. Cell Metab. 2016 Feb;23(2):369–378. PubMed PMID: 26669700; eng.
- Jodar M, Sendler E, Moskovtsev SI, et al. Absence of sperm RNA elements correlates with idiopathic male infertility. Sci Transl Med. 2015 Jul 08;7(295):295re6. PubMed PMID: 26157032; PubMed Central PMCID: PMCPMC4721635.
- Burl RB, Clough S, Sendler E, et al. Sperm RNA elements as markers of health. Syst Biol Reprod Med. 2018 Feb;64(1):25–38. PubMed PMID: 29199464.
- Godia M, Swanson G, Krawetz SA. A history of why fathers’ RNA matters. Biol Reprod. 2018 Jul 1;99(1):147–159. PubMed PMID: 29514212.
- de Castro Barbosa T, Ingerslev LR, Alm PS, et al. High-fat diet reprograms the epigenome of rat spermatozoa and transgenerationally affects metabolism of the offspring. Mol Metab. 2016 Mar;5(3):184–197. PubMed PMID: 26977389; PubMed Central PMCID: PMCPMC4770269.
- Chen Q, Yan M, Cao Z, et al. Sperm tsRNAs contribute to intergenerational inheritance of an acquired metabolic disorder. Science. 2016 Jan 22;351(6271):397–400. PubMed PMID: 26721680.
- Jenkins TG, Aston KI, Meyer TD, et al. Decreased fecundity and sperm DNA methylation patterns. Fertil Steril. 2016;105(1):51–7.e73. . PubMed PMID: 26453269; eng
- Diamond MP, Legro RS, Coutifaris C, et al. Assessment of multiple intrauterine gestations from ovarian stimulation (AMIGOS) trial: baseline characteristics. Fertil Steril. 2015 Apr;103(4):962–973.e4. PubMed PMID: 25707331; PubMed Central PMCID: PMCPMC4529113. eng.
- Estill MS, Hauser R, Krawetz SA. RNA element discovery from germ cell to blastocyst. Nucleic Acids Res. 2018. DOI:10.1093/nar/gky1223
- Team RC. R: A language and environment for statistical computing. 2013.
- Castillo J, Jodar M, Oliva R. The contribution of human sperm proteins to the development and epigenome of the preimplantation embryo. Hum Reprod Update. 2018 Sep 1;24(5):535–555. PubMed PMID: 29800303.
- Wakabayashi K-I, Okamura M, Tsutsumi S, et al. The peroxisome proliferator-activated receptor gamma/retinoid X receptor alpha heterodimer targets the histone modification enzyme PR-Set7/Setd8 gene and regulates adipogenesis through a positive feedback loop. Mol Cell Biol. 2009;29(13):3544–3555. . PubMed PMID: 19414603
- Zhang W, Ferguson J, Ng SM, et al. Effector CD4+ T cell expression signatures and immune-mediated disease associated genes. PLoS One. 2012;7(6):e38510–e38510. . PubMed PMID: 22715389
- Smith SM, Moran AP, Duggan SP, et al. Tribbles 3: A novel regulator of TLR2-mediated signaling in response to helicobacter pylori lipopolysaccharide. J Immunol. 2011;186(4):2462–2471.
- Indraccolo S, Pfeffer U, Minuzzo S, et al. Identification of genes selectively regulated by IFNs in endothelial cells. J Immunol. 2007;178(2):1122–1135.
- Lee Y, Awasthi A, Yosef N, et al. Induction and molecular signature of pathogenic TH17 cells. Nat Immunol. 2012;13(10):991–999. . PubMed PMID: 22961052
- Burton GR, Guan Y, Nagarajan R, et al. Microarray analysis of gene expression during early adipocyte differentiation. Gene. 2002 Jun 26;293(1):21–31. .
- Xie X, Lu J, Kulbokas EJ, et al. Systematic discovery of regulatory motifs in human promoters and 3′ UTRs by comparison of several mammals [Article]. Nature. 2005 Feb 27;434:338. https://www.nature.com/articles/nature03441#supplementary-information
- Subramanian A, Tamayo P, Mootha VK, et al. Gene set enrichment analysis: a knowledge-based approach for interpreting genome-wide expression profiles. Proc Natl Acad Sci U S A. 2005 Oct 25;102(43):15545–15550. PubMed PMID: 16199517; PubMed Central PMCID: PMCPMC1239896.
- Beltran M, Aparicio-Prat E, Mazzolini R, et al. Splicing of a non-coding antisense transcript controls LEF1 gene expression. Nucleic Acids Res. 2015;43(12):5785–5797. . PubMed PMID: 25990740
- De Jaime-Soguero A, Abreu de Oliveira WA, Lluis F. The pleiotropic effects of the canonical wnt pathway in early development and pluripotency. Genes (Basel). 2018;9(2):93.
- Rosmarin AG, Resendes KK, Yang Z, et al. GA-binding protein transcription factor: a review of GABP as an integrator of intracellular signaling and protein–protein interactions. Blood Cells Mol Dis. 2004 Jan 01;32(1):143–154. .
- Falkenberg KJ, Johnstone RW. Histone deacetylases and their inhibitors in cancer, neurological diseases and immune disorders [Review Article]. Nat Rev Drug Discov. 2014 Aug 18;13:673. https://www.nature.com/articles/nrd4360#supplementary-information
- Gillette TG, Hill JA. Readers, writers, and erasers: chromatin as the whiteboard of heart disease. Circ Res. 2015;116(7):1245–1253. PubMed PMID: 25814685
- Medvedeva YA, Lennartsson A, Ehsani R, et al. EpiFactors: a comprehensive database of human epigenetic factors and complexes. Database (Oxford). 2015;2015:bav067. PubMed PMID: 26153137; PubMed Central PMCID: PMCPMC4494013
- Biswas S, Rao CM. Epigenetic tools (The writers, the readers and the erasers) and their implications in cancer therapy. Eur J Pharmacol. 2018 Oct 15;837: 8–24. .
- Schapira M. Structural chemistry of human RNA methyltransferases. ACS Chem Biol. 2016 Mar 18;11(3):575–582. .
- Xu Y, Zhang S, Lin S, et al. WERAM: a database of writers, erasers and readers of histone acetylation and methylation in eukaryotes. Nucleic Acids Res. 2017;45(D1):D264–D270. . PubMed PMID: 27789692
- Bao Y, Shen X. SnapShot: chromatin remodeling complexes. Cell. 2007 May 4;129(3):632. PubMed PMID: 17482554.
- Sims JK, Wade PA. SnapShot: chromatin remodeling: CHD. Cell. 2011 Feb 18;144(4):626–626 e1. PubMed PMID: 21335242.
- Kutateladze TG. SnapShot: histone readers. Cell. 2011 Sep 2;146(5):842–842 e1. PubMed PMID: 21884941; PubMed Central PMCID: PMCPMC3645985.
- Kouzarides T. SnapShot: histone-modifying enzymes. Cell. 2007 Nov 16;131(4):822. PubMed PMID: 18022374.
- Biggar KK, Wang Z, Li SS. SnapShot: lysine methylation beyond histones. Mol Cell. 2017 Dec 7;68(5):1016–1016 e1. PubMed PMID: 29220647.
- Stelzer G, Rosen N, Plaschkes I, et al. The genecards suite: from gene data mining to disease genome sequence analyses. Curr Protoc Bioinformatics. 2016 Jun20;54:1 30 1–1 30 33. PubMed PMID: 27322403.
- Rouillard AD, Gundersen GW, Fernandez NF, et al. The harmonizome: a collection of processed datasets gathered to serve and mine knowledge about genes and proteins. Database (Oxford). 2016;2016. PubMed PMID: 27374120; PubMed Central PMCID: PMCPMC4930834. DOI:10.1093/database/baw100.
- Mognol GP, Carneiro FRG, Robbs BK, et al. Cell cycle and apoptosis regulation by NFAT transcription factors: new roles for an old player. Cell Death Dis. 2016;7(4):e2199–e2199. . PubMed PMID: 27100893
- Trussell JC, Coward RM, Santoro N, et al. Defining hypogonadism in male partners of couples with unexplained infertility. Fertil Steril. 2018;110(4):e296.
- Cardoso AM, Alves MG, Mathur PP, et al. Obesogens and male fertility. Obes Rev. 2017 Jan;18(1):109–125. PubMed PMID: 27776203.
- Lee H, Song J, Jung JH, et al. Primary cilia in energy balance signaling and metabolic disorder. BMB Rep. 2015;48(12):647–654. . PubMed PMID: 26538252
- Berbari NF, Lewis JS, Bishop GA, et al. Bardet-Biedl syndrome proteins are required for the localization of G protein-coupled receptors to primary cilia. Proc Natl Acad Sci U S A. 2008;105(11):4242–4246. . PubMed PMID: 18334641
- Dalbay MT, Thorpe SD, Connelly JT, et al. Adipogenic Differentiation of hMSCs is mediated by recruitment of IGF-1r onto the primary cilium associated with cilia elongation. Stem Cells. 2015 Jun;33(6):1952–1961. PubMed PMID: 25693948; PubMed Central PMCID: PMCPMC4737234.
- Nishimoto S, Fukuda D, Higashikuni Y, et al. Obesity-induced DNA released from adipocytes stimulates chronic adipose tissue inflammation and insulin resistance. Sci Adv. 2016 Mar;2(3):e1501332. PubMed PMID: 27051864; PubMed Central PMCID: PMCPMC4820373.
- Konner AC, Bruning JC. Toll-like receptors: linking inflammation to metabolism. Trends Endocrinol Metab. 2011 Jan;22(1):16–23. PubMed PMID: 20888253
- Jialal I, Kaur H, Devaraj S. Toll-like receptor status in obesity and metabolic syndrome: a translational perspective. J Clin Endocrinol Metab. 2014;99(1):39–48.
- Giraud G, Terrone S, Bourgeois CF. Functions of DEAD box RNA helicases DDX5 and DDX17 in chromatin organization and transcriptional regulation. BMB Rep. 2018;51(12):613–622. PubMed PMID: 30293550
- Ismael H, Altmeyer S, Stahl H. Regulation of the U3-, U8-, and U13snoRNA Expression by the DEAD Box Proteins Ddx5/Ddx17 with Consequences for Cell Proliferation and Survival. Noncoding RNA. 2016;2(4):11.
- Wilson BJ, Bates GJ, Nicol SM, et al. The p68 and p72 DEAD box RNA helicases interact with HDAC1 and repress transcription in a promoter-specific manner [journal article]. BMC Mol Biol. 2004 August 06;5(1):11.
- Motiño O, Francés DE, Mayoral R, et al. Regulation of mir-183 by cyclooxygenase-2 in liver is dead box helicase p68 (ddx5) dependent. role in insulin signaling. Mol Cell Biol. 2015. MCB. 00198-15.
- Park HJ, Kim J, Saima FT, et al. Adipose-derived stem cells ameliorate colitis by suppression of inflammasome formation and regulation of M1-macrophage population through prostaglandin E2. Biochem Biophys Res Commun. 2018 Apr 15;498(4):988–995. .
- Goodrich RJ, Anton E, Krawetz SA. Isolating mRNA and small noncoding RNAs from human sperm. Methods Mol Biol. 2013;927:385–396. PubMed PMID: 22992930
- Goodrich R, Johnson G, Krawetz SA. The preparation of human spermatozoal RNA for clinical analysis [Research Support, Non-U.S. Gov’t]. Arch Androl. 2007 May-Jun;53(3):161–167. PubMed PMID: 17612875; eng
- Kent WJ, Sugnet CW, Furey TS, et al. The human genome browser at UCSC. Genome Res. 2002 Jun;12(6):996–1006. Article published online before print in May 2002. PubMed PMID: 12045153; PubMed Central PMCID: PMCPMC186604.
- Benjamini Y, Hochberg Y. Controlling the false discovery rate: a practical and powerful approach to multiple testing. J R Stat Soc Series B Stat Methodol. 1995;57(1):289–300.
- Futschik ME, Carlisle B. Noise-robust soft clustering of gene expression time-course data. J Bioinform Comput Biol. 2005 Aug;3(4):965–988. PubMed PMID: 16078370
- Werner T. Bioinformatics applications for pathway analysis of microarray data. Curr Opin Biotechnol. 2008 Feb;19(1):50–54. PubMed PMID: 18207385
- Liberzon A, Subramanian A, Pinchback R, et al. Molecular signatures database (MSigDB) 3.0. Bioinformatics. 2011 Jun 15;27(12):1739–1740. PubMed PMID: 21546393; PubMed Central PMCID: PMCPMC3106198.
- Shannon P, Markiel A, Ozier O, et al. Cytoscape: a software environment for integrated models of biomolecular interaction networks. Genome Res. 2003 Nov;13(11):2498–2504. PubMed PMID: 14597658; PubMed Central PMCID: PMCPMC403769.
- Maere S, Heymans K, Kuiper M. BiNGO: a Cytoscape plugin to assess overrepresentation of gene ontology categories in biological networks. Bioinformatics. 2005;21(16):3448–3449.