
ABSTRACT
Histone deacetylases (HDACs) have been linked to a variety of cancers, and HDAC inhibitors (HDACi) are a promising class of drugs that have demonstrated anti-cancer effects. However, we have little knowledge regarding the selection and application of HDAC inhibitors to the personalized treatment of ovarian cancer (OC). Here, we report a correlation between the high expression of HDACs and poor outcomes in OC patients, which reveals that HDACi are a class of agents that show great promise for the treatment of OC. Furthermore, we found that HDACi increased both the mRNA and protein levels of DHRS2, which has been shown to be closely linked to HDACi sensitivity when it is highly expressed, especially in ovarian cancer cells. Consistently, we found that suppression of DHRS2 reduced the sensitivity of OC cells to HDAC inhibitors via attenuation of the inhibitory effects of HDAC inhibitors on Mcl-1 in vitro. Our study demonstrated that DHRS2 expression was decreased in OC tissues and that high expression of DHRS2 was correlated with better outcomes in OC patients. In addition, DHRS2 expression was closely related to the effects of chemotherapy. Our study reveals the role of DHRS2 in cell apoptosis induced by HDAC inhibitors and explores the clinical attributes of DHRS2 in OC from a new perspective, suggesting that OC patients with high DHRS2 expression may benefit from treatment with HDAC inhibitors.
KEYWORDS:
Introduction
Ovarian cancer is the deadliest gynecological cancer in the United States; it is estimated that approximately 21,880 new cases and 13,850 deaths occurred annually. Ovarian cancer is typically diagnosed at a late stage, and there is no effective screening strategy [Citation1]. Despite recent advances in surgical techniques and platinum-based chemotherapy, survival has changed little during the last 30 years [Citation2]. Recently, the use of innovative technologies for treatment, such as angiogenesis inhibitors, PARP inhibitors and immunotherapy agents, has surged, but fewer than half of affected women survive longer than 5 years after diagnosis. Therefore, new approaches are urgently needed to improve outcomes for patients.
With the advent of large-scale sequencing, it has been shown that ovarian cancer is characterized by a high number of chromosomal and epigenetic abnormalities. Epigenetics can be defined as modifications of DNA and/or associated proteins other than DNA sequence variations that dynamically regulate gene expression and/or associated function, and includes DNA methylation, miRNA regulation, and histone modifications. Histone modifications are controlled by histone acetyltransferases (HATs) and HDACs [Citation3]. HDACs are enzymes that are associated with the modulation of many basic cellular processes, such as apoptosis, DNA damage repair, cell cycle control, autophagy, metabolism, and senescence. Various HDAC inhibitors have been evaluated in preclinical and clinical trials [Citation4], and four synthetic compounds, viz., vorinostat, romidepsin, belinostat, and panobinostat have been approved as HDACi for cancer treatment by the United States Food and Drug Administration (FDA) [Citation5–Citation7]. A great number of experiments have revealed that HDACi may comprise a promising class of drugs with demonstrated anticancer effects against OC [Citation8–Citation10]. However, the results of clinical trials that have used HDACi to treat OC have been ambiguous [Citation11,Citation12]. If HDACi are to be developed into an effective therapy, it will be important to establish which patient group may benefit.
Here we report a new way to expand and guide the application of HDACi to the treatment of ovarian cancer. We managed to identify an important downstream gene involved in cell death induced by HDACi and evaluated the plausibility of exploiting this gene as a biomarker to direct the selection and application of HDACi to treatment. Among the genes induced by HDACi that were identified via analysis of the ‘Connectivity Map’ database (cMap), we successfully identified a promising target, DHRS2, whose high expression was closely related to HDACi sensitivity, and suppression of its expression induced HDACi resistance in ovarian cancer cells. The results were further verified by experiments in vivo. In addition, decreased DHRS2 in ovarian cancer is associated with PFS and OS in ovarian cancer. Therefore, high expression of DHRS2 could serve as a reliable biomarker for expanding the use of HDACi use to the treatment of OC in the future.
Materials and methods
Antibodies and reagents
DHRS2 antibody (cat# 15,735–1-AP), MCL-1 antibody (cat# 66,026–1-Ig) and GAPDH antibody (cat# 60,004–1-Ig) were obtained from Proteintech. Cleaved PARP antibody (cat# ab32064) was obtained from Abcam. Trichostatin A (cat# 58,880–19-6) and apicidin (cat# EPI008A) were obtained from Sigma-Aldrich. SAHA (cat# s1047) was obtained from Selleck.
Cell culture and transfection
OC cell lines ES2, SK-OV-3 and A2780 were obtained from the American Type Culture Collection (ATCC) and cultured according to the accompanying instructions. For the RNA interference of DHRS2, a specific siRNA pool targeting DHRS2 was custom-designed and synthesized by Ribobio. For siRNA transfection, Lipofectamine 3000 (Invitrogen) was used according to the manufacturer’s instructions. The siRNA sequences used for transfection were as follows: DHRS2 si-1 5′-CACUAGAACACUGGCAUUG-3′, 5′-GUGAUCUUGUGACCGUAAC −3′; DHRS2 si-2 5′-CUGGGUGUCUACAAUGUCATT-3′, 5′-UGACAUUGUAGACACCCAGTT −3′. For stable transfection of DHRS2, pre-designed shRNA lentiviral particles were obtained from Genechem, and the shRNA sequence (the targeting sequence was 5ʹ- CTGGGTGTCTACAAUGUCA-3ʹ).
Cell counting kit-8 (CCK8) assay
ES2 and A2780 OC cells were seeded at 6,000 cells per well in 96 well plates. The cells were allowed to adhere for 12 h and then treated with appropriate concentrations of HDAC inhibitors for 48 h. Each well was then incubated with 10 µl CCK8 reagent for 2 h. The OD value of each well was measured at 450 nm using a microplate reader.
Quantitative mRNA analysis using qRT-PCR
TRIzol reagent (Invitrogen, CA, USA) was used to extract the total RNA from cells. A reverse transcriptase kit (TaKaRa, Dalian, China) was used to synthesize cDNA from the RNA (2 μg). The DHRS2 primer sequences were as follows: forward (5′-3′) CCTCTGGTAGGGAGCACTCT, reverse (5′-3′) CCAGCGCCACTACTGGATTA; the GAPDH primer sequences were: forward (5′-3′): GCCTCGTCCCGTAGACAAAA; reverse (5′-3′) GATGGGCTTCCCGTTGATGA.
Western blotting
The cells were lysed in RIPA buffer containing PMSF and protease inhibitors (Beyotime Biotechnology) and sonicated. Typically, 40 μg of protein lysate was resolved on a Bolt 4–12% gradient gel, and the proteins were transferred to a PVDF membrane (Millipore). The membranes were blocked in 5% bovine serum albumin (BSA) and 1% Tween-20 in PBS for 1 h and incubated with the primary antibodies overnight at 4°C. Following incubation with the secondary antibodies, the membranes were visualized using a Li-COR Odyssey infrared scanner.
Flow cytometry analysis (FCA)
Cell cycle analysis carried out as described previously [Citation13]. Briefly, cells were fixed in 75% cold ethanol for at least 24 h and subsequently washed with PBS. RNase A (0.2 mg/mL) in PBS and propidium iodide were then added to the cells prior to FACS cell cycle analysis. For cell apoptosis analysis, an Annexin-V-fluorescein isothiocyanate/propidium iodide (Annexin-V-FITC/PI) cell apoptosis detection kit was used to detect cell apoptosis (cat# 556,547, BD). The cells were collected and washed with a PBS solution, which was followed by centrifugation at 1200 rpm for 5 min. The supernatant was aspirated, and then Annexin V-FITC and PI were added. The compounds were incubated in the dark at room temperature for 10 min. Flow cytometry analysis was conducted within 1 h of incubation.
Histopathological analyses using immunohistochemistry (IHC)
The tissue microarrays used in this work were purchased from Alenabio (cat# bc11012b and t112c; http://www.alenabio.com/, China). Tissues from 20 OC patients who had received at least six courses of typical cisplatin-based chemotherapy after surgery at Tongji Hospital at the Tongji Medical College, Huazhong University of Science and Technology, between 2012 and 2014 were used in the study. The study was approved by the local ethics committee. The patients were selected and divided into treatment response and treatment nonresponse groups according to the CA125 criteria proposed by the Gynecological Cancer Intergroup (GCIC) [Citation14]. The analyses were conducted as described previously [Citation15]. IHC staining with DHRS2 antibody (1:50 dilution) was performed. The final immunoreactivity score was determined by multiplying the intensity score (0–3+) by the extent of staining as determined using light microscopy (0–100%), and ranged from a minimum score of 0 to a maximum score of 12.
Use of animals
All animals used in this work were obtained from Beijing HFK Bioscience Co, Ltd. (Beijing, China), and the experiments were approved by the Committee on the Ethics of Animal Experiments at Tongji Medical College. The mice were maintained in the accredited animal facility of Tongji Medical College.
Statistics
Data are presented as the mean ± s.d. The differences between the experimental groups were analysed using Student’s t-test.
Results
Increased HDAC mRNA expression correlates with poor progression-free survival in OC patients
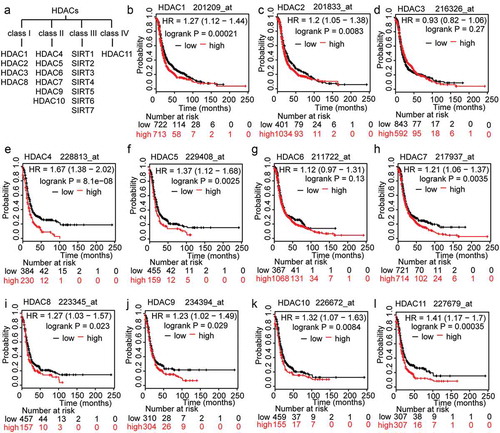
As ()) shows, there are 18 different isoforms of HDACs that are grouped into four classes. Classes I, II and IV comprise the ‘classical’ HDACs[Citation16]. To investigate the association between HDACs and OC prognosis, we searched the Kaplan-Meier plotter (KMP) database. The KMP is capable of assessing the effects of 54,675 genes on survival in 1,816 ovarian cancers, with a mean follow-up of 40 months. The primary purpose of the tool is for meta-analysis-based biomarker assessment. The relevant gene expression data and survival information for 1,816 ovarian cancer patients were downloaded from GEO[Citation17]. In order to analyse the prognostic value of the HDACs, each of the 11 total HDACs were assigned to one of two groups according to whether it had low or high expression. Poor progression-free survival (PFS) was compared between the two groups. The results showed that, for most HDACs, there is a significant correlation between high expression levels and poor PFS, except for HDAC3 (P = 0.27), HDAC6 (P = 0.13), and especially for HDAC4 (P = 8.1e-08; (-l)). We further assumed that drugs that regulate HDACs should be able to reverse OC progression; in addition, the genes that are regulated by these HDACs and that participate in HDACi resistance are likely to be key to the application and selection of HDAC inhibitors for the treatment of OC.
Figure 1. The prognostic value of HDACs in OC patients. A. Classification of members of the HDAC family. B-L. The prognostic value of expression of HDACs included in www.kmplot.com. PFS curves were plotted for all patients.
DHRS2 expression is elevated in response to HDACi
The cMap shows the impact of various drugs on gene expression profiles. Among these drugs, two types of HDACi, SAHA and TSA, are included [Citation18,Citation19]. Using the cMap, we managed to identify key genes that participate in the regulation of HDACs. As the results in ()) show, a set of genes were upregulated when tumor cells were exposed to HDACi; among them, DHRS2 was the most dramatically upregulated (fold change > 4; p < 0.001). Further, we analysed the alterations in DHRS2 that are common in tumor cells and OC tissues and found that the alteration frequencies were below 1.5% using the cBioPortal[Citation20] ()), which suggested that DHRS2 is a suitable target for further investigations of the mechanisms underlying HDACi resistance. As the data in the cMap was attained from human colon adenocarcinoma (HT-29) cells, we measured DHRS2 expression in the ovarian cancer cell lines ES2, A2780 and SK-OV-3 exposed to different HDACi using qRT-PCR and western blotting. Similar tendencies were observed in the two cell lines, both of which exhibited significant upregulation of their mRNA expression levels and protein expression levels in the presence of TSA, Apicidin and SAHA, respectively (,d) and S1A-C). Overall, in different ovarian cancer cell lines, various HDACi can increase the DHRS2 transcriptional expression level. Therefore, we assumed that DHRS2 could be involved in cell death induced by HDACi.
Figure 2. DHRS2 expression is upregulated by HDAC inhibitors. A. Upregulated genes shown in clusters based on the collection of gene signatures for HDACi (http://scads.jfcr.or.jp/db/cs/ushi2012.html), including TSA and SAHA. B. DHRS2 alterations common in tumors cell and OC tissues, obtained from the cBioPortal. C and D. qRT-PCR and western blot showing DHRS2 expression in ES2 cells (C) and A2780 cells (D) after treatment with SAHA, apicidin and TSA for 48 h. *data were obtained using a different probeset_id.

Decreased DHRS2 mRNA expression corelates to HDACi resistance
To investigate the relationship between the DHRS2 expression level and HDACi resistance, we utilized the Cancer Therapeutics Response Portal (CTRP), which links genetic, lineage, and other cellular features of cancer cell lines to small-molecule sensitivity[Citation21]. Correlation analysis of HDACi sensitivity and DHRS2 expression in cells that were from any primary site/subtype and were adherent showed that decreased DHRS2 mRNA expression was linked to resistance against 7 different HDACi (Table S1); the characteristic diagrams for apicidin and SAHA are shown individually in (,b)), respectively. In addition, we also investigated this relationship in OC cells and found a greater negative correlation between DHRS2 mRNA expression and the area under the concentration-response curve (AUCs) for 11 different HDACi using Pearson correlation analysis (). Characteristic diagrams are shown in (,d)).
Table 1. Correlation analysis of HDACi sensitivity and DHRS2 expression in adherent cells from the ovary. Pearson correlation coefficients for comparisons of HDAC inhibitor sensitivity data, expressed as the area under concentration-response curves (AUCs), with DHRS2 expression measurements, expressed as log2 robust-multi-array-average values.
Figure 3. ES2 cells with decreased DHRS2 mRNA expression are less sensitive to HDACi. A-D. Pearson correlation coefficients for comparisons of HDACi sensitivity data, expressed as the area under concentration-response curves (AUCs), with DHRS2 expression measurements, expressed as log2 robust-multi-array-average values. A. Correlation analysis of SAHA sensitivity and DHRS2 expression in cells from any primary site/subtype (adherent). B. Correlation analysis of apicidin sensitivity and DHRS2 expression in cells from any primary site/subtype (adherent). C. Correlation analysis of SAHA sensitivity and DHRS2 expression in cells from the ovary (adherent). D. Correlation analysis of apicidin sensitivity and apicidin expression in cells from the ovary (adherent). The mRNA levels of DHRS2 in ES2 and A2780 cells. E-H. CCK8 assay showing inhibition of cell growth in ovarian cancer lines (ES2 and A2780) after 48 h of treatment with HDAC inhibitors (TSA, SAHA and apicidin) at various doses (0.01, 0.04, 0.12, 0.37, 1.11, 3.3 and 10 μM). Data represent the mean values (± s.d.) obtained from quadruplicate cultures from three independent experiments.
To validate the CTRP results, we treated two OC cell lines, ES2 and A2780, with SAHA, TSA and apicidin separately. As shown in ()), DHRS2 mRNA expression in ES2 cells was significantly lower than in A2780 cells. However, a higher IC50 was observed in ES2 cells than in A2780 cells. Overall, A2780 cells, which have a higher DHRS2 mRNA expression level, exhibited a correspondingly greater sensitivity to TSA, SAHA and apicidin exposure (-h)), which supported our CTRP data and indicated that decreased DHRS2 mRNA expression correlated with HDACi resistance.
Suppression of DHRS2 results in HDACi resistance in vitro
Because DHRS2 appeared to be expressed at lower levels in HDACi-resistant OC cell lines than in HDACi-sensitive cell lines, we assumed that decreased DHRS2 expression leads to resistance to HDACi, which interferes with several hallmark processes of cancer cells, including proliferation, apoptosis, cell cycle regulation, metastasis, angiogenesis and differentiation[Citation22]. We downregulated DHRS2 expression in ES2 cells using siRNA and subjected these cells to proliferation, apoptosis and cell cycle assays. The suppression of DHRS2 by the siRNA was confirmed using qRT-PCR ()). During the cell proliferation/viability assay, ES2 cells that expressed less DHRS2 did not exhibit any significant survival advantage when compared with the control cells, but did gain a survival advantage when exposed to HDACi ()). We then measured the apoptosis-resistant activity of DHRS2 using annexin V/PI staining. ES2 cells that expressed decreased DHRS2 did not exhibit any significant increase in apoptosis when compared with the control cells and did exhibit decreased apoptosis upon HDACi exposure () and S2A). A similar result was witnessed during the cell cycle assay, which showed that the DHRS2-decreased group resisted G2/M arrest mediated by HDACi () and S3A). Further, we downregulated DHRS2 expression in another OC cell line, A2780, and the results were similar that the DHRS2 knockdown cells showed lower sensitivity to TSA, SAHA and apicidin (Figures S4A-D). This suggested that DHRS2 knockdown leads to HDACi resistance.
Figure 4. Inhibition of DHRS2 expression reduces the sensitivity of ES2 cells to HDACi. A. ES2 cells was transfected with the indicated siRNAs for 48 h and the mRNA level of DHRS2 was measured using qRT-PCR. B. After ES2 cells were transfected with DHRS2 siRNAs for 48 h, 1 μM TSA, 2 μM SAHA and 3 μM apicidin was added to each group. 48 h later, crystal violet dye was used to stain the adherent cells and take photographs. C. Cells transfected with DHRS2 siRNAs were treated with SAHA for 48 hours and the apoptotic cells were detected using flow cytometry. D. The cells transfected with DHRS2 siRNAs were treated with SAHA for 48 hours and the cell cycle was measured using flow cytometry. E. The expression level of the indicated proteins was detected by WB in cells that were treated as described for B.
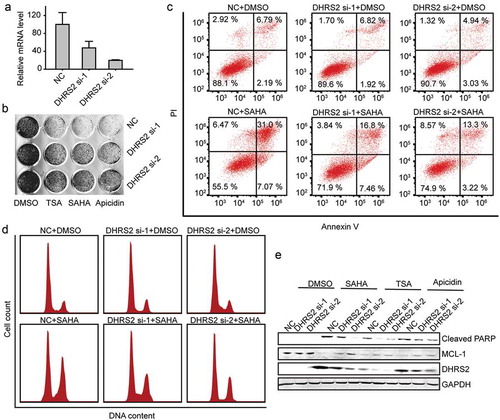
Mcl-1 is involved in cell apoptosis and cell cycle arrest and is a key survival factor that contributes to HDACi resistance[Citation23]. In order to clarify the mechanisms underlying DHRS2-mediated sensitivity to HDAC inhibitors in ovarian cancer cells, we performed western blotting analysis. As shown in ()), ES2 cells treated with various types of HDACi exhibited a reduced Mcl-1 protein level and an increased cleaved PARP level, which is a highly conserved protein that is implicated in the response of cells to apoptosis. However, the reduction in Mcl-1 and increase in cleaved PARP was reduced in the DHRS2-decreased group ()).
Clinical attributes of DHRS2 in OC
We then compared DHRS2 expression between normal and tumor tissues using immunohistochemistry with tissue microarrays. As predicted, DHRS2, a HDACi-sensitive gene, was significantly downregulated in tumor tissues from a cohort of ovarian cancer patients when compared to 4 adjacent normal ovary tissues that served as controls ()). The clinicopathological characteristics of these patients are shown in Table S2. To determine its clinical relevance, we analysed the correlation between DHRS2 protein expression and clinical features. DHRS2 was more highly expressed in grade 1 tumors than in others (P < 0.005; )). Similar results were obtained when we analysed the CSIOVDB database, which is a transcriptomic microarray database containing data from 3,431 human ovarian cancers ())[Citation24].
Figure 5. Clinical relevance of DHRS2 in OC. A and B. Immunohistochemistry (IHC) was performed to analyse the protein expression level of DHRS2 in tissue microarrays. A. Representative images of IHC performed on normal ovarian and ovarian cancer tissues. B. Box plot showing DHRS2 expression levels among OC tissue grades. C. The data from the CSIOVDB database showed DHRS2 expression levels among different OC tissue grades. D. Immunohistochemistry (IHC) was performed on tissues from 20 OC patients who had received regular cisplatin-based chemotherapy to analyse the correlation between DHRS2 and chemotherapeutic efficacy. E. The data from the CSIOVDB database showed the correlations between DHRS2 and clinical responses in OC patients. F. The TCGA data from the UCSC Xena database showed the correlations between DHRS2 and chemotherapeutic efficacy in OC patients. G and H. Kaplan–Meier survival curves are shown for relapse free survival (G) and overall survival time (H).
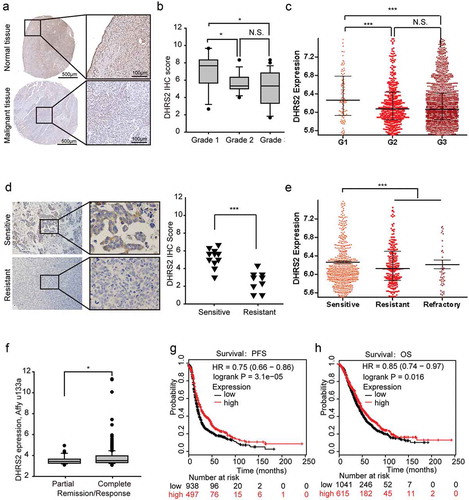
The sensitivity of OC cells to chemotherapeutic agents is a determining factor that affects the patient’s outcome. We exploited various methods to evaluate the correlation between DHRS2 and chemotherapeutic sensitivity. In our small-scale study, 20 ovarian cancer patients who had received conventional cisplatin-based chemotherapy were divided into sensitive and resistant groups; the DHRS2 expression level was significantly higher in the sensitive group than in the resistant group ()). Similar results were obtained when data from the CSIOVDB and UCSC Xena databases were analysed (,f). In addition, during the online KMP survival analysis, we found that higher DHRS2 expression was significantly linked to longer PFS and OS in OC (,h)). Overall, decreased DHRS2 was correlated with poor prognosis and chemotherapeutic resistance.
Identification DHRS2 in HDACi resistance in vivo
To further determine the role of DHRS2 in ovarian cancer formation and the development of HDACi resistance in vivo, A2780 cells were stably transfected with DHRS2 shRNA and control shRNA separately ()). Approximately 3x10[Citation6] cells of each type were subcutaneously injected into nude mice. Twelve days later, SAHA (20 mg/kg/day) was injected into the abdominal cavity. As shown in (,c)), tumor growth was significantly inhibited in the groups that were given SAHA, and DHRS2 knockdown did not impact tumor growth; nevertheless, when exposed to SAHA, DHRS2 knockdown allowed tumors to have a greater survival advantage. Consistently, the weights of tumors from the NC sh group that were treated with DMSO were no different from those from the DHRS2 sh group, but the weights of tumors from the NC sh group that were treated with SAHA were much lighter than those from the DHRS2 sh group (P < 0.001, )). A similar conclusion was reached upon observation of photographs of the tumors ()). Characteristic images of the tumors and the IHC results are shown in (,e)), respectively.
Figure 6. Downregulation of DHRS2 causes A2780 cells to become resistant to SAHA in vivo.
A total of 3 × 10[Citation6] A2780 cells expressing DHRS2-shRNA or an empty vector were subcutaneously injected into nude mice. SAHA (20 mg/kg/day) was administered by intraperitoneal injection and was switched on day 12, as indicated by the red arrow. A. qRT-PCR analysis of DHRS2 expression levels following stable knockdown of DHRS2. B. Tumor volumes (mm[Citation3]) were estimated using calipers for 20 days after tumor cell injections. C. Tumors were excised at 20 days after injection and the tumor weights were measured. Data were analysed using Student’s t-test. D. Tumor photographs. E. Representative images of H&E staining and IHC for DHRS2 using tumors from mice. *p < 0.05, **p < 0.01, ***p < 0.001.
![Figure 6. Downregulation of DHRS2 causes A2780 cells to become resistant to SAHA in vivo.A total of 3 × 10[Citation6] A2780 cells expressing DHRS2-shRNA or an empty vector were subcutaneously injected into nude mice. SAHA (20 mg/kg/day) was administered by intraperitoneal injection and was switched on day 12, as indicated by the red arrow. A. qRT-PCR analysis of DHRS2 expression levels following stable knockdown of DHRS2. B. Tumor volumes (mm[Citation3]) were estimated using calipers for 20 days after tumor cell injections. C. Tumors were excised at 20 days after injection and the tumor weights were measured. Data were analysed using Student’s t-test. D. Tumor photographs. E. Representative images of H&E staining and IHC for DHRS2 using tumors from mice. *p < 0.05, **p < 0.01, ***p < 0.001.](/cms/asset/a939e51b-428b-4d94-a92f-8fd426f6a041/kepi_a_1656155_f0006_c.jpg)
Discussion
Our study uncovered the value of HDACi in the personalized precision treatment of OC patients and demonstrated that OC patients with overexpression of DHRS2 would benefit from treatment with HDACi. We showed that high expression of HDACs was related to poor prognosis in OC patients, which revealed that HDACs were perfect targets for OC treatment. Further, DHRS2 mRNA expression was positively correlated with sensitivity to 11 different types of HDAC inhibitors in OC cells. HDACi notably increased DHRS2 expression, and DHRS2 played an important role in cell apoptosis that was induced by HDACi. High expression of DHRS2 was correlated with better outcomes and responses to chemotherapy in OC patients.
In humans, the four separate classes of HDACs have generally been identified based on their sequence similarities: The Class I Rpd3-like proteins (HDAC1-3 and HDAC8); the Class II Hda1-like proteins (HDAC4-7, HDAC9, and HDAC10); the Class III Sir2-like proteins (SIRT-7); and the Class IV protein (HDAC11) (illustrated in )). Unlike the other HDAC classes, the class III utilizes NAD+ rather than Zn2+ and thus is not affected by HDAC inhibitors (HDACis) that bind to a zinc moiety[Citation25]. HDACs are involved in multiple stages of cancer and have been shown to be aberrantly expressed in a variety of human tumors, including hematological and solid tumors [Citation26–Citation28]. Others have attempted to determine the prognostic value of HDACs in OC patients, but their results remain controversial partly due to the small sample sizes used. Our study comprehensively explored the prognostic significance of HDACs in OC patients using KMP and found that, among the 11 classical HDAC members, high expression of all except HDAC 3 and 6 is linked to poor prognosis. The results strongly indicated that HDACi are promising candidates for the treatment of OC. Since 2006, several HDACi, such as SAHA, FK-228, Belinostat and Panobinostat, have been sequentially granted FDA approval for use in cancer treatment, and other HDAC inhibitors are in various phases of clinical trials [Citation29,Citation30]. Although an increasing number of methods have been developed to investigate the uses of HDACi, either as single agents or in combination with other agents, the outcomes are still variable for different patients. If the use of HDACi was to be developed into an effective therapy, it would be important to establish which patient group may benefit. Our study aimed to identify the OC patients who could benefit from HDACi using the biomarker.
We focused on HDAC-regulated genes and found DHRS2 to be the most prominent target gene of SAHA and TSA using cMap database. In addition, DHRS2 was shown to be upregulated by SAHA, TSA and apicidin in A2780, ES2 and SK-OV-3 cells, which revealed that DHRS2 was a target gene induced by HDACi. Interestingly, we also found that the sensitivity to 7 different HDACi was positively correlated with the DHRS2 mRNA level in cancer cells of all origins, and the sensitivity to 11 HDACi was more obviously correlated with the DHRS2 mRNA level in OC cell lines via analysis of data obtained from the CTRP database, which contained information about 21 different HDAC inhibitors in 860 cancer cell lines [Citation21,Citation31]. These 11 HDACi (apicidin, SAHA, Belinostat, Pannobinostat, Entinostat, ISOX, Tubastation A, BRD-A94377914, Merck 60, BRD-k80183349 and BRD-K2490302) comprised both highly selective HDACi and nonselective HDACi () and revealed that DHRS2 was related to the sensitivity of various HDACi in OC cells. Based on this observation, we selected apicidin, SAHA and TSA for use in experiments in vitro. Consistently, the A2780 cells expressing greater DHRS2 were more sensitive to the three HDACi. In addition, in all three HDACi exposure conditions, downregulation of DHRS2 expression using siRNA abated apoptosis, cell cycle arrest and proliferation inhibition in OC cell lines in vitro compared to the control. In line with this result, suppression of DHRS2 abated the effects of HDACi on OC cells. In summary, DHRS2 is a key gene in apoptosis that is induced by HDACi, and the mRNA expression level of DHRS2 can serve as a potential biomarker for HDACi selection; in other words, ovarian cancer patients expressing high levels of DHRS2 would benefit from treatment with HDACi.
DHRS2, which belongs to the short-chain dehydrogenase/reductase (SDR) family, is upregulated by pterostilbene and 5-aza-2'-deoxycytidine treatment and downregulated by cisplatin treatment [Citation32–Citation34]. DHRS2 inhibits cancer cell proliferation and quiescence by inhibiting MDM2 and stabilizing p53 [Citation35,Citation36]. DHRS2 is reported to be a tumor suppressor gene, to be decreased in esophageal squamous cell carcinoma (ESCC) and is linked to poorer prognosis in ESCC patients[Citation37]. However, there have been only a few studies on the function and clinical relevance of DHRS2. In this study, we not only found a correlation between DHRS2 and HDACi sensitivity, but also found that decreased DHRS2 in OC was associated with a higher pathological grade and poorer outcome in OC patients. Furthermore, DHRS2 downregulation was associated with chemoresistance (cisplatin-based) in ovarian cancer. Notably, in a study of gastric carcinogenesis, DHRS2 was shown to be involved in 5-Fu resistance in gastric carcinoma[Citation38]. Therefore, we assume here that DHRS2 is a potential target for treatment of multiple-drug resistance. Study of the relevant mechanisms may eventually guide clinical treatment.
Overall, the results presented in this paper showed that DHRS2 is a biomarker related to prognosis and response to HDAC inhibitors in ovarian cancer patients that mediates the sensitivity of ovarian cancer cells to HDACi. Our study revealed that ovarian cancer patients with high DHRS2 expression may benefit from treatment with HDACi and provides a rational basis for personalized therapy of ovarian cancer.
Supplemental Material
Download MS Word (1.8 MB)Acknowledgments
The authors declare that there are no conflicts of interest related to this work. This work was supported by the “973” Program of China (grant no. 2015CB553903), and the National Natural Science Foundation of China (grant nos. 81702573, 81772787, 81402159, 81472783, 81372801, and 81572570).
Disclosure statement
No potential conflict of interest was reported by the authors.
Additional information
Funding
References
- Jelovac D, Armstrong DK. Recent progress in the diagnosis and treatment of ovarian cancer. CA Cancer J Clin. 2011;61:183–203.
- Damia G, Broggini M. Platinum Resistance in Ovarian Cancer: Role of DNA Repair. Cancers (Basel). 2019;11(1):119.
- Natanzon Y, Goode EL, Cunningham JM. Epigenetics in ovarian cancer. Semin Cancer Biol. 2018;51:160–169.
- Rodriguez-Paredes M, Esteller M. Cancer epigenetics reaches mainstream oncology. Nat Med. 2011;17:330–339.
- Marks PA, Breslow R. Dimethyl sulfoxide to vorinostat: Development of this histone deacetylase inhibitor as an anticancer drug. Nat Biotechnol. 2007;25:84–90.
- Roche J, Bertrand P. Inside HDACs with more selective HDAC inhibitors. Eur J Med Chem. 2016;121:451–483.
- Singh AK, Bishayee A, Pandey AK. Targeting Histone Deacetylases with Natural and Synthetic Agents: An Emerging Anticancer Strategy. Nutrients. 2018;10(6):731.
- Qiu X, Xiao X, Li N, et al. Histone deacetylases inhibitors (HDACis) as novel therapeutic application in various clinical diseases. Prog Neuropsychopharmacol Biol Psychiatry. 2017;72:60–72.
- Muscolini M, Cianfrocca R, Sajeva A, et al. Trichostatin A up-regulates p73 and induces Bax-dependent apoptosis in cisplatin-resistant ovarian cancer cells. Mol Cancer Ther. 2008;7:1410–1419.
- Sonnemann J, Gange J, Pilz S, et al. Comparative evaluation of the treatment efficacy of suberoylanilide hydroxamic acid (SAHA) and paclitaxel in ovarian cancer cell lines and primary ovarian cancer cells from patients. BMC Cancer. 2006;6:183.
- Khabele D. The therapeutic potential of class I selective histone deacetylase inhibitors in ovarian cancer. Front Oncol. 2014;4:111.
- Moufarrij S, Dandapani M, Arthofer E, et al. Epigenetic therapy for ovarian cancer: promise and progress. Clin Epigenetics. 2019;11:7.
- Han Y, Sun S, Zhao M, et al. CYC1 Predicts Poor Prognosis in Patients with Breast Cancer. Dis Markers. 2016;2016:3528064.
- Taylor PT, Haverstick D. Re: New guidelines to evaluate the response to treatment in solid tumors (ovarian cancer). J Natl Cancer Inst. 2005;97:151. author reply 2
- Ji T, Gong D, Han Z, et al. Abrogation of constitutive Stat3 activity circumvents cisplatin resistant ovarian cancer. Cancer Lett. 2013;341:231–239.
- Koeneke E, Witt O, Oehme I. HDAC family members intertwined in the regulation of autophagy: a druggable vulnerability in aggressive tumor entities. Cells. 2015;4:135–168.
- Gyorffy B, Lanczky A, Szallasi Z. Implementing an online tool for genome-wide validation of survival-associated biomarkers in ovarian-cancer using microarray data from 1287 patients. Endocr Relat Cancer. 2012;19:197–208.
- Lamb J, Crawford ED, Peck D, et al. The Connectivity Map: using gene-expression signatures to connect small molecules, genes, and disease. Science. 2006;313:1929–1935.
- Ushijima M, Mashima T, Tomida A, et al. Development of a gene expression database and related analysis programs for evaluation of anticancer compounds. Cancer Sci. 2013;104:360–368.
- Gao J, Aksoy BA, Dogrusoz U, et al. Integrative analysis of complex cancer genomics and clinical profiles using the cBioPortal. Sci Signal. 2013;6:pl1.
- Basu A, Bodycombe NE, Cheah JH, et al. An interactive resource to identify cancer genetic and lineage dependencies targeted by small molecules. Cell. 2013;154:1151–1161.
- Zagni C, Floresta G, Monciino G, et al. The search for potent, small-molecule HDACIs in cancer treatment: a decade after vorinostat. Med Res Rev. 2017;37:1373–1428.
- Labisso WL, Wirth M, Stojanovic N, et al. MYC directs transcription of MCL1 and eIF4E genes to control sensitivity of gastric cancer cells toward HDAC inhibitors. Cell Cycle. 2012;11:1593–1602.
- Tan TZ, Yang H, Ye J, et al. CSIOVDB: a microarray gene expression database of epithelial ovarian cancer subtype. Oncotarget. 2015;6:43843–43852.
- Li Y, Seto E. HDACs and HDAC Inhibitors in Cancer Development and Therapy. Cold Spring Harb Perspect Med. 2016;6(10).
- Nemati M, Ajami N, Estiar MA, et al. Deregulated expression of HDAC3 in colorectal cancer and its clinical significance. Adv Clin Exp Med. 2018;27:305–311.
- Miyake K, Yoshizumi T, Imura S, et al. Expression of hypoxia-inducible factor-1alpha, histone deacetylase 1, and metastasis-associated protein 1 in pancreatic carcinoma: correlation with poor prognosis with possible regulation. Pancreas. 2008;36:e1–9.
- Higashijima J, Kurita N, Miyatani T, et al. Expression of histone deacetylase 1 and metastasis-associated protein 1 as prognostic factors in colon cancer. Oncol Rep. 2011;26:343–348.
- Olsen EA, Kim YH, Kuzel TM, et al. Phase IIb multicenter trial of vorinostat in patients with persistent, progressive, or treatment refractory cutaneous T-cell lymphoma. J Clin Oncol. 2007;25:3109–3115.
- Manal M, Chandrasekar MJ, Gomathi Priya J, et al. Inhibitors of histone deacetylase as antitumor agents: A critical review. Bioorg Chem. 2016;67:18–42.
- Rees MG, Seashore-Ludlow B, Cheah JH, et al. Correlating chemical sensitivity and basal gene expression reveals mechanism of action. Nat Chem Biol. 2016;12:109–116.
- Suganya N, Bhakkiyalakshmi E, Subin TS, et al. Proteomic identification of pterostilbene-mediated anticancer activities in HepG2 cells. Chem Res Toxicol. 2014;27:1243–1252.
- Song J, Shih Ie M, Chan DW, et al. Suppression of annexin A11 in ovarian cancer: implications in chemoresistance. Neoplasia. 2009;11: 605–614. 1 p following 14.
- Okochi-Takada E, Nakazawa K, Wakabayashi M, et al. Silencing of the UCHL1 gene in human colorectal and ovarian cancers. Int J Cancer. 2006;119:1338–1344.
- Petropavlovskaia M, Bodnar CA, Behie LA, et al. Pancreatic small cells: analysis of quiescence, long-term maintenance and insulin expression in vitro. Exp Cell Res. 2007;313:931–942.
- Deisenroth C, Thorner AR, Enomoto T, et al. Mitochondrial Hep27 is a c-Myb target gene that inhibits Mdm2 and stabilizes p53. Mol Cell Biol. 2010;30:3981–3993.
- Zhou Y, Wang L, Ban X, et al. DHRS2 inhibits cell growth and motility in esophageal squamous cell carcinoma. Oncogene. 2018;37:1086–1094.
- Han Y, Song C, Wang J, et al. HOXA13 contributes to gastric carcinogenesis through DHRS2 interacting with MDM2 and confers 5-FU resistance by a p53-dependent pathway. Mol Carcinog. 2018;57:722–734.